Abstract
The polycyclic aromatic hydrocarbons (PAHs) in size-resolved particles emitted from diverse sources are required for quantification to reduce the emissions in order to protect public health. Twenty-four PAHs in size-segregated particles in the roadside environment of Beijing were observed from 1 October 2021 to 30 September 2022. The size distributions of PAHs were bimodal, with peak concentrations ranging from size fractions of 0.43 to 0.65 μm and 4.7 to 5.8 μm in all four seasons, respectively. The highest concentration of PAHs in fine particles (PM2.1) was 35.3 ng m−3 in winter, followed by 16.0 ng m−3 in autumn, 15.3 ng m−3 in spring, and 6.5 ng m−3 in summer. Conversely, the concentration of PAHs in coarse particles (PM2.1–9) ranged from 6.8 ng m−3 (summer) to 20.5 ng m−3 (winter) from low to high. The size fractions of 0.43–2.1 μm PAHs increased most from clear to polluted days, which could be ascribed to the heterogeneous reactions. Source apportionment using positive matrix factorization showed that four sources, namely biomass combustion, coal combustion, diesel vehicles, and gasoline vehicles accounted for PAHs with the estimation of 17.4%, 22.1%, 26.4%, and 23.2% to PAHs in PM2.1; and 19.6%, 24.3%, 23.6%, and 20.1% in PM2.1–9, respectively. Furthermore, we used the human alveolar epithelial cell (BEAS-2B) to assess the toxicological effects of size-resolved atmospheric PAHs. The results showed that the cell survival rate caused by fine particles was lower than that of coarse particles with the same concentrations of PAHs, which is mainly related to the higher content of highly toxic PAHs in fine particles.
1. Introduction
Atmospheric polycyclic aromatic hydrocarbons (PAHs) are proved to be pollutants with high carcinogenic, teratogenic, and mutagenic properties, and they have negative impacts on human health [1,2]. The significant associations between atmospheric PAHs and morbidity and mortality from cardiovascular, cerebrovascular, chronic respiratory diseases, and lung cancers have been documented in abundant epidemiological and toxicological studies [3]. The U.S. Environmental Protection Agency (USEPA) has listed sixteen congeners of PAHs as the priority pollutants [4]. In addition, some non-priority PAHs were detected in various environmental matrices, and some non-priority PAHs were observed to have stronger toxicity than those of benz(a)pyrene [5]. Compared to the studies on the source, transfer, and health risks of PAHs, the studies of ambient non-priority PAHs in China are less reported [6]. In addition, knowing the size distributions of PAHs is essential in assessing the impacts of PAHs on human health and the ecological environment and understanding the sources, formation processes, and conversion mechanisms of PAHs [7].
The results derived from the source apportionment of PAHs could help formulate policies for the associated emission source control [8]. Some methods, including paired isomeric ratios, chemical mass balances (CMB), and positive matrix factorization (PMF), were adopted to identify sources of PAHs [9]. Among them, PMF is a receptor model to quantify the source contribution to PAHs without a local source profile. Thus, the PMF model to apportion sources of PAHs has been used in some cities in China [10,11,12]. However, these studies have mainly focused on single-size fractions (i.e., PM2.5), without considering the source apportionment of size-resolved PAHs.
PAHs in the ambient environment are released from anthropogenic or natural sources, which include the combustion of fossil fuels and biomass in an incomplete state [13]. Among that, mobile sources are found to be a major contributor of PAHs across urban areas [14]. PAHs from mobile sources refer to a mixture of emissions, including exhaust emissions and non-exhaust emissions. Exhaust emission is composed of gasoline and diesel exhaust, and fuel evaporation, while non-exhaust emission includes the emissions from wear and tear of brakes, tires, and road surface materials, as well as the re-suspension of road dust [15,16]. PAH concentrations, source, and health risks have been obtained in different roadside environments [17,18,19]. However, most studies were performed to discuss the sources and health effects of priority PAHs, without considering non-priority PAHs. In addition, field studies on the levels of ambient PAHs were focused on a certain particle size [17,18,19]. Few studies focus on measuring the levels of size-fractionated PAHs.
For filling this knowledge gap, we observed 24 PAHs in size-segregated particles in the roadside environment of Beijing from 1 October 2021 to 30 September 2022. The study aims to report the characteristics of PAHs using a size-resolved dataset collected from clear and polluted days in four seasons. Then, PAH diagnostic ratios were used to identify the emission sources, and the PMF method was carried out with the estimation of relative contributions of sources in different size fractions. Finally, the toxicological effects of PAHs in different size fractions on BEAS-2B cells were investigated.
2. Experimental
2.1. Sampling Site
The size-resolved ambient samples were collected from 1 October 2021 to 30 September 2022. The sampler was placed at the side road of the West Third Ring Road and approximately 1.5 m above the ground. The sampling site is located in a commercial and cultural region. There are many roads in the surrounding area. However, apart from vehicles, there are no other strong primary PAHs sources (such as industrial sources) located within the surrounding few kilometers. The site was adjacent to the main highways in urban Beijing, which thus could represent a roadside environment site.
2.2. The Collection of Size-Resolved Ambient Samples
With cutoff points of 0.43, 0.65, 1.1, 2.1, 3.3, 4.7, 5.8, and 9.0 μm, an 8-stage sampler (Andersen Series 20-800, Cleves, OH, USA) was operated to collect size-resolved particles at a flow rate of 28.3 L min−1 for 48 h. The sampling system consists of a pump and an 8-stage impactor. The sucking pump makes the air mass pass through the impactor from top to bottom. The coarse particles, which have a small impulse, are trapped in the upper layer, while the fine particles reach the lower layer. Target PAH compounds in more than 70% of the samples could be detected when the sampling time was 48 h. In total, 35 sets of size-resolved ambient samples were sampled with quartz fiber filters for the whole sampling period. Before the collection, the pre-heated treatment of quartz fiber filters proceeded at 800 °C for 2 h to take out the organic substances on quartz fiber filters. Then, the quartz fiber filter is kept in a sealed conditioned dryer at a relative humidity of 22 ± 3% (RH) for 25 ± 3 °C for 72 h and then weighed using a microbalance with a sensitivity of ±0.01 mg. After the collection of samples, the quartz fiber filter was reweighed at a relative humidity of 22 ± 3% (RH) for 25 ± 3 °C. In cases where the samplers were blocked by the size-resolved particles during the sampling process, the samplers were washed in an ultrasonic bath for 30 min before each sampling. The calibration of the flow rate was performed using a standard flow meter in the process of each sampling.
2.3. Chemical Analyses
The extraction of PAHs on the quartz fiber filter was conducted with accelerated solvent extraction and a mixture of hexane/diethyl ether (9:1 v/v). Briefly, half of the quartz fiber filter was cut into pieces and put into the extraction cell. The extraction was carried out under an extraction temperature of 100 °C and extraction pressure of 1500 psi during the static extraction time of 5 min. Then, the extractions were leached to 100% pool volume under the nitrogen purging time of 60 s. Then, the extracts were condensed to 1 mL, with dry nitrogen operating at a gentle stream of dry nitrogen approximately. Before the measurement of GC/MS, the final volume of extraction solution was concentrated to 1 mL with the extraction solvent. The lists of 24 PAH compounds at known levels (20 μg mL−1) of naphthalene-d8, acenaphthene-d10, phenanthrene-d10, chrysene-d12, and perylene-d12 included in the measurement of GC/MS are shown in Table 1. The internal standards for the determination of PAHs were used in the measurements of 24 PAH compounds. One parallel sample was measured for every 20 samples, and the deviation was less than 25%. The detection limits of these PAH compounds ranged from 0.006 to 0.024 ng m−3. The detailed analytical methods (e.g., precision, quality control, and detection limit) for determining the levels of 24 PAH compounds were described in a prior study [20].

Table 1.
Abbreviation, formulas, and number of benzene rings of PAHs.
2.4. Receptor Model
PMF is a receptor model that could apportion sources effectively [21,22]. In this work, EPA-PMF 5.0 was employed to apportion sources for PAHs in particles with sizes of <0.43, 0.43–0.65, 0.65–1.1, 1.1–2.1, 2.1–3.3, 3.3–4.7, 4.7–5.8, and 5.8–9 μm fractions. The total number of size-resolved ambient samples was 153. We calculated the uncertainty of the concentration data associated with the input data by using the following equations.
If the concentration is lower than or equal to the detection limit (MDL) of the analytical method, the uncertainty is estimated with Equation (1):
Uncertainty = 5/6 × MDL
If the concentration is greater than the detection limit (MDL) of the analytical method, the calculation follows Equation (2):
In this work, the error fraction was set as 10% of all of the chemical species, and MDL was used in the data reported in previous studies [20]. We ran the base model 20 times with a different number of factors for optimizing the best solutions. For the first turn, some species with absolute scaled residuals greater than 3 indicated bad observed–predicted correlations. Thus, these species were set as “weak”, and the model was performed again. After a reasonable solution was identified, the bootstrapping method was then used to acquire the most optimal results. In total, 100 bootstrap runs were performed with an r2-value greater than 0.6. Among the 100 runs, the factors were considered to be a reliable result when the source profile of factors was similar to the source profiles of factors in the base run.
2.5. Evaluation of Cytotoxicity of PAHs
To evaluate the cytotoxicity of PAHs to BEAS-2B cells, the BEAS-2B cells of the logarithmic growth stage were digested with 0.25% trypsin (including EDTA); the cell suspension was then harvested and centrifuged at 1000 rpm for 5 min. Then, the supernatant was thrown away, the cells were re-suspended with 2 mL DMEM medium for counting, and the cells were diluted to 1 × 10⁵ cells mL−1 according to the counting results. The cell suspension was inoculated into 96-well plates at 100 uL per well, and cultured in a cell incubator (37 °C, 5% CO2, >90% humidity), and the cell morphology was observed under a microscope. After 24 h of cell adhesion growth, the original medium in the 96-well plate was discarded, and the test samples after dilution of 100 μL DMEM medium were added into the corresponding holes of the 96-well plate. (The substance being tested for toxicity was the dust particle extracted by a mixture of hexane/diethyl ether, and the final concentration was 250 μg mL−1). And 100 μL DMEM medium was made as a blank control sample. The 96-well plates were cultured in a cell incubator (37 °C, 5% CO2, >90% humidity) for 48 h, with three multiple Wells in each group. The liquid in the culture hole was removed, 50 μL MTT was added to each hole (the final concentration was 1 mg mL−1), the supernatant was removed after 2 h of culture in a carbon dioxide incubator, and 100 μL of isopropyl alcohol dissolved crystals was added to each hole. The absorbance value at 450 nm wavelength was determined on an enzyme marker, and the cell survival rate of each group was calculated.
3. Results and Discussion
3.1. Seasonal Variation in PAHs
3.1.1. Levels of PAHs
The mean levels of 24 PAHs in fine particles (PM2.1) exhibited obvious seasonal variations (Figure 1), with the greatest found in winter (35.3 ± 14.6 ng m−3), followed by autumn (16.0 ± 6.1 ng m−3), spring (15.3 ± 4.6 ng m−3), and summer (6.5 ± 1.8 ng m−3). The seasonal trends of average PAH concentrations in coarse particles (PM2.1–9) differ from those of PM2.1 slightly. The highest concentration of PAHs was detected in winter (20.5 ± 10.3 ng m−3), followed by spring (16.5 ± 7.4 ng m−3), autumn (7.1 ± 5.2 ng m−3), and summer (6.8 ± 4.5 ng m−3). The high concentrations of PAHs in coarse particles in spring may be related to the high concentration of dust in spring. The seasonal trends in PAHs mainly resulted from variations in emission sources and changes in meteorological conditions. Compared to previous studies in Beijing, the concentrations of PAHs in fine particles in winter were lower relative to the results reported during the periods from 2013 and 2018 [23]. The reduction in concentrations of PAHs implied the effectiveness of pollution prevention strategies in Beijing [24].
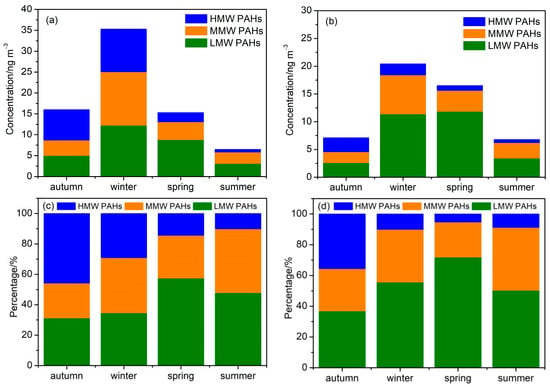
Figure 1.
Concentrations of PAHs in PM2.1 (a) and PM2.1–9 (b) and contributions of LMW, MMW, and HMW PAHs to total PAHs in PM2.1 (c) and PM2.1–9 (d).
From the perspective of PAHs with different benzene rings, concentrations of low molecular-weight PAHs (2–3 ring, LMW PAHs) and middle molecular-weight (4 ring, MMW PAHs) PAHs in fine particles followed the order of winter > spring > autumn > summer, while concentrations of high molecular-weight PAHs (5–6 ring, HMW PAHs) were higher in autumn and winter compared to those in spring and summer. HMW PAHs (29.0–45.7%) and MMW PAHs (22.0–36.3%) were the main PAH compounds during the cold period, while LMW PAHs (47.9–57.5%) dominated the PAH mixture during the warm period. LMW PAHs in coarse particles exhibited the highest concentrations in spring, followed by winter, summer, and autumn. However, MMW PAHs showed the highest concentration in winter, followed by spring, summer, and autumn. Notably, the levels of HMW PAHs were found to be greater in autumn and winter than in spring and summer. The contributions of LMW PAHs (36.9–71.9%) to total PAHs in coarse particles were higher than that of MMW and HMW PAHs in all the seasons.
3.1.2. Size Distribution of PAHs
The size distributions of LMW, MMW, and HMW PAHs across four seasons are depicted in Figure 2. In each season, the bimodal size distributions of PAHs were observed. The fine modes commonly showed maxima at 0.43–0.65 μm, and the coarse modes showed maxima at 4.7–5.8 μm across the four seasons. In Figure 2, the peak concentrations of MMW and HMW PAHs in the fine mode were significantly higher relative to that in the coarse mode, especially in winter and autumn. However, the peak of find mode LMW PAHs was similar to that of the coarse mode in summer and autumn, while the peak of the coarse mode LMW PAHs was greater compared to the fine mode in winter and spring. This is mainly due to the fact that LMW PAHs are highly volatile, and the absorption of volatilized PAHs in the coarse particles will lead to high concentrations of PAHs in coarse mode [7,25].
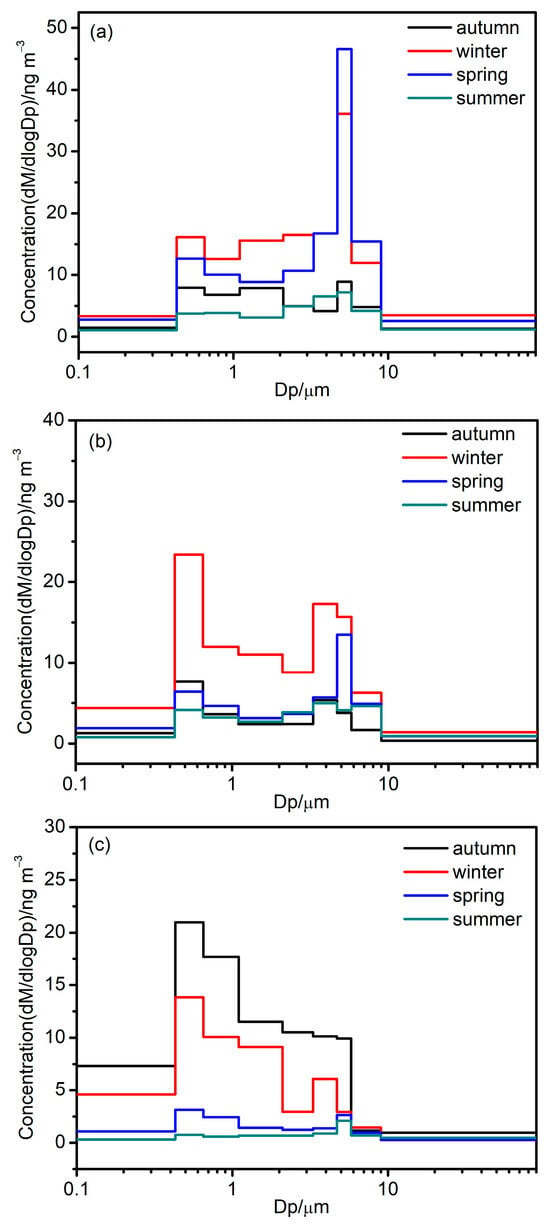
Figure 2.
Size distributions of LMW PAHs (a), MMW PAHs (b), and HMW PAHs (c) in different seasons.
3.2. Levels of PAHs in Different Pollution Levels
3.2.1. Differences in PAHs between Clear and Polluted Days
To examine the variations in concentrations and size distributions of PAHs in haze days, the sampling days in winter were grouped into clear days (PM2.5 < 35 μg m−3) and polluted days (PM2.5 > 35 μg m−3) based on PM2.5 concentrations. The average PM2.5 mass concentrations on clear days and polluted days were 20.1 μg m−3 and 41.2 μg m−3, respectively. Figure 3 shows the size levels of LMW PAHs, MMW PAHs, and HMW PAHs on both clear and polluted days. The levels of 24 PAHs in PM2.1 increased from 30.4 ng m−3 on clear days to 50.1 ng m−3 on polluted days (the ratio of polluted days to clear days was RP/C = 1.7), respectively. However, concentrations of 24 PAHs in PM2.1–9 decreased from 22.0 ng m−3 to 15.9 ng m−3 with the increases in air pollution. With regard to PAHs with different benzene rings, LMW PAHs in PM2.1 increased from 12.0 ng m−3 to 13.0 ng m−3 (RP/C = 1.1), MMW PAHs increased from 10.2 ng m−3 to 20.8 ng m−3 (RP/C = 2.0), and HMW PAHs increased from 8.2 ng m−3 to 16.4 ng m−3 (RP/C = 2.0). On the contrary, LMW PAHs in PM2.1–9 decreased from 13.5 ng m−3 to 5.1 ng m−3 (RP/C = 0.4), MMW PAHs increased from 6.5 ng m−3 to 8.5 ng m−3 (RP/C = 1.3) and HMW PAHs increased from 2.0 ng m−3 to 2.2 ng m−3 (RP/C = 1.1). Therefore, it is found that the accumulation of MMW and HMW PAHs in both fine and coarse particles during the haze pollution period significantly [26].
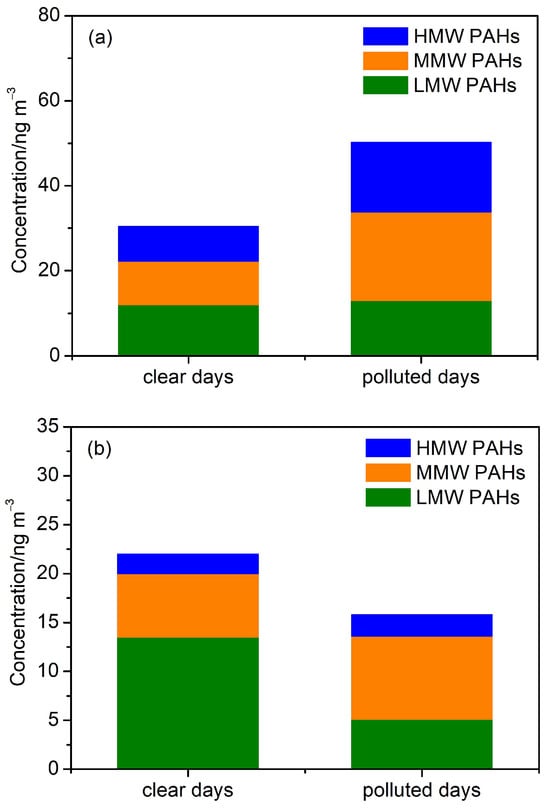
Figure 3.
Concentrations of PAHs in PM2.1 (a) and PM2.1–9 (b) on clear and polluted days.
3.2.2. Differences in Size Fractions
Figure 4 compares the average concentration size distributions of LMW, MMW, and HMW PAHs on clear and polluted days. The size distributions of LMW, MMW, and HMW PAHs were observed to be bimodal, with the peaks corresponding to the fine modes located at 0.43–0.65 μm and those corresponding to the coarse modes peaking at 4.7–5.8 μm. As seen in Figure 4a, the peak concentration of LMW PAHs in fine mode was lower than that in coarse mode on clear days; however, it was higher than that in the coarse mode on polluted days. LMW and MMW PAHs exhibited an almost similar peak concentration in both fine and coarse mode on clear days, but the peak in fine mode was much higher than that in coarse mode on polluted days. It revealed that HMW PAHs have a much higher fine mode peak than coarse mode on both clear and polluted days, while the fine peak levels of HMW PAHs in fine mode were found to be higher on polluted days than on clear days. Therefore, the size fractions of 0.43–2.1 μm PAHs increased most from clear to polluted days, and this was mainly related to the high concentration of precursors and the high humidity condition conducive to the heterogeneous chemical formation of PAHs in the accumulation mode on polluted days [27].
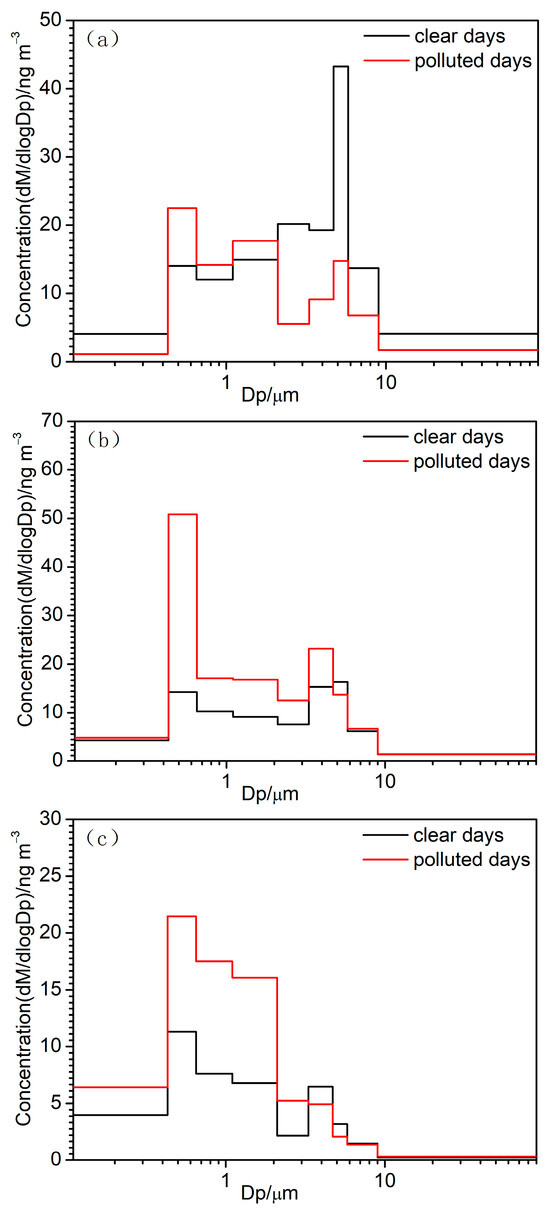
Figure 4.
Size distributions of LMW PAHs (a), MMW PAHs (b), and HMW PAHs (c) on clear and polluted days.
3.3. Source Apportionment
3.3.1. PAH Diagnostic Ratios
Because the proportions of PAHs from specific sources are relatively stable, diagnostic ratios of PAH are used as a convenient method to identify emissions sources. Firstly, MMW/HMW PAHs are used to determine whether it is an external source [28]. Then, BaP/(BaP + Chry), ANT/(ANT + PHE), BaA/(BaA + Chr), and IcdP/(IcdP + BghiP) were selected to examine PAH sources across different seasons and between clear and polluted days [29,30,31,32,33,34,35]. The results are shown in Table 2.

Table 2.
PAH diagnostic ratios.
The ratios of MMW/HMW for PM2.1 and PM2.1–9 in four seasons ranged from 0.50 to 4.14 and from 0.77 to 4.68, respectively, both of which were much greater in spring and summer relative to that in winter and autumn, showing that the PAHs in autumn and winter were mainly from local sources. The ratio was slightly lower on polluted days than on clear days, indicating that the contribution of local sources was relatively higher on polluted days. The ratios of BaP/(BaP + Chry) for PM2.1 and PM2.1–9 in four seasons ranged from 0.32 to 0.64 and from 0.39 to 0.65, respectively, indicating that the PAHs were affected by coal combustion, gasoline emissions, and diesel emissions. This was consistent with the results obtained from most of the urban sites, such as 0.55 and 0.59 in Tangshan, China [33]; and 0.53 in Hamilton, Canada [36]. This ratio was higher on polluted days than on clear days, indicating that the contribution of gasoline emissions and diesel emissions was relatively higher on polluted days. The ratios of ANT/(ANT + PHE) were greater than 0.1 for all the samples, which exhibited similar characteristics to those in urban Guangzhou [37], indicating that the PAHs were mainly from a combustion source. The ratios of BaA/(BaA + Chr) for PM2.1 and PM2.1–9 in four seasons ranged from 0.34 to 0.53 and from 0.31 to 0.53, respectively, which were slightly higher than that in the suburban site of Changchun [38] and consistent with that in urban Tehran, India [39], indicating that the PAHs were affected by coal combustion and vehicular emissions. This ratio was greater on polluted days versus on clear days, indicating that the contribution of vehicular emissions was relatively higher on polluted days. The ratios of IcdP/(IcdP + BghiP) for PM2.1 and PM2.1–9 in four seasons ranged from 0.20 to 0.42 and from 0.24 to 0.46, respectively, indicating that the PAHs were affected by coal combustion, gasoline emissions, and diesel emissions. This was consistent with the previous study in Beijing [40]. This ratio was found to be lower on polluted days versus on clear days, implying that the contributions of gasoline emissions and diesel emissions were relatively higher on polluted days. To sum up, PAHs were mainly from coal combustion and vehicular emissions, which were similar to that in urban sites in China and other countries.
3.3.2. PMF Model
Four PAHs sources were identified via an PMF analysis. Figure 5 shows the profiles of each source and the apportioned percentages of species for each source. The identified sources were named coal combustion, biomass burning, gasoline emissions, and diesel emissions. Together, these sources represented 89.1% and 87.6% of PAHs in PM2.1 and PM2.1–9, respectively.
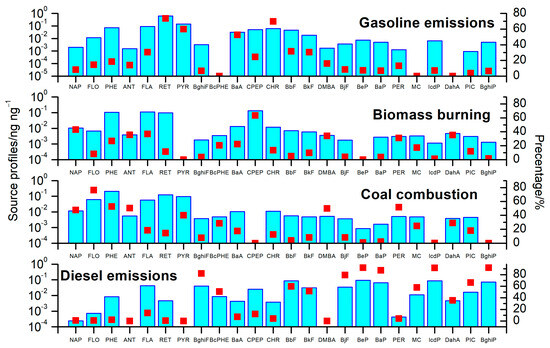
Figure 5.
The profiles of each source.
- Gasoline emissions
The first source was gasoline emissions, which were characterized by high RET, CHR, PYR, BaA, BkF, and FLA contents [41,42,43]. The contribution to PAHs in PM2.1 was 26.4%, which is slightly greater than the 23.6% contribution in coarse particles. Its contributions to PM2.1 and PM2.1–9 demonstrated a significant seasonal trend, with greater concentrations found in winter (27.4% and 25.1%).
- Biomass burning
The second source, biomass burning, was represented by high CPEP, NAP, FLA, ANT, DahA, and PHE [44,45]. The contribution in PM2.1 was 17.4%, which was slightly lower than the 19.6% contribution in PM2.1–9. This finding is evident since biomass burning contributed greater fractions to LMW PAHs, and this was more likely to occur in the coarse particles. The higher contributions to PM2.1 and PM2.1–9 were observed in spring (25.4% to PM2.1 and 26.1% to PM2.1–9), demonstrating an obvious seasonality.
- Coal combustion
The third source, coal combustion, was characterized by elevated FLO, PHE, DMBA, PER, ANT, NAP, and PYR concentrations [46,47,48,49,50,51]. The contribution of this source to PM2.1 was 22.1% (4.1 ng m−3). In addition to its contribution to PM2.1, coal combustion significantly contributed to PM2.1–9 (24.3%, 3.1 ng m−3). The contributions of coal combustion to PM2.1 and PM2.1–9 exhibited similar seasonal patterns of winter (23.7% to PM2.1 and 26.8% to PM2.1–9) > autumn (20.8% and 23.5%) > spring (19.9% and 22.4%) > summer (19.8% and 22.2%).
- Diesel emissions
The fourth source was diesel emissions, which were characterized by elevated BghiP, BeP, IcdP, BaP, BghiF, BjF, PIC, BbF, MC, BkF, and BcPHE concentrations [42,46,47,50,51,52]. The contribution in PM2.1 was 23.2%, which was slightly higher than the 20.1% contribution in PM2.1–9. The diesel emissions accounted for 25.1% and 21.3% of PM2.1 and PM2.1–9 in winter, as well as 24.0% and 22.4% of PM2.1 and PM2.1–9 in autumn, respectively.
Figure 6a,b illustrate the contributions of the four sources to the fine and coarse particles during the year and in different seasons. The contributions of biomass burning, coal combustion, gasoline emissions, and diesel emissions were 17.4%, 22.1%, 26.4%, and 23.2% to the fine fractions and 19.6%, 24.3%, 23.6%, and 20.1% to the coarse fractions. This result was similar to that in Huanggang City, Central China, thus showing that the main sources of PM2.5-bound PAHs were vehicle emissions (56.8%), coal and biomass burning (29.5%), and petroleum sources (13.7%) [53]. This result was comparable to that in urban and rural sites in Jamshedpur, India, which exhibited that vehicular emissions contributed more than 80% of atmospheric PAHs [54].
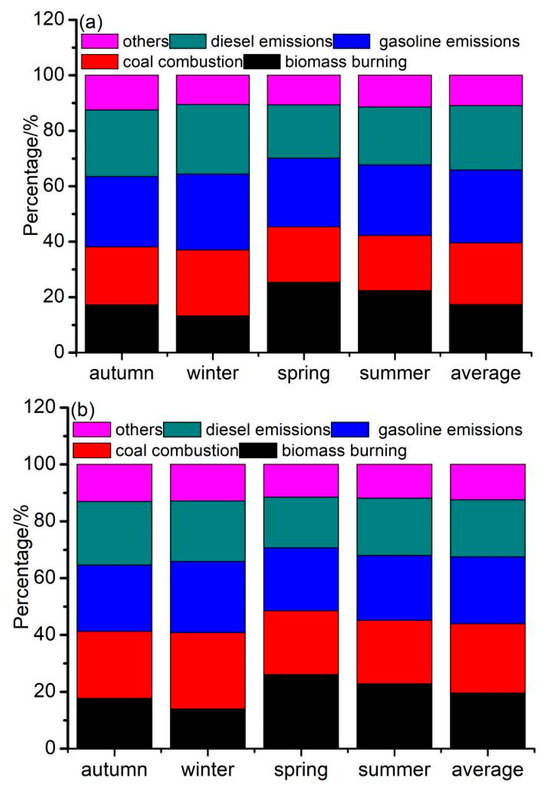
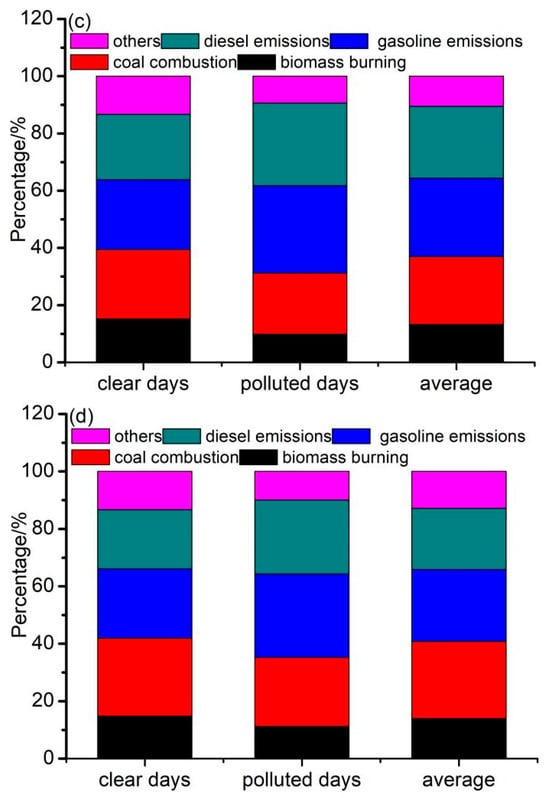
Figure 6.
Relative contributions from each identified source to (a) PM2.1 in different seasons, (b) PM2.1–9 in different seasons, (c) PM2.1–9 on clear and polluted days, and (d) PM2.1–9 on clear and polluted days of each source.
Figure 6c,d illustrate the contributions of the four sources to the fine and coarse particles on clear and polluted days. On polluted days, the contributions of coal combustion, biomass burning, gasoline emissions, and diesel emissions were 9.8%, 21.4%, 30.6%, and 28.8% to the fine fractions and 11.2%, 24.0%, 29.1%, and 25.8% to the coarse fractions. The contributions of gasoline emissions and diesel emissions on polluted days were higher than those on clear days; however, the contributions of coal combustion and biomass burning were lower than those on clear days. Additionally, the RP/C of the four sources was highest for diesel emissions (1.26 to fine particles vs. 1.25 to coarse particles), followed by gasoline emissions (1.25 vs. 1.20), coal combustion (0.88 vs. 0.89), and biomass burning (0.64 vs. 0.76). The high RP/C values indicated that traffic emissions played an important role in haze pollution.
3.4. Toxicological Effect of PAHs on BEAS-2B Cells
The toxicological effects of PAHs on BEAS-2B cells were investigated. Figure 7 shows the survival rates of cells under the influence of PAHs in different size fractions. The results showed that the survival rate of cells is inversely proportional to the concentration of PAHs, and a high concentration of PAHs will cause toxicity to cells and reduce their survival rate. The scatterplot of PAHs’ concentration and cell survival rates showed that when the PAHs’ concentration was below 0.05 μg/L, the cell survival rate did not decrease significantly with the increase in PAHs’ concentration. When the PAHs’ concentration was above 0.05 μg/L, the cell survival rate decreased significantly with the increase in the PAHs’ concentration. Compared with coarse particulate matter, the cell survival rate caused by fine particulate matter is lower at the same concentration of PAHs, and this result is mainly related to the higher content of highly toxic PAHs in fine particles.
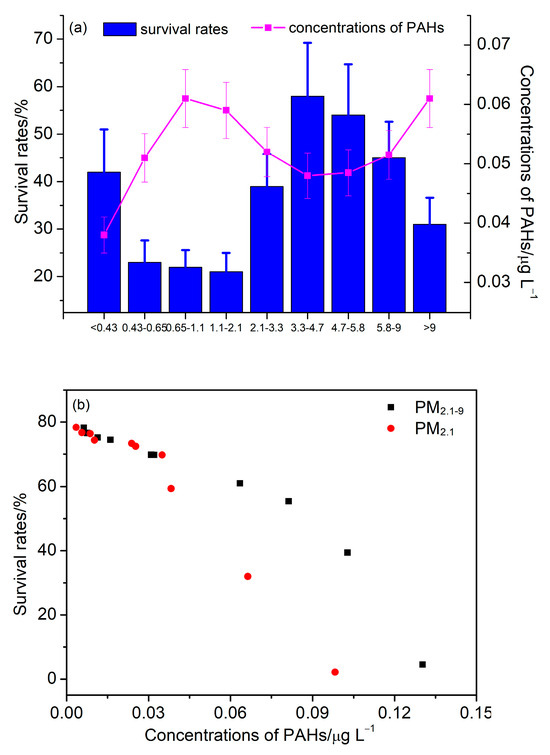
Figure 7.
(a) Survival rates of cells and concentrations of PAHs in different size fractions. (b) The scatterplot of survival rates and PAHs concentrations for PM2.1 and PM2.1–9.
4. Summary and Conclusions
In this study, 24 PAHs in size-resolved particles across the four seasonal sampling campaigns during the period from 2021 to 2022 were analyzed at the road site in Beijing. The mean levels of PAHs were the greatest during the winter and the lowest during clean summer. Comparisons revealed that PAHs in fine particles in winter decreased in the last decade. LMW and MMW PAHs in fine particles followed the order of winter > spring > autumn > summer, while concentrations of HMW PAHs were higher in autumn and winter compared to those in spring and summer. LMW PAHs in PM2.1–9 decreased from clear to polluted days; MMW and HMW PAHs in both fine and coarse particles significantly accumulated in the periods of haze pollution. The size distribution of PAHs was bimodal, with peak concentrations at 0.43–0.65 μm and 4.7–5.8 μm across four seasons. The size fractions of 0.43–2.1 μm PAHs increased most from clear to polluted days. Coal combustion, biomass burning, gasoline emissions, and diesel emissions were identified by PMF, which contributed 17.4%, 22.1%, 26.4%, and 23.2% to PAHs in PM2.1; and 19.6%, 24.3%, 23.6%, and 20.1% in PM2.1–9, respectively. The contributions of gasoline emissions and diesel emissions on polluted days were higher than those on clear days; however, the contributions of coal combustion and biomass burning were lower than those on clear days. The biological toxicity test showed that the cell survival rate caused by fine particles was lower than that of coarse particles with the same concentrations of PAHs, which is mainly related to the higher content of highly toxic PAHs in fine particles.
Author Contributions
Conceptualization, S.T., P.S. and Y.L.; methodology, S.T., Q.L., S.G., L.L., M.Y. and Y.A.; validation, S.T.; formal analysis, S.T., investigation, S.T.; resources, P.S. and Y.L.; data curation, S.T., S.G., L.L., M.Y. and Y.A.; writing—original draft preparation, S.T. and Q.L.; writing—review and editing, S.T. and Q.L.; visualization, S.T.; supervision, Y.L. All authors have read and agreed to the published version of the manuscript.
Funding
This study was supported by Beijing Natural Science Foundation (8232025 and 8222044) and the Beijing Academy of Science and Technology Innovation Project (23CA005-05).
Institutional Review Board Statement
Not applicable.
Informed Consent Statement
Not applicable.
Data Availability Statement
The data presented in this study are available in the main text.
Conflicts of Interest
The authors declare no conflict of interest.
References
- Perala-Dewey, J.; Orr, K.; Zawar-Reza, P. Atmospheric Transport of Polycyclic Aromatic Hydrocarbons into Three Alpine Valleys: Influence of Local-Scale Wind Patterns and Chemical Partitioning. Environ. Sci. Technol. 2023, 35, 57. [Google Scholar] [CrossRef] [PubMed]
- Shukla, S.; Khan, R.; Bhattacharya, P.; Devanesan, S.; Alsalhi, M.S. Concentration, source apportionment and potential carcinogenic risks of polycyclic aromatic hydrocarbons (PAHs) in roadside soils. Chemosphere 2022, 292, 133413. [Google Scholar] [CrossRef] [PubMed]
- Jiang, G.; Song, X.; Xie, J.; Shi, T.; Yang, Q. Polycyclic aromatic hydrocarbons (PAHs) in ambient air of Guangzhou city: Exposure levels, health effects and cytotoxicity. Ecotoxicol. Environ. Saf. 2023, 262, 115308. [Google Scholar] [CrossRef] [PubMed]
- Andersson, J.T.; Achten, C. Time to Say Goodbye to the 16 EPA PAHs? Toward an Up-to-Date Use of PACs for Environmental Purposes. Polycycl. Aromat. Compd. 2015, 35, 330–354. [Google Scholar] [CrossRef] [PubMed]
- Bergvall, C.; Westerholm, R. Identification and Determination of Highly Carcinogenic Dibenzopyrene Isomers in Air Particulate Samples from a Street Canyon, a Rooftop, and a Subway Station in Stockholm. Environ. Sci. Technol. 2007, 41, 731–737. [Google Scholar] [CrossRef] [PubMed]
- Ma, W.-L.; Zhu, F.-J.; Liu, L.-Y.; Jia, H.-L.; Yang, M.; Li, Y.-F. PAHs in Chinese atmosphere: Gas/particle partitioning. Sci. Total Environ. 2019, 693, 133623. [Google Scholar] [CrossRef] [PubMed]
- Alves, C.A.; Vicente, A.M.P.; Gomes, J.; Nunes, T.; Duarte, M.; Bandowe, B.A.M. Polycyclic aromatic hydrocarbons (PAHs) and their derivatives (oxygenated-PAHs, nitrated-PAHs and azaarenes) in size-fractionated particles emitted in an urban road tunnel. Atmos. Res. 2016, 180, 128–137. [Google Scholar] [CrossRef]
- Ali-Taleshi, M.S.; Riyahi Bakhtiari, A.; Moeinaddini, M.; Squizzato, S.; Feiznia, S.; Cesari, D. Single-site source apportionment modeling of PM2.5-bound PAHs in the Tehran metropolitan area, Iran: Implications for source-specific multi-pathway cancer risk assessment. Urban Clim. 2021, 39, 100928. [Google Scholar] [CrossRef]
- Gao, P.; Li, H.; Wilson, C.P.; Townsend, T.G.; Xiang, P.; Liu, Y.; Ma, L.Q. Source identification of PAHs in soils based on stable carbon isotopic signatures. Crit. Rev. Environ. Sci. Technol. 2018, 48, 923–948. [Google Scholar] [CrossRef]
- Jang, E.; Alam, M.S.; Harrison, R.M. Source apportionment of polycyclic aromatic hydrocarbons in urban air using positive matrix factorization and spatial distribution analysis. Atmos. Environ. 2013, 79, 271–285. [Google Scholar] [CrossRef]
- Wang, Q.; Dong, Z.; Guo, Y.; Yu, F.; Zhang, Z.; Zhang, R. Characterization of PM2.5-Bound Polycyclic Aromatic Hydrocarbons at Two Central China Cities: Seasonal Variation, Sources, and Health Risk Assessment. Arch. Environ. Contam. Toxicol. 2020, 78, 20–33. [Google Scholar] [CrossRef] [PubMed]
- Tang, N.; Suzuki, G.; Morisaki, H.; Tokuda, T.; Yang, X.; Zhao, L.; Lin, J.; Kameda, T.; Toriba, A.; Hayakawa, K. Atmospheric behaviors of particulate-bound polycyclic aromatic hydrocarbons and nitropolycyclic aromatic hydrocarbons in Beijing, China from 2004 to 2010. Atmos. Environ. 2017, 152, 354–361. [Google Scholar] [CrossRef]
- Famiyeh, L.; Chen, K.; Xu, J.; Sun, Y.; Guo, Q.; Wang, C.; Lv, J.; Tang, Y.T.; Yu, H.; Snape, C.; et al. A review on analysis methods, source identification, and cancer risk evaluation of atmospheric polycyclic aromatic hydrocarbons. Sci. Total Environ. 2021, 789, 147741. [Google Scholar] [CrossRef] [PubMed]
- Keyte, I.J.; Albinet, A.; Harrison, R.M. On-road traffic emissions of polycyclic aromatic hydrocarbons and their oxy- and nitro-derivative compounds measured in road tunnel environments. Sci. Total Environ. 2016, 566–567, 1131–1142. [Google Scholar] [CrossRef] [PubMed]
- Martuzevicius, D.; Kliucininkas, L.; Prasauskas, T.; Krugly, E.; Kauneliene, V.; Strandberg, B. Resuspension of particulate matter and PAHs from street dust. Atmos. Environ. 2011, 45, 310–317. [Google Scholar] [CrossRef]
- Bandowe, B.A.M.; Nkansah, M.A. Occurrence, distribution and health risk from polycyclic aromatic compounds (PAHs, oxygenated-PAHs and azaarenes) in street dust from a major West African Metropolis. Sci. Total Environ. 2016, 553, 439–449. [Google Scholar] [CrossRef] [PubMed]
- Wu, S.; Chen, Z.; Yang, L.; Zhang, Y.; Luo, X.; Guo, J.; Shao, Y. Particle-bound PAHs induced glucose metabolism disorders through HIF-1 pathway. Sci. Total Environ. 2021, 797, 149132. [Google Scholar] [CrossRef]
- Garcia, K.O.; Teixeira, E.C.; Agudelo-Castañeda, D.M.; Braga, M.; Alabarse, P.G.; Wiegand, F.; Kautzmann, R.M.; Silva, L.F.O. Assessment of nitro-polycyclic aromatic hydrocarbons in PM1 near an area of heavy-duty traffic. Sci. Total Environ. 2014, 479–480, 57–65. [Google Scholar] [CrossRef]
- Chen, F.; Hu, W.; Zhong, Q. Emissions of particle-phase polycyclic aromatic hydrocarbons (PAHs) in the Fu Gui-shan Tunnel of Nanjing, China. Atmos. Res. 2013, 124, 53–60. [Google Scholar] [CrossRef]
- Yang, M.; Tian, S.L.; Liu, Q.Y.; Yang, Z.; Yang, Y.F.; Shao, P.; Liu, Y.J. Determination of 31 Polycyclic Aromatic Hydrocarbons in Plant Leaves Using Internal Standard Method with Ultrasonic Extraction-Gas Chromatography-Mass Spectrometry. Toxics 2022, 10, 634. [Google Scholar] [CrossRef]
- Paatero, P.; Tapper, U. Positive matrix factorization: A non-negative factor model with optimal utilization of error estimates of data values. Environmetrics 1994, 5, 111–126. [Google Scholar] [CrossRef]
- Karanasiou, A.A.; Siskos, P.A.; Eleftheriadis, K. Assessment of source apportionment by Positive Matrix Factorization analysis on fine and coarse urban aerosol size fractions. Atmos. Environ. 2009, 43, 3385–3395. [Google Scholar] [CrossRef]
- Li, Y.; Bai, X.; Ren, Y.; Gao, R.; Ji, Y.; Wang, Y.; Li, H. PAHs and nitro-PAHs in urban Beijing from 2017 to 2018: Characteristics, sources, transformation mechanism and risk assessment. J. Hazard. Mater. 2022, 436, 129143. [Google Scholar] [CrossRef] [PubMed]
- Wang, Y.; Li, W.; Gao, W.; Liu, Z. 2013–2017 Trends in particulate matter and its chemical compositions in China. Sci. China Earth Sci. 2019, 62, 1857–1871. [Google Scholar] [CrossRef]
- Meng, Q.; Fan, S.; He, J.; Zhang, J.; Sun, Y.; Zhang, Y.; Zu, F. Particle size distribution and characteristics of polycyclic aromatic hydrocarbons during a heavy haze episode in Nanjing, China. Particuology 2015, 18, 127–134. [Google Scholar] [CrossRef]
- Zhang, F.; Xu, L.; Chen, J.; Chen, X.; Niu, Z.; Lei, T.; Li, C.; Zhao, J. Chemical characteristics of PM2.5 during haze episodes in the urban of Fuzhou, China. Particuology 2013, 11, 264–272. [Google Scholar] [CrossRef]
- Tian, S.; Pan, Y.; Liu, Z.; Wen, T.; Wang, Y. Size-resolved aerosol chemical analysis of extreme haze pollution events during early 2013 in urban Beijing, China. J. Hazard. Mater. 2014, 279, 452–460. [Google Scholar] [CrossRef] [PubMed]
- Zhang, W.; Zhang, S.; Wan, C.; Yue, D.; Ye, Y.; Wang, X. Source diagnostics of polycyclic aromatic hydrocarbons in urban road runoff, dust, rain and canopy throughfall. Environ. Pollut. 2008, 153, 594–601. [Google Scholar] [CrossRef]
- Yunker, M.B.; Macdonald, R.W.; Vingarzan, R.; Mitchell, R.H.; Goyette, D.; Sylvestre, S. PAHs in the Fraser River basin: A critical appraisal of PAH ratios as indicators of PAH source and composition. Org. Geochem. 2002, 33, 489–515. [Google Scholar] [CrossRef]
- Elzein, A.; Dunmore, R.E.; Ward, M.W.; Hamilton, J.F.; Lewis, A.C. Variability of polycyclic aromatic hydrocarbons and their oxidative derivatives in wintertime Beijing, China. Atmos. Chem. Phys. 2019, 19, 8741–8758. [Google Scholar] [CrossRef]
- Oliveira, C.; Martins, N.; Tavares, J.; Pio, C.; Cerqueira, M.; Matos, M.; Silva, H.; Oliveira, C.; Camoes, F. Size distribution of polycyclic aromatic hydrocarbons in a roadway tunnel in Lisbon, Portugal. Chemosphere 2011, 83, 1588–1596. [Google Scholar] [CrossRef] [PubMed]
- Iakovides, M.; Stephanou, E.G.; Apostolaki, M.; Hadjicharalambous, M.; Evans, J.S.; Koutrakis, P.; Achilleos, S. Study of the occurrence of airborne Polycyclic Aromatic Hydrocarbons associated with respirable particles in two coastal cities at Eastern Mediterranean: Levels, source apportionment, and potential risk for human health. Atmos. Environ. 2019, 213, 170–184. [Google Scholar] [CrossRef]
- Fang, B.; Zhang, L.; Zeng, H.; Liu, J.; Yang, Z.; Wang, H.; Wang, Q.; Wang, M. PM2.5-Bound Polycyclic Aromatic Hydrocarbons: Sources and Health Risk during Non-Heating and Heating Periods (Tangshan, China). Int. J. Environ. Res. Public Health 2020, 17, 483. [Google Scholar] [CrossRef] [PubMed]
- Gurkan Ayyildiz, E.; Esen, F. Atmospheric Polycyclic Aromatic Hydrocarbons (PAHs) at Two Sites, in Bursa, Turkey: Determination of Concentrations, Gas-Particle Partitioning, Sources, and Health Risk. Arch. Environ. Contam. Toxicol. 2020, 78, 350–366. [Google Scholar] [CrossRef]
- Kubo, T.; Bai, W.; Nagae, M.; Takao, Y. Seasonal Fluctuation of Polycyclic Aromatic Hydrocarbons and Aerosol Genotoxicity in Long-Range Transported Air Mass Observed at the Western End of Japan. Int. J. Environ. Res. Public Health 2020, 17, 1210. [Google Scholar] [CrossRef] [PubMed]
- Sofowote, U.M.; Allan, L.M.; McCarry, B.E. Evaluation of PAH diagnostic ratios as source apportionment tools for air particulates collected in an urban-industrial environment. J. Environ. Monit. 2010, 12, 417–424. [Google Scholar] [CrossRef] [PubMed]
- Liu, J.; Man, R.; Ma, S.; Li, J.; Wu, Q.; Peng, J. Atmospheric levels and health risk of polycyclic aromatic hydrocarbons (PAHs) bound to PM2.5 in Guangzhou, China. Mar. Pollut. Bull. 2015, 100, 134–143. [Google Scholar] [CrossRef]
- Bai, L.; Chen, W.; He, Z.; Sun, S.; Qin, J. Pollution characteristics, sources and health risk assessment of polycyclic aromatic hydrocarbons in PM2.5 in an office building in northern areas, China. Sustain. Cities Soc. 2020, 53, 101891. [Google Scholar] [CrossRef]
- Hoseini, M.; Yunesian, M.; Nabizadeh, R.; Yaghmaeian, K.; Ahmadkhaniha, R.; Rastkari, N.; Parmy, S.; Faridi, S.; Rafiee, A.; Naddafi, K. Characterization and risk assessment of polycyclic aromatic hydrocarbons (PAHs) in urban atmospheric particulate of Tehran, Iran. Environ. Sci. Pollut. Res. 2016, 23, 1820–1832. [Google Scholar] [CrossRef]
- Ouyang, R.; Yang, S.; Xu, L. Analysis and risk assessment of PM2.5-bound PAHs in a comparison of indoor and outdoor environments in a middle school: A case study in Beijing, China. Atmosphere 2020, 11, 904. [Google Scholar] [CrossRef]
- Pengchai, P.; Chantara, S.; Sopajaree, K.; Wangkarn, S.; Tengcharoenkul, U.; Rayanakorn, M. Seasonal variation, risk assessment and source estimation of PM 10 and PM10-bound PAHs in the ambient air of Chiang Mai and Lamphun, Thailand. Environ. Monit. Assess. 2009, 154, 197–218. [Google Scholar] [CrossRef] [PubMed]
- Wang, D.; Tian, F.; Yang, M.; Liu, C.; Li, Y.F. Application of positive matrix factorization to identify potential sources of PAHs in soil of Dalian, China. Environ. Pollut. 2009, 157, 1559–1564. [Google Scholar] [CrossRef] [PubMed]
- Rogge, W.F.; Hlldemann, L.M.; Mazurek, M.A.; Cass, G.R. Sources of fine organic aerosol. 2. Noncatalyst and catalyst-equipped automobiles and heavy-duty diesel trucks. Environ. Sci. Technol. 1993, 27, 636–651. [Google Scholar] [CrossRef]
- Khalili, N.R.; Scheff, P.A.; Holsen, T.M. PAH source fingerprints for coke ovens, diesel and gasoline engines, highway tunnels, and wood combustion emissions. Atmos. Environ. 1995, 29, 533–542. [Google Scholar] [CrossRef]
- Bzdusek, P.A.; Christensen, E.R.; Li, A.; Zou, Q. Source apportionment of sediment PAHs in Lake Calumet, Chicago: Application of factor analysis with nonnegative constraints. Environ. Sci. Technol. 2004, 38, 97–103. [Google Scholar] [CrossRef]
- Li, J.; Zhang, G.; Li, X.D.; Qi, S.H.; Liu, G.Q.; Peng, X.Z. Source seasonality of polycyclic aromatic hydrocarbons (PAHs) in a subtropical city, Guangzhou, South China. Sci. Total Environ. 2006, 355, 145–155. [Google Scholar] [CrossRef] [PubMed]
- Wan, X.; Chen, J.; Tian, F.; Sun, W.; Yang, F.; Saiki, K. Source apportionment of PAHs in atmospheric particulates of Dalian: Factor analysis with nonnegative constraints and emission inventory analysis. Atmos. Environ. 2006, 40, 6666–6675. [Google Scholar] [CrossRef]
- Harrison, R.M.; Smith, D.J.T.; Luhana, L. Source apportionment of atmospheric polycyclic aromatic hydrocarbons collected from an urban location in Birmingham, U.K. Environ. Sci. Technol. 1996, 30, 825–832. [Google Scholar] [CrossRef]
- Chang, K.F.; Fang, G.C.; Chen, J.C.; Wu, Y.S. Atmospheric polycyclic aromatic hydrocarbons (PAHs) in Asia: A review from 1999 to 2004. Environ. Pollut. 2006, 142, 388–396. [Google Scholar] [CrossRef]
- Karavalakis, G.; Fontaras, G.; Ampatzoglou, D.; Kousoulidou, M.; Stournas, S.; Samaras, Z.; Bakeas, E. Effects of low concentration biodiesel blends application on modern passenger cars. Part 3: Impact on PAH, nitro-PAH, and oxy-PAH emissions. Environ. Pollut. 2010, 158, 1584–1594. [Google Scholar] [CrossRef]
- Ballesteros, R.; Hernández, J.J.; Lyons, L.L. An experimental study of the influence of biofuel origin on particle-associated PAH emissions. Atmos. Environ. 2010, 44, 930–938. [Google Scholar] [CrossRef]
- Singh, K.P.; Malik, A.; Kumar, R.; Saxena, P.; Sinha, S. Receptor modeling for source apportionment of polycyclic aromatic hydrocarbons in urban atmosphere. Environ. Monit. Assess. 2008, 136, 183–196. [Google Scholar] [CrossRef] [PubMed]
- Xu, A.; Mao, Y.; Su, Y.; Shi, M.; Qi, S. Characterization, sources and risk assessment of PM2.5-bound polycyclic aromatic hydrocarbons (PAHs) in Huanggang city, central China. Atmos. Environ. 2021, 264, 118296. [Google Scholar] [CrossRef]
- Singh, S.; Ashesh, A.; Linthoingambi, D.N.; Yadav, I.C. A comprehensive review on occurrence, source, effect, and measurement techniques of polycyclic aromatic hydrocarbons in India. Microchem. J. 2022, 183, 108005. [Google Scholar] [CrossRef]
Disclaimer/Publisher’s Note: The statements, opinions and data contained in all publications are solely those of the individual author(s) and contributor(s) and not of MDPI and/or the editor(s). MDPI and/or the editor(s) disclaim responsibility for any injury to people or property resulting from any ideas, methods, instructions or products referred to in the content. |
© 2024 by the authors. Licensee MDPI, Basel, Switzerland. This article is an open access article distributed under the terms and conditions of the Creative Commons Attribution (CC BY) license (https://creativecommons.org/licenses/by/4.0/).