Article

Moss as a Biomonitor to Identify Atmospheric Deposition of Minor and Trace Elements in Macedonia

by
Robert Šajn
1,
Katerina Bačeva Andonovska
2,*,
Trajče Stafilov
3 and
Lambe Barandovski
4
1
Geological Survey of Slovenia, Dimičeva ul. 14, 1000 Ljubljana, Slovenia
2
Research Center for Environment and Materials, Macedonian Academy of Sciences and Arts, Krste Misirkov 2, 1000 Skopje, Macedonia
3
Institute of Chemistry, Faculty of Natural Sciences and Mathematics, Ss. Cyril and Methodius University, Arhimedova 5, 1000 Skopje, Macedonia
4
Institute of Physics, Faculty of Natural Sciences and Mathematics, Ss. Cyril and Methodius University, Arhimedova 3, 1000 Skopje, Macedonia
*
Author to whom correspondence should be addressed.
Atmosphere 2024, 15(3), 297; https://doi.org/10.3390/atmos15030297
Submission received: 6 February 2024 / Revised: 23 February 2024 / Accepted: 27 February 2024 / Published: 28 February 2024

Abstract

:
The present work was carried out to obtain and highlight the fifth comprehensive baseline dataset on atmospheric deposition of trace elements and to assess air quality in Macedonia. In the period from August to September 2020, a total of 72 moss samples were collected in accessible areas in the country. The content of 28 elements (Ag, Al, B, Ba, Ca, Cd, Co, Cr, Cu, Fe, Ga, Hg, K, La, Mg, Mn, Mo, Na, Ni, P, Pb, S, Sb, Sc, Sr, Ti, U, and Zn) was determined using inductively coupled plasma–mass spectrometry. Based on the data obtained on the content of the elements, a factor analysis was carried out to identify and characterise different sources of pollution. In addition, distribution maps were created for all elements to show the regions most affected by anthropogenic activities. The survey conducted in 2020 has shown that air pollution with potentially toxic elements (PTEs) has slightly decreased compared to the results of the previous survey from 2015. This is due to the fact that, despite the operation of all mining and smelting facilities with the same capacity, government regulations for the installation of cleaning systems and additional regulations to reduce pollution have been introduced in the last five years. Nevertheless, the fact remains that the highest anthropogenic air pollution with PTEs is still caused by the operation of the ferronickel smelter in Kavadarci (Ni and Cr) in the southern part and by the lead and zinc mines in Probištip, Makedonska Kamenica, and Kriva Palanka in the eastern part of the country (Cd, Pb, and Zn).

1. Introduction

Air pollution is a serious problem that is constantly monitored and reported worldwide [1,2,3,4,5,6,7,8]. Potentially toxic elements (PTEs) represent only a portion of the many harmful compounds in the air. The extent of metals and their distribution in the air depends on the frequency of emissions [2,9,10]. However, the higher concentrations of certain potentially toxic elements (PTEs) in the air pose a threat to the population and the environment as a whole. Air pollution with PTEs is a global problem, but there are hotspots that affect local populations [11,12,13,14,15,16,17,18]. For this reason, monitoring programmes should be implemented. The programme should cover larger areas and locate the hotspots in the study region where the local emission sources of PTEs have a direct impact on the local population and their environment [2,7,19,20,21]. The analysis of atmospheric deposition of trace elements is usually based on classical chemical analysis (e.g., precipitation, extraction, distillation, and quantitative and qualitative analysis), for which expensive equipment is used and which is sometimes not sensitive enough to detect the low concentrations [22,23,24]. Such problems can be solved by the use of biomonitors, i.e., organisms that provide quantitative information about the environment in which they grow [15,25,26,27].
For air quality assessment, terrestrial mosses have been significantly used as biomonitors because they are geographically widespread species with no or poorly developed cuticles, no or poorly develop root systems, and a high cation-exchange capacity [13,24,26]. Mosses also have a high ability to bind particles on their surfaces.
Despite the efficiency and simplicity of this technique, moss biomonitoring still has its limitations. The limitation of using bioindication methods is that the results cannot be compared with legal pollution standards. Another disadvantage is that it is often difficult to find them throughout the study area.
In the study or monitoring for air pollution from PTEs in Macedonia, the moss biomonitoring technique was used for the first time in 2002 as part of the European programme for monitoring the effects of air pollution on natural vegetation and crops with heavy metals (ICP Vegetation) [4,11,13,28,29]. The first study found that the activities of mines and smelters are the main sources of emissions of PTEs in the country [30]. The results of the earlier surveys in 2005, 2010, and 2015 confirmed the results of the first survey [30,31,32,33].
The activities of mines and smelters are the main sources of emissions of PTEs in the country. Thus, one of the largest sources of air pollution with Cd, Pb, and Zn are the three existing mines and flotation plants for the processing of Pb and Zn ore, “Sasa”, “Zletovo”, and “Toranica”, and the copper mine “Bučim” and flotation near the town of Radoviš in the east of the country [34], especially due to dust emissions from the large amounts of flotation residues enriched with PTEs.
Metallurgical plants that process ores and concentrates for the extraction of metals and ferroalloys, as well as metallurgical waste from these processes, also contribute significantly to the elevated concentrations of some PTEs in dust emitted into the air. Metallurgical waste covers productive land in certain areas and reduces soil resources. The PTEs contained in these wastes, which cause contamination, pose a major threat to soils and the environment in general.
This applies to the smelter for the production of lead, zinc, and cadmium in the city of Veles (in the central part of the country) [35], the smelter for the production of ferronickel in the south of the country in the vicinity of the city of Kavadarci [36], the smelter for the production of ferrochrome and ferrosilicon in the northern part of the country near the village of Jegunovce, and the smelter for the production of pig iron and steel in the capital Skopje [35].
Thermal power plants produce large amounts of waste in the form of fly ash and slag, as they use lignite with a low calorific value and high ash content. The ash landfill on the site of the REK Bitola thermal power plant on fertile soil covers 10 ha. The wind-blown ash contains heavy metals, as well as traces of uranium and thorium [37].
The aim of this study was to (1) present the results of the 2020 survey on deposition in Macedonia based on the analysis of moss samples using inductively coupled plasma mass spectrometry (ICP-MS) as an analytical technique, (2) show temporal trends of PTE content in the country’s mosses between 2002 and 2020, and (3) classify the data and identify possible sources of the elements and their deposition patterns.

2. Materials and Methods
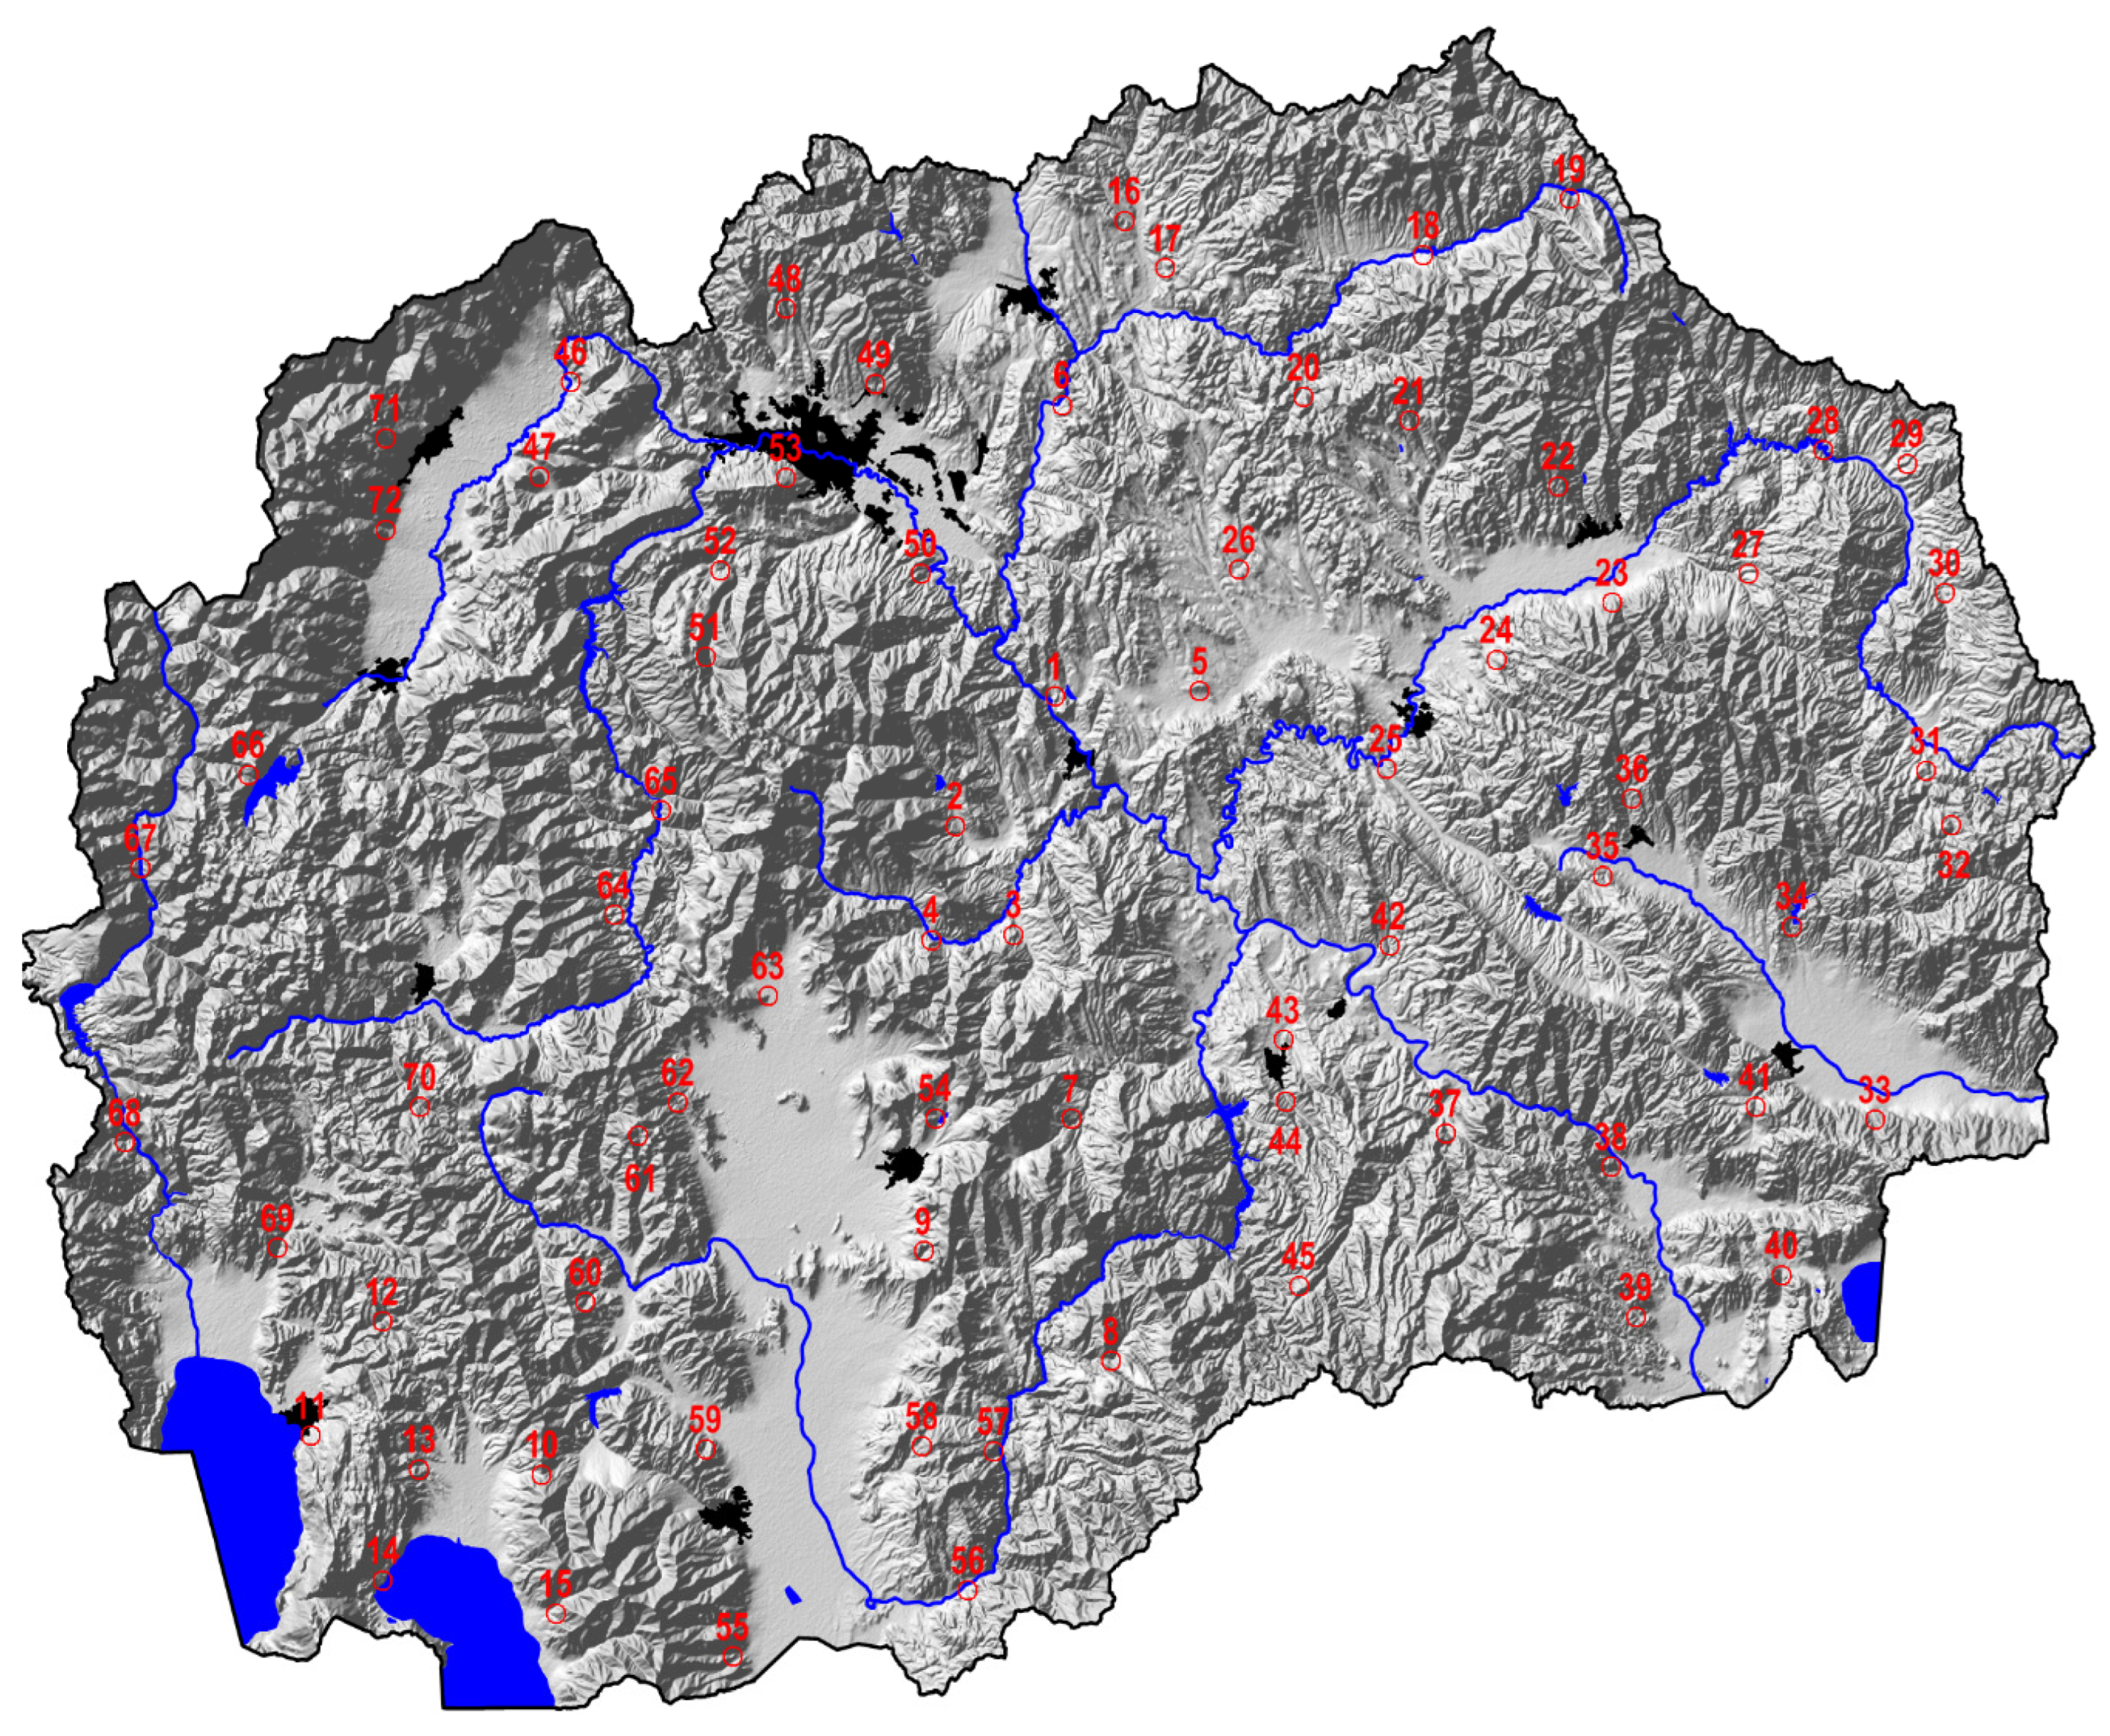
2.1. Study Area

Macedonia is located in the central part of the Balkan Peninsula (Figure 1). It covers an area of 25,700 km2 with a total population of 1,836,713 inhabitants (in 2021). The landscape is predominantly rugged and lies between the Šar and Osogovo Mountains, which frame the valley of the Vardar River. Macedonia has significant deposits of chromium and other non-ferrous metals (Cu, Pb, Zn, Ni, and Mn). The country also has gypsum, marble, and granite mines. Due to its characteristic natural and geographical features, Macedonia has two different climatic zones: a modified Mediterranean climate and a temperate continental climate [38].
Macedonia has a complex geology with many geological formations of different ages, which has resulted in a wide variety of soil types (Figure 2). It comprises six major tectonic units [39], including the Vardar Zone (VZ) in the central region, the Pelagonian Massif (PM), the West-Macedonian Zone (WMZ), and a small part of the Cukali-Krasta Zone (CKZ) in the west, as well as the Serbo-Macedonian Massif (SMM) and the Kraishtide Zone (KZ) in the east of the country [40].

2.2. Sampling, Sample Preparation and Analyses

Moss samples were collected from August to September 2020 at 72 sites across the country, with a grid of 17 × 17 km (Figure 3). The most common moss species are Camptothecium lutescens, Hypnum cupresifforme, Camptothecium lutescens, and Hypnum cupresifforme. Samples were taken according to the European ICP vegetation programme [26].
All collected moss samples were sent to the accredited laboratory ACME Ltd. in Vancouver, BC, Canada. For the analysis of the moss samples, approximately 1 g was placed in Teflon digestion vessels, which were digested in HNO3 followed by aqua regia and then analysed. All 37 elements (Ag, Al, As, Au, B, Ba, Bi, Ca, Cd, Co, Cr, Cu, Fe, Ga, Hg, K, La, Mg, Mn, Mo, Na, Ni, P, Pb, S, Sb, Sc, Se, Sr, Te, Th, Ti, Tl, U, V, W, and Zn) were determined using inductively coupled plasma mass spectrometry (ICP-MS). The detection limits ranged from 0.2 µg/kg for Au, 1 µg/kg for Hg, 3 µg/kg for Ag, 0.01 mg/kg for Cd, Co, Cu, La, Mo, Pb, and U, 0.02 mg/kg for Bi, Sb, Te, and Tl, 0.1 mg/kg for As, Ba, Cr, Ga, Ni, Sc, Se, Th, W, and Zn, 0.5 mg/kg for Sr, 1 mg/kg for B and Mn, 2 mg/kg for V, 10 mg/kg for Ti, 0.001% for Fe, Mg, and P, 0.01% for Al, Ca, K, and Na, and up to 0.05% for S. It was found that the contents for 9 elements (As, Au, Bi, Se, Te, Th, Tl, V, and W) were below the detection limit in most of the analysed samples and the data for these elements were excluded from further consideration. And for this reason, 28 elements were analysed in the moss samples.

2.3. Quality Control

Quality control was ensured by the analyses of moss standard reference materials M2 and M3 [41]. During the analysis, in addition to the routine calibration solutions, replicate and blank reference materials were also run at randomly assigned positions within each analysis. These QC materials provide a final check on the entire analytical process. The analysed concentrations of the moss standard reference materials were within the recommended values. The difference between the analysed and certified values was within 15%. The standard addition method was also used, and quantitative recoveries were obtained for most elements.

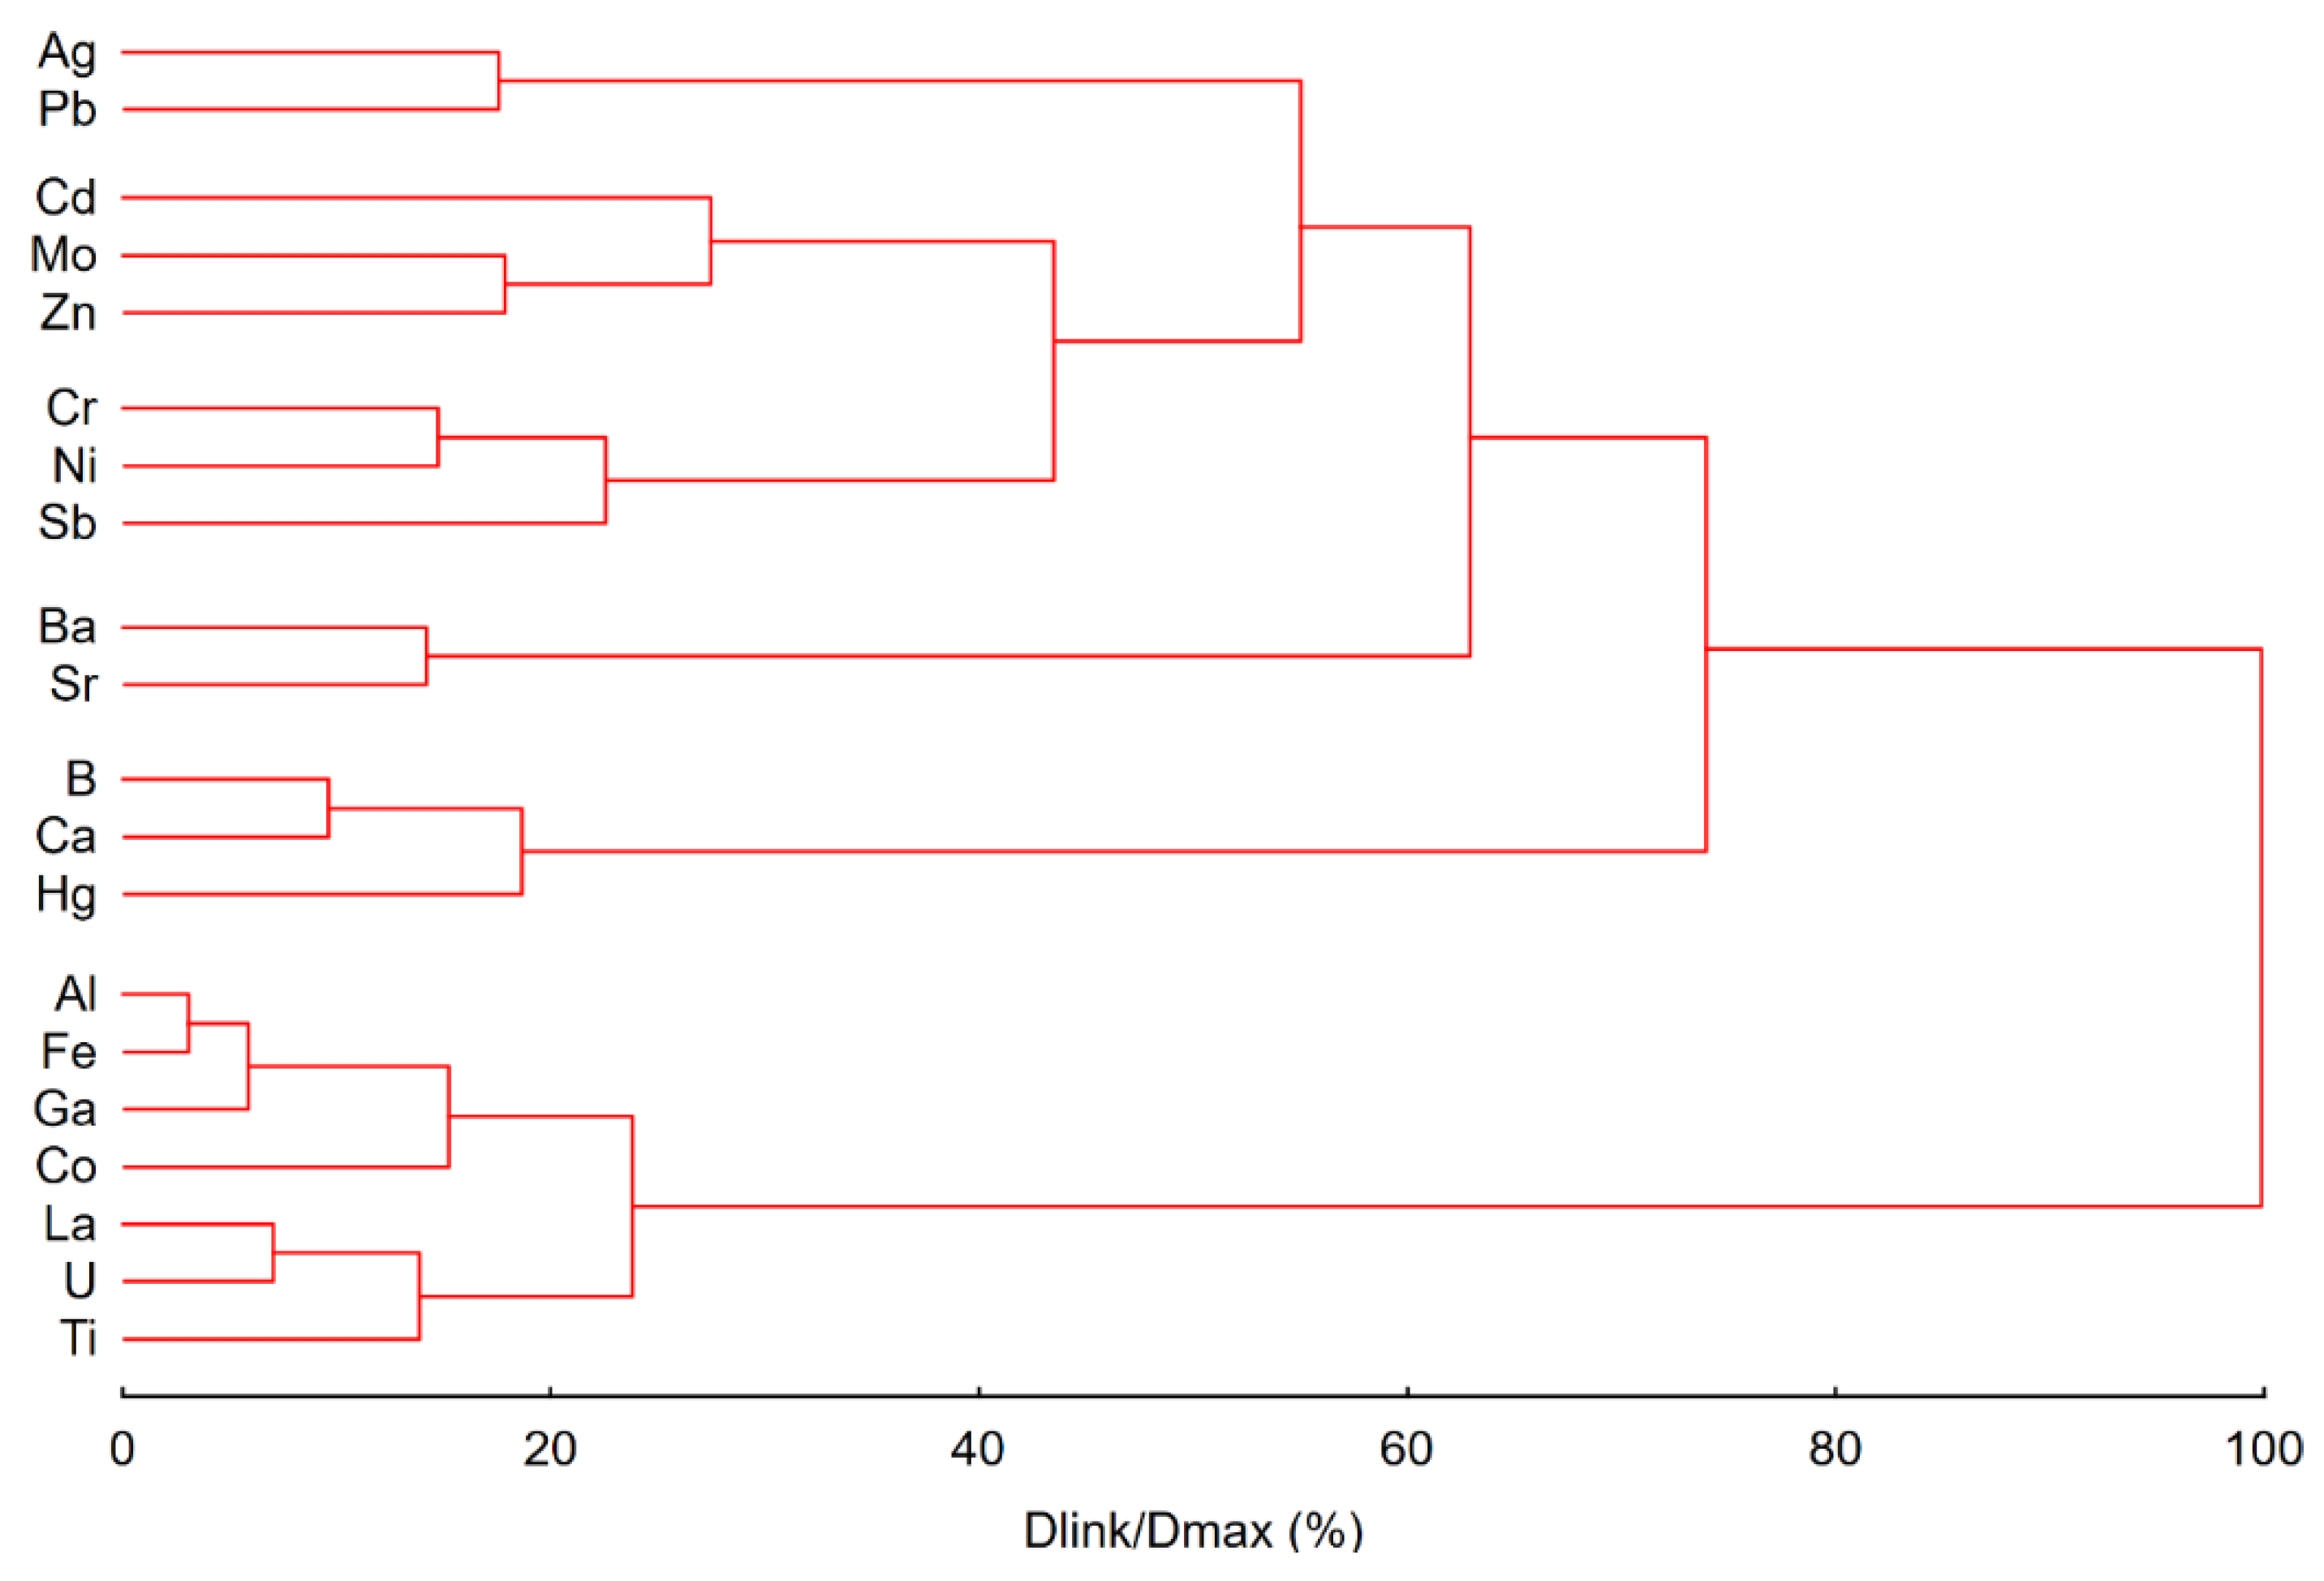
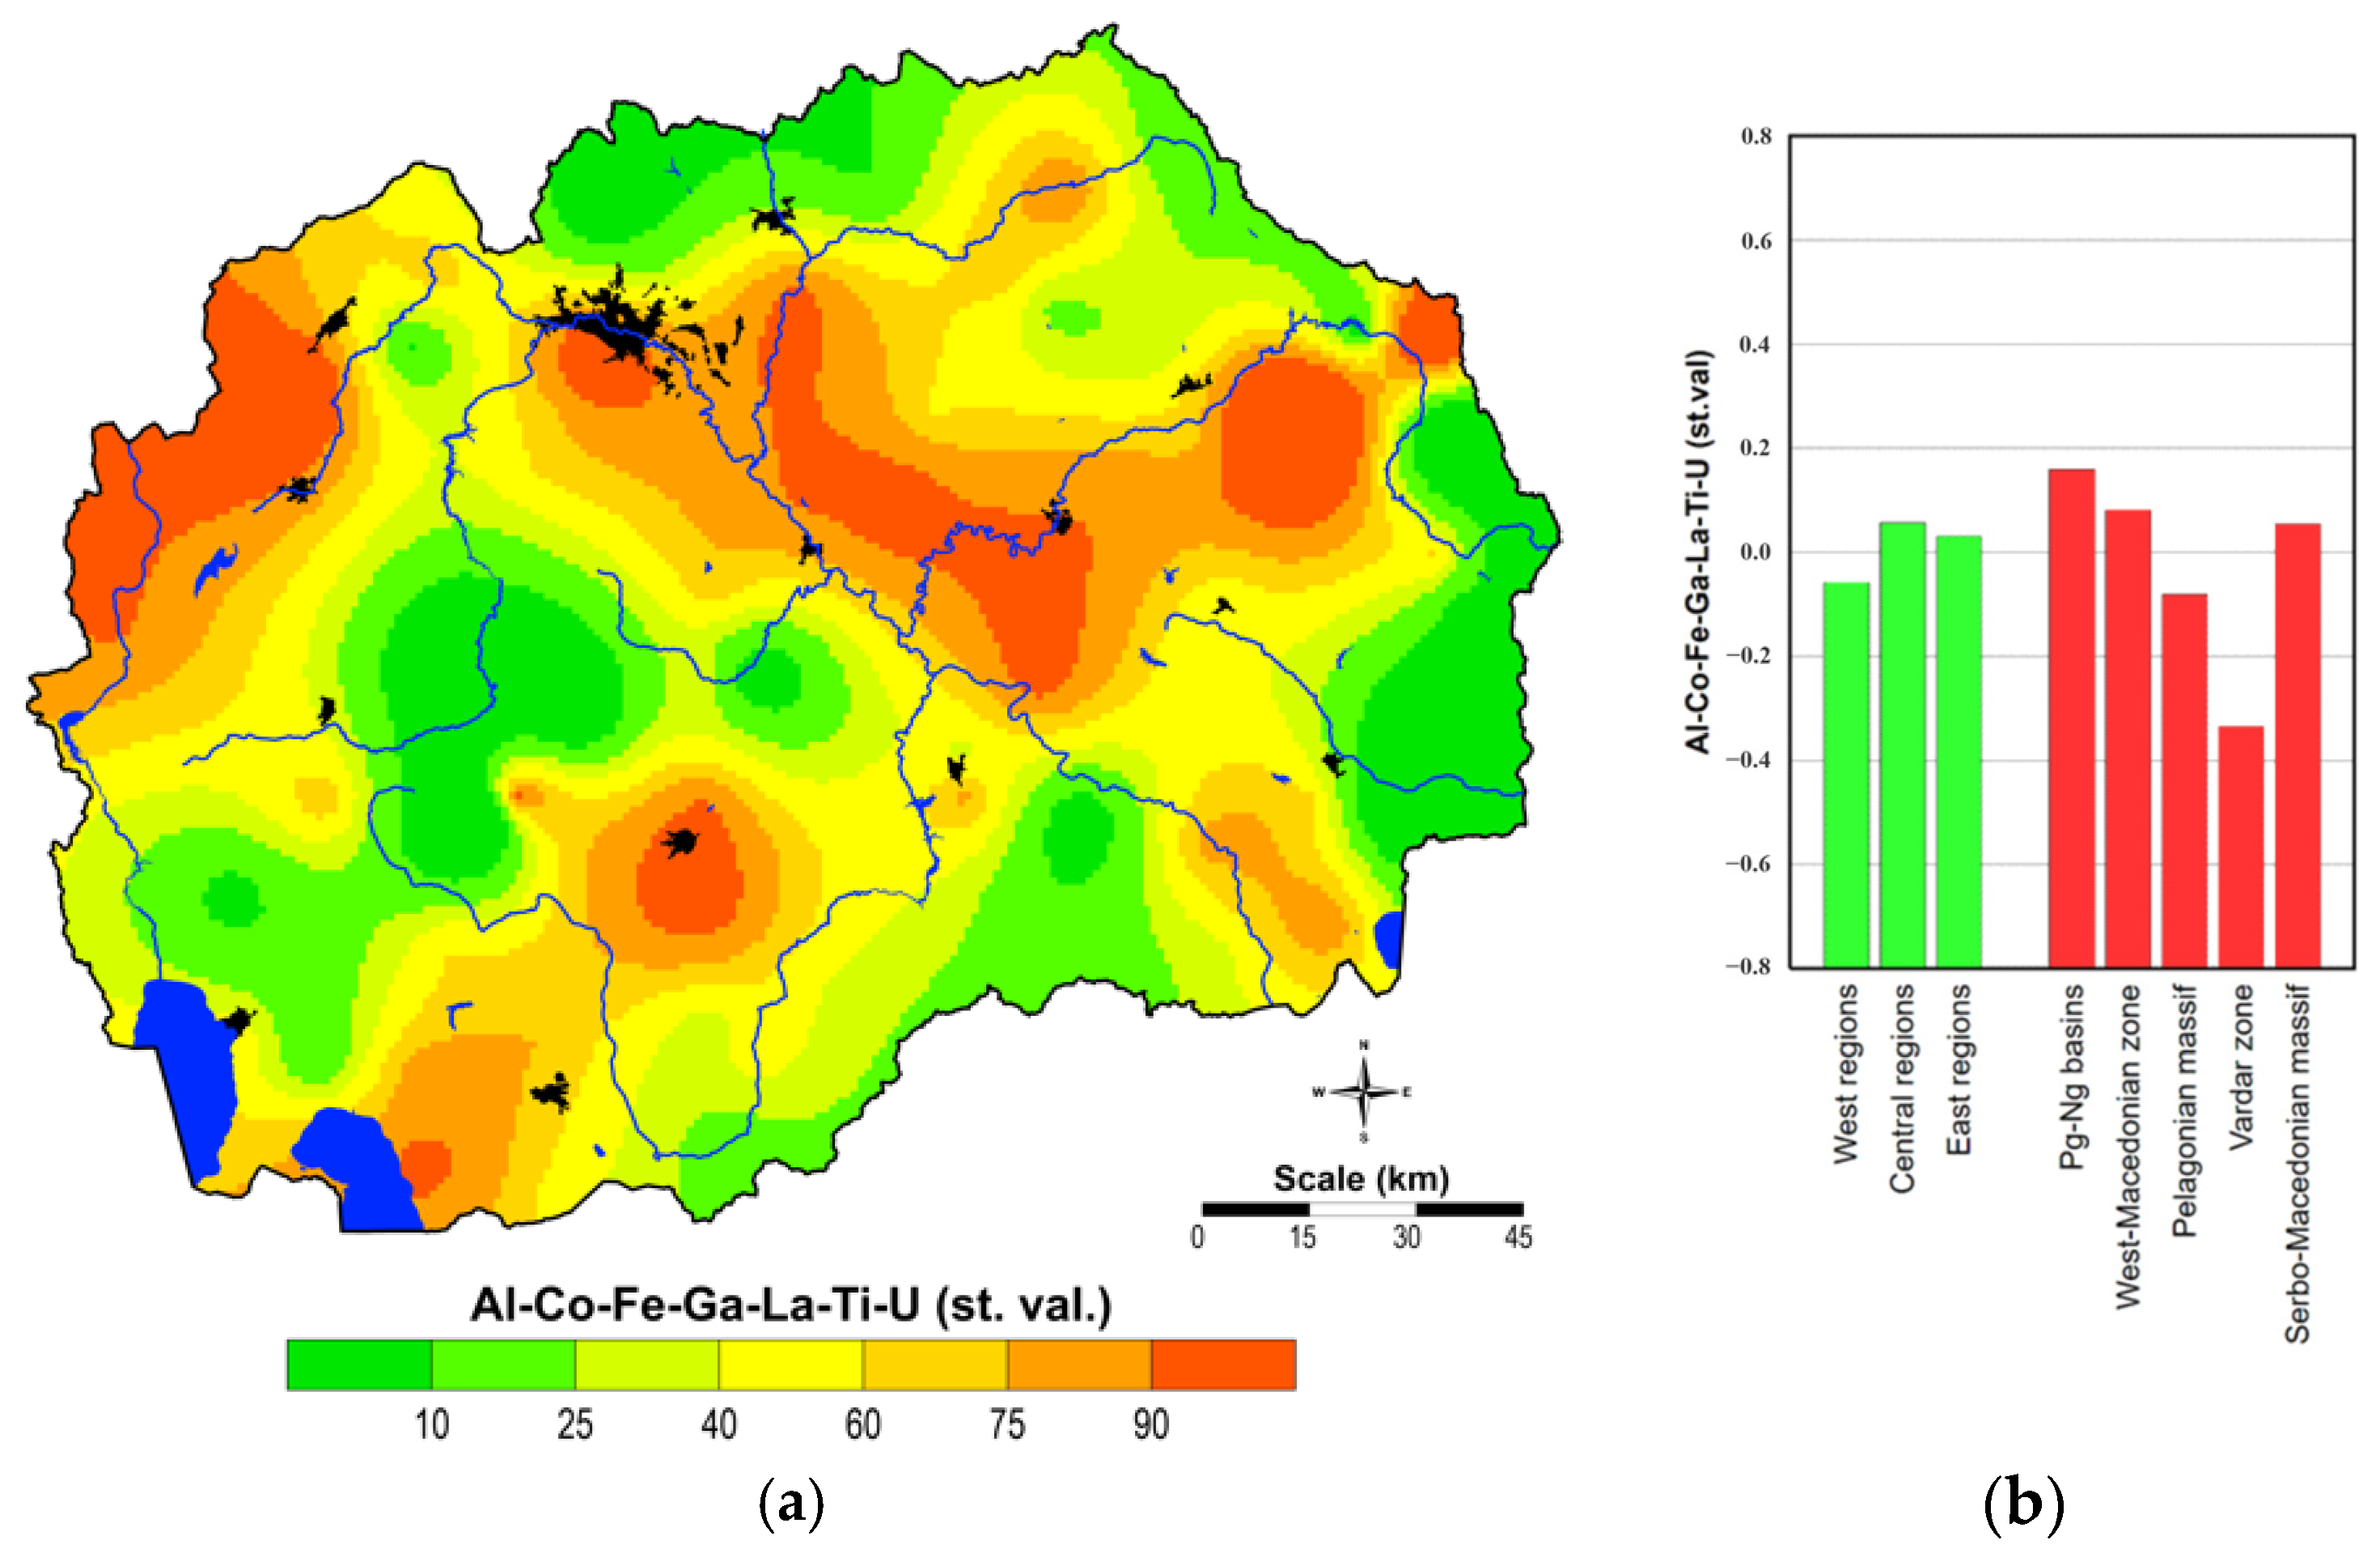
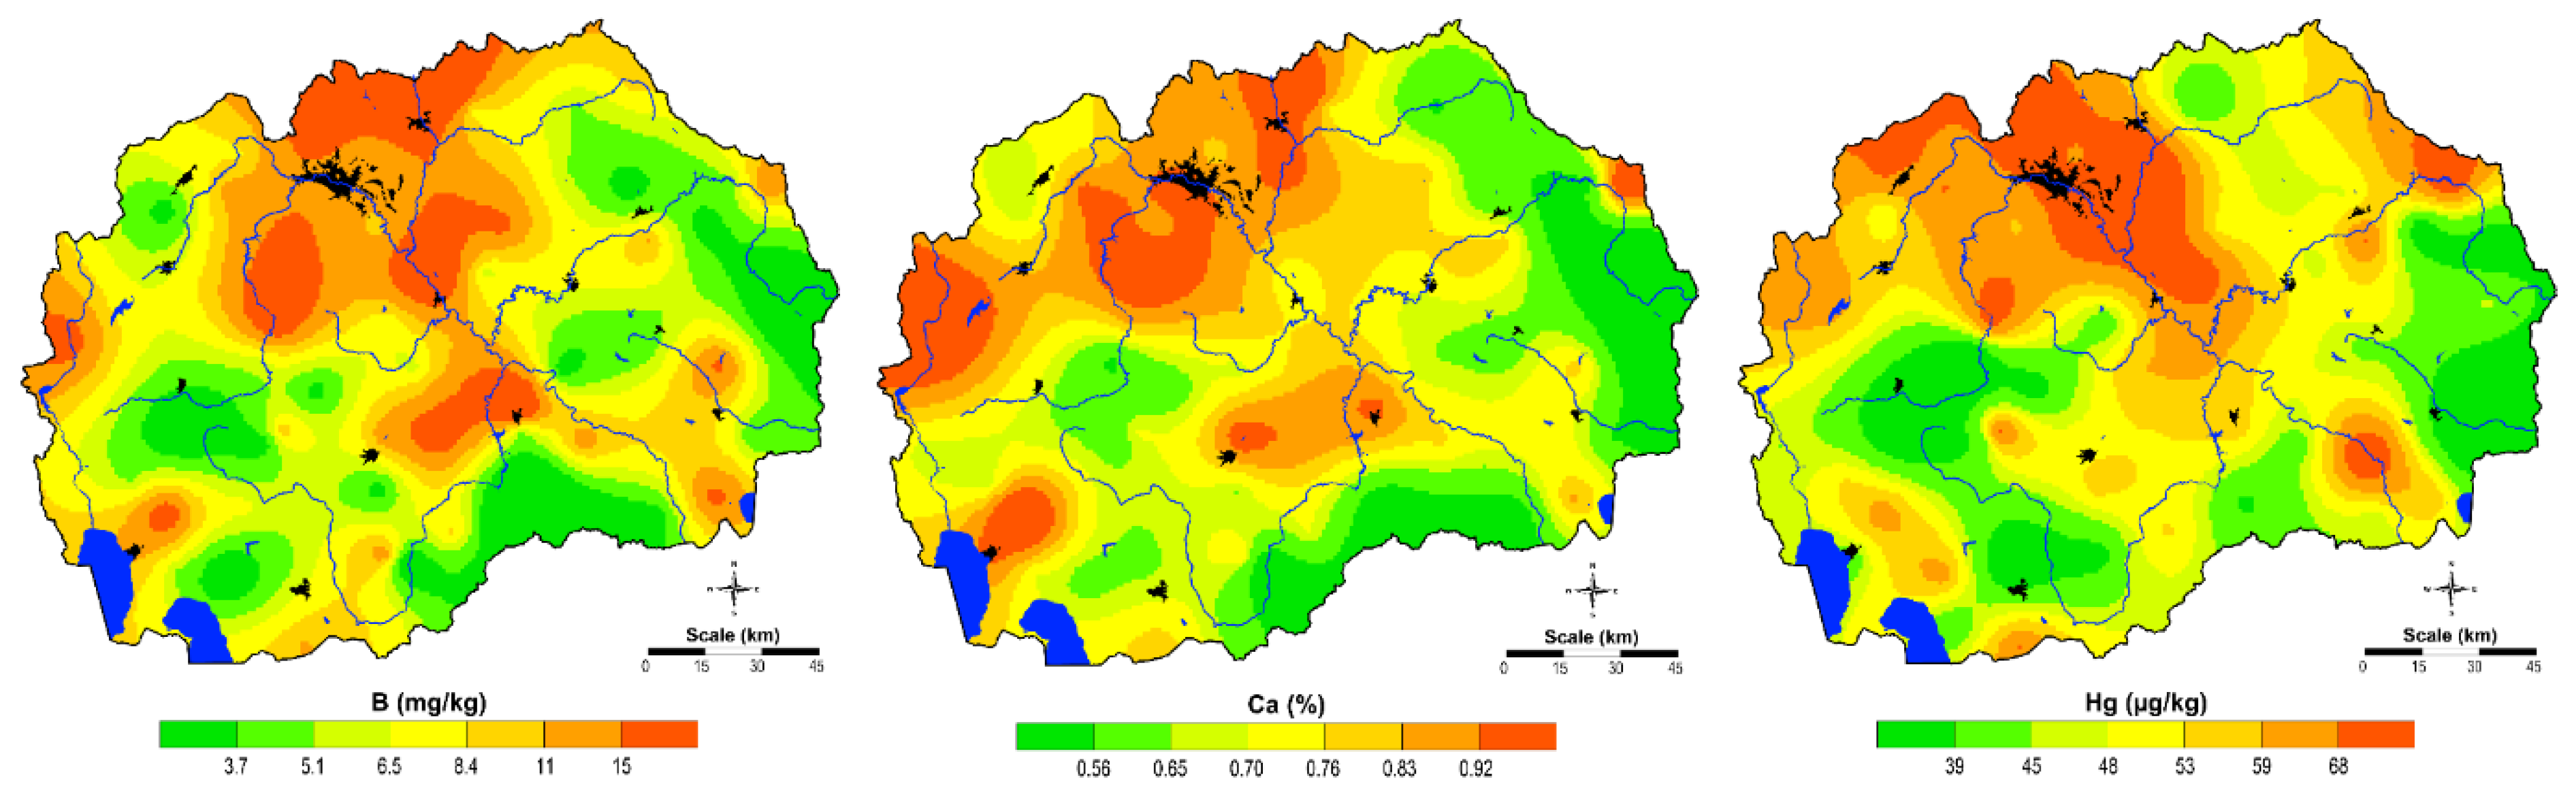
2.4. Statistical Methods

The statistical software Statistica 13 (StatSoft, Inc., Tulsa, OK, USA) was used to compare the results between different datasets and to perform parametric and nonparametric statistical methods simultaneously [42,43].
As the datasets were not normally distributed, a Box–Cox transformation was performed according to [44]. The Box–Cox-transformed values were later used in the analysis of variance. Initially, bivariate statistics were used to determine the correlation of chemical element contents between moss samples depending on the sampling campaign, which was then supported by statistical tests [45].
Pearson’s correlation coefficient was used to investigate the degree of association of the chemical elements in the moss samples [46]. The correlation coefficient was used to calculate the degree of correlation (linear dependence) between two random variables or groups of random variables.
The multivariate R-mode factor analyses were performed for 20 selected elements (Ag, Al, B, Ba, Ca, Cd, Co, Cr, Fe, Ga, Hg, La, Mo, Ni, Pb, Sb, Sr, Ti, U, and Zn). Some elements were excluded from the analysis because they had no meaningful relationship to other chemical elements. For the purpose of factor analysis, the variables were standardised to a mean of zero [47,48,49].
Universal kriging with the linear variogram interpolation method was used to create maps showing the spatial distribution of factor scores and maps showing the distribution of PTEs in the moss samples [47]. A grid cell size of 1 × 1 km was used for the interpolation. The visualisation (mapping) of the data was performed with different software packages: Statistica 13 (StatSoft, Inc., Tuls, OK, USA), QGIS (#), and Surfer 17 (Golden Software, Inc., Golden, CO, USA).

3. Results and Discussion

The statistics with all data of the 28 analysed elements (Ag, Al, B, Ba, Ca, Cd, Co, Cr, Cu, Fe, Ga, Hg, K, La, Mg, Mn, Mo, Na, Ni, P, Pb, S, Sb, Sc, Sr, Ti, U, and Zn) in the moss samples from the whole country (n = 72) are presented in Table 1. The values for Ca, K, Mg, P, and S are given in %; the values for the other elements (Al, B, Ba, Cd, Co, Cr, Cu, Fe, Ga, La, Mn, Mo, Na, Ni, Pb, Sc, Sr, Ti, and Zn) are given in mg/kg, while the contents for Ag, Hg, Sb, and U are given in µg/kg. Table 1 shows the descriptive statistics of the results for all 28 analysed elements. The results presented show that the median for some elements was lower than the P90 or the maximum values. This indicates a non-uniform distribution of elements with a large variation due to their increased content in the air in areas with anthropogenic pollution sources.
Table 2 shows comparative statistics of the average contents of the analysed elements by territorial regions (W-MK—western part, C-MK—central part, and E-MK—eastern part) and by tectonic units (Ng-Pg—Neogene and Paleogene, WMZ—West-Macedonian Zone, PM—Pelagonian Massif, VZ—Vardar Zone, and SMM—Serbo-Macedonian Massif). It can be seen that some elements have relatively similar mean content values in different parts of the country (Co, Cr, Ga, K, La, Mg, P, S, Sc, and Ti); some had higher values in the western part of the country (Mn and Na), some in the central part (Al, B, Ca, Cd, Mo, Ni, Pb, Sb, Sr, and Zn), and some in the eastern part (Ag, Al, Cd, Cu, Mn, Pb, Sb, Sr, and Zn). For some elements, these increased contents are due to a lithogenic origin, in some cases to an anthropogenic origin, and in some cases to both origins. All correlation coefficients between all elements for the elements determined by ICP-MS are listed in the matrix of correlation coefficients (Table 3).
The results of the factor analysis of the elements’ content values are shown in Table 4. Six factors were identified with a variability of 80.4% for the identified elements: F1 (Al, Fe, La, Ti, U, Ga, and Co), F2 (B, Ca, and Hg), F3 (Ag and Pb), F4 (Ba and Sr), F5 (Cr, Mo, and Ni), and F6 (Cd, Sb, and Zn). The factor analysis revealed two geogenic associations (F1 and F4), two anthropogenic associations (F3 and F6), and two mixed geogenic and anthropogenic associations (F2 and F5).
The resulting cluster analysis, which includes 20 elements, produces 7 subclusters, leading to the separation of 6 main clusters (Figure 4). The dendrogram contains 20 elements, while 8 elements were excluded from the dendrogram because they correlate poorly with other elements. The elements not included in the dendrogram are the same elements that are not included in the factor associations (Cu, K, Mg, Mn, Na, P, S, and Sc). Figure 4 shows that 7 subclusters were formed, leading to the separation of 6 main clusters comprising the remaining 20 elements. The first cluster comprises Al, Fe, Ga, Co, La, U, and Ti, elements that form Factor 1. The second cluster with B, Ca, and Hg corresponds to Factor 2; the third cluster corresponds to Factor 4 and includes Ba and Sr. The fourth cluster includes Cr, Ni, and Mo, and the fifth cluster includes Cd, Mo, and Zn. These clusters correspond to the associations of Factor 5 and Factor 6 with the difference that antimony from the fourth cluster is included in Factor 6 and molybdenum from the fifth cluster is included in Factor 6. Finally, the sixth cluster with Ag and Pb corresponds to the association of the elements from Factor 3.
The association of Al, Fe, La, Ti, U, Ga, and Co (Factor 1) represents the typical crustal components in the moss samples, which are significantly influenced by the mineral particles carried into the atmosphere by the wind and whose spatial distribution depends mainly on the urban activities not associated with industrial activities. It accounts for 26.59% of the total variability representing the strongest factor (Table 4, Figure 5 and Figure 6). High contents of elements from this association were found in moss samples from the areas of Paleogene and Neogene clastitic sediments of the Vardar tectonic zone located in the central part of the country. High contents of these elements are also found in moss samples from the eastern and western part of the country (Plačkovica and Golak Mountains), where Proterozoic metamorphic rocks and Paleozoic igneous rocks of the Serbian-Macedonian geotectonic massif predominate.
Higher contents of elements from F1 are also found in moss samples from the northeastern part of the country (southern part of the Šar Mountains and Korab Mountains) along the Radika River, where Paleozoic metamorphic and carbonate rocks from the West-Macedonian Zone and Mesozoic clastitic sediments from the Cukali-Krasta Zone predominate (Figure 5 and Figure 6) [40].
The increased content of elements of this factor are also found in the southern part of the city of Skopje (Al, Fe, Ti, and Ga) and near the city of Prilep (Co and Fe), in areas with Proterozoic metamorphic rocks from the Pelagonian Massif and in the samples from the vicinity of the Galičica Mountains and Dojran Lake, where Mesozoic carbonate rocks predominate. High contents of these elements are also known in the eastern part, the part between Kočani and Radoviš (Serbo-Macedonian Massif) [34].
The high uranium values in the samples collected in the Pelagonian Massif (Figure 5 and Figure 6) can be explained by the presence of metamorphic rocks from the Proterozoic of the Pelagonian Massif with increased uranium content in the soil [40]. The elevated U content in moss samples collected in the southwest of the country near the town of Bitola could also be related to fly ash emissions from a thermoelectric power plant in Bitola, which uses lignite as fuel, and to transboundary pollution from thermoelectric power plants in northern Greece [37]. The uranium-rich granite deposits in the eastern part of the country may also have an influence on the high uranium levels. During the mining of these granites, uranium-containing dust particles can enter the environment in considerable quantities, which are collected by the moss samples. The median value for U is 20 µg/kg, with the minimum value of 5 µg/kg and the maximum value of 110 µg/kg (Table 1). The highest values for U were found in the eastern region with 19 µg/kg and the highest uranium content in the Serbo-Macedonian Massif with 20 µg/kg (Table 3).
The geochemical association of the elements B, Ca, and Hg (Factor 2) represents a mixed geogenic and anthropogenic association. The elements B and Ca are naturally present on the whole territory of the country, and there is no pollution by them. However, the Hg content in the moss samples is a completely different case. The higher Hg content (Figure 7 and Figure 8) in the air is of both anthropogenic and geogenic origin. The anthropogenic origins are the soil pollution near the town of Veles and the presence of a slag deposit from the former operation of the Pb-Zn smelter in Veles [50], as well as the flotation waste dumps from the mines of Zletovo, Sasa, and Toranica in the central and eastern parts of the country. The influence of the thermoelectric power plant near Bitola can also be seen in the dust emissions, which contain Hg due to the use of large quantities of lignite.
The high enrichment of moss samples collected near the capital Skopje is partly related to mercury-contaminated areas of the former “Organic Chemical Industry in Skopje—OHIS” factory in the city (in operation from 1964 to 1995). It is assumed that part of the mercury-containing waste generated during chlorine production (using mercury cell electrolysis) was disposed of in the mixed landfill near the factory and that 400 tonnes of mercury were released into the environment [51]. In the northwestern part of the country, the main source of pollution in the village of Jegunovce in the Tetovo region is the ferrosilicon smelting plant “Silmak” and the landfill near the plant. High levels of Hg have been detected in this part of the country, probably from steel production, i.e., ferrosilicon from scrap metal.
The statistical values for the elements from F2 are shown in Table 1. The median value for Hg is 52 µg/kg, with a minimum of 27 µg/kg and maximum of 96 µg/kg. The median value for B is 7 mg/kg, and the minimum value is 0.5 mg/kg, and the maximum value is 36 mg/kg. For Ca, the median value is 0.72%, and the range is from 0.38 to 1.3%.
The geochemical association of the elements Ag and Pb (Factor 3) is an anthropogenic factor and is related to the industrial activity in the country (Figure 9) with the highest levels in the samples from the central and northeastern part of the country (the vicinity of Skopje, Veles, Tetovo, Probištip, Makedonska Kamenica, and Kriva Palanka). More precisely, in the eastern region, the highest Ag and Pb levels were found in the Serbo-Macedonian Massif (19 µg/kg and 4.4 mg/kg) and in the Paleogene and Neogene basins (17 µg/kg and 4.2 mg/kg, respectively).
The elements contained in Factor 3 (Ag and Pb) are related to dust emission from the flotation residues of Pb-Zn flotation tailings (Figure 9 and Figure 10) [52]. The traffic density, district heating, and the steelworks in Skopje also contribute to increased pollution [33]. In region of the city of Veles, the main source of Pb pollution is the slag deposit of the Pb-Zn smelter [50]. Although the smelter has not been in operation since 2002, the open slag heap of this smelter in Veles (containing 1.5 million tonnes of slag) and the soil around it are polluted and contribute to the high levels of Pb in the air in this part of the country.
High contents of these elements were also detected in the eastern parts of the country, more specifically in moss samples from the vicinity of mines with flotation plants, which is due to the emissions of flotation waste, such as from the Pb-Zn mines: “Zletovo” near Probištip, “Sasa” near Makedonska Kamenica, and “Toranica” near Kriva Palanka. In the period from 2001/2002 to 2006/2007, the mines were not active, but from 2006 (Sasa) and 2007 (Toranica and Zletovo) they were reactivated. The weathering processes of the rock on site cause an increasing content of these elements in the air and soil. The dispersion of corpuscular dust from the surface layer of flotation waste and soil by the wind in the atmosphere contributes to the observation of high levels of these metals in moss samples collected in these areas [34]. Wind also contributes to pollution from these elements along the Vardar River (Figure 9 and Figure 10). The main source of pollution in the Tetovo region is the “Silmak” ferrosilicon smelter.
The geochemical associations of the elements Ba and Sr (Factor 4) are shown in Figure 11 and Figure 12. These elements are naturally distributed, which is not related to anthropogenic activities. Figure 11 shows that these elements are most abundant in the central region, shifting to the southern part of the country and to the eastern region and Povardarie, which is dominated by volcanic rocks [53]. The highest contents of these elements were found in the Paleogene and Neogene basins, followed by the Western Macedonian Zone and the Serbo-Macedonian Massif. The highest contents of Ba and Sr in the Ng-Pg basins were 36 mg/kg and 34 mg/kg, respectively.
The association of the elements Cr, Mo, and Ni (factor 5) is a geogenic and anthropogenic association. High contents of these elements (Table 1 and Figure 13 and Figure 14) are found in the central region of the country, in the Paleogene and Neogene basins such as the Vardar zone, which are of geogenic origin and are due to pollution from the ferronickel smelter “FENI” in the region of Kavadarci, which processes ores enriched with these elements. The highest contents of Cr and Ni in the central region were 3.6 mg/kg and 3.2 mg/kg, and in the Paleogene and Neogene basins, the content of Cr was 3.8 mg/kg and of Ni 3.2 mg/kg. The Mo content in the central region and in the Paleogene and Neogene basins was 0.17 mg/kg.
The content of nickel and chromium fluctuated, with the lowest values determined in 2002 and the highest in 2005. The higher content of these elements is related to the geogenic distribution associated with the Paleogene and Neogene sediments. High values were found in the Tetovo and Kavadarci areas, which were associated with former ferrochrome and ferronickel smelters, respectively. Nickel values were much higher in 2005 than in 2002, which is related to the reactivation and increase in the production capacity of the ferronickel smelter in Kavadarci in 2004 [36]. Since 2005, the plant has increased its ore processing capacity as it also mines material from Albania, Turkey, and Indonesia. However, the grades of Ni and Cr in the mosses collected in the period 2010–2020 have slightly decreased, which can be associated with a renewed reduction in the smelter’s production capacity.
The spatial distribution of this compound of Cd, Sb, and Zn is shown in Figure 15 and Figure 16. The highest values for these elements were found in the central and eastern regions of the country and in the Paleogene and Neogene basins of the Serbo-Macedonian Massif. The highest values for Cd and Zn in the central region were 0.21 mg/kg and 25 mg/kg, respectively, and for Sb the highest value of 71 µg/kg was found in the Paleogene and Neogene basins. In the Skopje region, the highest values for these elements were found in the collected moss samples, which can be attributed to the urban and industrial activities. In the Veles region, the source of dust with these elements is the slag dump of the former Pb-Zn smelter [50]. High values of these elements were also found in the eastern parts of the country (Figure 15), especially in the vicinity of mines with flotation plants (Zletovo, Sasa, and Toranica). The weathering processes of the rock on site increase the content of these elements in the air and soil. The dispersion of corpuscular dust from the flotation waste and soil contributes to the detection of high levels of these elements in moss samples collected from these regions [34]. In addition, high levels of Zn were detected in moss samples collected in the Kavadarci town area, which can be attributed to air pollution from the ferronickel smelter.
In Jegunovce, Zn particles and ferrochrome dust were detected in the atmosphere and soil as a result of dust deposition near the smelter. The identified risk of respiratory diseases is related to air pollution.
Due to the lack of correlation with other elements, eight elements were not included in a factor association (Cu, K, Mg, Mn, Na, P, S, and Sc). The distribution maps for the content of these elements are shown in Figure 17.
Comparative median values for micro- and macroelements in moss samples are presented in Table 5, starting with the data from 2002 [30] and those from the surveys in 2005, 2010, and 2015 [30,31,32,33], up to the last survey in 2020. These results show that the median values of all elements determined in the 2020 survey were lower than in the other years, with the exception of Cu.
The data presented in Table 5 show that the content of almost all PTEs (As, Cd, Co, Cr, Cu, Ni, Pb, and Zn) was increased in the moss samples from 2002 and 2005, while the content decreased in the samples collected in 2010, 2015, and 2020. In 2010 and 2015, the Hg content in the analysed moss samples increased (Table 5), and later, in 2020, the median values of Hg in the moss samples decreased again. The median levels of Cd and Pb were elevated in 2002 and 2005, probably due to the reactivation of lead and zinc mining in the east of the country, with large amounts of flotation residues being deposited in landfills [50]. Similarly, the higher mean of Ni content in the 2005 samples (5.8 mg/kg) was due to the increase in the capacity of the smelter for ferronickel near the town of Kavadarci, while in 2010 and 2015, these values were identical (decrease), but in 2020, the values for Ni were slightly decreasing [33]. This is due to the fact that there were government regulatory measures to prevent and/or reduce emissions. From 2010 to 2015, there were no significant variations in the values of elements that occur at high levels due to anthropogenic activities. The reason for this is that all mining and metallurgical activities operated continuously and at the same capacity during the five-year period. Moreover, the value of Hg as a global pollutant was relatively stable during the whole period (2002–2020) of the moss studies in Macedonia.

4. Conclusions

Moss biomonitoring is a valuable technique for air pollution with PTEs, mainly because it provides a low-cost and effective alternative to deposition analysis for specific areas at risk from high atmospheric deposition fluxes of PTEs and can play an important role in identifying spatial and temporal trends in atmospheric heavy metal pollution. The results presented refer to the application of this technique for monitoring air pollution in Macedonia with PTEs in 2020. A total of 28 elements (Ag, Al, B, Ba, Ca, Cd, Co, Cr, Cu, Fe, Ga, Hg, K, La, Mg, Mn, Mo, Na, Ni, P, Pb, S, Sb, Sc, Sr, Ti, U, and Zn) were determined by ICP-MS. The factor analysis revealed two geogenic associations (F1 and F4), two anthropogenic associations (F3 and F6), and two geogenic-anthropogenic associations (F2 and F5). However, the largest anthropogenic effects of air pollution with PTEs were found in the vicinity of a ferronickel smelter near Kavadarci (Ni and Cr) and lead and zinc mines near Probištip, Makedonska Kamenica, and Kriva Palanka (Cd, Pb, and Zn).
The moss survey carried out in 2020 points to the fact that the level of air pollution with PTEs is similar to in 2015, with a slight decrease in the levels of certain PTEs. This is due to the fact that all mining and smelting activities in this five-year period (2015–2020) operated at the same capacity, and pollution with PTEs was reduced due to the implementation of government measures to prevent and/or reduce emissions.

Author Contributions

L.B.: collected samples, K.B.A.: prepared samples for analysis, writing—original draft, writing and editing, T.S.: methodology, writing, editing, and supervision, R.Š.: analysis, statistical data processing, and map preparation. All authors have read and agreed to the published version of the manuscript.

Funding

This study was partially supported by the Slovenian Research Agency under the Groundwater and Geochemistry research programme (P1-0020).

Institutional Review Board Statement

Not applicable.

Informed Consent Statement

Not applicable.

Data Availability Statement

The data presented in this study are available on request from the corresponding author. The data are not publicly available due to privacy.

Conflicts of Interest

The authors declare no conflict of interest.

Correction Statement

This article has been republished with a minor correction to the existing affiliation information. This change does not affect the scientific content of the article.

References

  1. Thompson, L.A.; Darwish, W.S. Environmental Chemical Contaminants in Food: Review of a Global Problem. J. Toxicol. 2019, 2019, 2345283. [Google Scholar] [CrossRef] [PubMed]
  2. Manisalidis, I.; Stavropoulou, E.; Stavropoulos, A.; Bezirtzoglou, E. Environmental and Health Impacts of Air Pollution: A Review. Front. Public Health 2020, 8, 14. [Google Scholar] [CrossRef] [PubMed]
  3. Osborne, S.; Uche, O.; Mitsakou, C.; Exley, K.; Dimitroulopoulou, S. Air Quality around Schools: Part I—A Comprehensive Literature Review across High-Income Countries. Environ. Res. 2021, 196, 110817. [Google Scholar] [CrossRef] [PubMed]
  4. Longchurst, J.; Brebbia, C. Air Pollution; WIT Press: Southampton, UK, 2013. [Google Scholar]
  5. Drava, G.; Ailuno, G.; Minganti, V. Trace Element Concentrations Measured in a Biomonitor (Tree Bark) for Assessing Mortality and Morbidity of Urban Population: A New Promising Approach for Exploiting the Potential of Public Health Data. Atmosphere 2020, 11, 783. [Google Scholar] [CrossRef]
  6. Giordano, S.; Spagnuolo, V.; Capozzi, F. Biomonitoring of Air Pollution. Atmosphere 2021, 12, 433. [Google Scholar] [CrossRef]
  7. Lequy, E.; Siemiatycki, J.; Leblond, S.; Meyer, C.; Zhivin, S.; Vienneau, D.; De Hoogh, K.; Goldberg, M.; Zins, M.; Jacquemin, B. Long-Term Exposure to Atmospheric Metals Assessed by Mosses and Mortality in France. Environ. Int. 2019, 129, 145–153. [Google Scholar] [CrossRef]
  8. Baczewska-Dąbrowska, A.H.; Gworek, B.; Dmuchowski, W. The Use of Mosses in Biomonitoring of Air Pollution in the Terrestrial Environment: A Review. Environ. Prot. Nat. Resour. 2023, 34, 19–30. [Google Scholar] [CrossRef]
  9. Market, B.; Oehlmann, J.; Roth, M. Biomonitoring of Heavy Metals: Definitions, Possibilities and Limitations. In Proceedings of the International Workshop on Biomonitoring of Atmospheric Pollution (with Emphasis on Trace Elements)—BioMAP, Lisbon, Portugal, 21–24 September 1997; p. 129. [Google Scholar]
  10. Giráldez, P.; Varela, Z.; Aboal, J.R.; Fernández, J.Á. Testing Different Methods of Estimating Edaphic Inputs in Moss Biomonitoring. Sci. Total Environ. 2021, 778, 146332. [Google Scholar] [CrossRef]
  11. Harmens, H.; Norris, D.A.; Steinnes, E.; Kubin, E.; Piispanen, J.; Alber, R.; Aleksiayenak, Y.; Blum, O.; Coşkun, M.; Dam, M.; et al. Mosses as Biomonitors of Atmospheric Heavy Metal Deposition: Spatial Patterns and Temporal Trends in Europe. Environ. Pollut. 2010, 158, 3144–3156. [Google Scholar] [CrossRef]
  12. Rajfur, M.; Stoica, A.-I.; Świsłowski, P.; Stach, W.; Ziegenbalg, F.; Mattausch, E.M. Assessment of Atmospheric Pollution by Selected Elements and PAHs during 12-Month Active Biomonitoring of Terrestrial Mosses. Atmosphere 2024, 15, 102. [Google Scholar] [CrossRef]
  13. Harmens, H.; Norris, D.A.; Sharps, K.; Mills, G.; Alber, R.; Aleksiayenak, Y.; Blum, O.; Cucu-Man, S.-M.; Dam, M.; De Temmerman, L.; et al. Heavy Metal and Nitrogen Concentrations in Mosses Are Declining across Europe Whilst Some “Hotspots” Remain in 2010. Environ. Pollut. 2015, 200, 93–104. [Google Scholar] [CrossRef] [PubMed]
  14. Fernández, J.A.; Aboal, J.R.; Couto, J.A.; Carballeira, A. Moss Bioconcentration of Trace Elements around a FeSi Smelter: Modelling and Cellular Distribution. Atmos. Environ. 2004, 38, 4319–4329. [Google Scholar] [CrossRef]
  15. Fernández, J.Á.; Aboal, J.R.; Real, C.; Carballeira, A. A New Moss Biomonitoring Method for Detecting Sources of Small Scale Pollution. Atmos. Environ. 2007, 41, 2098–2110. [Google Scholar] [CrossRef]
  16. Harrison, R.M.; Tilling, R.; Callén Romero, M.S.; Harrad, S.; Jarvis, K. A Study of Trace Metals and Polycyclic Aromatic Hydrocarbons in the Roadside Environment. Atmos. Environ. 2003, 37, 2391–2402. [Google Scholar] [CrossRef]
  17. Aboal, J.R.; Fernández, J.A.; Boquete, T.; Carballeira, A. Is It Possible to Estimate Atmospheric Deposition of Heavy Metals by Analysis of Terrestrial Mosses? Sci. Total Environ. 2010, 408, 6291–6297. [Google Scholar] [CrossRef]
  18. Boquete, M.T.; Fernández, J.A.; Carballeira, A.; Aboal, J.R. Relationship between Trace Metal Concentrations in the Terrestrial Moss Pseudoscleropodium Purum and in Bulk Deposition. Environ. Pollut. 2015, 201, 1–9. [Google Scholar] [CrossRef]
  19. Lee, C.S.L.; Li, X.; Zhang, G.; Peng, X.; Zhang, L. Biomonitoring of Trace Metals in the Atmosphere Using Moss (Hypnum Plumaeforme) in the Nanling Mountains and the Pearl River Delta, Southern China. Atmos. Environ. 2005, 39, 397–407. [Google Scholar] [CrossRef]
  20. Godzik, B. Use of Bioindication Methods in National, Regional and Local Monitoring in Poland—Changes in the Air Pollution Level over Several Decades. Atmosphere 2020, 11, 143. [Google Scholar] [CrossRef]
  21. Zhou, X.; Lu, L.; Wang, Y.; Fang, Y.; Sun, T. Spatial Distribution and Source Analysis of Airborne Trace Metal Deposition Using Moss Biomonitoring in Huai’an, China. Environ. Sci. Pollut. Res. 2022, 30, 34022–34036. [Google Scholar] [CrossRef] [PubMed]
  22. Macedo-Miranda, G.; Avila-Pérez, P.; Gil-Vargas, P.; Zarazúa, G.; Sánchez-Meza, J.C.; Zepeda-Gómez, C.; Tejeda, S. Accumulation of Heavy Metals in Mosses: A Biomonitoring Study. SpringerPlus 2016, 5, 715. [Google Scholar] [CrossRef] [PubMed]
  23. Esposito, S.; Loppi, S.; Monaci, F.; Paoli, L.; Vannini, A.; Sorbo, S.; Maresca, V.; Fusaro, L.; Asadi Karam, E.; Lentini, M.; et al. In-Field and in-Vitro Study of the Moss Leptodictyum Riparium as Bioindicator of Toxic Metal Pollution in the Aquatic Environment: Ultrastructural Damage, Oxidative Stress and HSP70 Induction. PLoS ONE 2018, 13, e0195717. [Google Scholar] [CrossRef]
  24. Augusto, S.; Máguas, C.; Branquinho, C. Guidelines for Biomonitoring Persistent Organic Pollutants (POPs), Using Lichens and Aquatic Mosses—A Review. Environ. Pollut. 2013, 180, 330–338. [Google Scholar] [CrossRef]
  25. Giráldez, P.; Crujeiras, R.M.; Fernández, J.Á.; Aboal, J.R. Establishment of Background Pollution Levels and Spatial Analysis of Moss Data on a Regional Scale. Sci. Total Environ. 2022, 839, 156182. [Google Scholar] [CrossRef]
  26. Frontasyeva, M.; Harmens, H.; Uzhinskiy, A.; Chaligava, O. Participants of the Moss Survey. Mosses as Biomonitors of Air Pollution: 2015/2016 Survey on Heavy Metals, Nitrogen and POPs in Europe and beyond; Joint Institute for Nuclear Research: Dubna, Russia, 2020; p. 136. [Google Scholar]
  27. Świsłowski, P.; Vergel, K.; Zinicovscaia, I.; Rajfur, M.; Wacławek, M. Mosses as a Biomonitor to Identify Elements Released into the Air as a Result of Car Workshop Activities. Ecol. Indic. 2022, 138, 108849. [Google Scholar] [CrossRef]
  28. Harmens, H.; Norris, D. Spatial and Temporal Trends in Heavy Metal Accumulation in Mosses in Europe (1990–2005); Programme Coordination Centre for the ICP Vegetation, Centre for Ecology and Hydrology: Wales, UK, 2008. [Google Scholar]
  29. Buse; Norris, D.; Harmens, H.; Buker, P.; Ashenden, T.; Mills, G. Heavy Metals in European Mosses: 2000/2001 Survey; UNECE ICP Vegetation Programme Coordination Centre, Centre for Ecology and Hydrology: Bangor, UK, 2003. [Google Scholar]
  30. Barandovski, L.; Cekova, M.; Frontasyeva, M.V.; Pavlov, S.S.; Stafilov, T.; Steinnes, E.; Urumov, V. Atmospheric Deposition of Trace Element Pollutants in Macedonia Studied by the Moss Biomonitoring Technique. Environ. Monit. Assess. 2008, 138, 107–118. [Google Scholar] [CrossRef]
  31. Barandovski, L.; Frontasyeva, M.V.; Stafilov, T.; Šajn, R.; Pavlov, S.; Enimiteva, V. Trends of Atmospheric Deposition of Trace Elements in Macedonia Studied by the Moss Biomonitoring Technique. J. Environ. Sci. Health Part A 2012, 47, 2000–2015. [Google Scholar] [CrossRef]
  32. Barandovski, L.; Frontasyeva, M.V.; Stafilov, T.; Šajn, R.; Ostrovnaya, T.M. Multi-Element Atmospheric Deposition in Macedonia Studied by the Moss Biomonitoring Technique. Environ. Sci. Pollut. Res. 2015, 22, 16077–16097. [Google Scholar] [CrossRef]
  33. Stafilov, T.; Šajn, R.; Barandovski, L.; Andonovska, K.B.; Malinovska, S. Moss Biomonitoring of Atmospheric Deposition Study of Minor and Trace Elements in Macedonia. Air Qual. Atmos. Health 2018, 11, 137–152. [Google Scholar] [CrossRef]
  34. Balabanova, B.; Stafilov, T.; Šajn, R.; Tănăselia, C. Multivariate Extraction of Dominant Geochemical Markers for Deposition of 69 Elements in the Bregalnica River Basin, Republic of Macedonia (Moss Biomonitoring). Environ. Sci. Pollut. Res. 2016, 23, 22852–22870. [Google Scholar] [CrossRef] [PubMed]
  35. Barandovski, L.; Stafilov, T.; Šajn, R.; Frontasyeva, M.; Bačeva Andonovska, K. Atmospheric Heavy Metal Deposition in North Macedonia from 2002 to 2010 Studied by Moss Biomonitoring Technique. Atmosphere 2020, 11, 929. [Google Scholar] [CrossRef]
  36. Bačeva, K.; Stafilov, T.; Šajn, R.; Tănăselia, C. Moss Biomonitoring of Air Pollution with Heavy Metals in the Vicinity of a Ferronickel Smelter Plant. J. Environ. Sci. Health Part A 2012, 47, 645–656. [Google Scholar] [CrossRef]
  37. Dimovska, B.; Šajn, R.; Stafilov, T.; Bačeva, K.; Tănăselia, C. Determination of Atmospheric Pollution around the Thermoelectric Power Plant Using a Moss Biomonitoring. Air Qual. Atmos. Health 2014, 7, 541–557. [Google Scholar] [CrossRef]
  38. Lazarevski, A. Climate in Macedonia; Kultura: Skopje, North Macedonia, 1993. (In Macedonian) [Google Scholar]
  39. Arsovski, M. Tectonics of Macedonia; Faculty of Mining and Geology: Štip, North Macedonia, 1997. (In Macedonian) [Google Scholar]
  40. Stafilov, T.; Sajn, R. Geochemical Atlas of the Republic of Macedonia; Faculty of Natural Sciences and Mathematics, Ss Cyril and Methodius University: Skopje, North Macedonia, 2016. [Google Scholar]
  41. Steinnes, E.; Rühling, Å.; Lippo, H.; Mäkinen, A. Reference Materials for Large-Scale Metal Deposition Surveys. Accredit. Qual. Assur. 1997, 2, 243–249. [Google Scholar] [CrossRef]
  42. Snedecor, G.; Cochran, W. Statistical Methods; The Iowa State University Press: Ames, IA, USA, 1967. [Google Scholar]
  43. Hollander, M.; Wolfe, D. Nonparametric Statistical Methods; Wiley: New York, NY, USA, 1982. [Google Scholar]
  44. Box, G.; Cox, D. An Analysis of Transformations. J. R. Stat. Soc. Ser. B 1962, 26, 211–252. [Google Scholar] [CrossRef]
  45. Shoji, T. Enrichment Ratio-Tonnage Diagrams for Resource Assessment. Nat. Resour. Res. 2002, 11, 273–287. [Google Scholar] [CrossRef]
  46. La Maitre, R. Numerical Petrology, Statistical Interpretation of Geochemical Data; Elsevier: Amsterdam, The Netherlands, 1982. [Google Scholar]
  47. Davis, J. Statistic and Data Analysis in Geology; Willey: New York, NY, USA, 1986. [Google Scholar]
  48. Reimann, C.; Filzmoser, P.; Garrett, R.G. Factor Analysis Applied to Regional Geochemical Data: Problems and Possibilities. Appl. Geochem. 2002, 17, 185–206. [Google Scholar] [CrossRef]
  49. Filzmoser, P.; Garrett, R.G.; Reimann, C. Multivariate Outlier Detection in Exploration Geochemistry. Comput. Geosci. 2005, 31, 579–587. [Google Scholar] [CrossRef]
  50. Stafilov, T.; Šajn, R.; Pančevski, Z.; Boev, B.; Frontasyeva, M.V.; Strelkova, L.P. Heavy Metal Contamination of Topsoils around a Lead and Zinc Smelter in the Republic of Macedonia. J. Hazard. Mater. 2010, 175, 896–914. [Google Scholar] [CrossRef] [PubMed]
  51. Stafilov, T.; Barandovski, L.; Šajn, R.; Bačeva Andonovska, K. Atmospheric Mercury Deposition in Macedonia from 2002 to 2015 Determined Using the Moss Biomonitoring Technique. Atmosphere 2020, 11, 1379. [Google Scholar] [CrossRef]
  52. Angelovska, S.; Stafilov, T.; Šajn, R.; Balabanova, B. Geogenic and Anthropogenic Moss Responsiveness to Element Distribution Around a Pb–Zn Mine, Toranica, Republic of Macedonia. Arch. Environ. Contam. Toxicol. 2016, 70, 487–505. [Google Scholar] [CrossRef] [PubMed]
  53. Bačeva Andonovska, K.; Šajn, R.; Tănăselia, C.; Stafilov, T. Moss as an Indicator of Rare Earth Elements across the Area of the Volcanogenic Deposit in the Allchar Locality, North Macedonia. Air Qual. Atmos. Health 2023, 16, 1381–1391. [Google Scholar] [CrossRef]
Figure 1. The study area and the pollution sources. (1. Ferrochromium smelter in Jegunovce; 2. Steel plant in Skopje; 3. Oslomej thermoelectrical power plant; 4. Pb-Zn smelter in Veles; 5. Bitola thermoelectrical power plant; 6. Ferronickel smelter near Kavadarci; 7. Raduša ferrochromium mine; 8. Lojane As-Sb mine; 9. Toranica Pb-Zn mine; 10. Sasa Pb-Zn mine; 11. Zletovo Pb-Zn mine; 12. Bučim copper mine; 13. Allchar As-Sb mine.) The blue lines show the river courses.
Atmosphere 15 00297 g001
Figure 2. Geological map of Macedonia: SMM—Serbo-Macedonian massif, VZ—Vardar zone, PM—Pelagonian massif, WMZ—West-Macedonian zone, CKZ—Cukali-Krasta Zone, and KZ—Kraishtide Zone [40].
Atmosphere 15 00297 g002
Figure 3. Sampling locations. The numbers indicate the numbering of the locations. The blue lines show the river courses.
Atmosphere 15 00297 g003
Figure 4. Cluster analysis dendrogram–element relationship.
Atmosphere 15 00297 g004
Figure 5. Spatial distribution of the factor scores of Factor 1 (Al, Co, Fe, Ga, La, Ti, and U) on the country level (a) and by regions and geological formations (b).
Atmosphere 15 00297 g005
Figure 6. Spatial distribution of the content of the elements from factor 1 (Al, Co, Fe, Ga, La, Ti, and U).
Atmosphere 15 00297 g006
Figure 7. Spatial distribution of the factor scores of Factor 2 (B, Ca, and Hg) on the country level (a) and by regions and geological formations (b).
Atmosphere 15 00297 g007
Figure 8. Spatial distribution of the content of the elements from factor 2 (B, Ca, and Hg).
Atmosphere 15 00297 g008
Figure 9. Spatial distribution of the factor scores of Factor 3 (Ag and Pb) on the country level (a) and by the regions and geological formations (b).
Atmosphere 15 00297 g009
Figure 10. Spatial distribution of the elements from Factor 3 (Ag and Pb).
Atmosphere 15 00297 g010
Figure 11. Spatial distribution of the factor scores of Factor 4 (Ba and Sr) on the country level (a) and by regions and geological formations (b).
Atmosphere 15 00297 g011
Figure 12. Spatial distribution of the content of the elements included in Factor 4 (Ba and Sr).
Atmosphere 15 00297 g012
Figure 13. Spatial distribution of the factor scores of Factor 5 (Cr, Mo, and Ni) on the country level (a) and by regions and geological formations (b).
Atmosphere 15 00297 g013
Figure 14. Spatial distribution of the content of the elements included in Factor 5 (Cr, Mo, and Ni).
Atmosphere 15 00297 g014
Figure 15. Spatial distribution of the factor scores of Factor 6 (Cd, Sb, and Zn) on the country level (a) and by regions and geological formations (b).
Atmosphere 15 00297 g015
Figure 16. Spatial distribution of the content of the elements included in Factor 6 (Cd, Sb, and Zn).
Atmosphere 15 00297 g016
Figure 17. Spatial distribution of the content of Cu, K, Mg, Mn, Na, P, S, and Sc.
Atmosphere 15 00297 g017
Table 1. Descriptive statistical analysis of the results.
UnitXMdXBCMinMaxP10P90P25P75SMADAEABCEBC
Agµg/kg1815147.01108.0241121175.04.2920.850.00−0.01
Almg/kg50050047020013003007004006001801001.555.430.010.95
Bmg/kg9.67.07.60.50363.0195.0137.44.01.562.460.000.05
Bamg/kg3328266.21201157164222131.643.56−0.00−0.54
Ca%0.750.720.730.381.30.551.00.640.850.190.100.750.700.000.18
Cdmg/kg0.180.150.150.0600.500.0900.300.11250.200.0980.0451.552.280.01−0.18
Comg/kg0.380.370.350.160.970.210.570.270.470.150.111.091.930.00−0.60
Crmg/kg3.63.53.52.65.82.94.43.23.90.660.401.201.480.05−0.36
Cumg/kg7.06.36.53.9134.4105.58.22.31.30.920.210.04−0.72
Femg/kg65062060026020004108905007802601302.299.65−0.011.20
Gamg/kg0.140.100.130.0500.400.0500.200.100.200.0730.0500.570.53−0.08−1.06
Hgµg/kg545252279636724365159.80.610.14−0.00−0.22
K%0.600.580.570.361.30.440.740.500.670.150.0801.998.13−0.020.36
Lamg/kg0.580.510.480.203.60.310.890.380.630.450.135.0431.96−0.071.03
Mg%0.180.180.180.100.320.140.230.150.200.0400.0240.922.09−0.000.47
Mnmg/kg1339110028400462605919093450.96−0.020.04−1.17
Momg/kg0.140.130.130.0400.350.070.230.0900.170.0660.0401.301.780.00−0.05
Namg/kg363029101602060204024102.479.390.00−0.11
Nimg/kg2.72.32.20.90121.43.71.72.92.00.652.838.08−0.040.61
P%0.170.160.170.0980.250.120.220.130.200.0400.0340.14−1.02−0.04−0.99
Pbmg/kg2.52.02.11.0101.44.01.613.21.40.572.8212.640.07−0.67
S%0.110.100.110.0250.190.0250.150.0850.130.0410.020−0.18−0.02−0.09−0.05
Sbµg/kg544040104101080306059104.5023.54−0.011.15
Scmg/kg0.410.400.400.300.700.300.500.400.500.0880.100.921.670.01−0.32
Srmg/kg2723228.013012441632188.13.3316.99−0.000.04
Timg/kg1515158.033112112184.43.01.453.73−0.010.23
Uµg/kg2320185.01101040103019102.769.67−0.000.25
Znmg/kg2321211313015291826143.56.8053.15−0.120.90
X—mean; Md—median; XBC—mean (Box–Cox transformed data); Min—minimum; Max—maximum; P10—10 percentile; P90—90 percentile; P25—25 percentile; P75—75 percentile; S—standard deviation; MAD—median absolute deviation; A—skewness; E—kurtosis; ABC—skewness (Box–Cox transformed data); EBC—kurtosis (Box–Cox transformed data).
Table 2. Comparative statistics by territorial regions and major tectonic units.
Territorial UnitsTectonic Units
ElementUnitW-MKC-MKE-MKNg-PgWMZPMVZSMM
N 3017251520131113
Agµg/kg1214171713121319
Almg/kg170460470490510450410470
Bmg/kg7.1106.78.26.88.4115.3
Bamg/kg2826253629241825
Ca%0.740.800.660.750.770.740.760.60
Cdmg/kg0.130.210.150.180.150.150.140.15
Comg/kg0.330.390.350.380.350.300.350.37
Crmg/kg3.43.63.53.83.33.33.53.6
Cumg/kg6.06.47.26.96.46.06.27.0
Femg/kg580640610650620560560620
Gamg/kg0.120.140.130.150.130.120.110.12
Hgµg/kg5058505452495649
K%0.580.550.580.540.590.550.570.61
Lamg/kg0.500.470.470.480.530.490.400.50
Mg%0.170.190.170.170.160.200.180.17
Mnmg/kg10073130921306669180
Momg/kg0.110.170.120.170.100.130.150.10
Namg/kg4220242144282824
Nimg/kg1.93.22.03.21.91.82.52.0
P%0.170.160.160.160.180.160.160.17
Pbmg/kg2.53.64.24.22.62.63.04.4
S%0.110.100.100.110.110.100.110.10
Sbµg/kg2758497128314243
Scmg/kg0.380.430.400.400.400.400.380.41
Srmg/kg2025253421181923
Timg/kg1514151515151415
Uµg/kg1817191916221420
Znmg/kg1825222518222122
N—number of samples; W-MK—west regions; C-MK—central regions; E-MK—east regions; Pg-Ng—Paleogene-and Neogene basins; WMZ—West-Macedonian Zone; PM—Pelagonian Massif; VZ—Vardar Zone; SMM—Serbo-Macedonian Massif.
Table 3. Pearson correlation coefficient between element contents in mosses (n = 72). Values in the range of 0.5 to 0.7 (good association) are underlined, and the values in the range of 0.7 to 1.0 (strong association) are bolded; Box–Cox transformed values used.
Ag1.00
Al0.061.00
B−0.380.051.00
Ba0.180.01−0.291.00
Ca−0.320.260.77−0.201.00
Cd0.340.08−0.070.090.071.00
Co0.160.74−0.070.010.060.191.00
Cr0.170.410.10−0.120.130.140.551.00
Cu0.430.14−0.050.200.050.280.120.281.00
Fe0.040.920.140.080.330.150.810.460.161.00
Ga0.030.820.080.010.310.170.680.420.210.841.00
Hg0.230.290.43−0.110.550.280.250.260.190.320.211.00
K−0.01−0.490.19−0.010.030.14−0.47−0.21−0.01−0.46−0.35−0.001.00
La0.070.760.020.320.220.070.640.220.150.800.610.21−0.481.00
Mg−0.32−0.090.460.070.22−0.20−0.180.02−0.07−0.01−0.050.070.060.031.00
Mn0.31−0.04−0.480.42−0.49−0.000.03−0.180.06−0.08−0.13−0.120.000.08−0.221.00
Mo−0.100.170.310.140.360.190.200.290.190.340.280.09−0.180.270.22−0.491.00
Na−0.01−0.24−0.420.00−0.34−0.19−0.16−0.19−0.15−0.31−0.25−0.320.10−0.19−0.190.11−0.231.00
Ni0.190.380.010.120.080.200.670.550.240.510.350.23−0.470.39−0.080.060.59−0.261.00
P0.09−0.320.210.190.080.10−0.32−0.110.09−0.26−0.220.200.72−0.200.220.19−0.23−0.07−0.261.00
Pb0.600.40−0.190.14−0.050.440.410.420.470.450.420.32−0.190.34−0.210.180.23−0.340.40−0.101.00
S−0.11−0.210.14−0.010.11−0.03−0.190.200.19−0.18−0.180.290.37−0.210.23−0.150.050.01−0.090.33−0.031.00
Sb0.360.490.07−0.120.130.350.380.510.410.490.480.30−0.270.30−0.18−0.120.31−0.360.48−0.240.70−0.071.00
Sc0.190.35−0.180.12−0.120.160.380.180.080.330.38−0.01−0.050.29−0.04−0.010.12−0.040.23−0.120.19−0.030.101.00
Sr0.110.01−0.040.63−0.01−0.140.090.050.200.100.05−0.13−0.090.290.140.270.30−0.130.270.060.130.01−0.000.171.00
Ti0.040.760.010.190.130.100.700.430.200.780.690.21−0.380.670.040.000.15−0.130.35−0.150.38−0.060.300.370.151.00
U0.070.75−0.080.250.100.070.670.340.140.790.660.13−0.510.780.02−0.010.38−0.200.42−0.340.45−0.140.410.280.220.731.00
Zn0.37−0.06−0.060.19−0.000.580.040.160.460.070.150.220.22−0.040.03−0.090.39−0.200.250.140.490.270.550.170.150.070.151.00
AgAlBBaCaCdCoCrCuFeGaHgKLaMgMnMoNaNiPPbSSbScSrTiUZn
Table 4. Matrix rotating load of the dominant factors.
F1F2F3F4F5F6Comm
Al0.920.220.15−0.090.05−0.0392.0
Fe0.900.220.11−0.040.200.1493.7
La0.87−0.090.030.17−0.030.0580.0
Ti0.81−0.040.080.210.030.0371.7
U0.80−0.14−0.010.210.150.1776.3
Ga0.800.340.090.000.080.1579.4
Co0.72−0.050.04−0.180.530.0584.4
B−0.100.91−0.080.000.140.0286.5
Ca0.190.88−0.21−0.09−0.000.0886.1
Hg0.220.690.42−0.150.110.2278.0
Ag−0.02−0.100.870.01−0.00−0.0277.1
Pb0.24−0.060.760.150.130.2775.6
Sr0.050.040.080.890.17−0.1284.2
Ba0.22−0.230.030.81−0.090.1478.6
Ni0.01−0.02−0.070.070.890.1582.4
Cr0.250.110.37−0.020.80−0.0985.7
Mo0.110.29−0.140.380.650.3983.2
Zn0.010.090.200.260.260.7778.4
Cd0.310.140.08−0.290.030.7678.6
Sb0.250.210.22−0.030.490.6575.7
Prp. Totl26.5912.7810.039.8112.988.1980.4
Expl. Var5.322.562.011.962.601.64
Eigen Val6.692.752.371.761.411.10
F1, F2, F3, F4, F5, and F6—factor loadings of Factors 1, 2, 3, 4, 5, and 6; Comm—communality (%); Prp. Totl—total amount of the explained system variance; Expl. Var—particular component variance; Eigen Val—Eigen value. Bold values signify the factor values for the chemical elements belonging to the corresponding factor.
Table 5. Comparison of average and median contents of analysed elements from each moss biomonitoring survey (2002, 2005, 2010, 2015, and 2020). The values are given in mg/kg.
AverageMedian
Year2002200520102015202020022005201020152020
Ag----0.018----0.015
Al5100490028002300200038003600240020001800
B65616260605453505055
Ca6300920084006600860056008500830066008200
Cd0.290.420.290.250.180.160.290.220.210.15
Co1.81.50.920.890.841.11.10.830.780.76
Cr14118.57.15.77.96.86.55.74.8
Cu287.44.04.77.0246.73.54.66.3
Fe3400280021001700150024002200190016001400
Ga----0.14----0.10
Hg0.0680.0800.110.0850.0540.0560.0680.0930.0840.052
K8700770066007000910084007500660069008800
La3.72.91.81.61.62.32.31.41.31.3
Mg2800150025002200260024001300240021002500
Mn260220180170160190190140130110
Mo0.230.210.160.390.240.190.160.150.270.23
Na790500250260330440360190220280
Ni3.89.16.87.75.42.55.84.34.44.2
P--1100-1700--1100-1600
Pb7.59.75.45.33.86.07.64.64.83.1
S----1000----1000
Sb0.260.180.100.130.150.200.150.0890.110.11
Sc1.20.980.550.520.530.740.670.440.450.48
Sr38373942413234343238
Ti260300180150120160220150130110
U0.310.260.150.130.130.210.210.110.110.11
Zn46413233343936293232
Disclaimer/Publisher’s Note: The statements, opinions and data contained in all publications are solely those of the individual author(s) and contributor(s) and not of MDPI and/or the editor(s). MDPI and/or the editor(s) disclaim responsibility for any injury to people or property resulting from any ideas, methods, instructions or products referred to in the content.

