1. Introduction
Rapid economic growth and urbanization have reduced the air quality in China [
1]. According to the World Health Organization, the majority of the world’s population is breathing air that exceeds the WHO’s air quality standards; thus, human health is threatened [
2].
Xinjiang is the largest high-quality cotton production province in China. Cotton production has increased rapidly in the past decade. In 2022, Xinjiang’s cotton planting area and production were, respectively, 3745.35 million mus and 5.391 million tons and accounted for 83.22% and 90.19% of the total cotton planting area and total output in China [
3,
4]. However, excessive usage of pesticides and crop straw burning are prominent problems in cotton cultivation. In autumn and winter, the low temperature, slow wind, stable layer, and crop straw burning cause the concentration of particulate matter to exceed the standard in a specific period, causing harm to human health and the ecological environment [
5,
6]. In the face of serious air pollution, the Chinese government promulgated the Action Plan on Air Pollution Prevention and Control in 2013, which specified the emission reduction target of PM
2.5 in key areas of the country by 2017 [
7]. From 2013 to 2017, local governments took effective control measures, and the action plan was considered to be the strictest air pollution plan. Therefore, China’s anthropogenic air pollutant emissions decreased significantly from 2013 to 2017 [
8]. In 2019, the annual average PM
2.5 concentration in Xinjiang was 50% lower than that in 2013 and exceeded the 2019 PM
2.5 emission reduction target [
9]. However, even with substantial improvement, the annual average PM
2.5 concentration in Xinjiang in 2019 was still 53 μg/m
3, which is 1.51 times the secondary standard of 35 μg/m
3 [
10]. In addition, China’s Ministry of Ecology and Environment (MEE) announced that by 2030, the annual average PM
2.5 in all the cities nationwide should reach the national environmental air quality standard of 35 μg/m
3. The Xinjiang regional government needs to make more efforts to complete the task of air pollution control. Therefore, it is of great significance to fulfill the mitigation approaches for future air quality to achieve the future improvement target of PM
2.5 in the Xinjiang region and to formulate the policy according to the Air Pollution Prevention and Control Action Plan.
Many countries around the world have conducted forecast studies using different future scenarios [
11]. For example, Song Liu et al. [
12] simulated the dependence of a climate change penalty on emission scenario selection by using multiple independent models, and they studied the response of PM
2.5 to China’s future climate warming in 2050. Siyi Cai et al. [
13] developed four future scenarios for 2030 based on the 2013 emission inventory; they predicted the impact of air pollutant control policies on China’s future PM
2.5 concentration and its contributing sources. Zhang Xin [
14] predicted changes in atmospheric pollutant O
3 and PM
2.5 emissions in 2025. The results show that PM
2.5 will decrease significantly by 2025, with the highest value in January and the lowest value in July. The main sources of contributions are civil and industrial sources. Du et al. [
15] explore pathways for energy conservation and emission mitigation in road transport from a regional perspective, taking the Jing-Jin-Ji region as a case study. They explore the mitigation potentials in six scenarios from 2014 to 2030. Chang S et al. [
16] developed three scenario strategies for the PRD in 2035 to achieve the WHO’s interim target of annual average PM
2.5 in the PRD. Campbell et al. [
17] emphasize the importance of decreased anthropogenic emissions in the control of future nitrogen loading in the Chesapeake Bay in a changing climate. Stowell, JD et al. [
18] evaluated the separate impacts of climate change and emission control policies on O
3 in the US in 2050.
Many studies have focused on measures to reduce PM
2.5 emissions. The CMAQ modeling system was used to simulate air pollutants, identify sources of air pollution, and quantify the contributions of emission reductions and meteorology [
19,
20]. For example, Wang et al. [
21] calculated the contributions of local and nonlocal emission control measures using the WRF model and CMAQ model. Ren et al. [
22] analyzed the characteristics of PM
2.5 during the 2015 Grand Military Parade and revealed a 40% reduction in the lung cancer risk due to the implementation of emission control measures. Wang et al. [
23] isolate meteorological factors to achieve reliable estimates of surface PM
2.5 responses to both long-term and emergency emission control measures from 2016 to 2019 over the Yangtze River Delta; the results show that long-term emission control strategies play a crucial role in curbing PM
2.5 levels, especially in the megacities and other areas with abundant anthropogenic emissions. In the study by Li, B et al. [
24], the results show that residential emission cuts were the key measures for future air quality improvement in cold winters. Hei W et al. [
25] select 13 industrial parks in 7 cities in Henan Province to evaluate their emissions of air pollutants and CO
2 in 2017; they consider the potential of different measures to reduce emissions.
In this study, we predicted and evaluated the pathways for future air quality improvement in Xinjiang’s main cotton region by 2025. Firstly, the emission reduction of major air pollutants is carried out by developing three future emission scenarios. Secondly, the future air quality in Xinjiang’s main cotton region in different scenarios was estimated by using the Weather Research and Forecast (WRF) model and the Community Multiscale Air Quality (CMAQ) model. Finally, the impact of emission control strategies on future PM2.5 concentrations is fully discussed to provide a reference for policy making.
2. Materials and Methods
2.1. Data Source
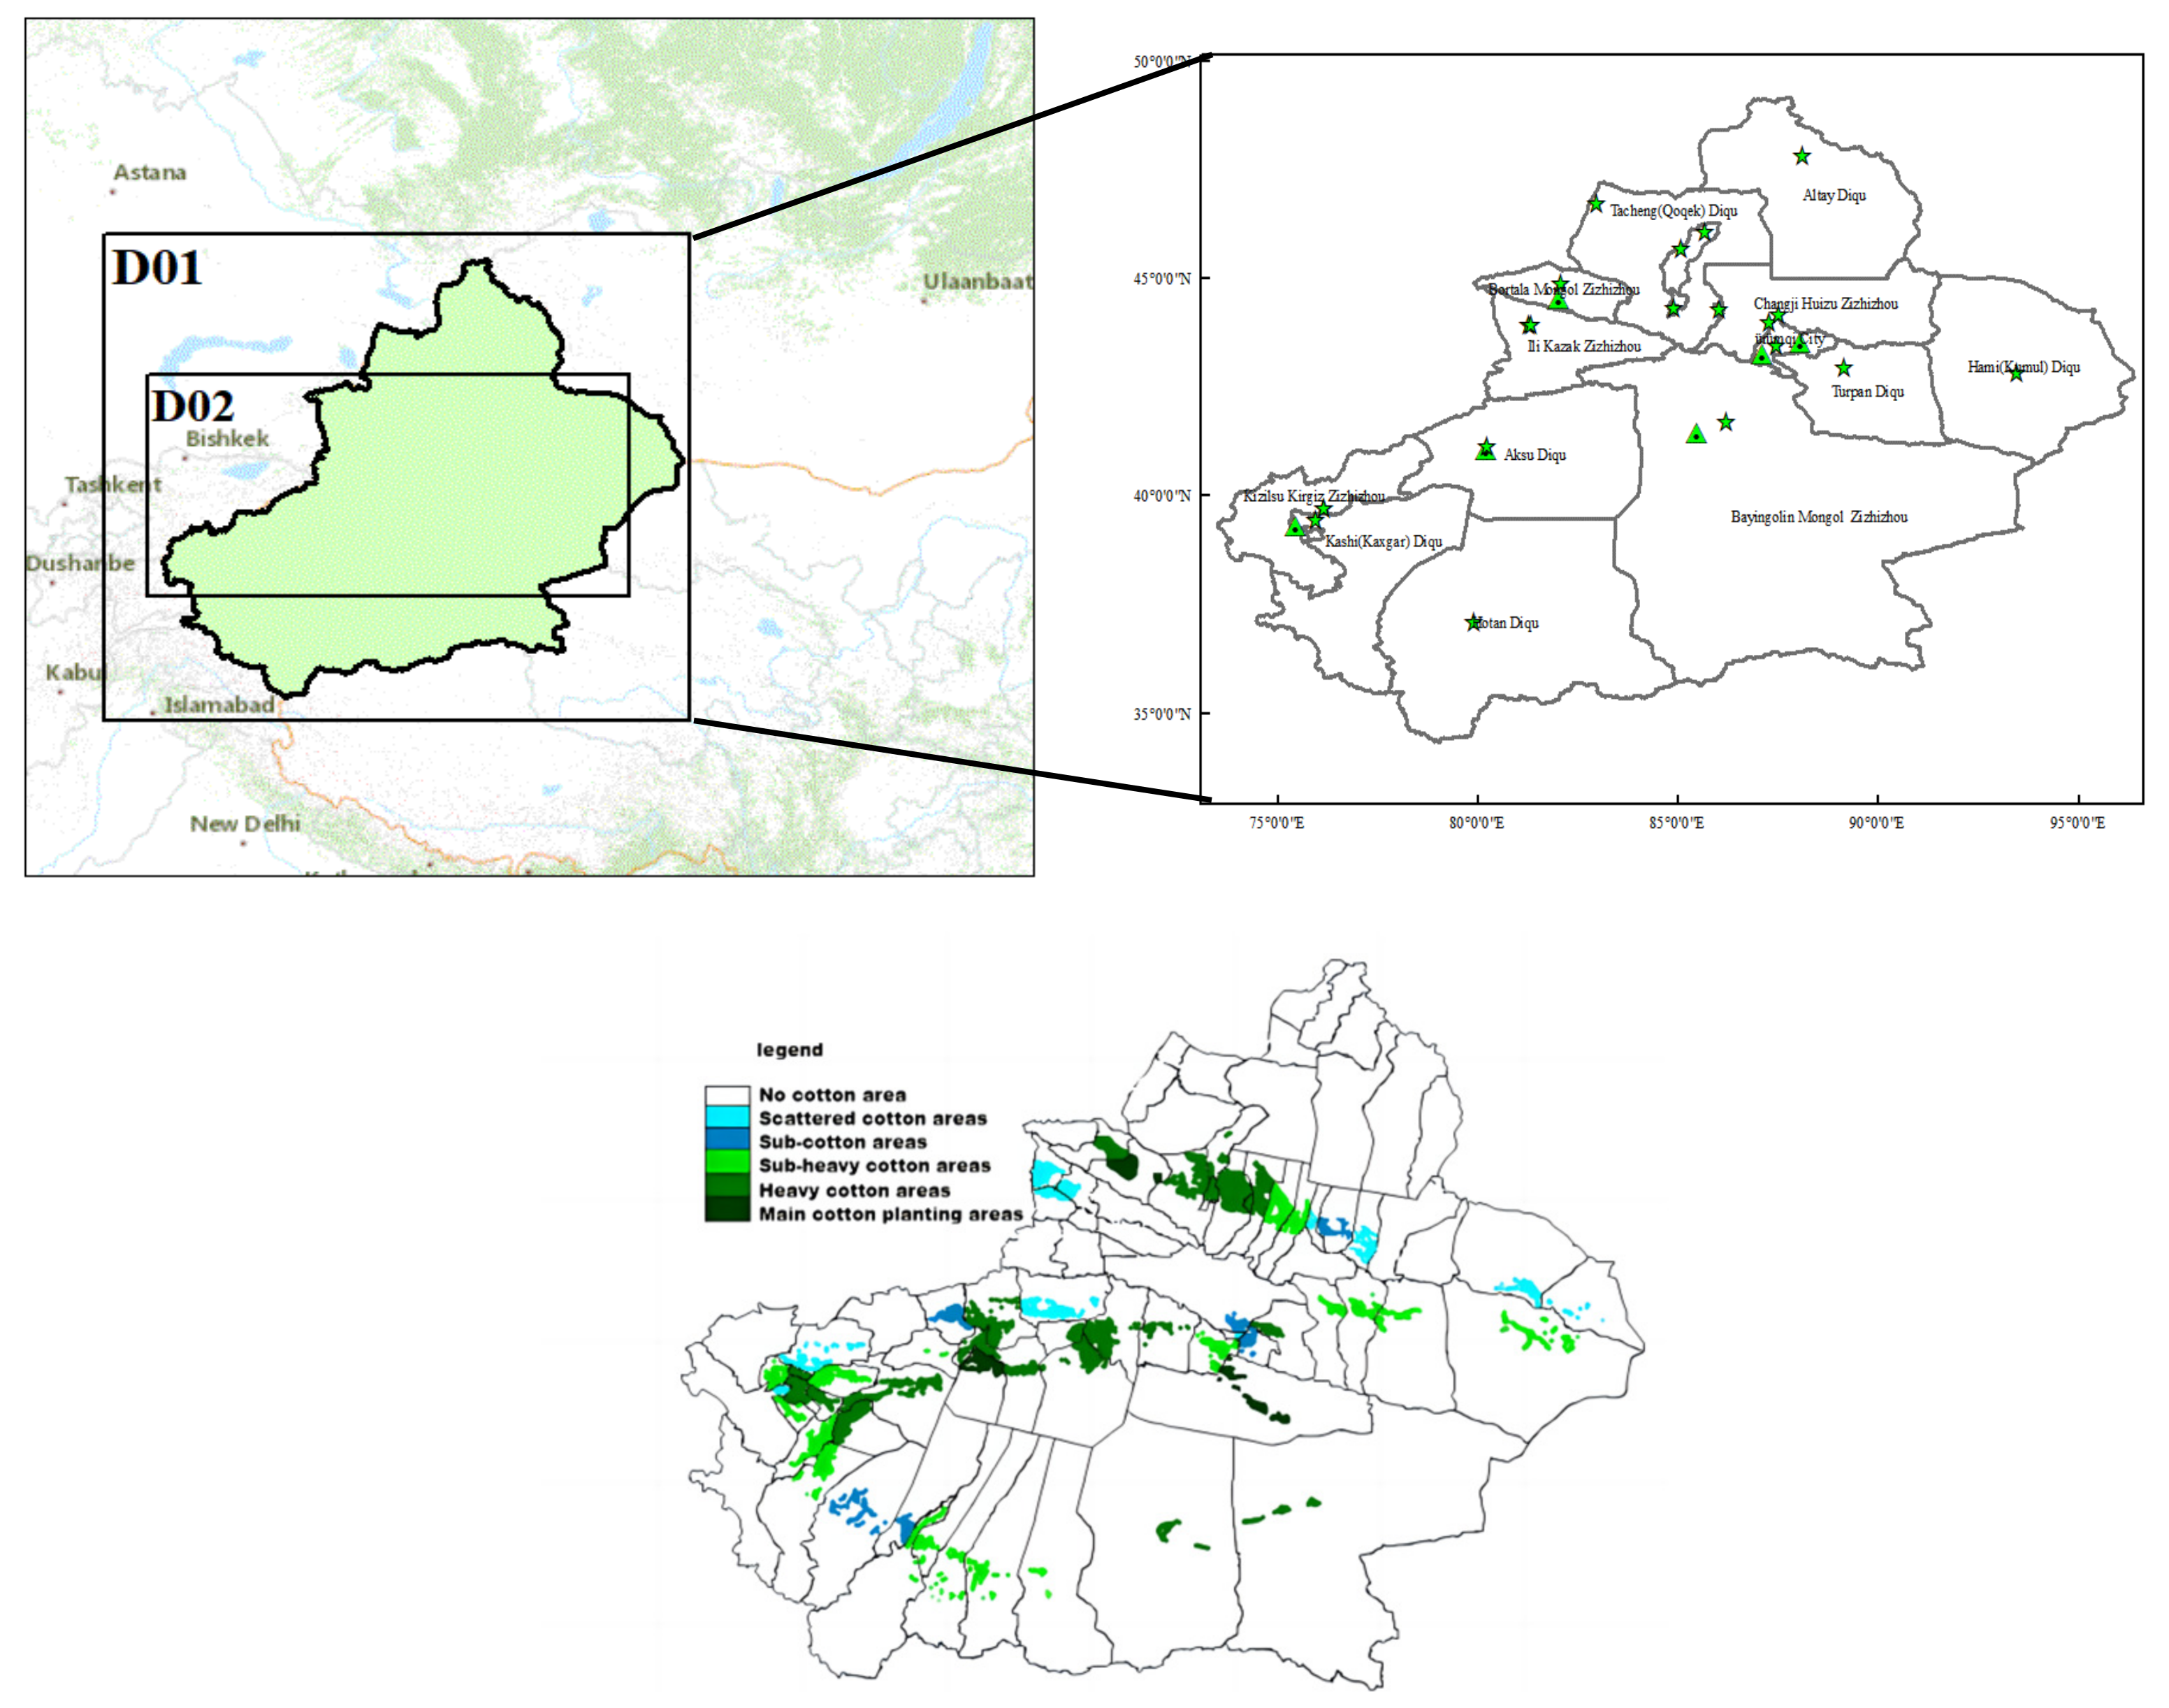
The meteorological data used in this study were sourced from the China Meteorological Data Service Center. The primary characteristics considered were temperature, relative humidity, wind speed, and wind direction. All the data were collected on the specified dates. The acquired data align with the national norms. The simulation results were compared with the observation results by correlation analysis to verify the accuracy of WRF. In this study,12 meteorological stations (triangles in
Figure 1) with comprehensive and representative data in southern and northern Xinjiang were selected (
Figure 1); these were distributed in Altay, Urumqi, Hami, Aksu, Hetian, Korla, Kashi, Tianchi, Turpan, Bayinbuluke, Bole, and Moyu. World Standard Time (UTC) was used for the time of the data.
The monitoring data are from the China National Environmental Monitoring Network. China’s National Environmental Monitoring Center regularly monitors the concentrations of major pollutants in the atmosphere every day, including PM
2.5, PM
10, CO, SO
2, NO
2, O
3, and the air quality index (AQI). Environmental monitoring station are represented by a five-pointed star in
Figure 1. Six main pollutants were selected from ground monitoring stations, and the concentration changes of the pollutants in Xinjiang were analyzed and compared with the model output results to verify the accuracy of the CMAQ simulation results. Because some stations in the monitoring data had missing pollutant concentrations, the pollutant concentrations at the hour before and after the average missing value were used to represent the pollutant concentrations at that hour. In this study, 17 pollutant concentration monitoring stations in Xinjiang were selected; these were distributed in Aksu, Hetian, Korla, and Kizilsu Kirgiz Autonomous Prefecture in southern Xinjiang and Altay, Urumqi, and Hami in northern Xinjiang.
2.2. Method
In this study, the Joint Weather Research and Forecast Model (WRF) 4.3.3 and Community Multiscale Air Quality Simulation System (CMAQ) 5.3.2 were used.
Figure 1 shows the study area and two domain areas. The primary cotton cultivation locations in Xinjiang include Changji City, Manas Prefecture, Hutubi Prefecture, Wusu City, Shawan Prefecture, and Hefeng Prefecture in Tacheng Prefecture. Additionally, Jinghe County and Bole City in Bozhou Prefecture, Tokxun Prefecture in Turpan Prefecture, and Hami City in Hami Prefecture are notable cotton producing zones. The specific regions are indicated in the accompanying
Figure 1 [
26]. Because Xinjiang is located in the border area, D01 covers part of the Xinjiang Autonomous Region, Kazakhstan, Mongolia, Russia, and Nepal, with a grid resolution of 24 km × 24 km. D02 covers the main cotton planting area in Xinjiang, with a grid resolution of 8 km × 8 km. The locations of meteorological monitoring stations and environmental monitoring stations in this study have been marked in
Figure 1.
CMAQ simulates different physicochemical processes of air pollutants and particulate matter (PM) composition driven by the meteorological field provided by WRF. The meteorological data used by WRF–CMAQ are from the reanalysis dataset (NCEP-FNL). The Meteorology–Chemistry Interface Processor (MCIP) was used to simulate the Weather Research and Forecasting (WRF) model outputs, such as temperature, water vapor, cloud cover, precipitation, and the diffusion coefficient. These outputs were then used as the input data for the Community Multiscale Air Quality Modeling System (CMAQ) air quality model. In the WRF simulation, the vertical grid structure consists of 32 layers, and the center latitude and longitude are 84.51° E and 40.20° N, respectively. In Xinjiang, cotton is planted and harvested in April-May and October, respectively. Straw burning occurs before and after the cotton harvest and planting and affects the air quality. Therefore, this study takes March and November as the typical months [
27]. The CMAQ model is equipped with the AER06 aerosol module and CB05 gas chemistry mechanism. To mitigate the impact of the initial conditions, the model is run five days in advance.
2.3. Emission Inventory
In this study, 2019 was used as the base year. The MEIC China Multi-Resolution emission inventory 0.25° × 0.25°, created by Tsinghua University, was utilized for the emission inventory (
http://meicmodel.org/) (accessed on 31 January 2024). It provides emission data from five separate departments: power, industrial, residential, transportation, and agricultural. The pollutants include SO
2, NO
2, PM
2.5, PM
10, VOC, CO, and NH
3 [
28,
29].
The compilation of the emission inventory in 2025 and the future emission scenarios is based on the 13th and 14th Five-Year Plan, and statistical yearbook data of Xinjiang. The growth rate of the list allocation basis is calculated, and the emissions of each industry in 2025 are calculated [
30,
31,
32,
33]. Based on the MEIC emission inventory, Megan, and biomass combustion sources are supplemented.
For the power sector, in the base scenario (BAS) for 2025, the area of coal-fired heating is expected to continue to increase, and it is expected that the area of heating in the power sector will be growing by about 1.51% annually by 2025. In the enhanced emission reduction scenario (EER), it is assumed that the plantation area will reduce the proportion of coal-fired power generation in its total power generation and switch from coal to clean energy (such as natural gas and other renewable energy), and the emissions from the power sector will be reduced by 10% [
34,
35]. In the strengthened emission reduction scenario (SER), it is assumed that the policy of “coal to electricity” is strictly implemented, that heating by electricity instead of by burning coal will increase, and that the emissions from the power sector will be reduced by 20%. In the best alternative scenario (BAT), there will be no more coal-fired power plants in operation in the plantation area, and the emissions from the power sector will be reduced by 30%.
For the industrial sector, in the BAS scenario of 2025, the added value of the secondary industry is expected to continue to increase, and it is expected that the average annual growth rate of the industrial added value will be about 1.45% by 2025. In the EER scenario, the capacity of high-polluting industries is controlled, the outdated capacity is gradually eliminated, and the industrial emissions will be reduced by 15%. In the SER scenario, the planting area slows down the development of new large heavy industries (such as steel plants) and further reduces the output of steel, cement, pig iron, coke and raw coal, and other industries, and the industrial emissions will be reduced by 35%. In the BAT scenario, through the adjustment of the industrial structure, the planting area will not develop heavy industry except for the basic environmental protection industry, and the industrial emissions will be reduced by 45%.
For the residential sector, in the 2025 base scenario (BAS), the population is expected to grow, and it is expected that by 2025, the population will be growing by 1.1% annually. The coal consumption of residential sources will also increase as it is driven by the growing population and building area. The adjustment of the energy consumption structure is conducive to the reduction in the emissions of residential sources. In the EER scenario, the reduction in non-peak household electricity prices to reduce the cost of electric heating will reduce the emissions of residential sources by 10%. In the SER scenario, under the emission reduction conditions of the EER scenario, the construction of new gas heating systems in suburban and rural areas will promote the conversion of fuels and reduce pollutant emissions, reducing the emissions of residential sources by 20%. In the BAT scenario, the energy consumption structure will be optimized, and the proportion of hydrogen energy consumption will reach more than 60%, reducing the emissions of residential sources by 30%.
For the biomass combustion sector, in the BAS scenario in 2025, crop yield will continue to grow, and it is expected that the annual growth rate of the crop yield in 2025 will be 1.13%. In the EER scenario, a 15% emission reduction can be achieved by the policy of banning straw burning; in the SER scenario, a 25% emission reduction can be achieved by improving the comprehensive recycling rate of straw and using straw as an emerging alternative fuel. In the BAT scenario, assuming that the province implements the policy of banning straw burning and that the government issues policies to vigorously support the agricultural processing industry with straw as the main raw material and realizes the recycling and reprocessing of all straw, a 70% emission reduction can be achieved by using a biomass combustion source.
2.4. Compilation of Biomass Burning Emission Inventory
The MEIC emission inventory lacks information on the biomass burning emission inventory. Nevertheless, biomass fire events take place in March and November within Xinjiang’s key cotton region. Consequently, we have added the biomass burning emission inventory to remedy this gap. The Guidelines for Compilation of Air Pollutant Emission Inventory from Biomass Combustion were used to calculate the pollutant emissions (PM
2.5, PM
10, CO, SO
2, NO
2, O
3) in the Xinjiang Autonomous Region in 2019 (the base year) [
36].
Equation (1) is used to calculate the emission of a certain air pollutant (
Ei) generated by biomass combustion.
where
A is the emission source activity level (t);
EF is the emission coefficient (g/kg);
i is a certain kind of air pollutant;
j is the region, such as the province, city, or county;
K is the type of biomass combustion (biomass boiler, household biomass stove, forest fire, grassland fire, or straw open burning), and
m is the type of fuel, such as vegetation belt, grassland, or straw. The specific parameters are shown in
Table 1.
The amount of biomass burning of straw by open-air incineration is calculated by Equation (2).
where
P is crop yield (t), which is from the statistics of the agricultural sector;
N is the grass-to-grain ratio, for which the specific parameters are shown in
Table 2;
R is the proportion of straw open burning;
η is the combustion rate, which is 0.9.
The amount of biomass burning by forest fire and grassland fire is calculated by Equation (3).
AR is the fire-affected area (hm
2), which is from the statistics of the forestry sector and distributed according to the vegetation climate zone;
D is the forest dry biomass (t/hm
2);
η is the combustion rate, which is 0.9.
3. Results and Discussion
3.1. Analysis of Annual and Monthly Variation Characteristics of Pollutants in Xinjiang
Figure 2 shows the annual average changes in PM
2.5, PM
10, SO
2, NO
2, O
3, and CO pollutants in Xinjiang from 2017 to 2022. The concentrations of SO
2 and CO in Xinjiang showed a downward trend, while the changes in particulate matter, NO
2, and O
3 tended to be stable. The average concentration of O
3 was 58 μg/m
3. The average concentration of NO
2 was 22 μg/m
3. There was a difference in concentration between the north and the south in Xinjiang, and the average concentration of pollutants in southern Xinjiang was generally higher than that in northern Xinjiang. This is because the low-altitude Gobi Desert area in southern Xinjiang, such as Korla, Aksu, Kashi, and Hetian, and the eastern area are surrounded by the Qinghai-Tibet Plateau, the Pamir Plateau, and the Tianshan Mountains; pollutants linger in the basin for a long time and are not easy to diffuse [
37].
The changes in the monthly average concentrations of six pollutants in Xinjiang from 2017 to 2022 are shown in
Figure 2. On the whole, the O
3 concentration in summer is higher than that in winter, showing an “inverted U” curve, which is consistent with the trend of other cities [
38]. The ozone concentration in southern Xinjiang is higher than that in northern Xinjiang because the summer temperature in southern Xinjiang is higher than that in northern Xinjiang, the relative humidity is lower, and the precipitation is less; these meteorological conditions are conducive to the generation of O
3. When local farmers plant cotton, the application of basal fertilizer on the cultivated land leads to a small increase in NO
2 and SO
2 concentrations from May to June. During the growth of cotton, certain amounts of pesticides, defoliants, and other pesticides are applied until September and October. This process leads to a considerable part of the nitrogen fertilizer entering the atmosphere in the form of nitrification–denitrification and ammonia volatilization [
39]. From July to September, the concentrations of NO
2 and SO
2 also increase.
3.2. Temporal and Spatial Distribution Characteristics of Pollutant Concentration
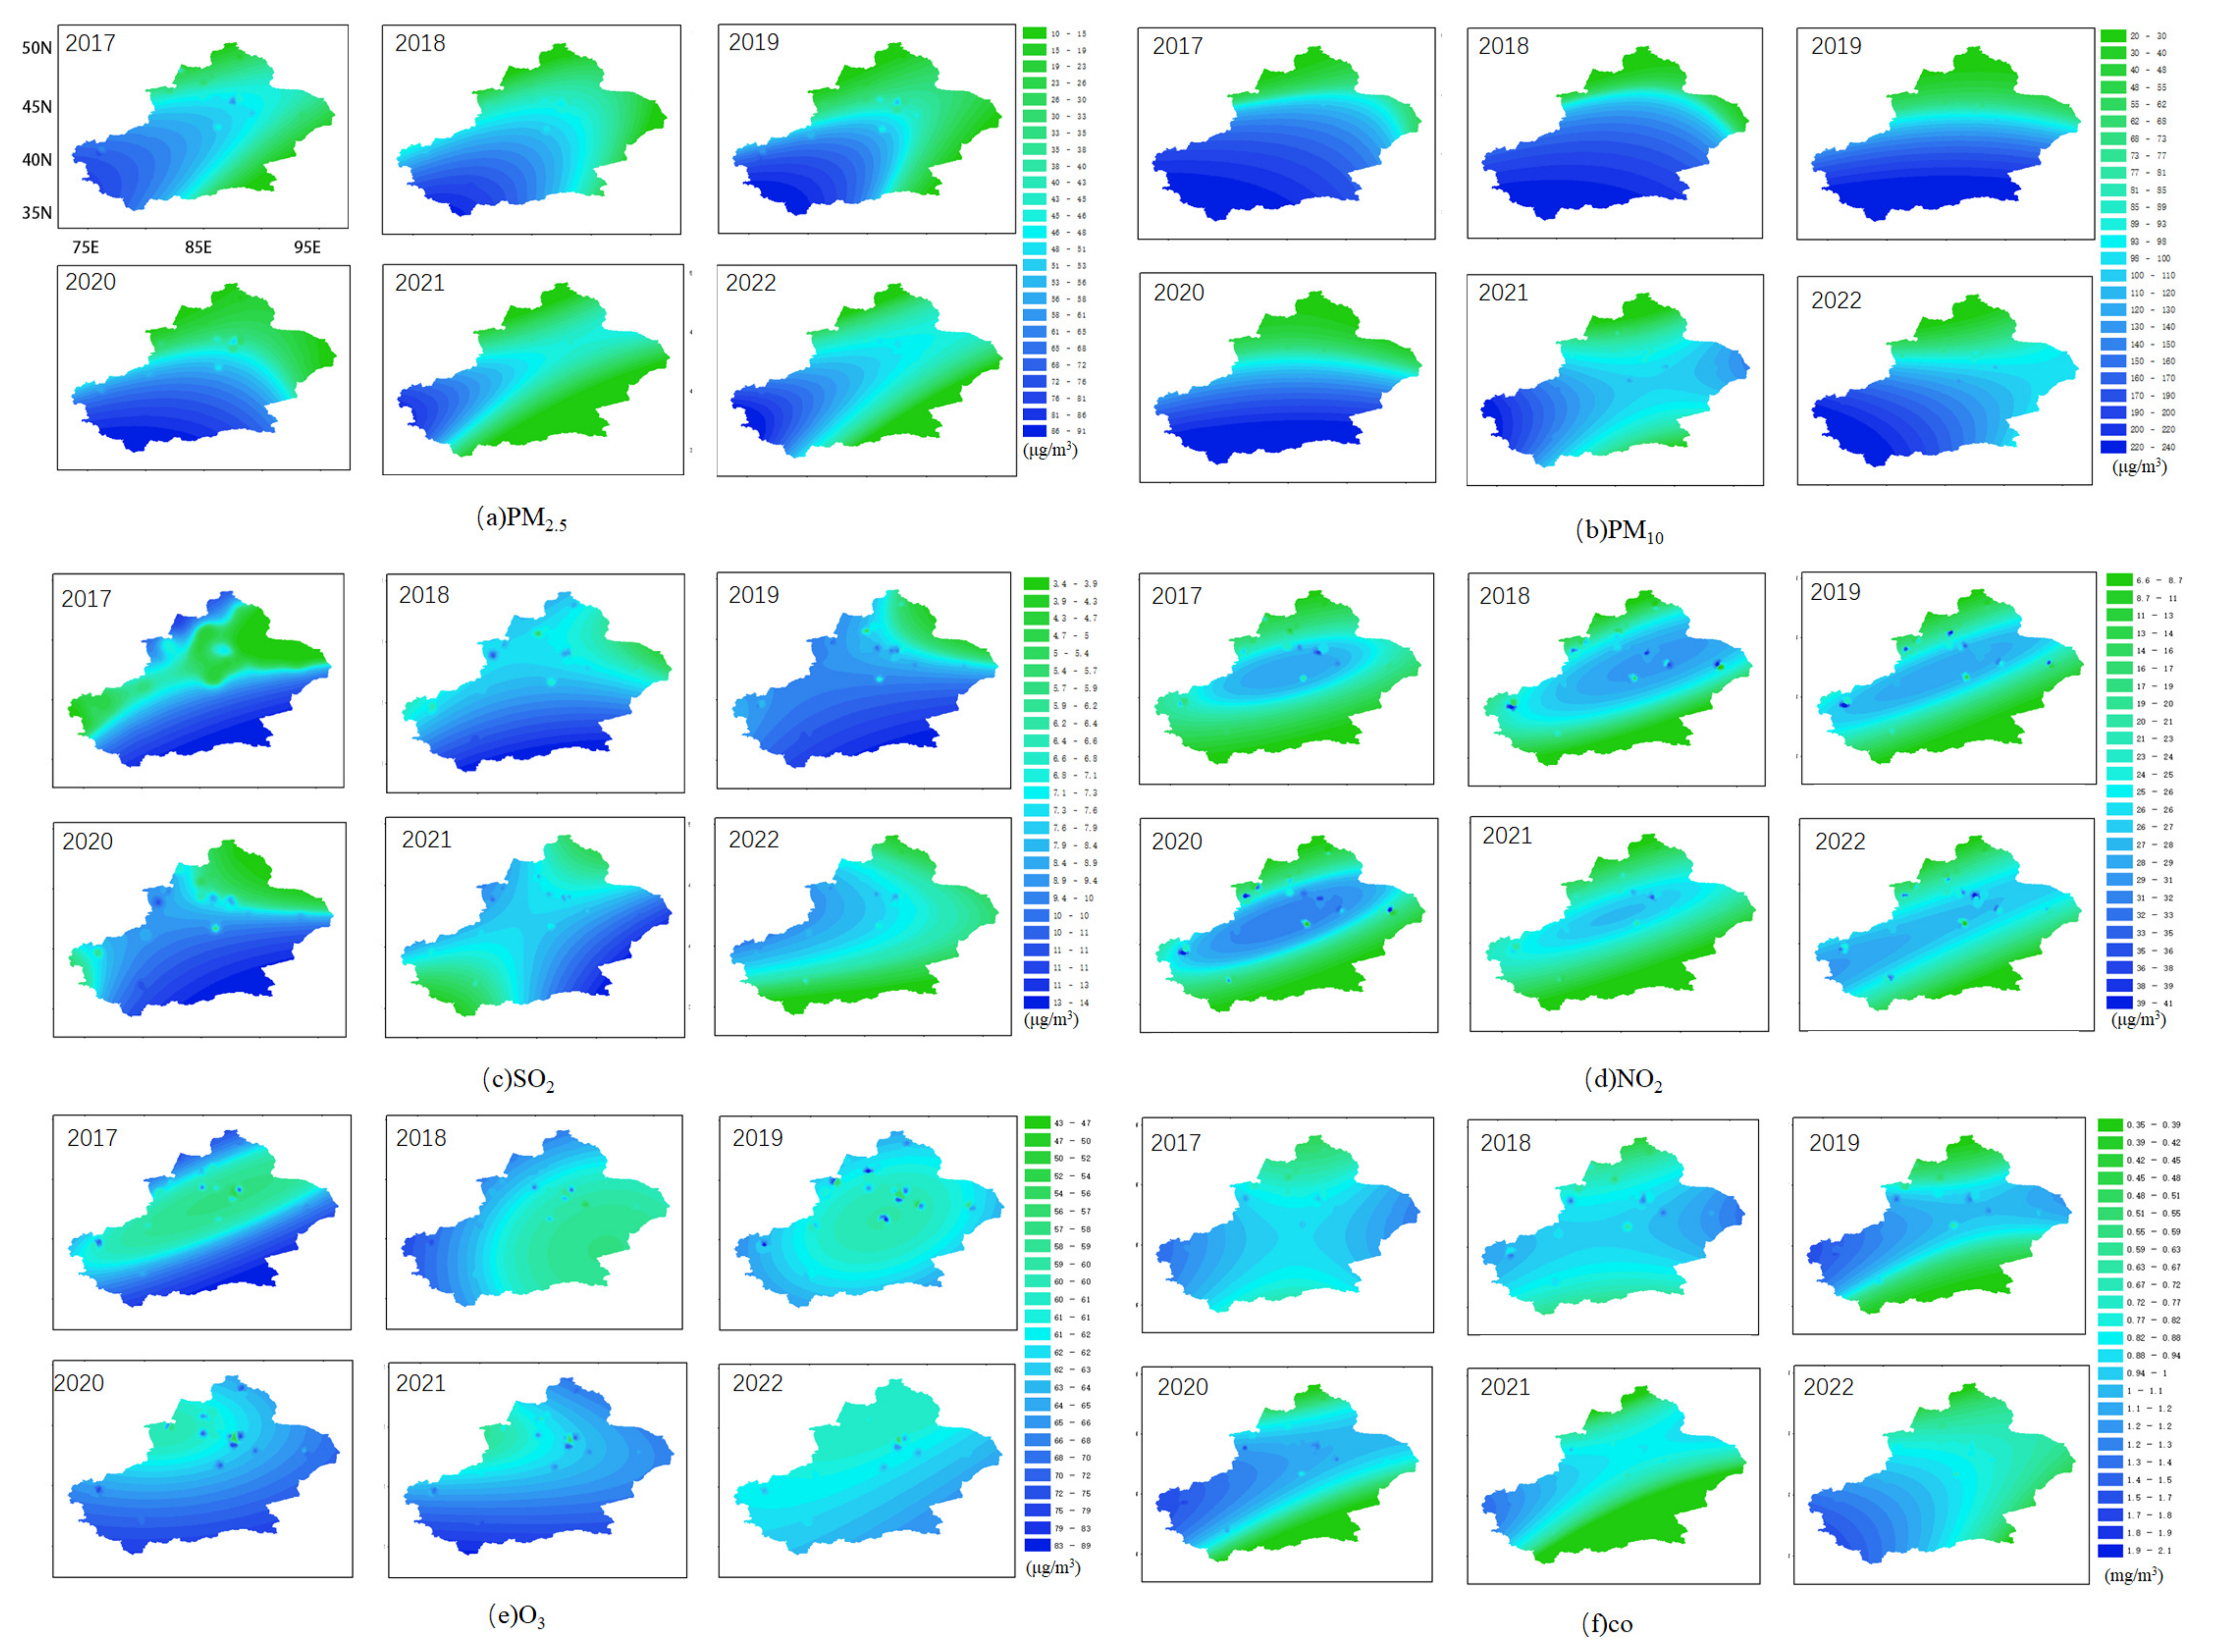
The annual average concentration of 17 environmental quality monitoring stations in Xinjiang Province was used to calculate the spatial distribution of pollutants.
Figure 3 shows the spatial distribution characteristics of pollutants in Xinjiang Province from 2017 to 2022, regional latitude and longitude refer to the 2017 PM
2.5 concentration distribution map in
Figure 3. The overall concentration of pollutants in Xinjiang presents a significant north–south distribution difference, showing a pollution trend of high concentration in the south and low concentration in the north. The mass concentration of four southern Xinjiang cities, Bozhou, Aksu, Kashi, and Hetian, is not less than 120 μg/m
3. The annual average mass concentration of particulate matter in the southern part of northern Xinjiang is higher than that in the northern part, such as Hami, Urumqi, and Turpan. The annual average mass concentration of particulate matter is 68–122 μg/m
3, which is higher than the 26–63 μg/m
3 in Altay, Tianchi, Bozhou, and Karamay. Hetian and Kashi are the two southern Xinjiang cities with the highest annual average mass concentration of particulate matter, and Altay is the city with the lowest annual average mass concentration of particulate matter. The reason that the spatial distribution of the annual average mass concentration of particulate matter is high in the south and low in the north may be closely related to the influence of the desert in Xinjiang [
40].
The variation in the O3 concentration shows an increasing trend from west to east, with higher O3 concentration in Kezhou, Aksu, and Tacheng and lower O3 content in Urumqi, Changji, and Bozhou. The SO2 concentration in Hetian is much higher than that in other regions; in contrast, Kezhou, Tacheng, and Bazhou have lower SO2 concentrations. The CO concentrations in Yili, Turpan, and Urumqi are higher, while the CO concentrations in Altay and Tacheng are lower. The high NO2 concentrations are mainly concentrated in Urumqi, Changji, and Turpan, and the traffic flow also increases the NO2 concentration to a certain extent.
3.3. WRF Model Simulation Effect Evaluation
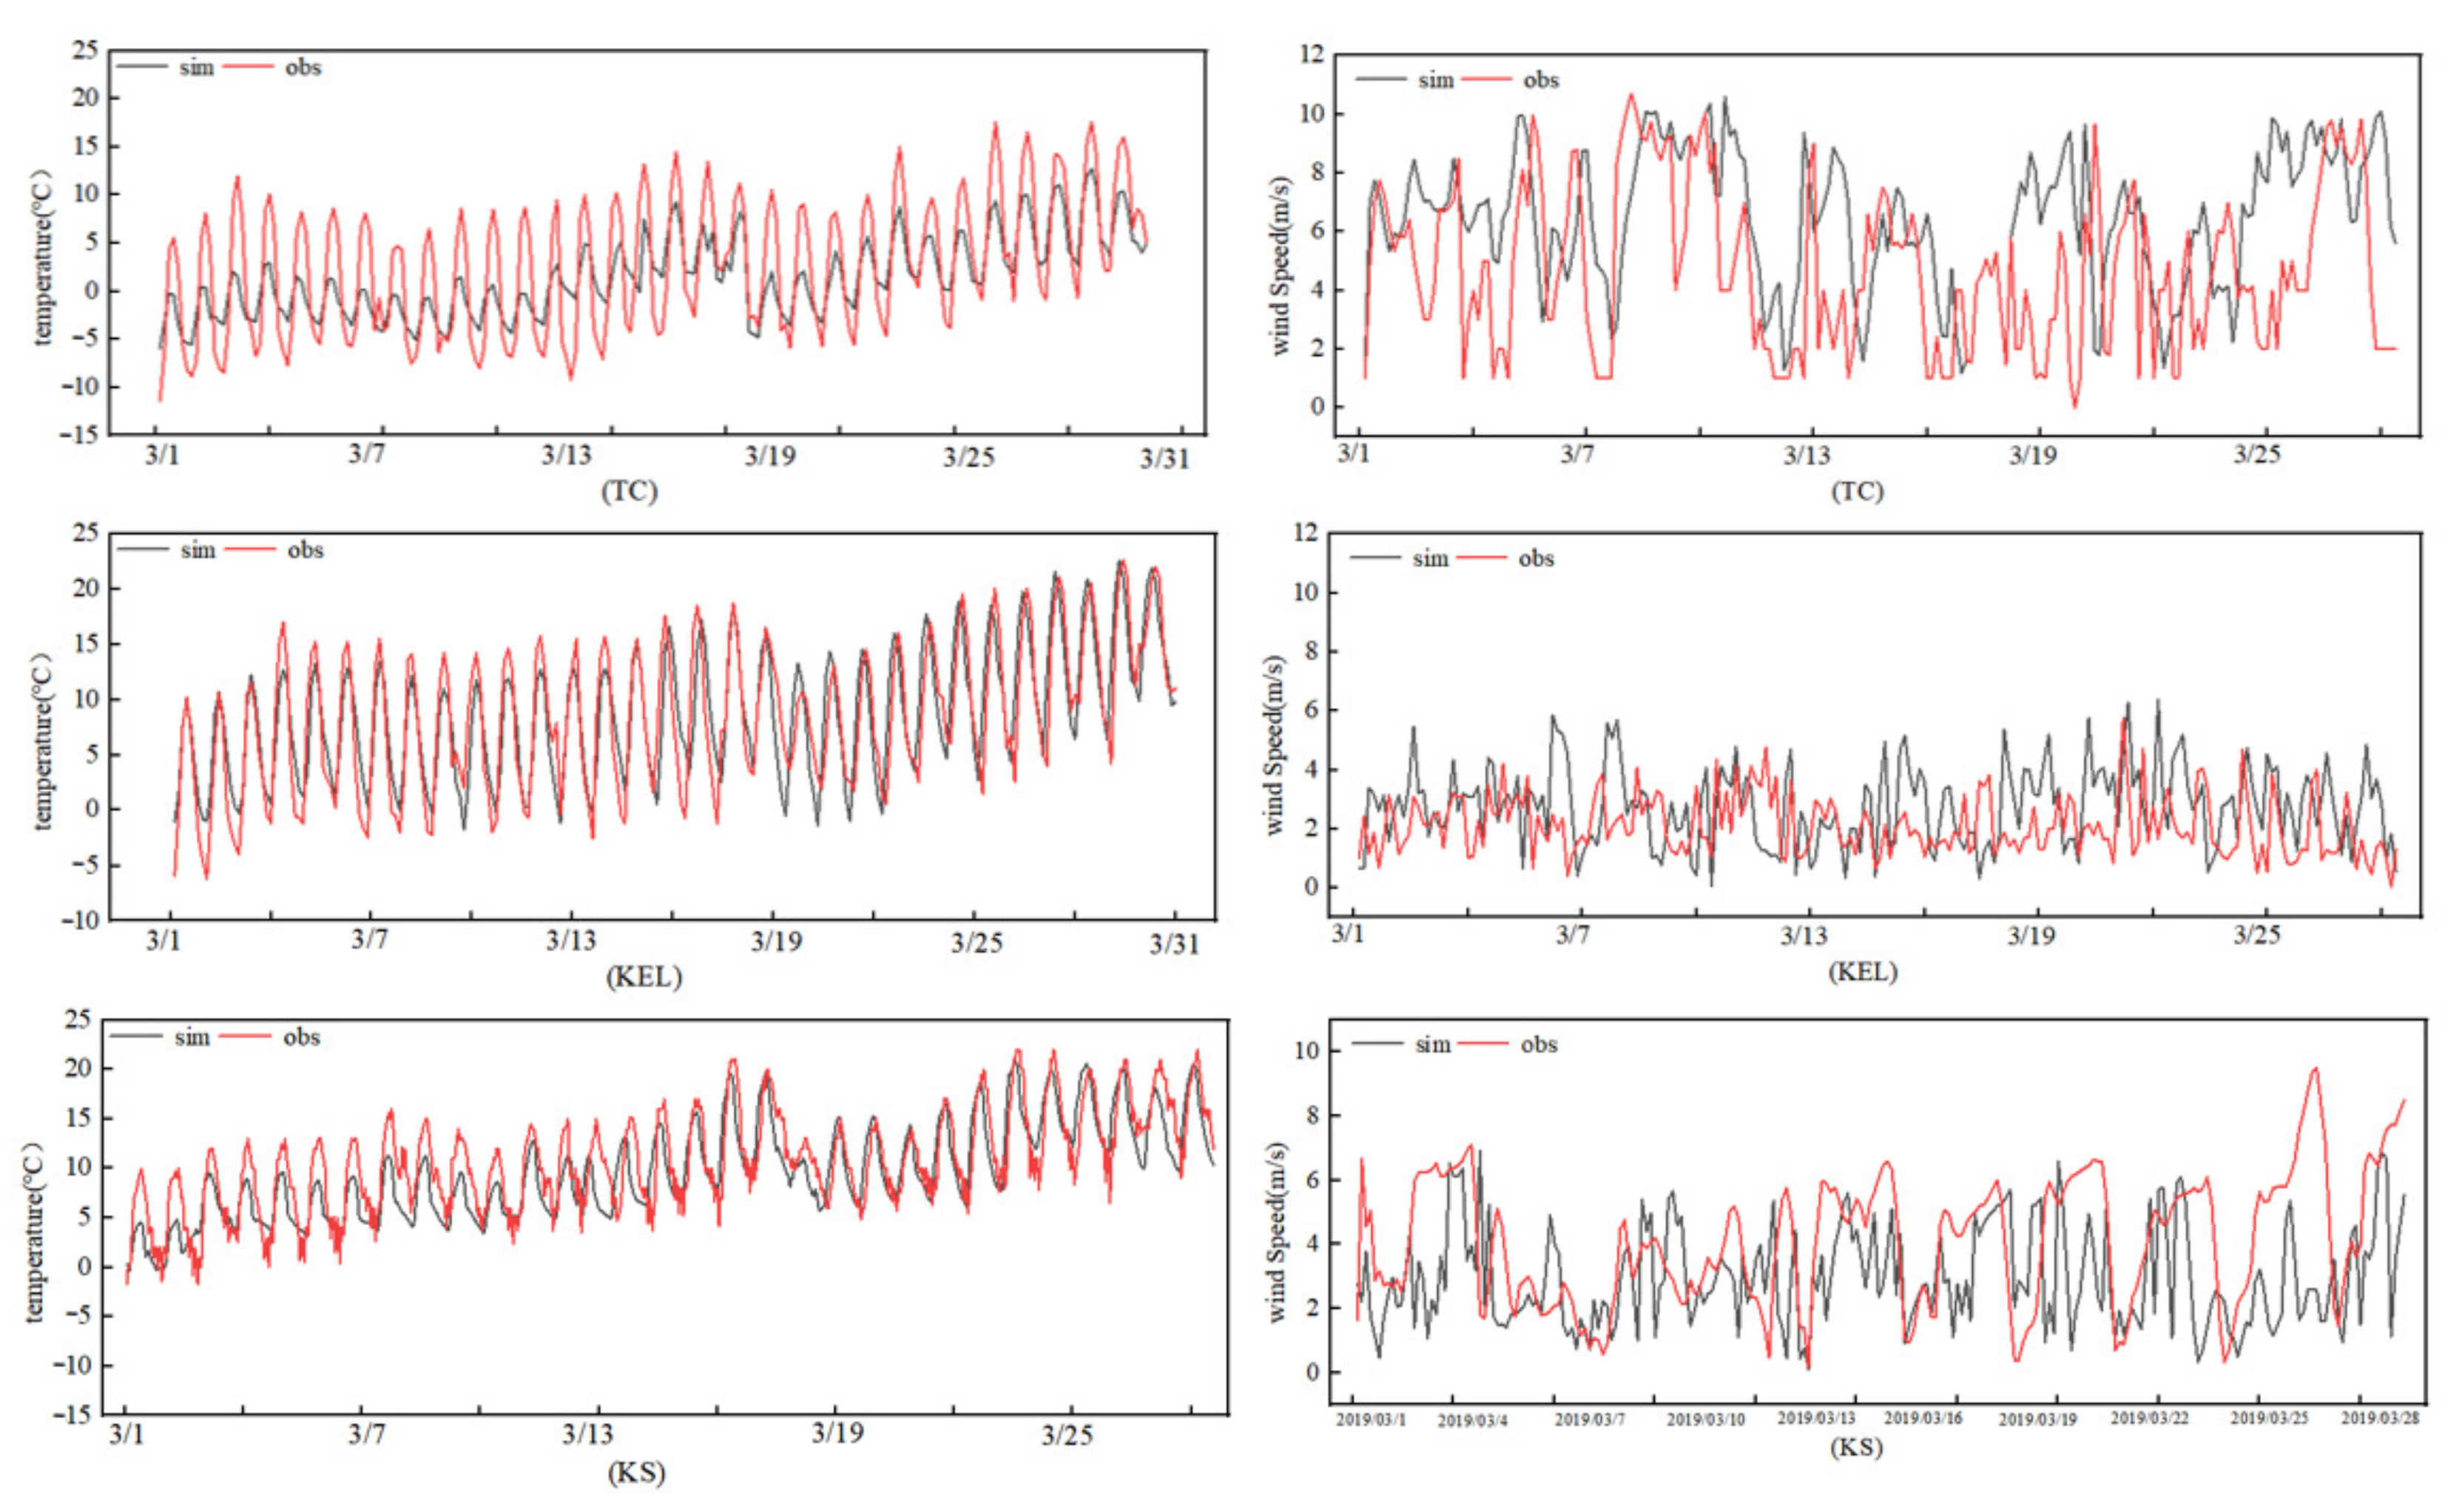
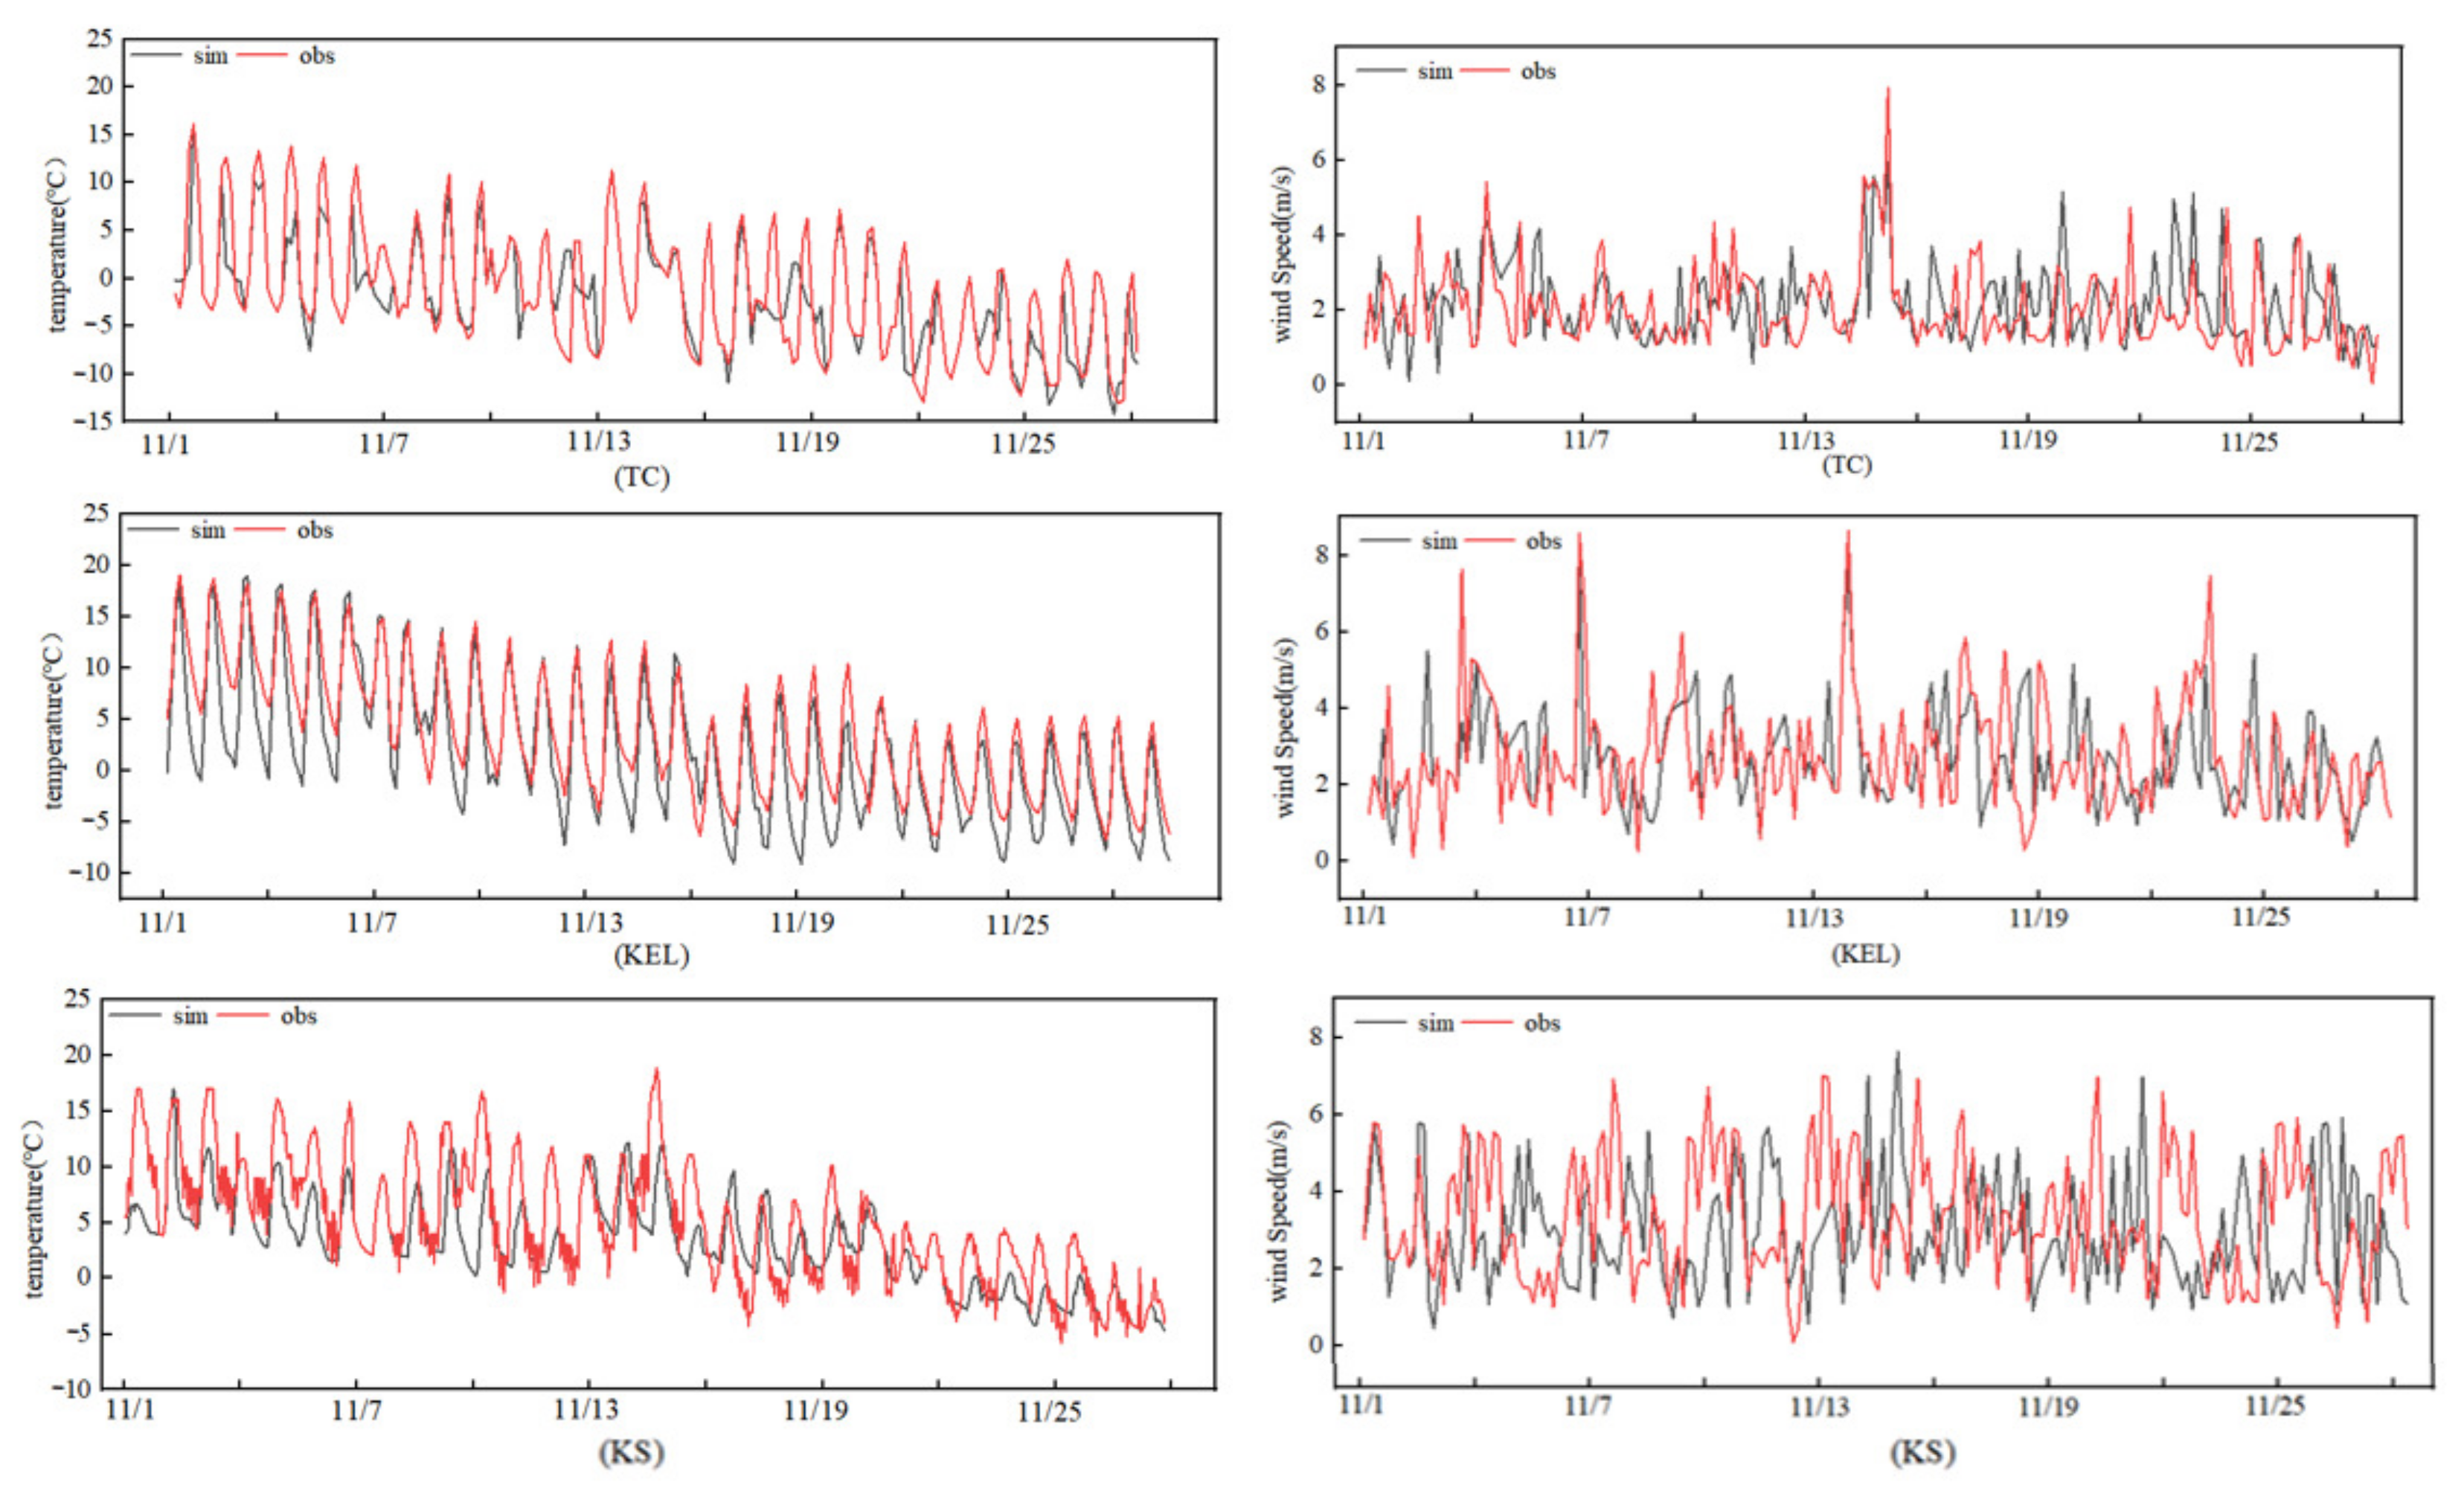
As the meteorological input data provided by the WRF model directly affect the uncertainty of the CMAQ simulation results, the WRF model was first verified. The typical months of March and November 2019 were selected for simulation, and three cities located in northern and southern Xinjiang, namely Urumqi, Korla, and Kashgar, were selected to verify T2 and WS10. The performance of the model was evaluated according to three statistical indicators, namely the correlation coefficient (R), normalized mean bias (NMB), and normalized mean error (NME). The simulation results and monitoring results are shown in
Table 3 and
Figure 4. R meets the critical value of the correlation coefficient; The NMB and NME results meet the standards proposed by the US Environmental Protection Agency. The model performance results show that the WRF model can simulate temperature and wind speed well. The missing data of the meteorological stations represent less than 1%.
3.4. CMAQ Model Simulation Effect Evaluation
Table 4 and
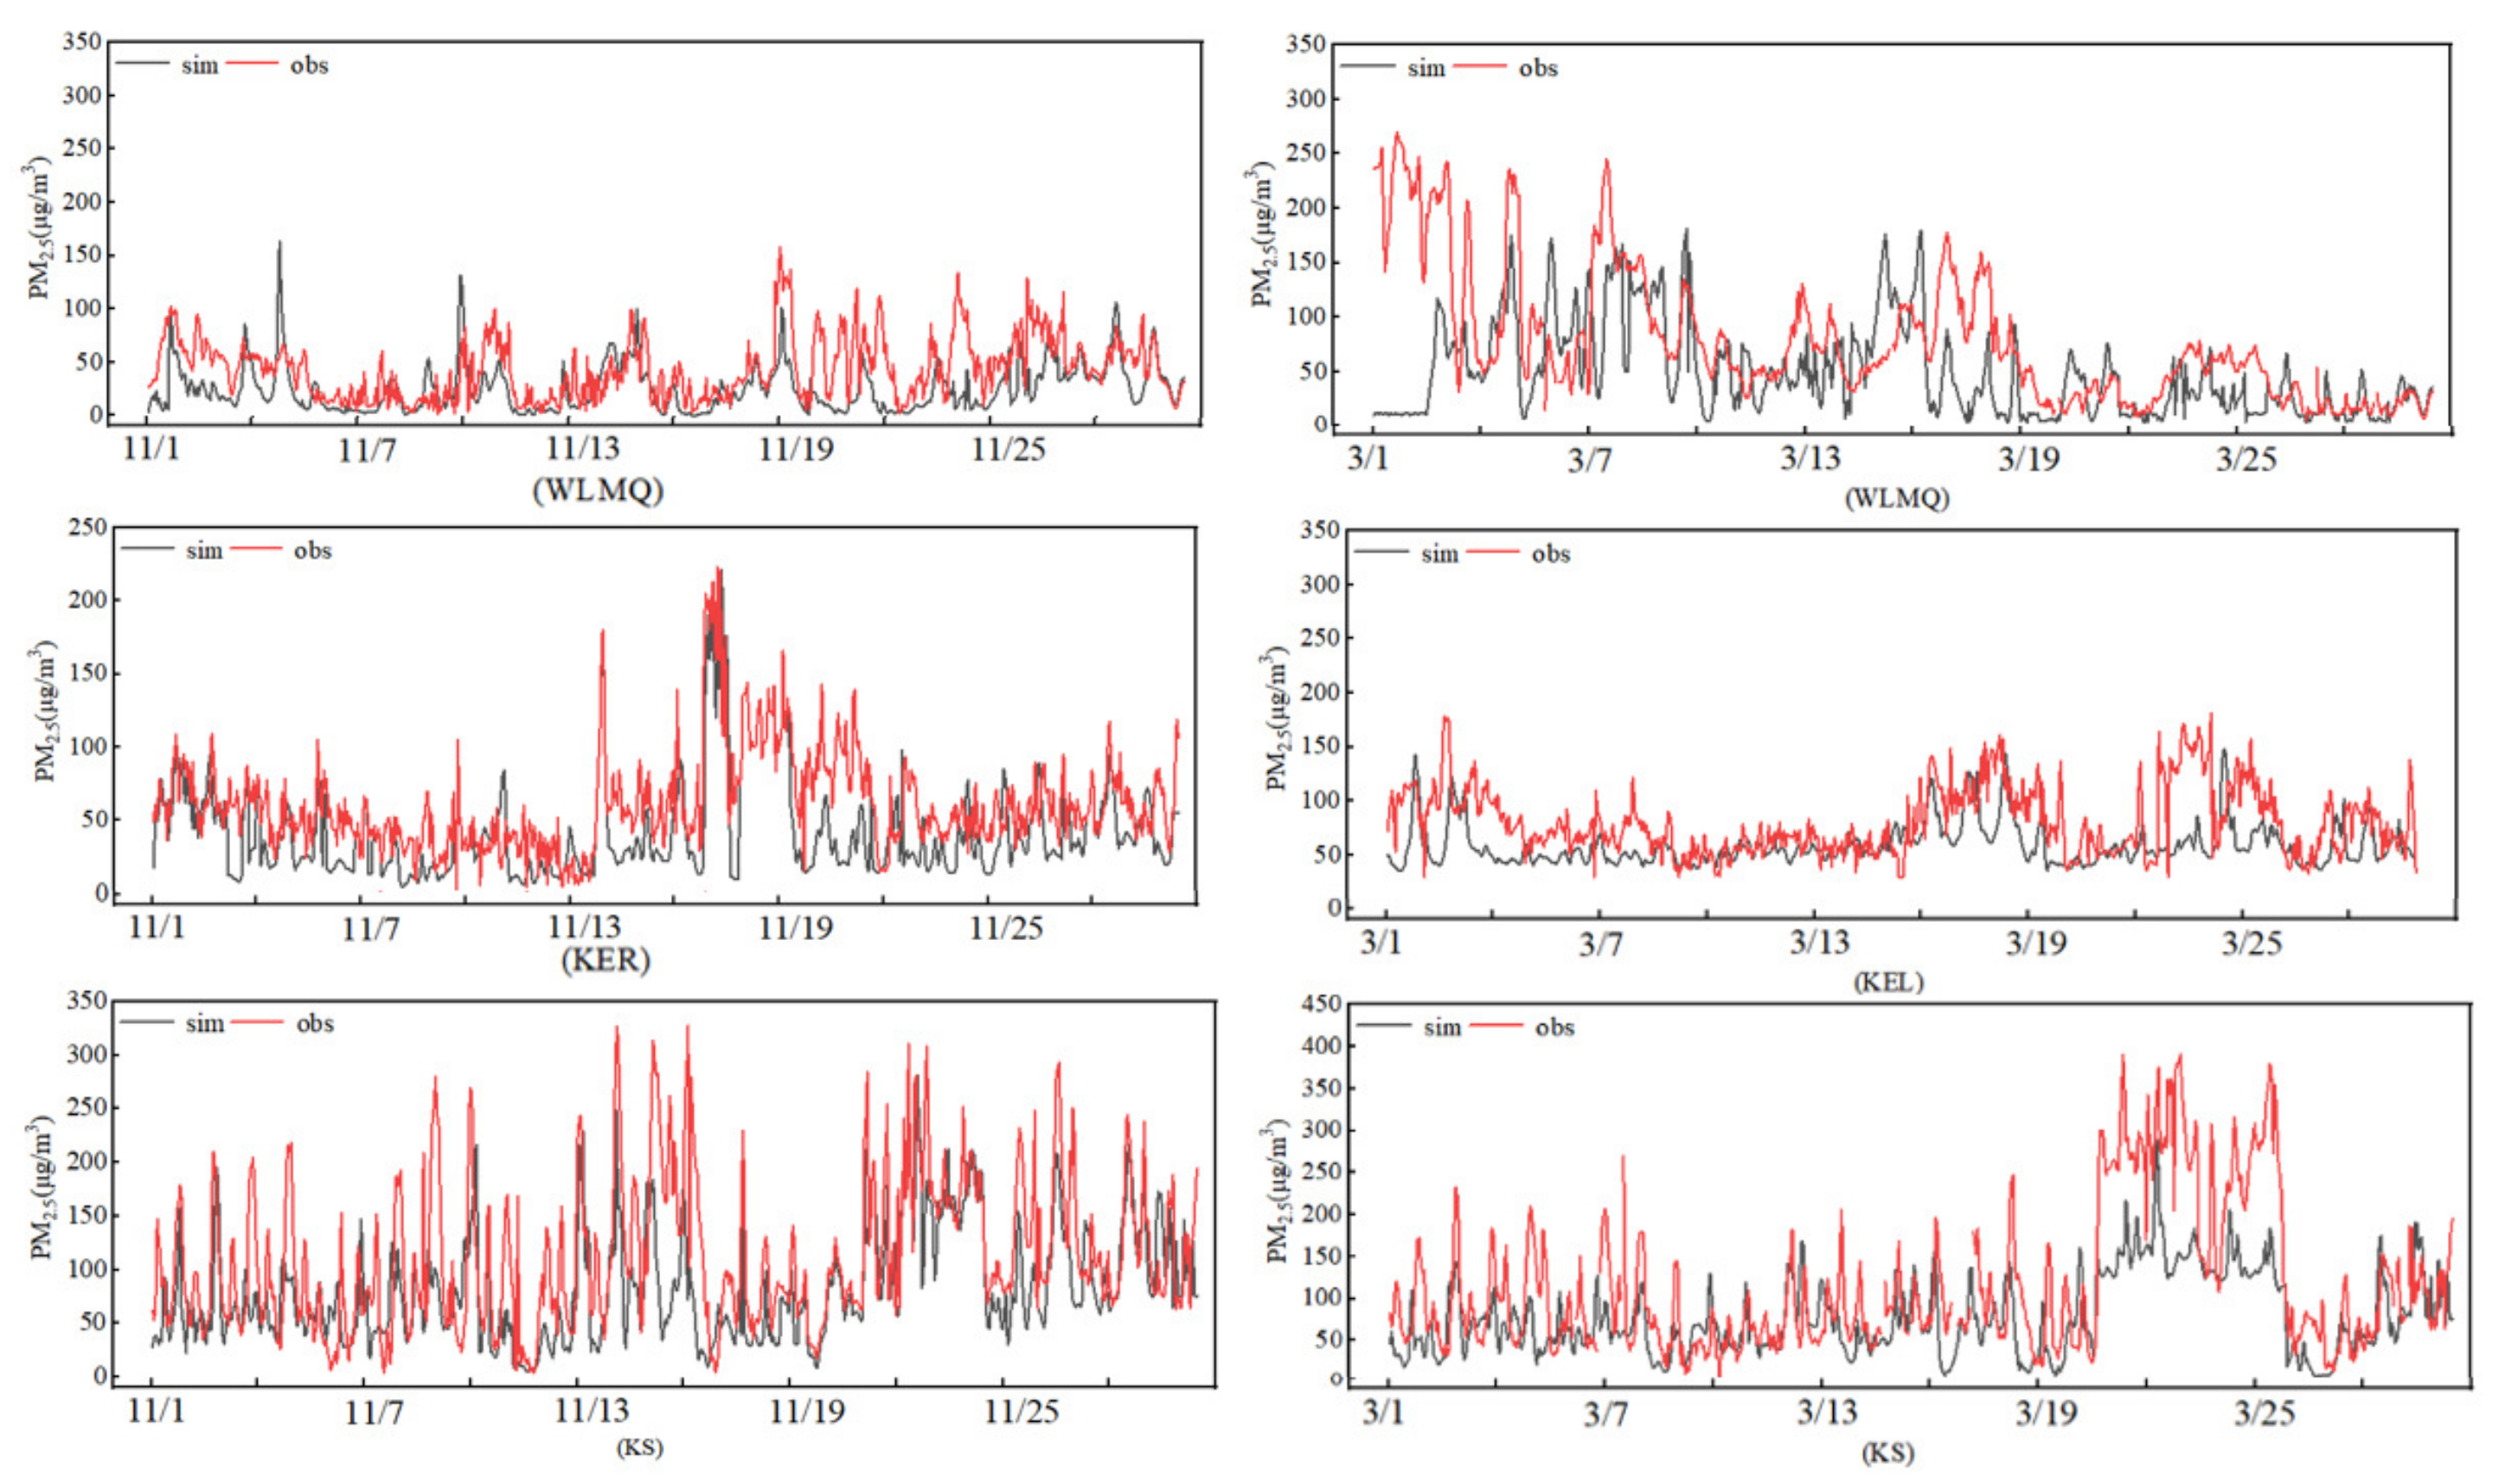
Figure 5 show the comparison between the CMAQ simulation results and the monitoring results in March and November 2019.
Table 4 summarizes the statistical results of the PM
2.5 simulation performance, including R, NMB, and NME. The verification results meet the standards proposed by the US Environmental Protection Agency. The missing data rate of the air quality monitoring stations is less than 10%. In general, the model captures the time-varying characteristics of the PM
2.5 concentration at the observation station. In comparison, the simulation effect in March is slightly lower than that in November, and the overall concentration simulation is slightly lower than the monitoring value. The verification results show that the CMAQ model can accurately simulate the changes in PM
2.5 concentration in March and November.
3.5. Emission Reduction Measures in Future Scenarios
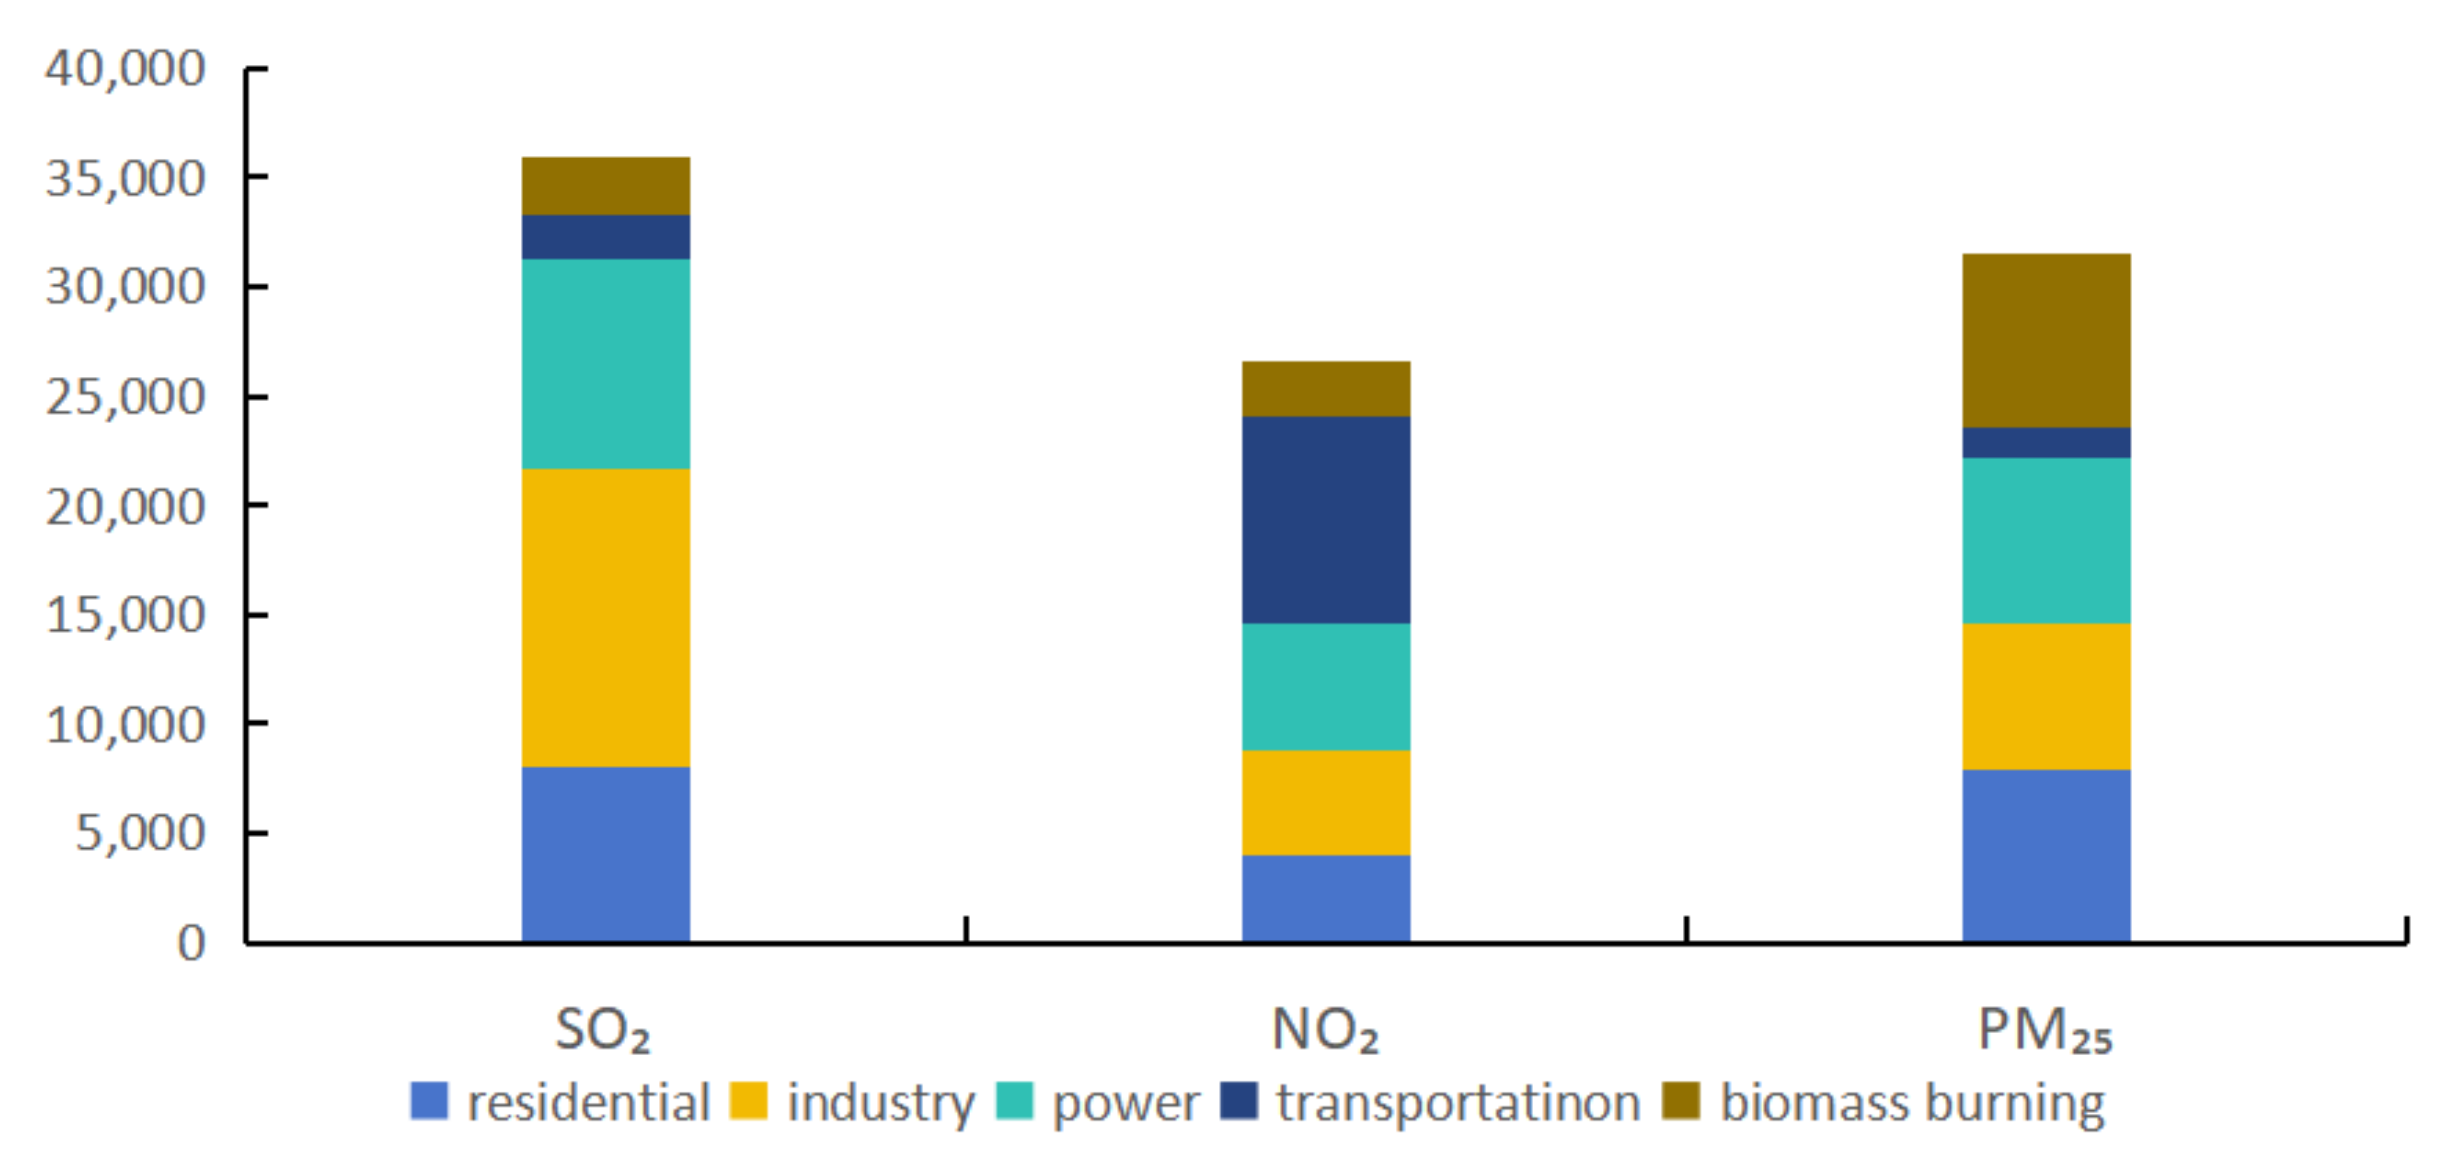
Figure 6 shows the estimated average industry emissions of SO
2, NO
2, and PM
2.5 for March and November 2025. The industry is the largest source of SO
2 emissions in the planting area in 2025, accounting for 40%, followed by electricity at 26%. Transportation is the main source of NO
2 emissions in the planting area in 2025, accounting for 38%. The second is heating, which is also an important source of NO
2 emissions (26%). As for PM
2.5, biomass burning, industry, and residential areas are the main sources of PM
2.5 emissions in the planting area in 2025, accounting for 27%, 21%, and 19%, respectively. Biomass burning mainly includes the large incineration of crop residues in March and November; the industrial processes include those of the steel, cement, and coking industries, while rural residents’ emissions mainly come from coal.
According to the MEIC emission inventory, the residential emissions of SO2, NO2, and PM2.5 in the cultivated area in March 2019 were estimated to be 34,340 t, 25,403 t, and 30,519 t, respectively. The residential emissions of SO2, NO2, and PM2.5 in November 2019 were estimated to be 33,089 t, 27,565 t, and 22,021 t, respectively. With the implementation of control measures (i.e., the EER scenario), it is expected that the emissions of SO2, NO2, and PM2.5 in 2025 will be about 15% lower than those in 2019. In the SER scenario with measures and higher control efficiency levels, the emissions of SO2, NO2, and PM2.5 in 2025 will be about 35% lower than those in 2019. In the BAT scenario, the emission reduction will be more significant, and the emissions of SO2, NO2, and PM2.5 in 2025 will be about 45% lower than those in 2019. Among all the regions, the cultivated area in Urumqi has the highest emissions and the largest contribution to the total emission reduction; this is mainly because it had the largest contribution in 2019.
From the above analysis, it can be seen that the main pollutant in Xinjiang is particulate matter. In November and March 2025, the average monthly PM2.5 concentrations in the planting area were 53 μg/m3 and 76 μg/m3, respectively, and were 1.51 and 2.17 times the national secondary standard of 35 μg/m3. With the promotion and implementation of control measures, in the EER scenario, the PM2.5 concentrations in November and March are expected to be reduced to 40.5 and 66.22 μg/m3, respectively. Although the air quality in November and March has been greatly improved in this case, there are still multiple areas where the PM2.5 concentration is higher than the target standard of 35 μg/m3. In the SER scenario, the PM2.5 concentrations in November and March are expected to be reduced to 32.5 and 50 μg/m3, respectively. In this case, although the average value in November meets the standard, there are still areas such as Urumqi, Turpan, and Kashgar where the concentration is higher than the target standard of 35 μg/m3, and some areas in March are still higher than the target standard. In the BAT scenario, the PM2.5 concentrations in November and March can be reduced to 22.5 and 34 μg/m3, respectively, and the target of 35 μg/m3 can be achieved by 2025.
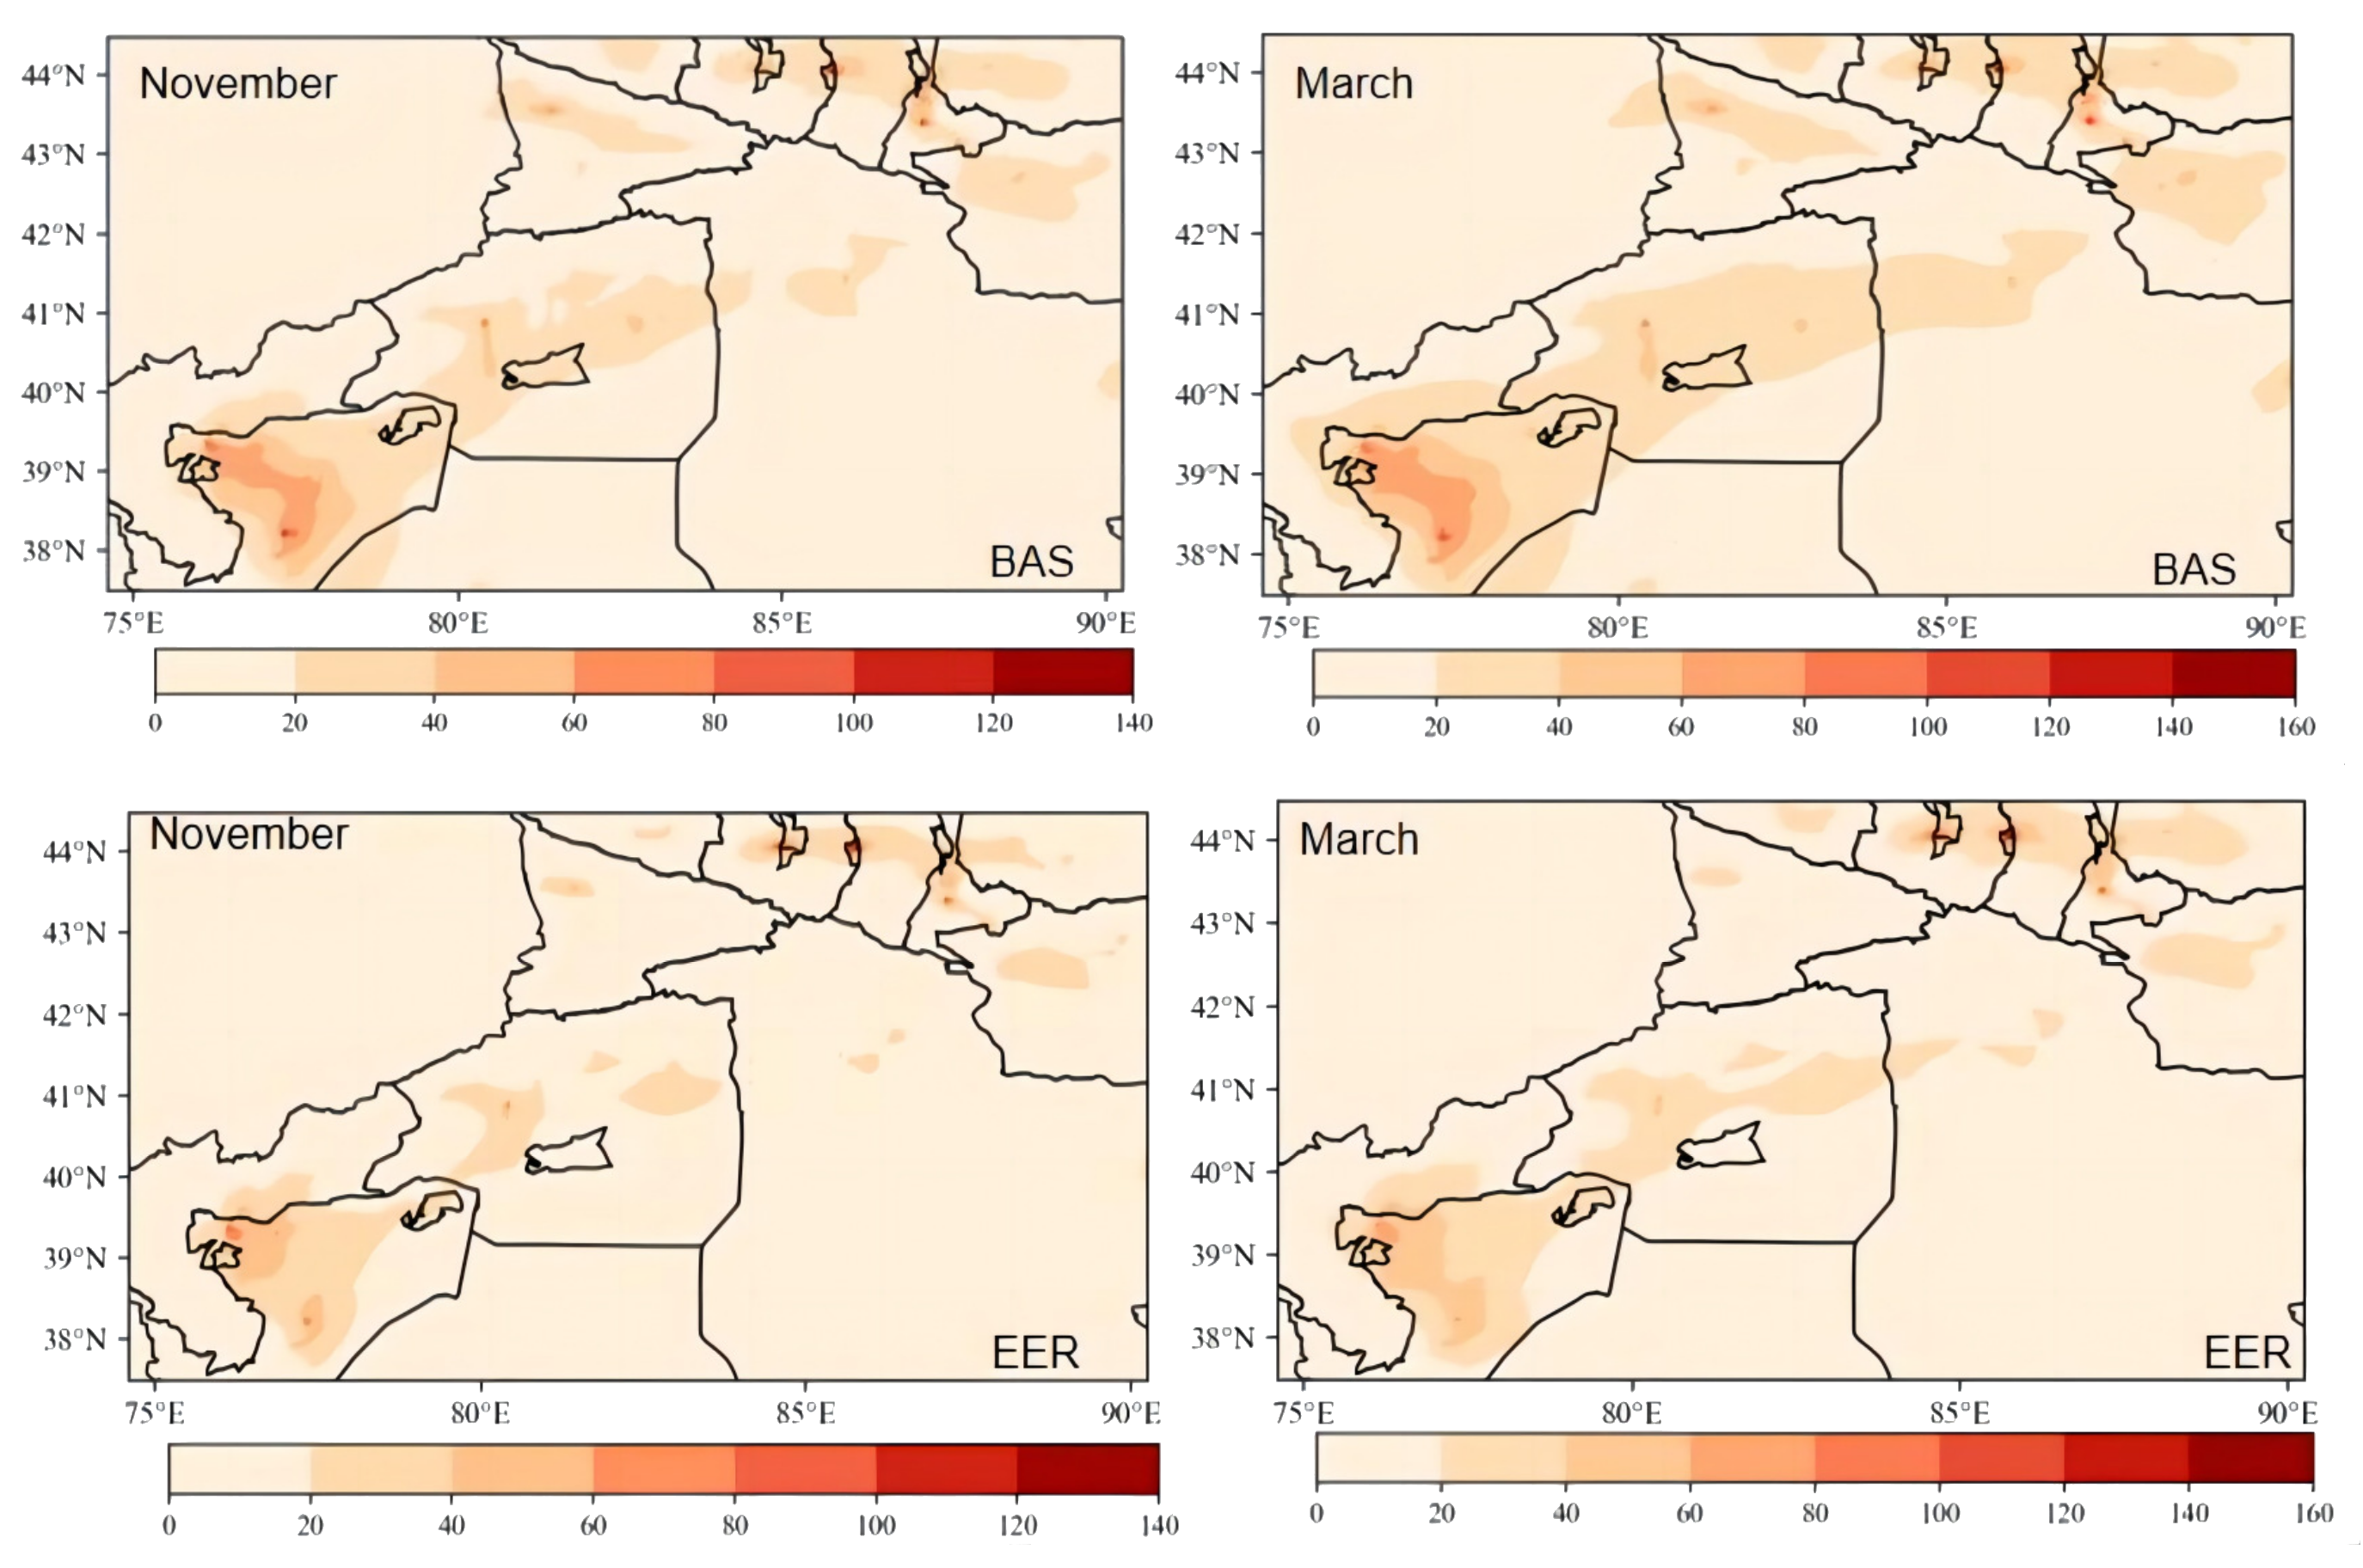
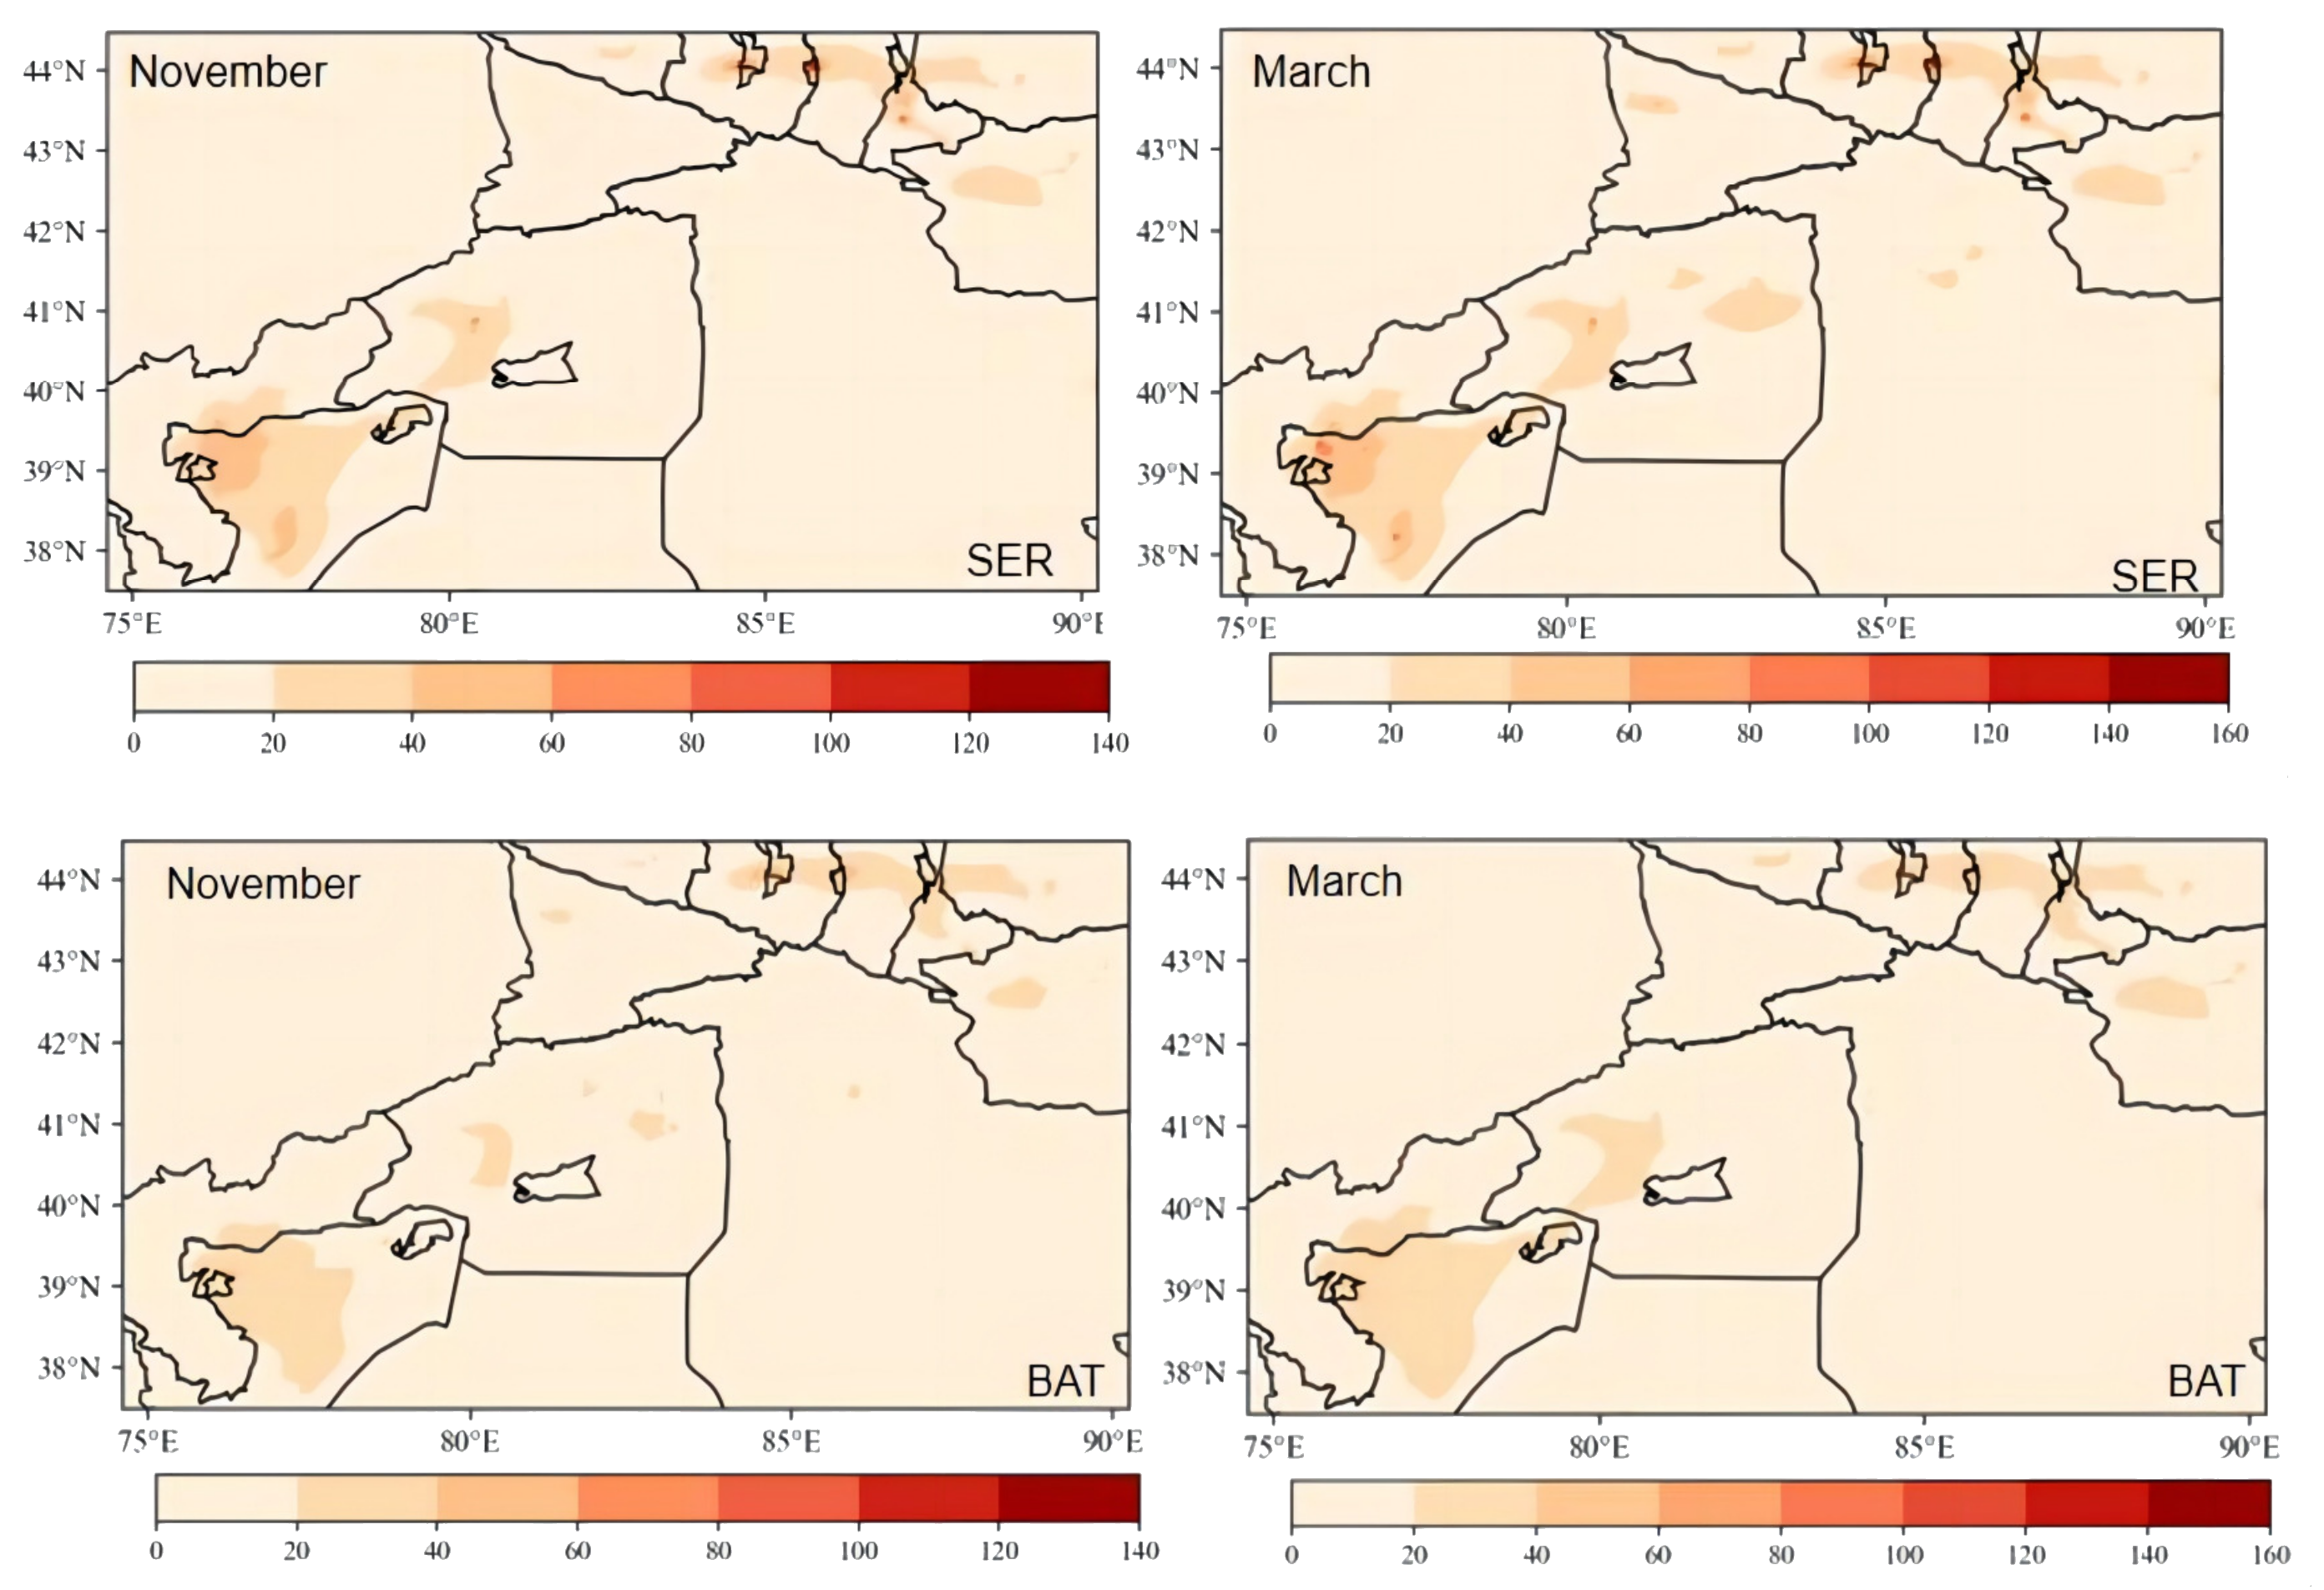
Figure 7 shows the spatial distribution of the monthly average concentration of PM
2.5 in the planting area in March and November in the base scenario and BAT scenario in 2025. In the BAT scenario in 2025, all the cities in the planting area reach the target of 35 μg/m
3 in March and November. However, there are still some cities very close to the target of 35 μg/m
3, such as those of central Urumqi and northern Kashgar. Some rural areas are still slightly higher than 35 μg/m
3, indicating that the control of the rural pollution still needs to be strengthened. For example, the adjacent non-planting areas with PM
2.5 that are close to the target of 35 μg/m
3 should also be paid attention to because the planting area may also be affected by the long-distance transport of air pollutants from these places in the long distance transportation.
4. Conclusions
This study first analyzed the characteristics of air pollution changes in the plantation area; then, based on the WRF–CMAQ model, through the 2019 emission inventory, it constructed the 2025 emission inventory and three future emission scenarios (EER, SER, and BAT). The main conclusions are as follows:
The concentrations of pollutants in Xinjiang showed an overall downward trend from 2017 to 2022. There was a north–south difference in the concentrations of pollutants in Xinjiang. The average concentration of pollutants in southern Xinjiang was generally higher than that in northern Xinjiang. The O3 concentration showed an increasing trend from west to east. The concentration of O3 in Kezhou, Aksu, and Tacheng was higher, while the concentration of O3 in Urumqi, Changji, and Bozhou was lower. Hetian and Kashgar were the cities with the highest annual average mass concentration of particulate matter, and Altay was the city with the lowest annual average mass concentration of particulate matter. The WRF–CMAQ model can better simulate the change trend of the local pollutants after the addition of the biomass burning emission inventory. In the EER scenario, SER scenario, and BAT scenario, the concentrations of SO2, NO2, and PM2.5 will be reduced in 2025. In the EER, SER and BAT scenarios, the concentrations in 2025 will decrease by about 15%, 35% and 45%. In the emission reduction scenario and the BAT scenario, the PM2.5 concentrations in November and March can be reduced to 22.5 and 34 μg/m3, respectively, and the target of 35 μg/m3 can be achieved by 2025. The BAT scenario is the best for the environment. The emission reduction techniques described in this study can assist the government in creating and executing efficient air pollution management policies and ultimately aid in the attainment of the 35 μg/m3 target by 2025.
