Article

Monitoring Indoor Air Quality in Classrooms Using Low-Cost Sensors: Does the Perception of Teachers Match Reality?

1
HyLab—Green Hydrogen Collaborative Laboratory, Estrada Nacional 120-1 Central Termoeléctrica, 7520-089 Sines, Portugal
2
Centro de Ciências e Tecnologias Nucleares (C2TN), Instituto Superior Técnico, Universidade de Lisboa, Estrada Nacional 10, Km 139.7, 2695-066 Bobadela LRS, Portugal
3
Instituto Politécnico de Setúbal, Escola Superior de Tecnologia de Setúbal, Campus do IPS, Estefanilha, 2914-508 Setúbal, Portugal
*
Author to whom correspondence should be addressed.
Atmosphere 2024, 15(12), 1450; https://doi.org/10.3390/atmos15121450
Submission received: 5 November 2024 / Revised: 26 November 2024 / Accepted: 28 November 2024 / Published: 1 December 2024
(This article belongs to the Special Issue Indoor Air Quality Control)

Abstract

:
This study intended to understand whether teachers’ perceptions of indoor air quality (IAQ) during classes aligned with the real levels of air pollutants and comfort parameters. For this purpose, an IAQ monitoring survey based on low-cost sensors using a multi-parameter approach was carried out in nine classrooms (a total of 171 monitored classes) in a Portuguese school. In each monitored class, the perception of IAQ reported by the teacher was assessed using a scale from 1 (very bad IAQ) to 10 (very good IAQ). Several exceedances regarding national legislation were found, with temperature being the parameter with a higher percentage of exceedance in all the studied classrooms (46%), followed by PM10 (32%), and then CO2 (27%). Temperature was found to be the only environmental parameter that was significantly associated with lower IAQ perception reported by the teachers, highlighting that typical pollutants such as CO2 (which can be identified as stuffy air) did not contribute to the teachers’ perceptions.

1. Introduction

Indoor air quality (IAQ) is critically important in educational settings to provide students and teachers with a healthy indoor environment that maximises their productivity [1] and well-being [2,3]. With students typically spending about 6.5 h per weekday in classrooms [4], the quality of indoor air plays a significant role in their daily integrated exposure to environmental pollutants, which can have long-term health implications [5].
Over the past decades, numerous studies have highlighted various IAQ issues in classrooms, focusing on different types of pollutants and their sources [6,7], such as carbon dioxide (CO2) [8], volatile organic compounds (VOCs) [9], and particulate matter [10]. Among these, ventilation has been consistently identified as a key factor in controlling pollutant levels [11], ensuring that air quality remains within acceptable limits as defined by national and international guidelines [3]. Poor IAQ has been linked to a range of negative effects [12,13], including cognitive decline, reduced focus, and decreased attendance. For example, studies have shown that lowering CO2 concentrations from 2100 ppm to 900 ppm can improve task performance by up to 12%, while reducing CO2 levels to 900 ppm can enhance the learning process by 5%, and daily attendance can be improved by 2.5% when CO2 reduces from 4100 ppm to 1000 [12].
Despite the critical importance of IAQ in educational settings, several challenges persist in maintaining optimal air quality. These challenges include inadequate ventilation [11], pollution from building materials, infiltration of outdoor air pollutants, and specific indoor pollution sources promoted by classroom activities [14,15]. These challenges make it essential to implement effective strategies for monitoring and mitigating IAQ problems in classrooms. A comprehensive approach to improving IAQ begins with regular monitoring of air quality indicators and comfort parameters, which allows for accurate assessments and targeted interventions if needed.
In recent years, advances in low-cost sensor technology and Internet-of-Things (IoT)-based solutions have allowed the implementation of new multi-pollutant monitoring systems, which have allowed us to overcome shortcomings of traditional monitoring methods such as price, interference with local activities (due to noise), and specialised human resources [16,17]. The use of these tools has already been applied in different environments and has made it possible to gather relevant information that allows enhancing automatic controls and human decision-making [18] to improve air quality [19]. However, to ensure the accuracy and reliability of low-cost sensors, proper calibration against reference equipment is crucial to avoid measurement discrepancies [20,21].
In the absence of this type of IAQ monitoring technology system to inform the decision-making process, the management of IAQ in classrooms relies on the subjective perception of the occupants (teachers and students) during classes [22]. Teachers, particularly in naturally ventilated classrooms, often take action based on their sense of air quality, such as opening windows or doors to improve ventilation. However, their ability to assess IAQ accurately can be influenced by several external factors, such as weather conditions, noise pollution, and the presence of outdoor pollutants, which may compromise the reliability of their assessments [23]. Understanding the accuracy of teachers’ perceptions of IAQ (which drives their actions) is essential for establishing best practices and guidelines to ensure a healthy classroom environment.
The present study aims to contribute to this topic and to provide insights into how the IAQ perceptions of teachers align with real IAQ levels in classrooms. To this end, this study aimed to perform an IAQ assessment in classrooms during teaching hours using a multi-pollutant approach involving low-cost sensors and identifying the key environmental factors that shape teachers’ perceptions of air quality.

2. Materials and Methods

2.1. Study Site

The present study was conducted in a high school in the municipality of Ponte de Sor, Portalegre district, inland Portugal. Yearly, it has around 400 students attending classes. The school was remodelled in 2010, and a central air conditioning and ventilation system was installed. Additionally, new windows were installed in all the school buildings. However, due to the inability of the occupants to manually operate the windows (such as opening and closing), along with the inoperability of the central air conditioning and ventilation system due to budget restrictions, several complaints have been reported by the occupants of the classrooms (teachers and students), especially regarding thermal comfort during winter and summer.
Ponte de Sor municipality experiences a temperate climate characterised by dry, hot summers, as described in the Iberian Climate Atlas [24]. The mean monthly air temperature in Ponte de Sor in May 2023 was 20 °C; this month was considered “very hot” based on air temperature and very dry based on precipitation. Overall, the air temperature in Portugal in this month was 18.2 °C; this was considered the eighth hottest May since 1931 [25].

2.2. IAQ Monitoring Equipment Based on Low-Cost Sensors

Three monitoring boxes (MBs) based on low-cost sensors were assembled with four different low-cost sensors to provide a comprehensive characterisation of indoor environments regarding CO2, VOCs, fine (PM2.5), and inhalable (PM10) particulate matter, and the comfort parameters temperature (T) and relative humidity (RH).
The low-cost sensors selected for this study included (1) an SCD30 for measuring CO2, with a range between 400 and 10,000 ppm and an accuracy of ±30 ppm; (2) a MiCS-VZ-89TE for detecting VOCs, with a range of 0–1000 ppb in isobutylene; (3) an HPMA115S0 for monitoring PM2.5 and PM10, with a range of 0–1000 μg.m−3 and an accuracy of 15%; and (4) an SHT31 for monitoring temperature and relative humidity, with a precision of ±0.3 °C for T and of ±2% for RH. These MBs monitored real-time data for the selected parameters with a 1-min monitoring frequency and the data were sent instantaneously to an online platform via wireless communication (for cloud storage). Additional information about the MBs’ hardware platform and internal layout is described in previously published studies where these MBs were successfully used to assess IAQ in different micro-environments such as grocery stores [26] and bedrooms [27].
To assure data reliability, correction factors were identified for each parameter and for each MB in an inter-comparison study with calibrated real-time instruments. The reference real-time instruments were factory-calibrated devices from TSI (TSI, Shoreview, MN, USA), namely a DustTrak DRX monitor model 8533 to assess PM2.5 and PM10, and two IAQ-Calc Indoor Air Quality Meters: model 7545 to assess CO2, T, and RH, and model 9565 to assess VOCs.
Table 1 presents the intercomparison results of each MB, including correction factors, such as the slope (m) and intercept (b) of the regression line between calibrated and low-cost sensor equipment.
Very strong correlations were obtained (R2 ranging from 0.86 to 1.00) for CO2, T, and RH for all the studied MBs. For PM10, strong to very strong correlations were found (R2 ranging from 0.62 to 0.98), while only strong correlations were found for PM2.5 (expressed as R2 ranging from 0.67 for AirQ1 to 0.72 for both AirQ2 and AirQ3). For VOCs, only moderate correlations were found (with R2 ranging from 0.42 for AirQ3 to 0.53 for AirQ2).
The raw monitoring data were downloaded from the online platform and, afterwards, the correction factors for each sensor and each MB were applied to the raw data.

2.3. IAQ and Perception Survey During Classes

A total of 9 classrooms were selected to be monitored during class periods for one full week in May of 2023. The IAQ monitoring equipment was located on the teacher’s desk.
The teachers were asked to complete a brief questionnaire after each class to provide some details (day, start and end time of the class, and the number of students present and their average age) and their IAQ perceptions during the classes, ranging from 1 (very bad IAQ) to 10 (very good IAQ). The complete questionnaire that the teachers were requested to fill is presented in Table S1 of the Supplementary Information.

2.4. Data and Statistical Analysis

A Python script was built to aggregate the raw data, apply the identified correction factors, and evaluate the environmental parameters for each class, considering the start and end times. Further data treatment was performed in Microsoft Excel. Data analysis was conducted by applying non-parametric statistics, such as Spearman’s correlation (with a significance level of 0.050), using SPSS (Statistical Package for the Social Sciences, IBM SPSS Statistics, version 27).

2.5. Exposure to PM and the Doses Inhaled by Students

The exposure of students to particulate matter (E, μg.m−3.h) was determined by both the concentration and duration of exposure. It was calculated by multiplying the daily mean concentration (Cj) in the classroom by the time spent in it by the student, as expressed by the formula E = Cj.tj. The potential inhaled dose (D, μg), which represents the amount of a contaminant absorbed by the body of an exposed individual over a specific period (tj), was computed by multiplying the exposure by the Inhalation Rate (IR, m3.h−1) [26,27,28].
It is well established that IR varies across different age groups and activities, ranging from 0.3 m3.h−1 for children and young people at rest to 2 m3.h−1 for adults engaged in physical activity. In the classroom setting, where activities are generally sedentary, an IR of 0.45 m3.h−1 was used to estimate the potential inhaled dose by students aged between 11 and 18 years old [28].

3. Results

Table 2 provides an overview of the number of classes evaluated per classroom, along with information on the mean number of students attending and the mean IAQ perception reported by the teachers. Overall, a total of 171 classes were monitored.

3.1. Indoor Air Quality Parameters

3.1.1. Temperature

The ISO 7730 guideline defines the optimal temperature range for indoor environments as being from 23 to 26 °C during the summer [29]. Figure 1 shows the mean, minimum, and maximum temperature levels assessed per classroom, as well as its compliance with the guideline, considering all the monitored classes. Overall, the mean temperature in all 171 monitored classes was 25.5 ± 1.8 °C, ranging from a minimum value of 19.9 ± 0.4 °C (classroom C12, twelfth monitored class) to 29.5 ± 0.2 °C (classroom C11, third monitored class). Only one classroom had mean temperature levels outside the optimal range, namely, classroom 11, with a mean temperature of 27.9 ± 1.4 °C.
Out of the 171 classes monitored, 76 (46%) had mean temperature levels outside the acceptable range. It is important to note that the monitoring period was in May, which was characterised by unusually high temperatures that may have contributed to the high levels recorded in the classrooms, as no mechanical ventilation or air conditioning was used.

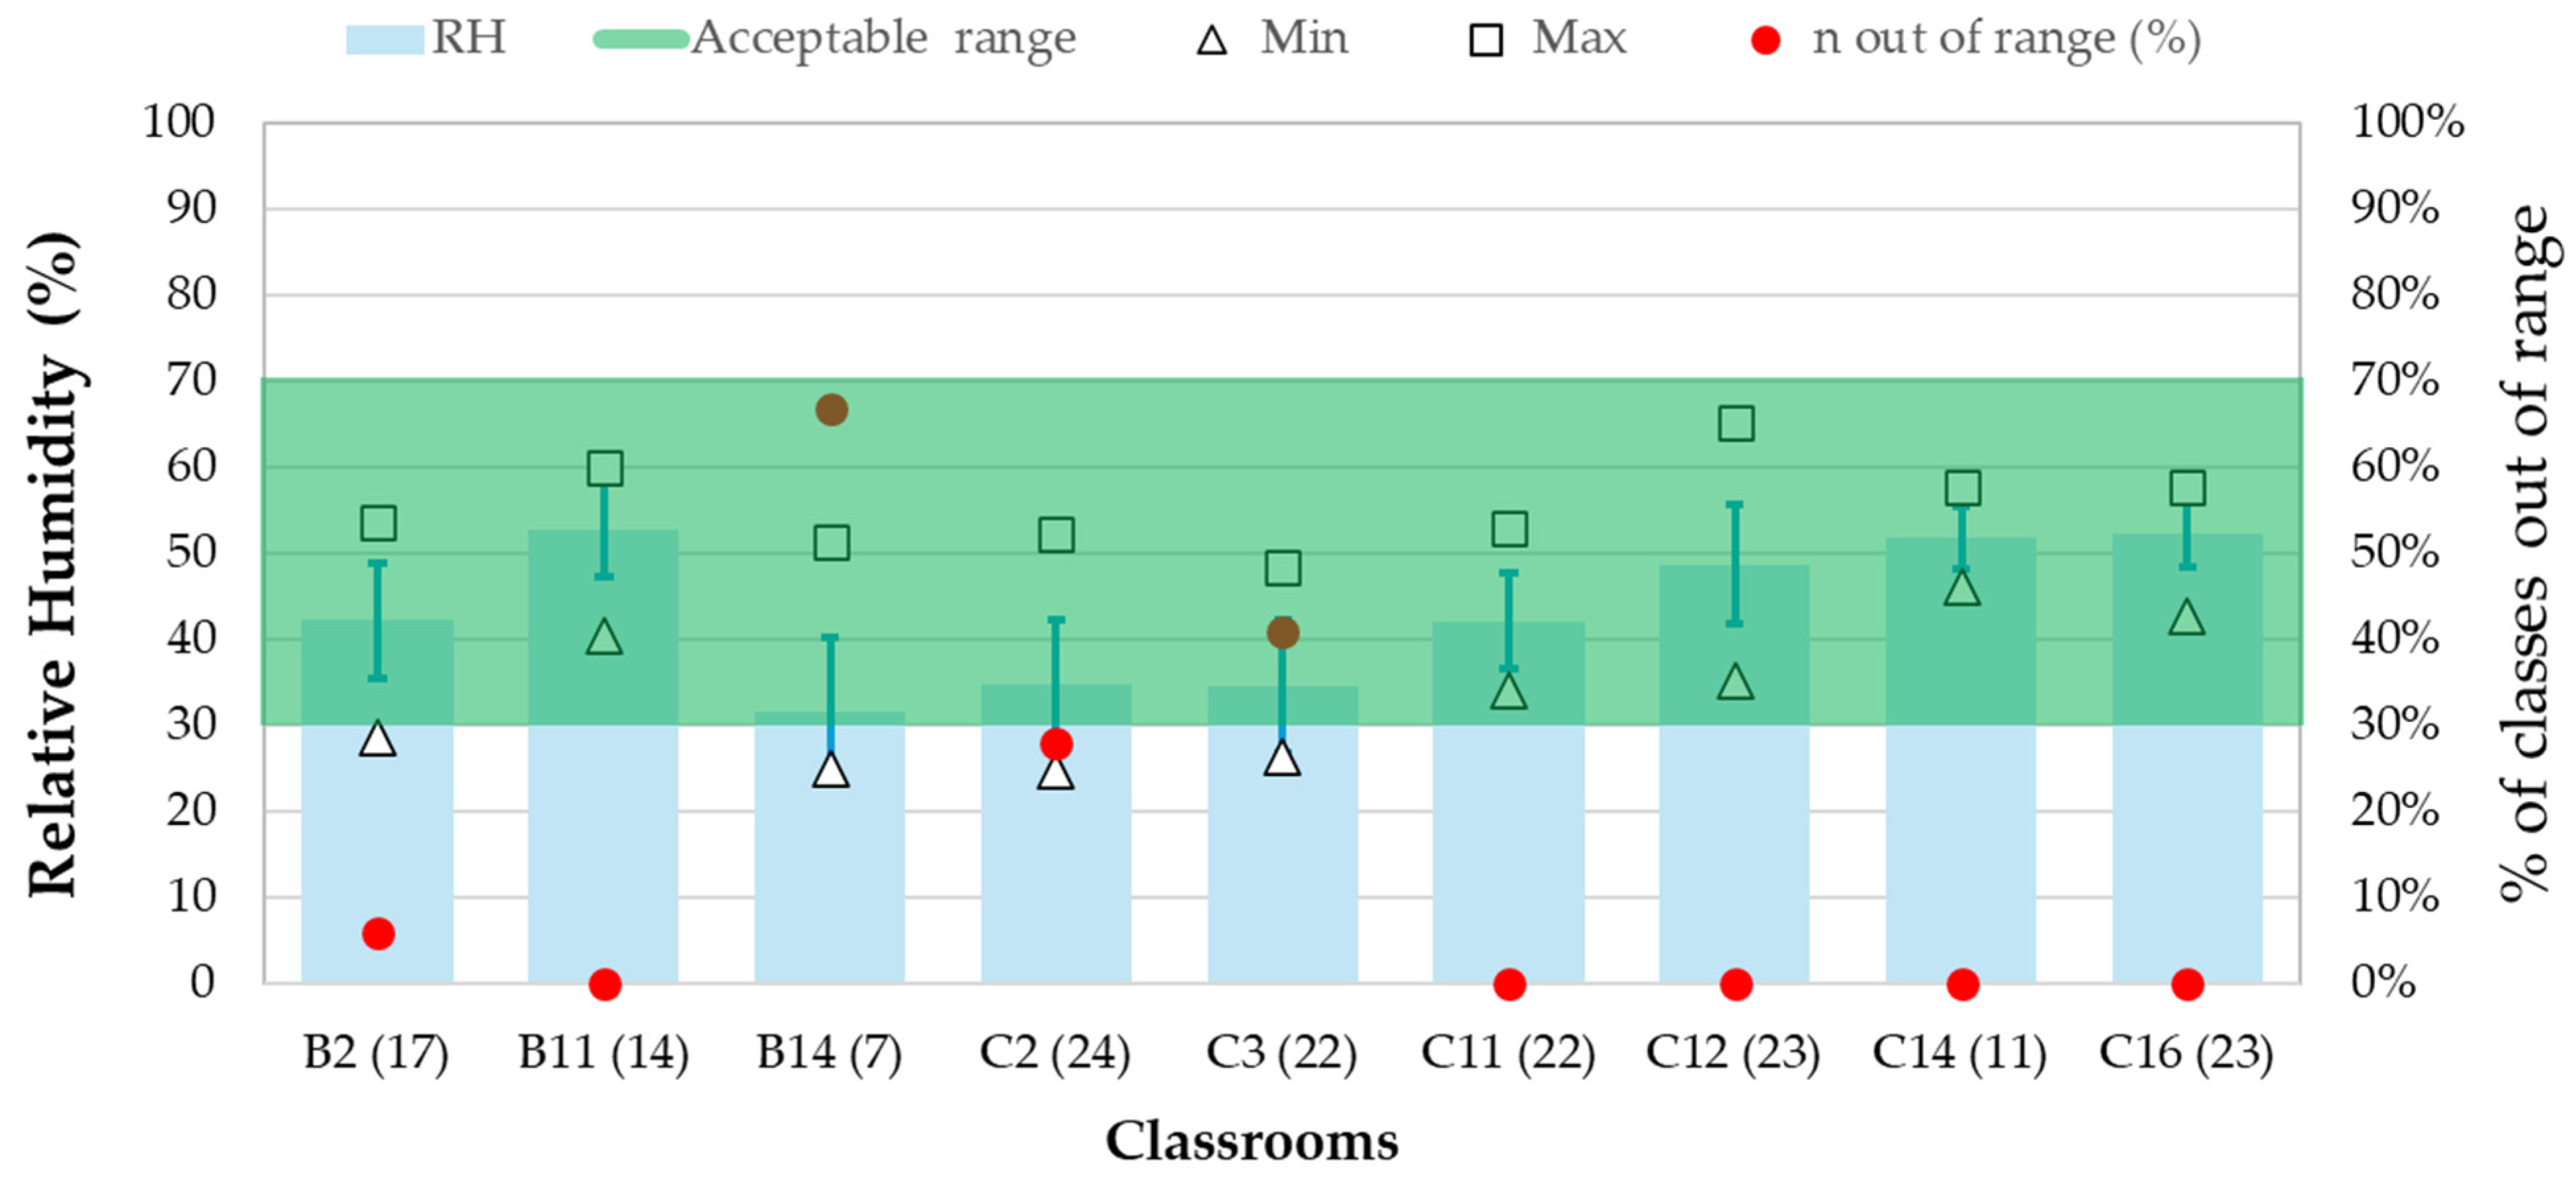
3.1.2. Relative Humidity

Figure 2 presents the mean RH levels in all the monitored classrooms. A mean value of 43.1 ± 9.9% was registered, ranging from 24.6 ± 0.6% (classroom B14, ninth monitored class) to 65.1 ± 0.6% (classroom C12, eighth monitored class). All classrooms had mean RH levels within the acceptable range of 30 to 70% as defined by ISO 7730 [29]. Overall, only 15% (25 out of 171) of the classes had mean RH levels outside the acceptable range.

3.1.3. Carbon Dioxide

Figure 3 presents the mean CO2 levels measured in each studied classroom, considering all the monitored classes. The overall mean CO2 level found in the 171 monitored classes was 1042 ± 449 ppm, ranging from 405 ± 17 ppm (classroom B14) to 2476 ± 433 ppm (classroom C12). Since CO2 is produced exclusively by occupants, this parameter often serves as an indicator of both ventilation quality and occupancy level [30].
The Portuguese legislation (Portaria n.º 138-G/2021, de 1 de julho) [31] establishes a CO2 limit value (LV) of 1250 ppm. A total of 46 of the 171 monitored classes (27%) had mean CO2 levels above this threshold. Fourteen classes were found to have CO2 levels consistently above the LV (from the start to the end of the class), showing the lack of ventilation and accumulation effect from previous classes, which shows that the break between classes was not taken as an opportunity to ventilate the classrooms effectively.
The classrooms that had higher mean CO2 levels during all their classes were B11 (1245 ± 430 ppm) and C14 (1255 ± 498 ppm), with 36% and 42% of their time above the established LV, respectively.
It is important to highlight that all classrooms had a central ventilation system; however, this was not working due to financial constraints. Additionally, the windows in the classrooms were not easy to open. If natural ventilation had been easy for the teachers to operate, the CO2 levels in the classrooms would probably have been lower, and a lower number of exceedances would have been identified.
High levels of CO2 in classrooms are a known fact, especially in countries where natural ventilation is usual. For instance, a study conducted in 50 classrooms in France identified a weekly mean of 1400 ± 400 ppm for naturally ventilated classrooms during the occupied period, while a weekly mean of 1000 ± 200 ppm was found for mechanically ventilated classrooms [32]. A study in the north of Portugal (Porto city, winter season) found that 86% of the 73 studied naturally ventilated classrooms had median CO2 levels above 1000 ppm [33]. In naturally ventilated Albanian schools, weekly average CO2 levels during classes ranged from 1286 to 5546 ppm (median 2776 ppm) during the cold season [30].

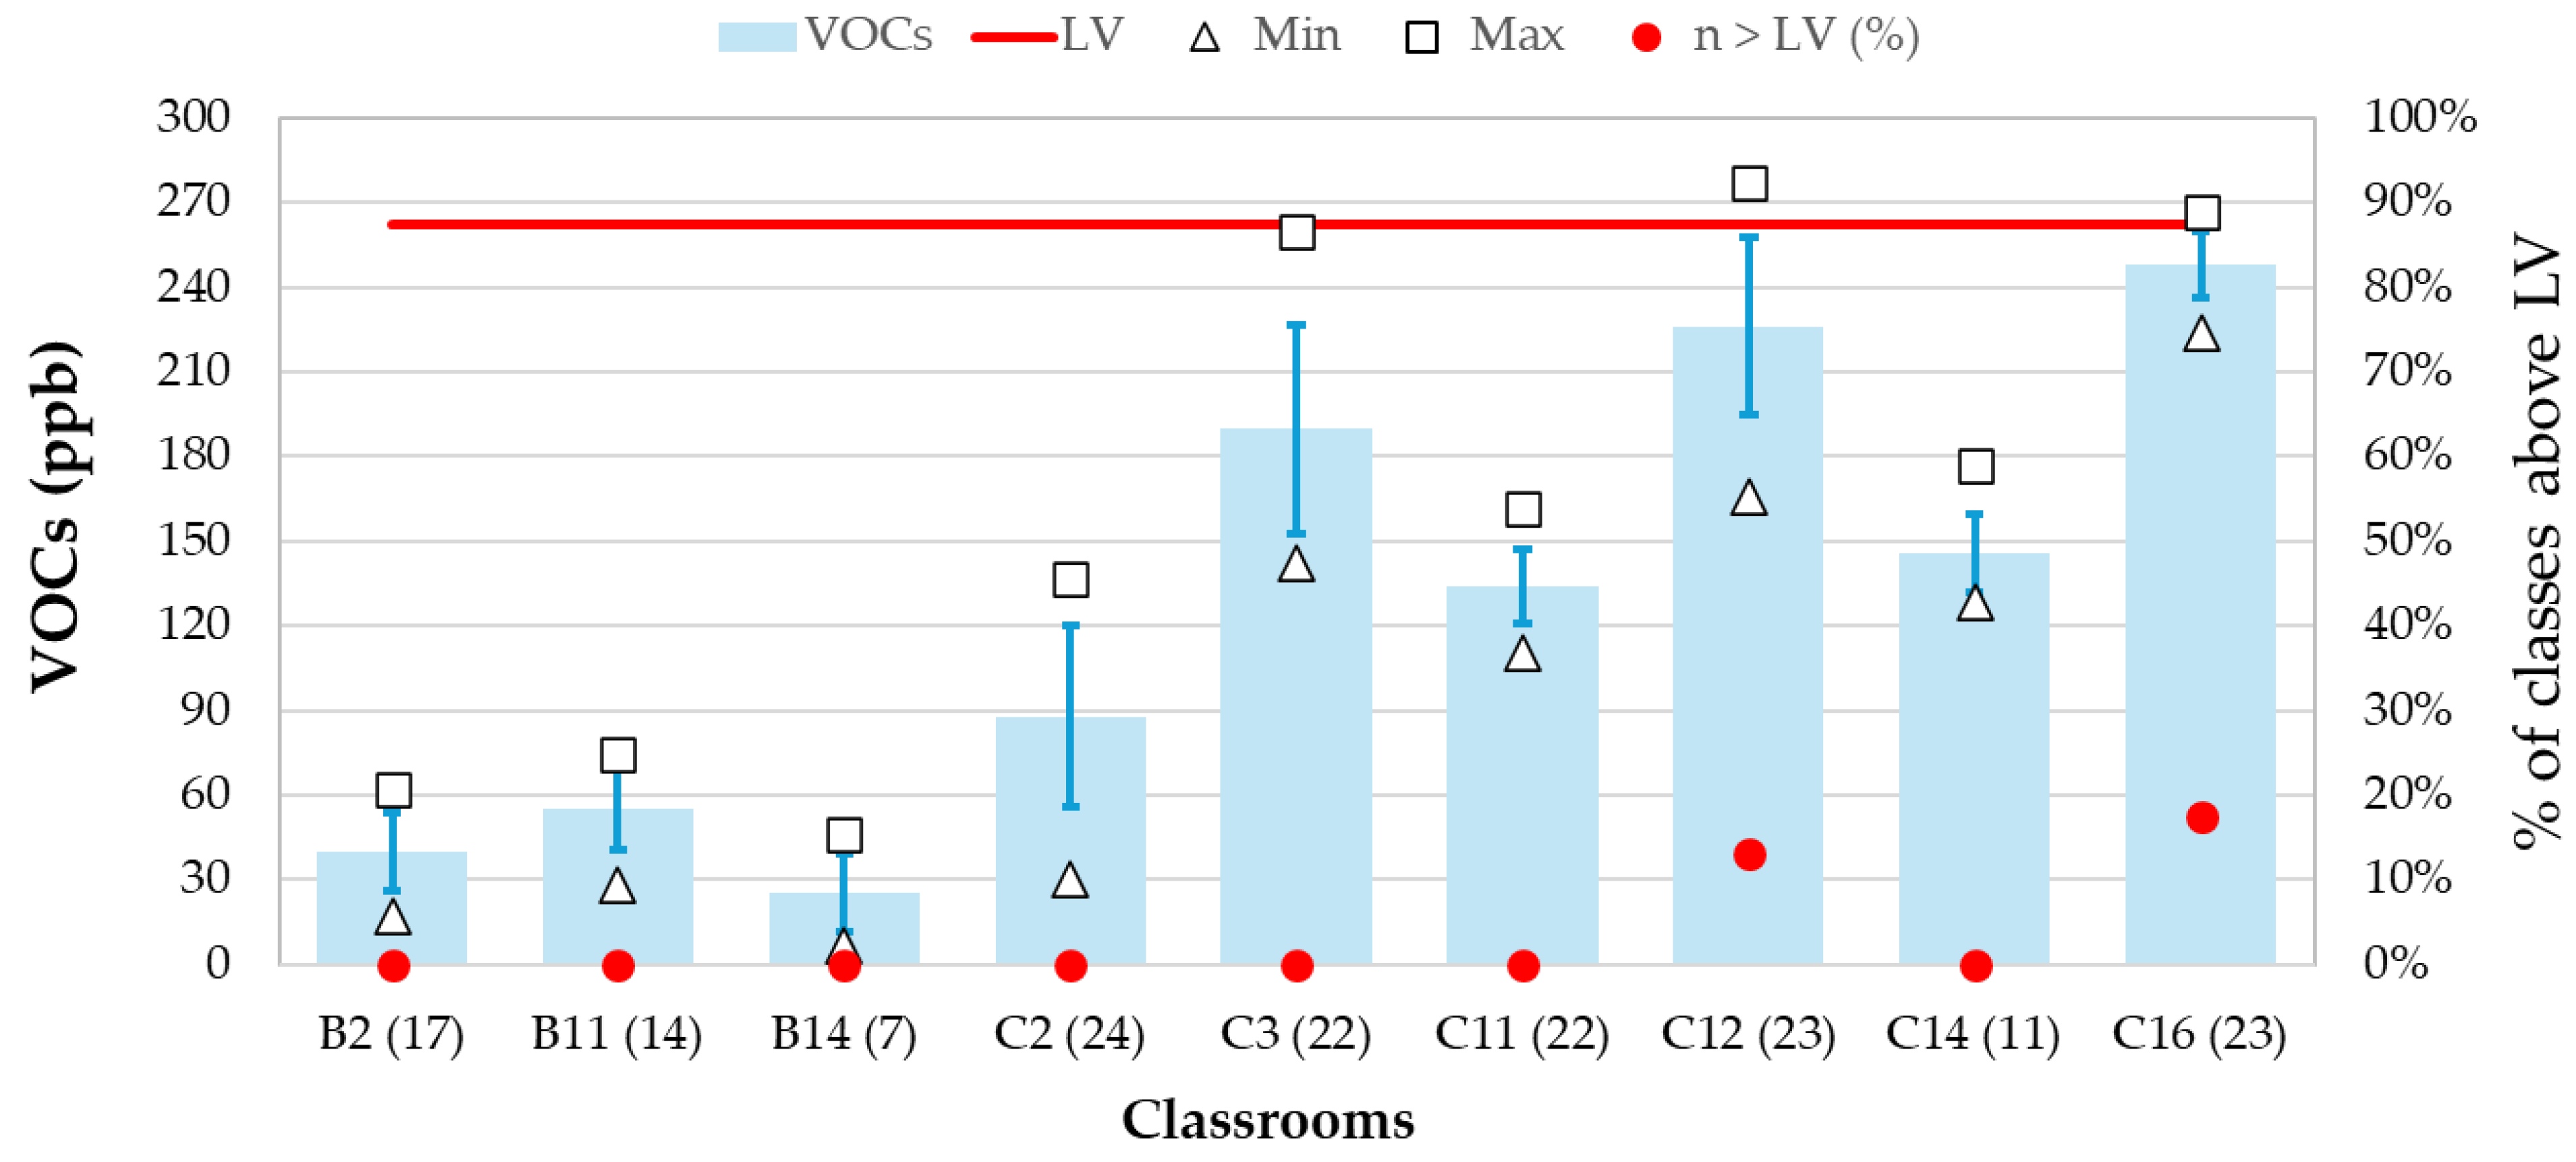
3.1.4. Total Volatile Organic Compounds

Figure 4 shows the mean VOC levels registered in all classrooms. All of them were below the limit value of 262 ppb (corresponding to 600 µg.m−3) established by Portuguese legislation [31]. The overall VOC mean, considering the 162 monitored classes, was 144 ± 79 ppb, with only 4% of the monitored classes having values above the established limit.

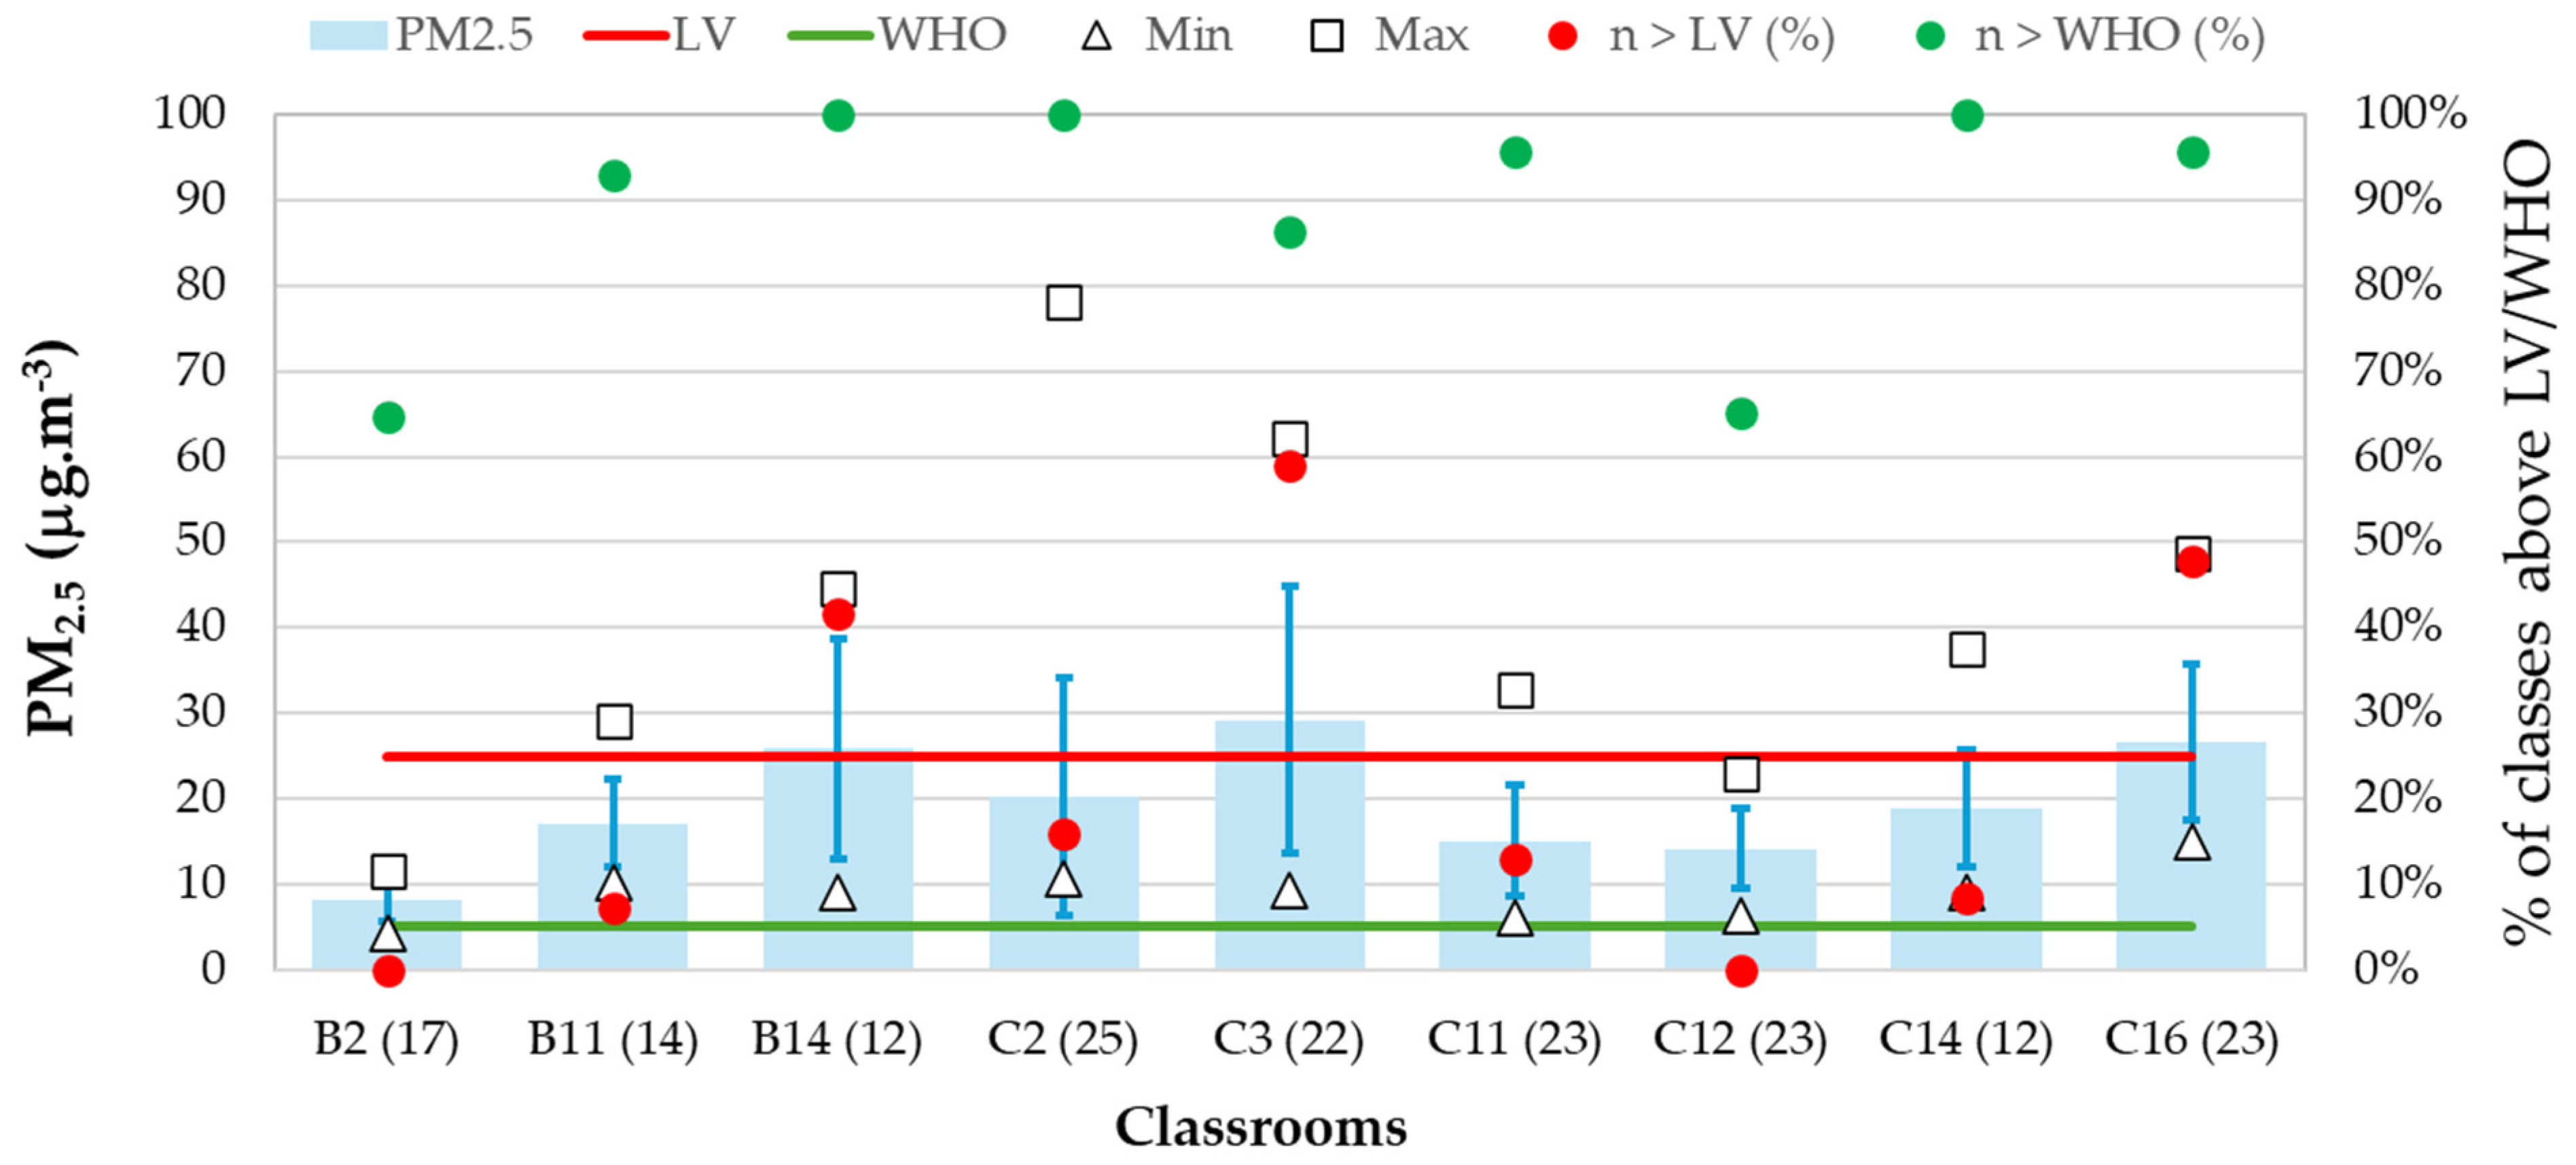
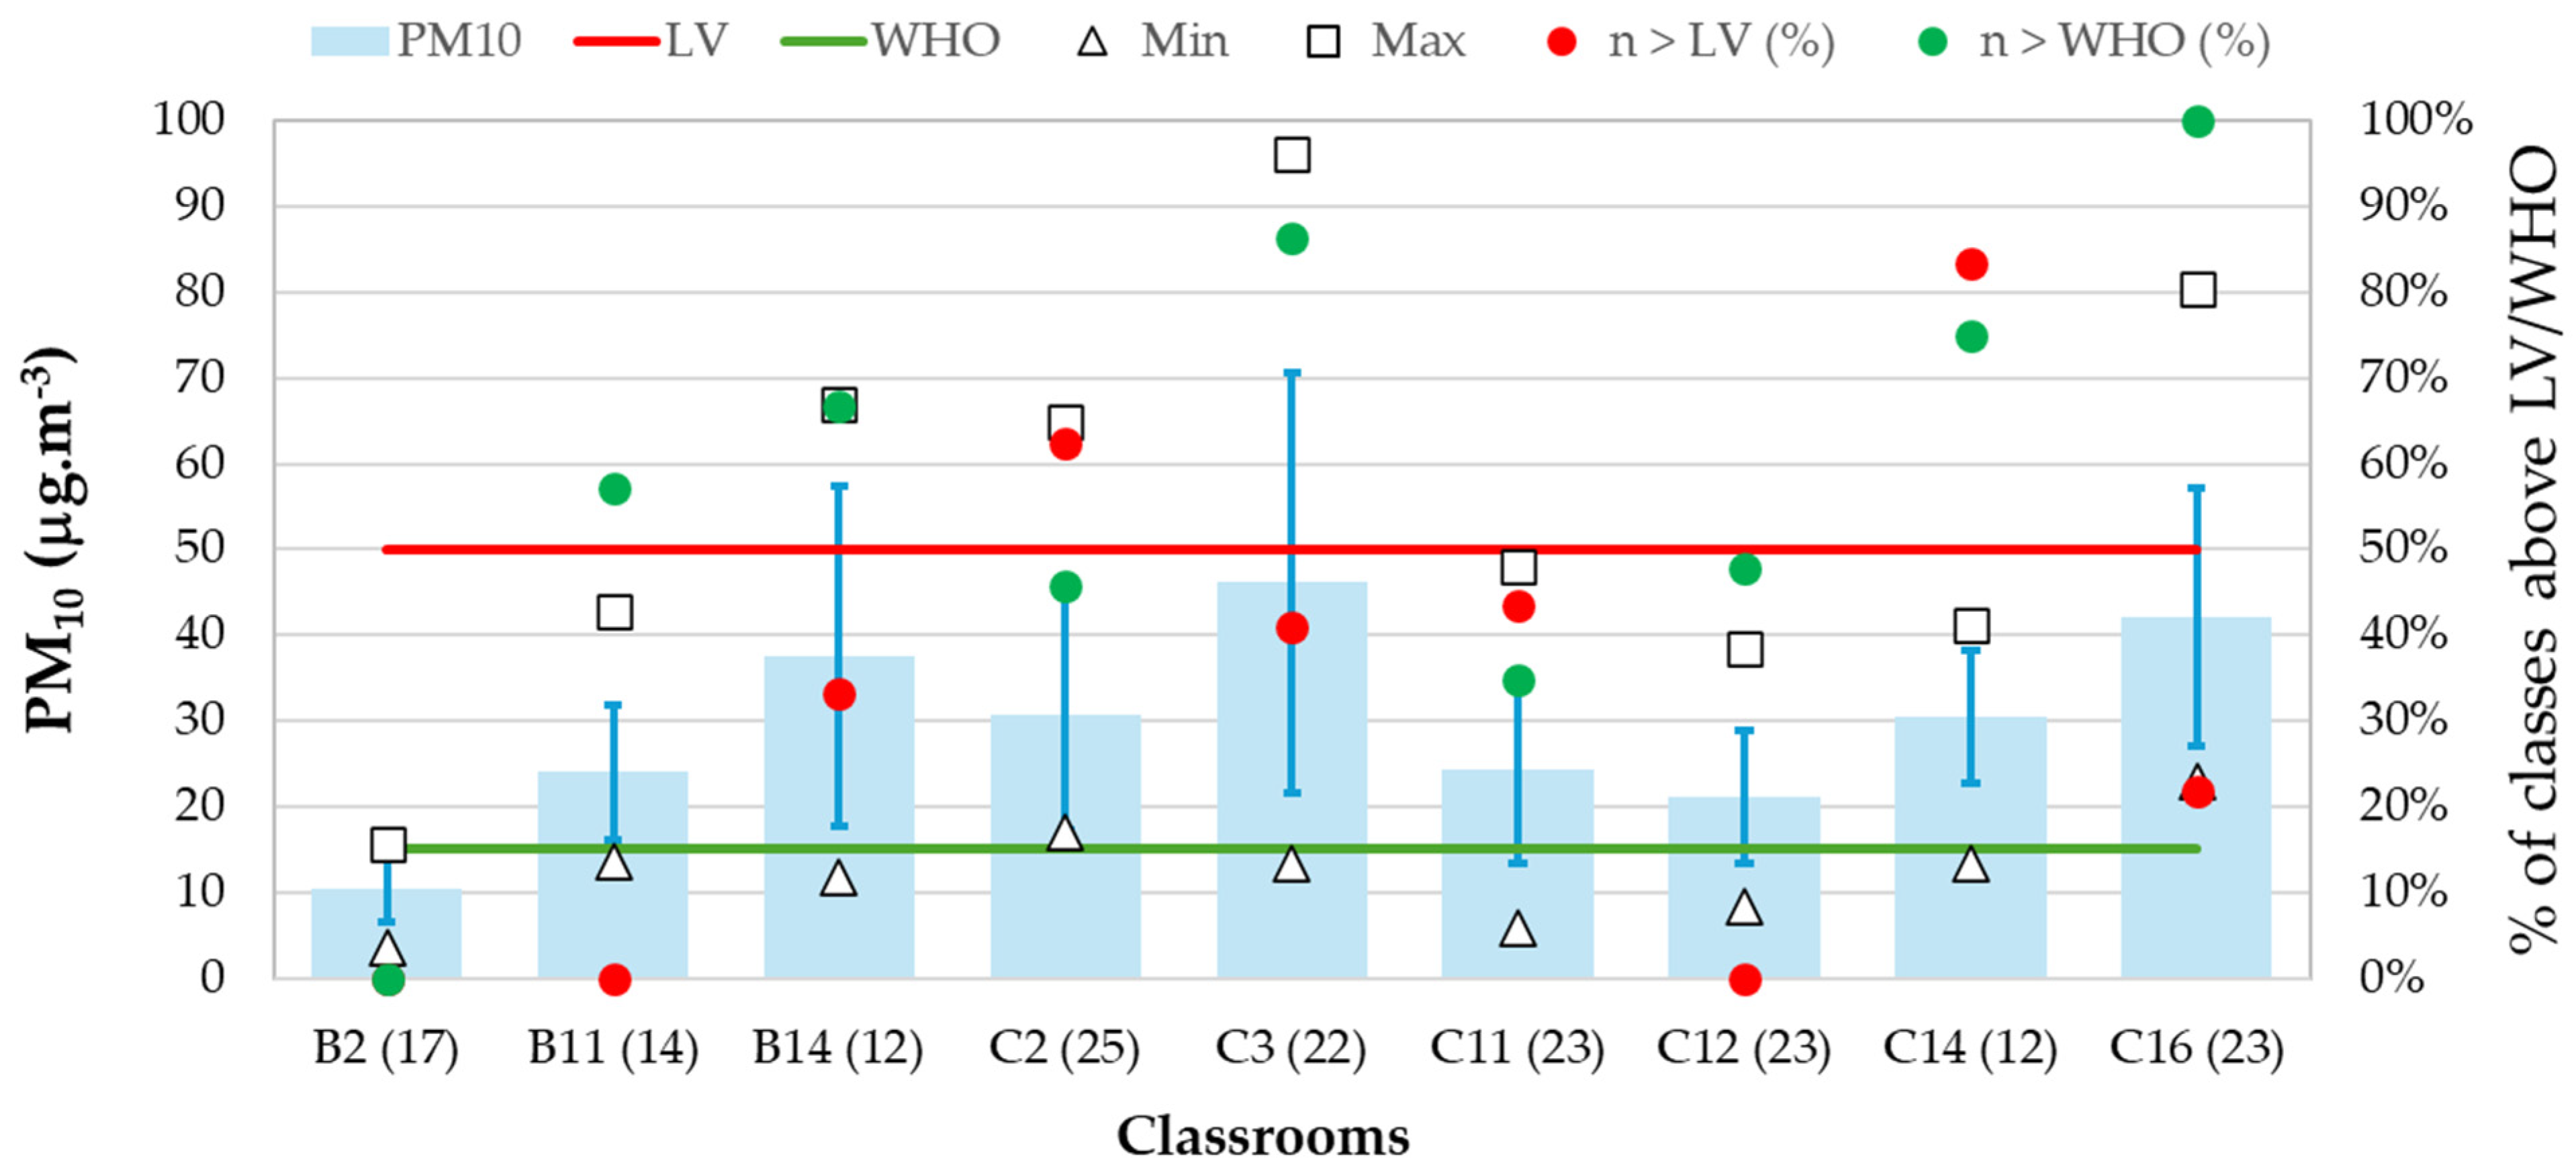
3.1.5. Particulate Matter

Figure 5 and Figure 6 indicate the mean levels of PM2.5 and PM10 in the studied classrooms, respectively.
Regarding PM2.5, three classrooms had mean PM2.5 levels above the limit value of 25 μg.m−3 established by the Portuguese legislation [31], namely, B14, C3, and C16.
The overall mean PM2.5 concentration was 19.6 ± 11.6 μg.m−3, ranging from 4.2 ± 0.0 μg.m−3 (classroom B2, seventh monitored class) to 78.0 ± 14.5 μg.m−3 (classroom C2, twenty-fourth monitored class). Considering the Portuguese legislation limit value, only 22% of the classes had mean PM2.5 levels above the threshold; however, if the air quality guideline value for PM2.5 defined by the World Health Organization (WHO) is considered (5 μg.m−3) [34], then only 2% of the monitored classes were below this value.
For PM10, all the studied classrooms had mean levels below the limit value of 50 μg.m−3 established by the Portuguese legislation [31], with an overall mean of 30.0 ± 17.4 μg.m−3, ranging from 3.5 ± 1.3 μg.m−3 (classroom B2, seventh monitored class) to 96.1 ± 2.9 μg.m−3 (classroom C3, twentieth monitored class).
Of the 170 monitored classes, only 12% had mean levels of PM10 above the limit value established by the Portuguese legislation; however, 82% of the classes had mean PM10 levels above the air quality guideline threshold of 15 μg.m−3 established by WHO [34].
The exposure and potential inhaled doses of PM in the classrooms, considering 8 h of classes per day, are described in Table 3. Mean exposures to PM10 and PM2.5 were estimated to be 156 ± 54 μg.m−3.h and 238 ± 89 μg.m−3.h, respectively.
The exposure levels found in the present study were slightly lower than those found in classrooms in Lisbon primary schools (Portugal), namely, 218 μg.m−3.h for PM2.5 and 404 μg.m−3.h for PM10 [4]. This difference may be due to the age of the students and the typical activities in primary schools (which include more physical activities that may cause resuspension of particles [4]) compared with classrooms where older students have classes, such as the ones in the present study. Additionally, local sources of PM can also explain higher exposure (especially PM10). This may be the reason for the higher exposure in Lisbon schools, where the use of chalk in the classrooms (contributing to PM10 exposure [4]) was identified, along with the impact of heavy local traffic (also contributing to PM2.5 exposure) that is known to be much higher in Lisbon (the capital of the country) than in inland Portuguese towns (with rural surroundings), such as the site where the studied school is located [35].

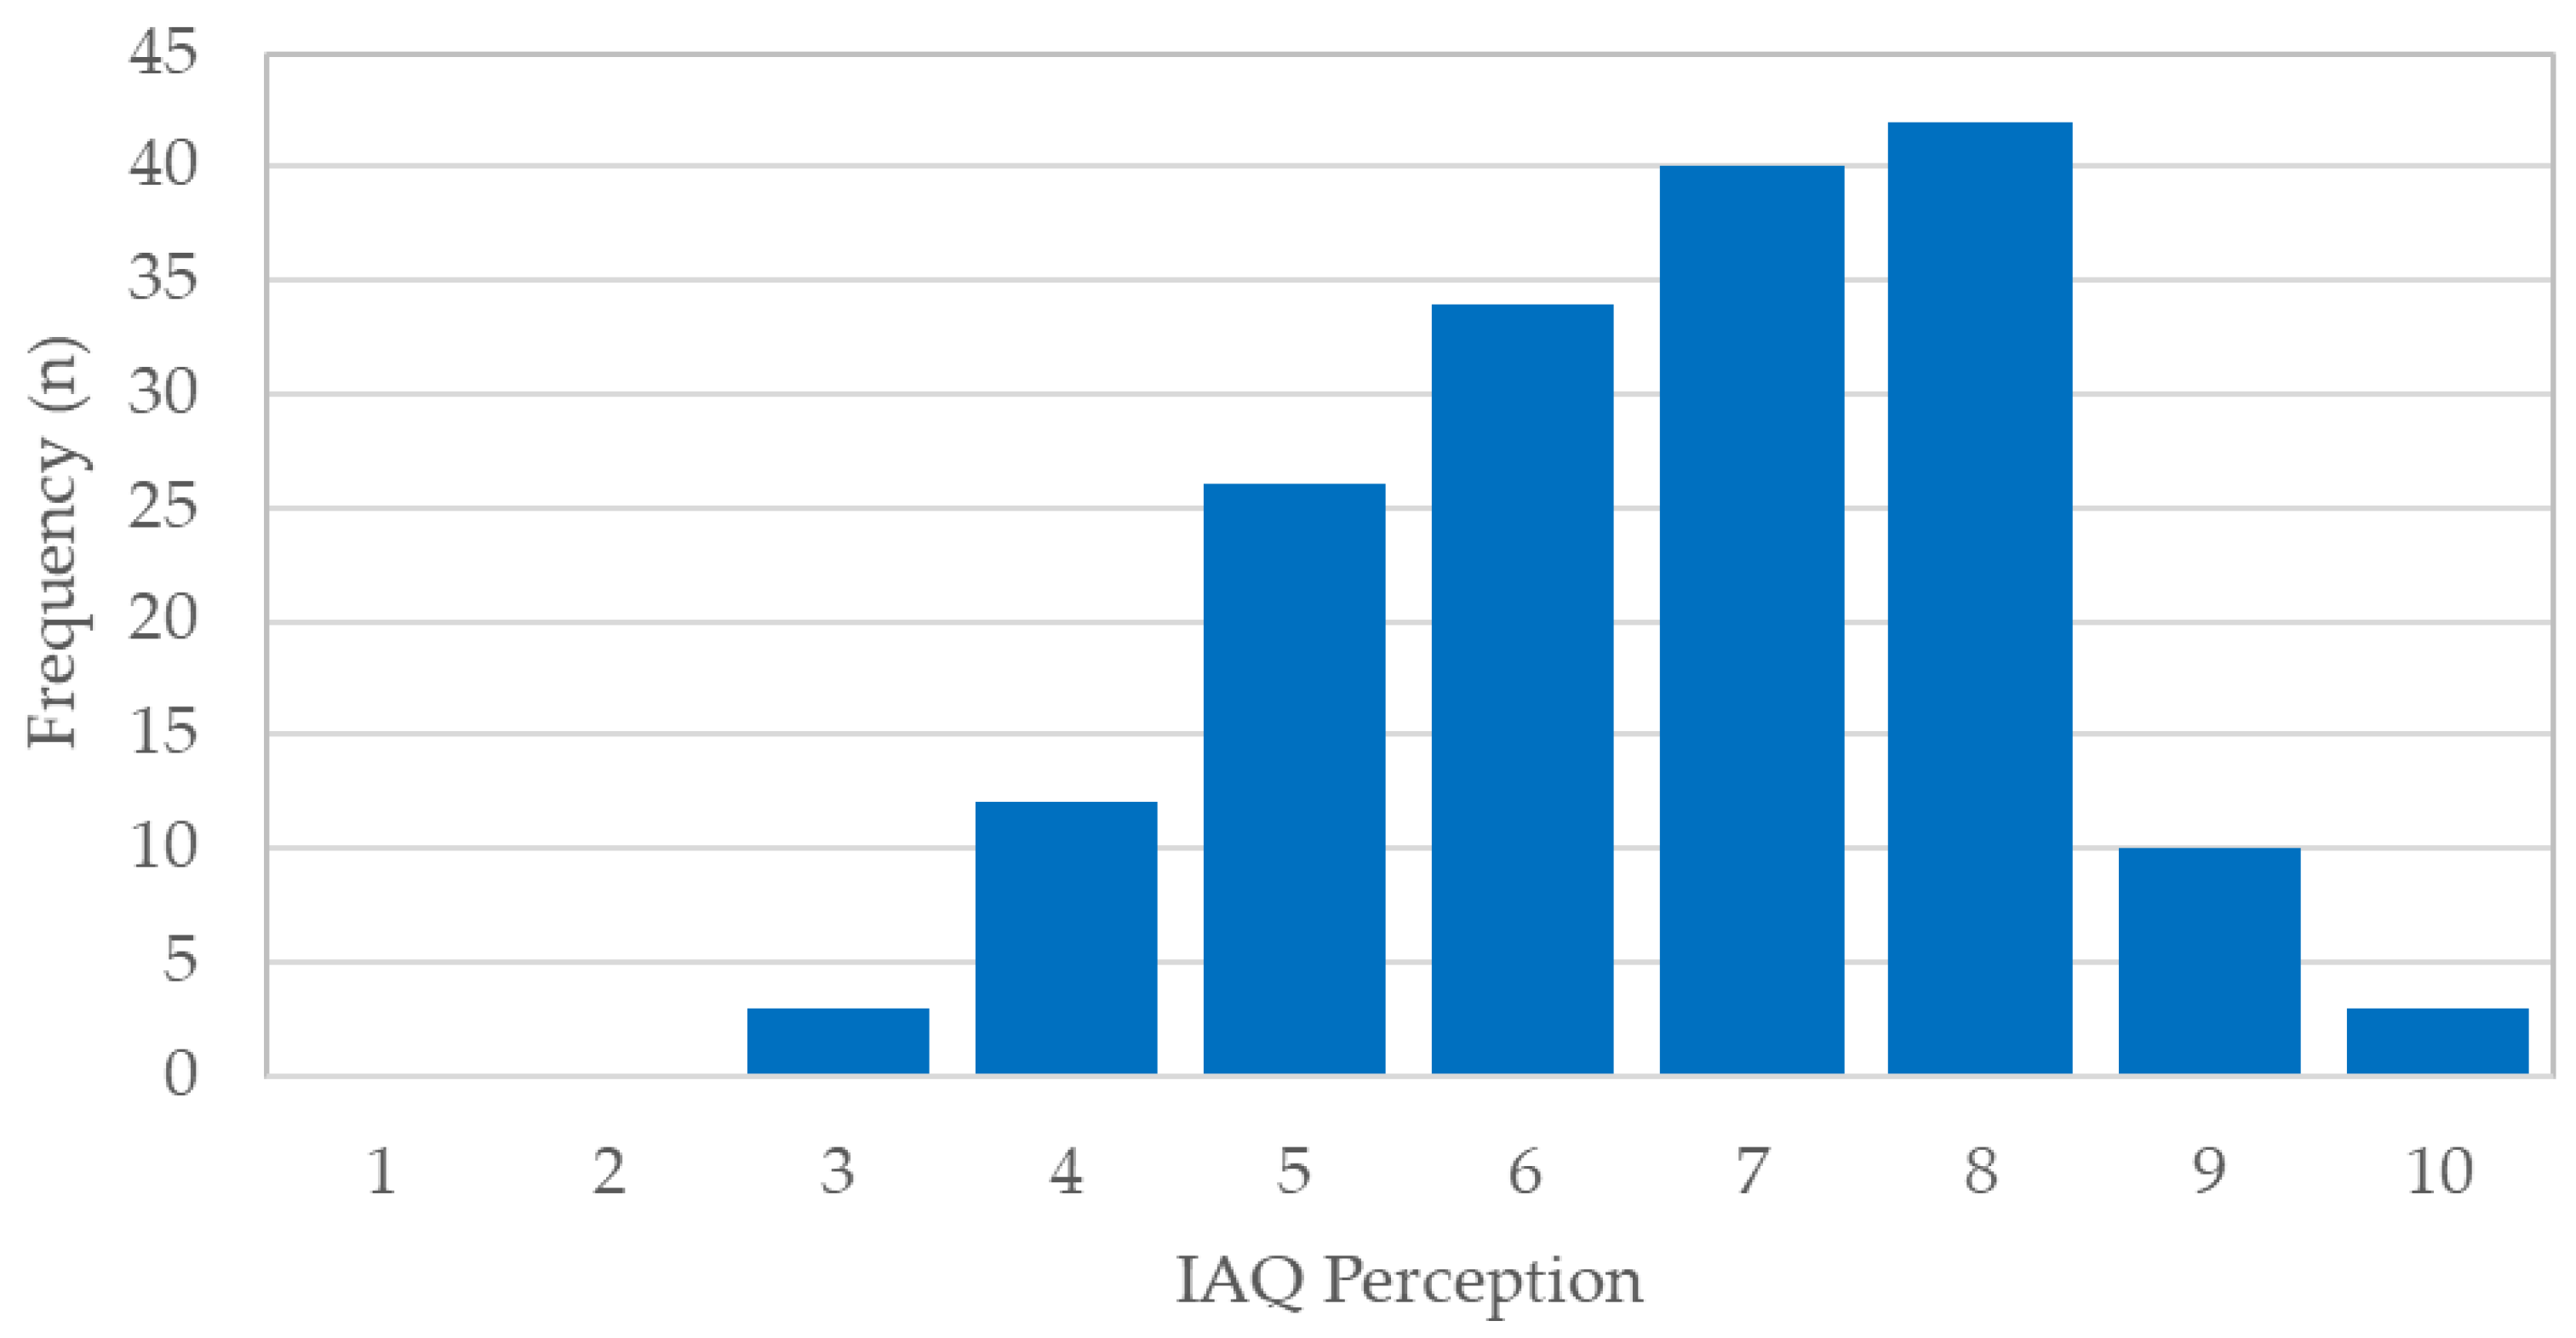
3.2. Indoor Air Quality Perception

Figure 7 provides an overview of the IAQ perception reported by the teachers in the studied classes (a total of 170). It can be seen that, in general, most teachers rated IAQ as being medium to good (76% of the attributed IAQ perception values were between 6 and 10). Table 4 summarises the mean levels of the IAQ parameters monitored for each perception category.

3.3. Spearman’s Correlation Between IAQ Perception and Environmental Parameters

Table 5 presents Spearman’s correlations between the IAQ perception indexes provided by the teachers for the 170 studied classes and the mean levels of the different environmental parameters. Only temperature had a significant negative impact on IAQ perception (Spearman’s rho of −0.225, p-value = 0.003), while the remaining parameters did not show any significant correlation. Overall, an increase in mean temperature during the class period caused a decrease in the teachers’ IAQ perception levels at the end of the class.

4. Discussion

The present study confirms that the use of monitoring tools based on low-cost sensors provides an extensive and successful survey in classrooms without having an impact on teaching activities.
Overall, as shown in Table 6, temperature was the parameter with the highest percentage of exceedances in all the studied classrooms (46%), followed by PM10 (32%) and then CO2 (27%).
Additionally, temperature was the only parameter that had a significant correlation with the teachers’ perception of IAQ during the classes. On the contrary, the remaining environmental pollutants, even when their levels were above the thresholds established by Portuguese legislation, did not cause a lower ranking of IAQ perception.
The findings of the present study, targeting the IAQ perceptions of teachers during classes, agree partially with the results of a study conducted in the UK [36], where children’s perception was assessed over a full year. In that study, 28 naturally ventilated classrooms in eight UK primary schools were studied, and 805 children were surveyed throughout the year regarding their perceptions of IAQ. It was found that their perceptions were affected by CO2 levels (during the non-heating season) and by the operative temperature (during the heating season); the latter result is similar to that of the present study.
A study conducted in office buildings in southern Brazil also concluded that the air quality perception of the occupants was influenced by factors other than CO2 [37], with a significant influence of thermal and humidity comfort on air quality satisfaction being identified.
A study conducted in Portugal revealed that people with more knowledge about air quality have a higher level of perception about it [38]. Therefore, awareness campaigns about IAQ targeting teachers may allow them to improve the factors affecting IAQ during classes, decreasing both their exposure and their students’ exposure to high levels of pollutants that may compromise their health and performance.
For instance, high CO2 levels are known to cause a reduction in cognitive performance in pupils and to lower students’ and teachers’ productivity [3]. Additionally, high CO2 levels are identified by the commonly called stuffy air; however, from the perspective of the occupants of the classrooms, it may go undetected, as was confirmed by the results of the present study, where high levels of CO2 were not associated with lower IAQ perception.
It is important to highlight some limitations of the present study and potential further work:
(i)
IAQ perception focused on the teachers’ perceptions and not on the students’ perspectives, which should also be evaluated. Considering that students tend to feel comfortable in indoor climates that are cooler than environments where adults feel thermally neutral [3], it would be relevant to assess their perceptions and identify potential associations with environmental parameters.
(ii)
This type of study should be performed throughout the academic year to understand the influence of seasons on IAQ perception and IAQ parameters (including ventilation).
(iii)
The impact of different ventilation typologies in the classrooms (natural and mechanical) on IAQ perception and IAQ levels should be studied.
(iv)
To evaluate the effective impact of an IAQ awareness campaign for teachers and students on the improvement or not of IAQ levels during classes and their perception.
Additionally, when mechanical ventilation systems are not properly working or when in naturally ventilated classrooms, the adoption of good ventilation practices would result in lower accumulation of air pollutants in classrooms, minimising the degradation of IAQ. The following measures can be included:
(i)
Ventilate the classrooms between classes by opening doors and windows during breaks (to avoid pollutant accumulation from one class to the next);
(ii)
Classrooms should be cleaned at the end of the day instead of in the morning before classes so that the decay of pollutants (particles and VOCs) can occur during nighttime;
(iii)
If outdoor meteorological conditions allow, always have some ventilation during classes by opening windows and/or doors.
Given the budget constraints faced by many schools, the recommendations provided in this study are designed as cost-effective solutions that can be practically implemented to improve IAQ without straining limited financial resources.
Nevertheless, if during classes teachers are aware that IAQ is getting degraded, they would actively act to improve ventilation in the classrooms by opening windows and/or doors; therefore, real-time monitoring of IAQ with indication of IAQ levels to teachers should be available in the classrooms. Moreover, specific training on IAQ, its impact on students’ well-being and performance, and strategies to improve it should also be provided to teachers so that they are conscious of IAQ and what should be done to improve it.

5. Conclusions

This study allowed the successful application of an IAQ monitoring strategy based on low-cost sensors using a multi-parameter approach to provide an understanding of IAQ levels in nine classrooms (totalling 171 classes). Additionally, using a simple IAQ perception index (1 to 10), it was possible to obtain the IAQ perceptions of the teachers.
Temperature was the only environmental parameter that was significantly associated with lower IAQ perception, which highlights that typical pollutants such as CO2 (which can be identified as stuffy air) do not contribute to teachers’ perceptions of IAQ. It is important to implement monitoring strategies that provide real-time information on pollutant levels, especially in naturally ventilated classrooms such as the ones evaluated in this study, considering the negative impacts that such air pollutants may have on health and performance. With this valuable information, teachers can make decisions based on reality and can act immediately to mitigate situations when levels are above established thresholds.

Supplementary Materials

The following supporting information can be downloaded at: https://www.mdpi.com/article/10.3390/atmos15121450/s1, Table S1: Information required for the teachers to fulfil during each monitored class (left) and expected answers from the teachers (guiding remarks for the teachers).

Author Contributions

Conceptualization, N.C.; Methodology, N.C., C.C., S.M. and M.F.; Software, C.C.; Validation, C.C.; Formal analysis, N.C., C.C. and C.A.G.; Investigation, N.C., S.M. and M.F.; Writing—original draft preparation, N.C.; Writing—review & editing, N.C., C.C., C.A.G. and M.F. All authors have read and agreed to the published version of the manuscript.

Funding

This research was supported by the Portuguese Foundation for Science and Technology (FCT, Portugal) through the project HypnosAir (PTDC/CTA-AMB/3263/2021, https://doi.org/10.54499/PTDC/CTA-AMB/3263/2021), contract 2021.00088.CEECIND (N. Canha, https://doi.org/10.54499/2021.00088.CEECIND/CP1651/CT0009), contract CEECINST/00043/2021/CP2797/CT0006 (M. Felizardo), PhD fellowship (S. Mendez, grant reference 2023.03202.BD), and financial support to C2TN/IST (UIDB/04349/2020 + UIDP/04349/2020).

Institutional Review Board Statement

The study was conducted in accordance with the Declaration of Helsinki, and approved by the Ethics Committee of Instituto Superior Técnico (protocol code 3/2023 and date of approval of 20 February 2023).

Informed Consent Statement

Informed consent was obtained from all subjects involved in the study.

Data Availability Statement

The original contributions presented in this study are included in the article/Supplementary Material. Further inquiries can be directed to the corresponding author(s).

Conflicts of Interest

The authors declare no conflicts of interest.

References

  1. Pulimeno, M.; Piscitelli, P.; Colazzo, S.; Colao, A.; Miani, A. Indoor Air Quality at School and Students’ Performance: Recommendations of the UNESCO Chair on Health Education and Sustainable Development & the Italian Society of Environmental Medicine (SIMA). Health Promot. Perspect. 2020, 10, 169–174. [Google Scholar] [CrossRef] [PubMed]
  2. Salthammer, T.; Uhde, E.; Schripp, T.; Schieweck, A.; Morawska, L.; Mazaheri, M.; Clifford, S.; He, C.; Buonanno, G.; Querol, X.; et al. Children’s Well-Being at Schools: Impact of Climatic Conditions and Air Pollution. Environ. Int. 2016, 94, 196–210. [Google Scholar] [CrossRef] [PubMed]
  3. Sadrizadeh, S.; Yao, R.; Yuan, F.; Awbi, H.; Bahnfleth, W.; Bi, Y.; Cao, G.; Croitoru, C.; de Dear, R.; Haghighat, F.; et al. Indoor Air Quality and Health in Schools: A Critical Review for Developing the Roadmap for the Future School Environment. J. Build. Eng. 2022, 57, 104908. [Google Scholar] [CrossRef]
  4. Faria, T.; Martins, V.; Correia, C.; Canha, N.; Diapouli, E.; Manousakas, M.; Eleftheriadis, K.; Almeida, S.M. Children’s Exposure and Dose Assessment to Particulate Matter in Lisbon. Build. Environ. 2020, 171, 106666. [Google Scholar] [CrossRef]
  5. Kumar, P.; Singh, A.B.; Arora, T.; Singh, S.; Singh, R. Critical Review on Emerging Health Effects Associated with the Indoor Air Quality and Its Sustainable Management. Sci. Total Environ. 2023, 872, 162163. [Google Scholar] [CrossRef]
  6. Osborne, S.; Uche, O.; Mitsakou, C.; Exley, K.; Dimitroulopoulou, S. Air Quality around Schools: Part I—A Comprehensive Literature Review across High-Income Countries. Environ. Res. 2021, 196, 110817. [Google Scholar] [CrossRef] [PubMed]
  7. Daisey, J.M.; Angell, W.J.; Apte, M.G. Indoor Air Quality, Ventilation and Health Symptoms in Schools: An Analysis of Existing Information. Indoor Air 2003, 13, 53–64. [Google Scholar] [CrossRef] [PubMed]
  8. Luther, M.B.; Horan, P.; Tokede, O. Investigating CO2 Concentration and Occupancy in School Classrooms at Different Stages in Their Life Cycle. Archit. Sci. Rev. 2018, 61, 83–95. [Google Scholar] [CrossRef]
  9. Fu, N.; Wei, P.; Jia, Y.; Zheng, X.; Guan, J. Indoor Volatile Organic Compounds in Densely Occupied Education Buildings of Four Universities: Target List, Concentration Levels and Correlation Analysis. Build. Environ. 2021, 191, 107599. [Google Scholar] [CrossRef]
  10. Son, Y.-S. A Review on Indoor and Outdoor Factors Affecting the Level of Particulate Matter in Classrooms of Elementary Schools. J. Build. Eng. 2023, 75, 106957. [Google Scholar] [CrossRef]
  11. Fisk, W.J. The Ventilation Problem in Schools: Literature Review. Indoor Air 2017, 27, 1039–1051. [Google Scholar] [CrossRef] [PubMed]
  12. Wargocki, P.; Porras-Salazar, J.A.; Contreras-Espinoza, S.; Bahnfleth, W. The Relationships between Classroom Air Quality and Children’s Performance in School. Build. Environ. 2020, 173, 106749. [Google Scholar] [CrossRef]
  13. Toyinbo, O. Indoor Environmental Quality, Pupils’ Health, and Academic Performance—A Literature Review. Buildings 2023, 13, 2172. [Google Scholar] [CrossRef]
  14. Saraga, D.Ε.; Querol, X.; Duarte, R.M.B.O.; Aquilina, N.J.; Canha, N.; Alvarez, E.G.; Jovasevic-Stojanovic, M.; Bekö, G.; Byčenkienė, S.; Kovacevic, R.; et al. Source Apportionment for Indoor Air Pollution: Current Challenges and Future Directions. Sci. Total Environ. 2023, 900, 165744. [Google Scholar] [CrossRef]
  15. Becerra, J.A.; Lizana, J.; Gil, M.; Barrios-Padura, A.; Blondeau, P.; Chacartegui, R. Identification of Potential Indoor Air Pollutants in Schools. J. Clean. Prod. 2020, 242, 118420. [Google Scholar] [CrossRef]
  16. Ródenas García, M.; Spinazzé, A.; Branco, P.T.B.S.; Borghi, F.; Villena, G.; Cattaneo, A.; Di Gilio, A.; Mihucz, V.G.; Gómez Álvarez, E.; Lopes, S.I.; et al. Review of Low-Cost Sensors for Indoor Air Quality: Features and Applications. Appl. Spectrosc. Rev. 2022, 57, 747–779. [Google Scholar] [CrossRef]
  17. Alsamrai, O.; Redel-Macias, M.D.; Pinzi, S.; Dorado, M.P. A Systematic Review for Indoor and Outdoor Air Pollution Monitoring Systems Based on Internet of Things. Sustainability 2024, 16, 4353. [Google Scholar] [CrossRef]
  18. Demanega, I.; Mujan, I.; Singer, B.C.; Anđelković, A.S.; Babich, F.; Licina, D. Performance Assessment of Low-Cost Environmental Monitors and Single Sensors under Variable Indoor Air Quality and Thermal Conditions. Build. Environ. 2021, 187, 107415. [Google Scholar] [CrossRef]
  19. Zagatti, E.; Russo, M.; Pietrogrande, M.C. On-Site Monitoring Indoor Air Quality in Schools: A Real-World Investigation to Engage High School Science Students. J. Chem. Educ. 2020, 97, 4069–4072. [Google Scholar] [CrossRef]
  20. Nalakurthi, N.V.S.R.; Abimbola, I.; Ahmed, T.; Anton, I.; Riaz, K.; Ibrahim, Q.; Banerjee, A.; Tiwari, A.; Gharbia, S. Challenges and Opportunities in Calibrating Low-Cost Environmental Sensors. Sensors 2024, 24, 3650. [Google Scholar] [CrossRef]
  21. Sá, J.P.; Chojer, H.; Branco, P.T.B.S.; Forstmaier, A.; Alvim-Ferraz, M.C.M.; Martins, F.G.; Sousa, S.I.V. Selection and Evaluation of Commercial Low-Cost Devices for Indoor Air Quality Monitoring in Schools. J. Build. Eng. 2024, 98, 110952. [Google Scholar] [CrossRef]
  22. Zhang, D.; Bluyssen, P.M. Actions of Primary School Teachers to Improve the Indoor Environmental Quality of Classrooms in the Netherlands. Intell. Build. Int. 2021, 13, 103–115. [Google Scholar] [CrossRef]
  23. Muelas, Á.; Remacha, P.; Pina, A.; Tizné, E.; El-Kadmiri, S.; Ruiz, A.; Aranda, D.; Ballester, J. Analysis of Different Ventilation Strategies and CO2 Distribution in a Naturally Ventilated Classroom. Atmos. Environ. 2022, 283, 119176. [Google Scholar] [CrossRef]
  24. Couto, M.A.G. Atlas Climático Ibérico–Temperatura do ar e Precipitação (1971–2000); Agência Estatal de Meteorologia de Espanha (AEMET) e Instituto Português do Mar e da Atmosfera, I.P. (IPMA): Madrid, Spain, 2011; ISBN 978-84-7837-079-5. [Google Scholar]
  25. Instituto Português do Mar e da Atmosfera (IPMA). Boletim Climático Portugal Continental—Maio 2023. Available online: https://www.ipma.pt/pt/media/noticias/documentos/2023/Boletim_clima_IPMA_Mai2023.pdf (accessed on 1 October 2024).
  26. Baptista, T.; Almeida-Silva, M.; Silva, D.; Diogo, C.; Canha, N. Indoor Air Quality Assessment in Grocery Stores. Appl. Sci. 2022, 12, 12940. [Google Scholar] [CrossRef]
  27. Ramos, J.; Belo, J.; Silva, D.; Diogo, C.; Almeida, S.M.; Canha, N. Influence of Indoor Air Quality on Sleep Quality of University Students in Lisbon. Atmos. Pollut. Res. 2022, 13, 101301. [Google Scholar] [CrossRef]
  28. Buonanno, G.; Giovinco, G.; Morawska, L.; Stabile, L. Tracheobronchial and Alveolar Dose of Submicrometer Particles for Different Population Age Groups in Italy. Atmos. Environ. 2011, 45, 6216–6224. [Google Scholar] [CrossRef]
  29. ISO 7730; Ergonomics of the Thermal Environment—Analytical Determination and Interpretation of Thermal Comfort Using Calculation of the PMV and PPD Indices and Local Thermal Comfort Criteria. International Organization for Standardization: Geneva, Switzerland, 2005.
  30. Hänninen, O.; Canha, N.; Kulinkina, A.V.; Dume, I.; Deliu, A.; Mataj, E.; Lusati, A.; Krzyzanowski, M.; Egorov, A.I. Analysis of CO2 Monitoring Data Demonstrates Poor Ventilation Rates in Albanian Schools during the Cold Season. Air Qual. Atmos. Health 2017, 10, 773–782. [Google Scholar] [CrossRef]
  31. Portaria n.o 138-G/2021. Portaria n.o 138-G/2021—Requisitos Para a Avaliação Da Qualidade Do Ar Interior Nos Edifícios de Comércio e Serviços. Diário República 2021, 1, 128.
  32. Canha, N.; Mandin, C.; Ramalho, O.; Wyart, G.; Ribéron, J.; Dassonville, C.; Hänninen, O.; Almeida, S.M.; Derbez, M. Assessment of Ventilation and Indoor Air Pollutants in Nursery and Elementary Schools in France. Indoor Air 2016, 26, 350–365. [Google Scholar] [CrossRef] [PubMed]
  33. Madureira, J.; Paciência, I.; Rufo, J.; Severo, M.; Ramos, E.; Barros, H.; de Oliveira Fernandes, E. Source Apportionment of CO2, PM10 and VOCs Levels and Health Risk Assessment in Naturally Ventilated Primary Schools in Porto, Portugal. Build. Environ. 2016, 96, 198–205. [Google Scholar] [CrossRef]
  34. WHO Global Air Quality Guidelines. Available online: https://apps.who.int/iris/handle/10665/345329 (accessed on 1 February 2022).
  35. Gama, C.; Relvas, H.; Lopes, M.; Monteiro, A. The Impact of COVID-19 on Air Quality Levels in Portugal: A Way to Assess Traffic Contribution. Environ. Res. 2021, 193, 110515. [Google Scholar] [CrossRef]
  36. Korsavi, S.S.; Montazami, A.; Mumovic, D. Perceived Indoor Air Quality in Naturally Ventilated Primary Schools in the UK: Impact of Environmental Variables and Thermal Sensation. Indoor Air 2021, 31, 480–501. [Google Scholar] [CrossRef]
  37. de Oliveira, C.C.; Rupp, R.F.; Ghisi, E. Assessment of Air Quality Perception and Its Effects on Users’ Thermal Comfort in Office Buildings. Science 2021, 3, 47. [Google Scholar] [CrossRef]
  38. Qian, X.; Xu, G.; Li, L.; Shen, Y.; He, T.; Liang, Y.; Yang, Z.; Zhou, W.W.; Xu, J. Knowledge and Perceptions of Air Pollution in Ningbo, China. BMC Public Health 2016, 16, 1138. [Google Scholar] [CrossRef] [PubMed]
Figure 1. Mean temperatures (blue bars) and their standard deviations monitored during classes in each studied classroom. The number in brackets represents the number of classes evaluated in each classroom. The triangle and square represent, respectively, the minimum and maximum mean values assessed in each classroom. The green area represents the acceptable range established by ISO 7730 [29], and the red dots correspond to the percentage of classes in which the mean values were outside the acceptable range.
Atmosphere 15 01450 g001
Figure 2. Mean RH values (blue bars) and standard deviations monitored during classes in each studied classroom. The number in brackets represents the number of classes evaluated in each classroom. The triangle and square represent, respectively, the minimum and maximum mean values assessed in each classroom. The green area represents the acceptable range established by ISO 7730 [29], and the red dots correspond to the percentage of classes in which the mean values were outside the acceptable range.
Atmosphere 15 01450 g002
Figure 3. Mean CO2 levels (blue bars) and standard deviations monitored in the studied classrooms. The number in brackets represents the number of classes evaluated in each classroom. The triangle and square represent, respectively, the minimum and maximum mean values assessed in each classroom. The red line represents the limit value of 1250 ppm established by Portuguese legislation [31], and the red dots correspond to the percentage of classes in which the mean values were above the limit value.
Atmosphere 15 01450 g003
Figure 4. Mean VOC levels (blue bars) and standard deviations monitored in the studied classrooms. The number in brackets represents the number of classes evaluated in each classroom. The triangle and square represent, respectively, the minimum and maximum mean values assessed in each classroom. The red line represents the limit value of 262 ppb established by the Portuguese legislation [31]. Red dots correspond to the percentage of classes in which the mean values were above the limit value.
Atmosphere 15 01450 g004
Figure 5. Mean PM2.5 levels (blue bars) and standard deviations monitored during the classes in each studied classroom. The number in brackets represents the number of classes evaluated in each classroom. The triangle and square represent, respectively, the minimum and maximum means assessed in each classroom. The red line represents the limit value of 25 μg.m−3 established by Portuguese legislation [31], and the red dots correspond to the percentage of classes with mean values above the limit value. The green line represents the air quality guideline of 5 µg.m−3 established by WHO [34], and the green dots correspond to the percentage of classes with mean values above this threshold.
Atmosphere 15 01450 g005
Figure 6. Mean PM10 levels (blue bars) and standard deviations monitored during the classes in each studied classroom. The number in brackets represents the number of classes evaluated in each classroom. The triangle and square represent, respectively, the minimum and maximum means assessed in each classroom. The red line represents the limit value of 50 μg.m−3 established by the Portuguese legislation [31] and the red dots correspond to the percentage of classes with mean values above the limit value. The green line represents the air quality guideline of 15 µg.m−3 established by WHO [34], and the green dots correspond to the percentage of classes with mean values above this threshold.
Atmosphere 15 01450 g006
Figure 7. Histogram of the IAQ perception (ranging from 1, representing “very bad IAQ”, to 10, representing “very good IAQ”) of teachers during the studied 170 classes.
Atmosphere 15 01450 g007
Table 1. Intercomparison results between MBs and the calibrated instruments for all the studied parameters. RMSE stands for root mean square error and Range REF stands for the range of the parameter as measured by the calibrated equipment (CAL).
Monitoring UnitParameterUnitmbR2RMSEFrequencyRange CALn PointsRatio MB/CAL
AirQ1PM2.5µg.m−32.1931.0060.6734.05 min1.3–43.110050.37
PM10µg.m−34.202−5.5520.6166.65 min1.7–102.910050.43
CO2ppm1.014−27.3100.997325 min400–232715301.02
VOCsppb0.320−67.0740.443462.45 min20–20012905.05
T°C1.284−10.4310.8613.15 min15.3–27.514931.13
RH%1.164−3.2320.9084.45 min26.4–61.915301.09
AirQ2PM2.5µg.m−32.0820.7280.7154.55 min1.3–43.113060.33
PM10µg.m−33.527−4.6850.97525.65 min1.7–262.711020.42
CO2ppm0.992−23.9070.997395 min400–232715301.04
VOCsppb0.370−36.3390.525294.65 min63–18312023.64
T°C1.254−9.3890.8932.95 min15.3–27.514811.12
RH%1.159−2.4780.9164.85 min26.4–61.915301.10
AirQ3PM2.5µg.m−31.7550.6980.7193.95 min1.3–43.111100.50
PM10µg.m−32.653−3.2670.98122.25 min1.7–262.712930.45
CO2ppm1.015−74.8470.997695 min400–232715281.09
VOCsppb0.315−97.2820.417562.55 min63–20811745.91
T°C1.260−9.6110.9023.05 min15.3–27.514161.12
RH%1.234−6.8600.8954.25 min26.4–61.915281.07
Table 2. Summary of the total monitored classes per classroom, including the mean number of students attending and the mean IAQ perception reported by the teachers.
ClassroomNumber of Evaluated Classes Mean Number of Students per Studied ClassMean Age of Students Attending ClassesMean IAQ Perception
of Teachers
(1–10)
B21716168.1
B111423165.4
B141216165.7
C22513177.2
C32219166.6
C112314145.3
C122315167.7
C141219187.3
C162319166.1
Table 3. Exposure to PM10 and PM2.5 and corresponding potential inhaled doses during classes in the studied classrooms.
PM Concentration, Cj (µg.m−3)Time, tj (h)Exposure to PM (µg.m−3.h)Potential Inhaled Dose (µg)
ClassroomPM2.5PM10PM2.5 PM10PM2.5PM10
B28.210.58.0668429.537.9
B1117.124.18.013719361.586.8
B1425.937.68.020730193.2135.4
C220.330.88.016224772.9111.0
C329.246.18.0234369105.2166.1
C1115.024.38.012019454.187.4
C1214.221.28.011317051.076.4
C1418.830.58.015124467.8109.7
C1626.642.08.021233695.6151.3
Mean ± SD19.5 ± 6.829.7 ± 11.1 156 ± 54238 ± 8970.1 ± 24.4107 ± 40
Table 4. Monitored mean levels of IAQ parameters for each perception category (as perceived by teachers in the studied classes).
IAQ Perception Temperature
(°C)
Relative Humidity
(%)
CO2
(ppm)
VOCs
(ppb)
PM2.5
(μg.m−3)
PM10
(μg.m−3)
1------
2------
327.7 ± 2.040.7 ± 10.11070 ± 350167 ± 7229.0 ± 3.245.1 ± 3.9
426.8 ± 2.646.4 ± 6.01030 ± 450116 ± 6013.0 ± 5.619.1 ± 8.8
526.0 ± 1.742.8 ± 10.31090 ± 410136 ± 8422.8 ± 14.532.0 ± 14.5
625.5 ± 1.741.2 ± 10.8960 ± 300139 ± 8122.1 ± 12.234.2 ± 19.1
725.1 ± 1.745.1 ± 9.81180 ± 580161 ± 6821.1 ± 12.533.5 ± 19.5
825.3 ± 1.641.8 ± 9.6970 ± 440126 ± 8817.3 ± 9.627.3 ± 17.2
925.4 ± 2.048.0 ± 6.71010 ± 430178 ± 9511.6 ± 5.117.0 ± 8.9
1024.2 ± 0.736.5 ± 15.71000 ± 46087 ± 6017.6 ± 2.430.5 ± 4.5
Table 5. Spearman’s correlations between IAQ perception and the environmental parameters monitored in the studied classrooms. Bold values represent significant correlations, with p-value < 0.05.
Environmental Parameters
Spearman ParametersTRHCO2VOCsPM2.5PM10
IAQ Perceptionρ−0.225−0.001−0.0730.031−0.1460.119
p-value0.0030.9910.3460.6890.0570.122
n170170170169170169
Table 6. Percentage of exceedances of the different monitored environmental parameters in the studied classrooms (relative to Portuguese legislation).
Environmental Parameters
ClassroomsTRHVOCsCO2PM2.5PM10
B235%6%0%29%0%0%
B1143%0%0%36%7%0%
B1450%67%0%8%42%33%
C240%28%0%8%16%63%
C336%41%0%14%59%41%
C1187%0%0%26%13%43%
C1243%0%13%39%0%0%
C1442%0%0%42%8%83%
C1635%0%17%43%48%22%
Mean exceedances46%16%3%27%21%32%
Disclaimer/Publisher’s Note: The statements, opinions and data contained in all publications are solely those of the individual author(s) and contributor(s) and not of MDPI and/or the editor(s). MDPI and/or the editor(s) disclaim responsibility for any injury to people or property resulting from any ideas, methods, instructions or products referred to in the content.

