1. Introduction
Neighborhood characteristics have been associated with various aspects of quality of life, influencing health outcomes, social cohesion, and cognitive development. Environmental factors, such as air pollution from road traffic, have been linked to increased morbidity and mortality [
1,
2,
3,
4], while access to green spaces promotes social inclusion and supports physical and mental health [
5,
6,
7]. These associations are critical as recent research has increasingly highlighted the relationship between neighborhood environments and academic performance—a commonly used proxy for cognitive functioning. Studies indicate that environmental exposures in children’s neighborhoods can affect cognitive development, influencing outcomes like memory, attention, and general academic achievement [
8,
9,
10,
11].
Green spaces around schools and residential areas are increasingly recognized for their potential to support cognitive and academic outcomes. Exposure to natural environments has been associated with improvements in cognitive functions, such as attention and memory, which are essential for academic success [
9,
12]. The mechanisms proposed for these effects include enhanced air quality due to pollutant-filtering vegetation, reduced exposure to noise, and psychological benefits from increased interaction with nature. For instance, the presence of green spaces is thought to alleviate stress, provide restorative environments, and even facilitate physical activity, which collectively support cognitive function and readiness to learn [
13,
14]. Consequently, many studies report positive associations between green space exposure and academic performance in various age groups, with stronger effects observed in younger children, who may be particularly susceptible to their surrounding environments [
15,
16].
The density of roads near homes and schools, often a proxy for traffic-related air and noise pollution, is another critical neighborhood characteristic affecting cognitive performance. High road density has been associated with poorer air quality, increased levels of noise, and heightened stress—all of which can negatively influence learning environments and academic performance [
8,
17]. Studies have shown that air pollutants, especially particulate matter (PM) and nitrogen dioxide (NO
2), can impact neurodevelopment and are linked to cognitive decline in children [
18,
19]. Additionally, chronic exposure to noise pollution from nearby traffic can lead to difficulties in concentration, heightened stress levels, and sleep disturbances, which collectively hinder academic performance [
20,
21]. Therefore, examining the road density in proximity to both homes and schools provides insights into how urban infrastructure might impose cognitive and academic challenges for children.
Another environmental characteristic is related to wildfires. Wildfire exposure is increasingly relevant due to its growing frequency and impact on air quality, particularly in regions like Brazil where seasonal fires are prevalent. Wildfire smoke, rich in fine particulate matter (PM
2.5), has been shown to detrimentally affect air quality, which can impair respiratory health and, by extension, cognitive function and learning abilities [
22,
23,
24]. The association between wildfire exposure and cognitive health outcomes is still emerging, but recent studies suggest that prolonged exposure to wildfire smoke can lead to increased stress and adverse neuropsychological effects in children, potentially affecting their academic performance [
25]. This makes it essential to examine wildfire exposure as an atmospheric factor impacting educational outcomes in students, especially those in wildfire-prone areas.
Studying the impact of neighborhood characteristics on academic performance often involves complex data structures with multiple levels of influence. Student academic performance is not only affected by individual-level factors but also by school- and neighborhood-level variables. To account for this hierarchical data structure, many studies employ multilevel or mixed-effects regression models, enabling the inclusion of random effects to capture variations across groups, such as schools or neighborhoods [
26]. Mixed-effects models are particularly valuable for this type of research because they accommodate within-group correlations—such as similarities among students within the same school—and can control for unobserved heterogeneity between schools [
26]. This approach enhances the accuracy of the estimates by accounting for nested data and by adjusting for potential confounding factors across multiple levels.
The previous research has successfully employed mixed-effects regression models to assess the influence of environmental factors, such as green space exposure and traffic pollution, on cognitive outcomes and academic performance. For example, Dadvand et al. (2015) utilized a mixed-effects model to assess how green spaces around homes and schools relate to academic outcomes, finding that green space exposure was positively associated with cognitive development in children [
9]. Similarly, studies on the impact of road density on health outcomes have applied mixed-effects models to account for variations across neighborhoods and the differing exposure levels between schools and homes [
17,
19]. However, one limitation of mixed-effects models is their sensitivity to model specifications, including the choice of random intercepts and slopes. Moreover, these models require careful consideration of confounding variables as unmeasured neighborhood or school characteristics can introduce bias if not properly controlled [
17].
Despite the clear importance of neighborhood characteristics in shaping academic outcomes, there is a limited body of literature that considers the combined effects of multiple environmental factors, especially green spaces, road density, and wildfire exposure. Most studies focus on a single environmental factor, often only around either the school or the home, but rarely both. One notable exception is Dadvand et al. (2015), who assessed green spaces around both homes and schools, although they did not account for other key environmental factors, such as roads or wildfires, which may also influence cognitive performance [
9].
This study builds on the previous research by applying a mixed-effects regression model to examine not just a single environmental factor but multiple neighborhood characteristics—green spaces, road density, and wildfire exposure—simultaneously and across both school and home locations. This comprehensive approach enables a more detailed understanding of how diverse environmental conditions interact to influence academic performance. By implementing random intercepts and slopes, we can account for individual-level variability in academic performance while controlling for school-specific and temporal factors. Our approach addresses the limitations in the literature by expanding the focus beyond green spaces to include both road infrastructure and wildfire exposure, thus providing a more holistic assessment of the environmental impacts on the learning outcomes in students within the Federal District, Brazil.
2. Materials and Methods
2.1. Study Area
The study was conducted in the Federal District (FD) in Brazil, where the city of Brasilia, the capital of Brazil, is located. The FD has an estimated population of 3 million inhabitants (about 700,000 are children and adolescents), with a population density of more than 520 inhabitants/km2. According to data from the Brazilian Institute of Geography and Statistics (IBGE), there were 684 schools in the Distrito Federal, Brazil, as of 2021. In terms of the number of students, around 447,000 students were enrolled in schools in the Distrito Federal in 2020. This represents approximately 1.9% of the total number of students enrolled in Brazil, which was around 47.3 million in the same year.
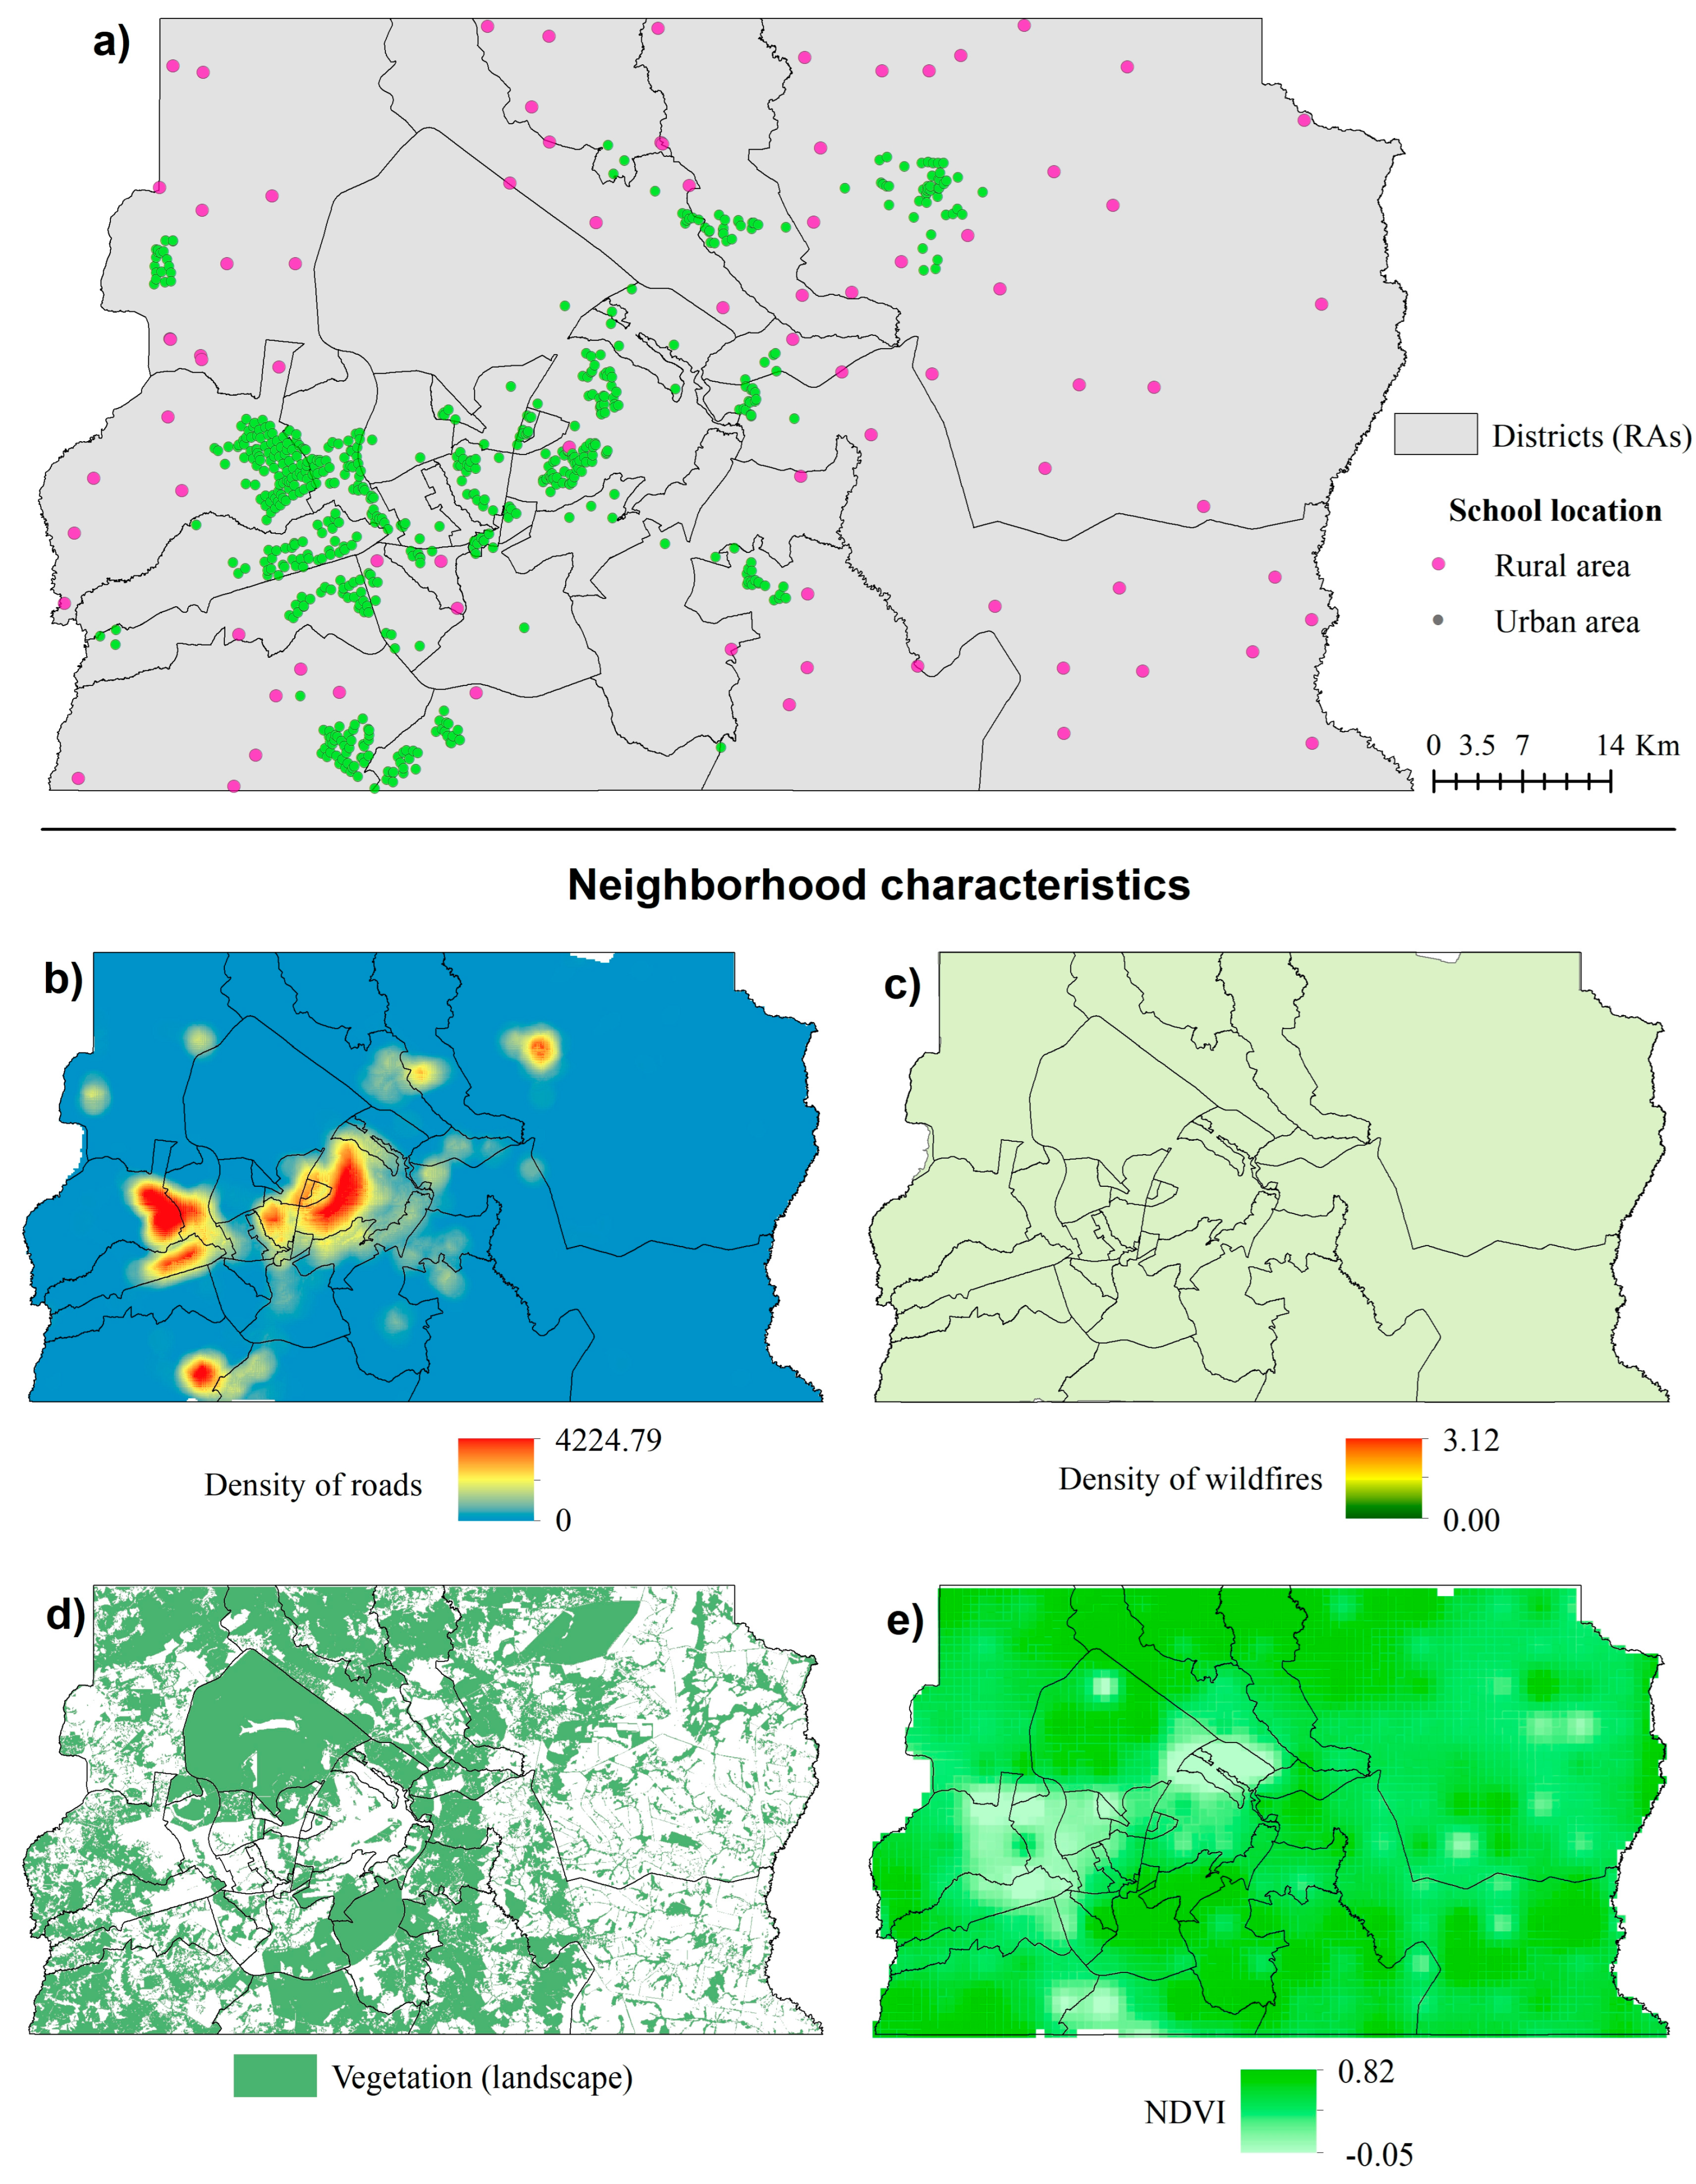
Figure 1 illustrates the spatial distribution of schools in the FD, showing both rural and urban locations along with neighborhood characteristics relevant to this study, including roads, wildfires, vegetation, and NDVI. This map provides an overview of the study area and the environmental factors analyzed around the schools and residential areas of students.
2.2. Data
We accounted for three types of neighborhood characteristics around students’ schools and homes, including green spaces, roads, and wildfires. In the next subsections, we describe these variables, the data representing academic performance, and the covariates used in the statistical analyses.
2.2.1. Academic Performance
The Department of Education in the FD provided data on academic achievement, which consist of student-level data from 2017 to 2020. This information includes each student’s final grades, which are represented by a numeric variable ranging from 0 to 10, with 10 being the highest grade. The data also include the school name, school level (middle school, high school, or adult education program), year, location of the school (represented by district, called “RA”), and the type of school (urban or rural). It is important to note that these data only include students from public schools in the FD. The data cover 256 public schools in the FD and 344,175 students who were enrolled in these schools between 2017 and 2020.
2.2.2. Green Spaces
To evaluate the impacts of greenness on student-level academic performance, we utilized two different greenness metrics. Specifically, we analyzed the quantity of green spaces and NDVI. To obtain the first metric, we used land use data that were provided by the Brazilian Institute of Geography and Statistics (IBGE). The land use information was derived from images taken by Landsat 8, which is equipped with the Operational Land Imager (OLI) and the Thermal Infrared Sensor (TIRS) instruments. The IBGE processed the data from Landsat 8 and created 14 different land use classes for Brazil in 2016, including agricultural areas, blue areas (such as rivers and lakes), urban areas, areas of deforestation, forests, and grasslands. For our study, we only focused on the classes that correspond to green spaces. To estimate the quantity of green spaces, we used Geographic Information System (GIS) techniques to measure the area of all green spaces within buffers of 250 m, 500 m, 750 m, and 1 km around each school and each student’s home.
For the second metric, we utilized the Green Space NDVI, which was accessed via satellite remote sensing. We used data from the Moderate Resolution Imaging Spectroradiometer (MODIS) NDVI, which were captured by the Terra and Aqua satellites (MODIS MOD13Q1 and MODIS MYD13Q1 products). These data were smoothed, and gaps caused by clouds or bad pixels were filled using the NASA Stennis Time Series Product Tool—TSPT. The vegetation index was calculated as the normalized ratio of the near-infrared (NIR) and red reflectance (RED) bands. The NDVI ranges from −1 to 1, where negative values represent water, values near zero represent barren areas of rock or sand, and positive values correspond to greener regions (with 1 representing the greenest area). To calculate the average NDVI for the study period (2017–2020), we used data from the months that correspond to the Brazilian school year (February–June and August–November). We estimated the average NDVI of all pixels (250 m × 250 m) in buffers of 250 m, 500 m, 750 m, and 1 km around each school and each student’s home.
2.2.3. Roads
To investigate the potential impacts of traffic (a proxy for air quality, representing an environmental condition in the neighborhood) on the academic performance of students, we considered the total length of all roads within specific buffer zones surrounding schools and homes. The data regarding the road network were sourced from the Secretary of State for Habitation in the FD. Using GIS techniques, we calculated the total length of roads (in meters) within each buffer zone, including 250 m, 500 m, 750 m, and 1 km around each school and each student’s home.
2.2.4. Wildfires
The National Institute of Spatial Research of Brazil, Instituto Nacional de Pesquisas Espaciais—INPE, provided wildfire data, including the date of wildfire records and geographical location. The data were collected from seven satellite remote sensing observations, processed by INPE, and based on the AQUA satellite as a reference. The data encompassed all wildfire records occurring in the FD between 2017 and 2020. Using GIS techniques, we aggregated the annual number of wildfires within buffers of 250 m, 500 m, 750 m, and 1 km around each school and each student’s home.
Figure 1 illustrates the spatial distribution of schools in the FD, stratified by rural and urban locations and the three types of neighborhood characteristics considered in this study, including green areas, roads, and wildfires.
2.2.5. Covariates
We included income and education level as covariates in our analysis to control for socioeconomic factors that may influence academic performance independently of neighborhood environmental characteristics. Income information was derived from the number of households within each census tract with a family income exceeding three minimum wages, which provides a proxy for economic status within the area. Education level was assessed based on the number of literate individuals above 20 years old within the same census tract, representing the general educational attainment of the community.
Data for both income and education level were obtained from the Brazilian Institute of Geography and Statistics (IBGE). We linked these socioeconomic data to the academic and environmental exposure variables (green spaces, roads, and wildfires) using Geographic Information System (GIS) techniques. Specifically, we spatially aligned the census tract data with each student’s school and home location to account for the socioeconomic characteristics of the neighborhoods surrounding both the schools and homes. Including these covariates allows us to control for socioeconomic differences that could affect academic performance, thus providing a more accurate assessment of the impact of environmental factors.
2.3. Statistical Analyses
First, applied the Wilcoxon test to compare the environmental characteristics surrounding schools and homes. This test determines if the two samples (characteristics surrounding schools and homes) come from the same population or if one sample tends to have larger values than the other.
Then, we employed a regression model with mixed effects to investigate the relationship between academic performance at the individual level and neighborhood characteristics (green spaces, roads, and wildfires) around students’ schools and homes in the FD. Our model took into account temporal factors, socioeconomic factors, and school-specific variables related to the school’s characteristics and location. We hypothesized that neighborhood characteristics around schools and homes may be associated with individual students in a manner that produces varying residuals across students. To account for this, we incorporated a random intercept and slope that could differ across students. The statistical model used is described in Equation (1).
where
is the student-level academic performance for student
i considering the exposure to the neighborhood characteristic
z;
is the intercept coefficient for neighborhood characteristic
z varying by a student
i;
β1 is the slope coefficient for neighborhood characteristic
z, which varies by a student
i;
s(
year) is the smoothing spline function to characterize nonlinear relationships between student-level academic performance and year (2017–2020);
β2,
β3,
β4,
β5,
β6 are the vectors of coefficients that represent the
income (variable described above,
Section 2.2.3),
education (variable described above,
Section 2.2.3),
type (type of school, including urban and rural),
location (RA where the school is located), and
level (school level, including middle school and high school), respectively.
The model described in Equation (1) was applied individually for each neighborhood characteristic (amount of green spaces, NDVI, roads, and wildfire), each buffer (250 m, 500 m, 750 m, and 1 km), and each place (schools and homes). The results were estimated along with 95% Confidence Intervals (CIs).
Finally, we stratified the analyses by type of school and school level. We used R software, version 4.1.3, including the R package “lme4” for the mixed effects regression model.
3. Results
We analyzed 344,175 students who were enrolled in the public schools (256 schools) of the FD from 2017 to 2020. The average grade for student-level academic performance was 6.29 points, with a standard deviation of 1.72 points. The academic performance of the students varied greatly, with grades ranging from 0 to 10. The descriptive statistics for academic performance, as well as the socioeconomic status (SES) variables and neighborhood characteristics surrounding the schools and homes, are presented in
Table 1.
The results of the Wilcoxon test indicate statistically significant difference between the neighborhood characteristics (all the characteristics defined in our study across all the buffers) around the schools and homes. The
p-value associated with the test was less than 0.05 in all the analyses, suggesting the rejection of the null hypothesis that there is no difference between the two samples.
Table S1 (
Supplementary Materials) shows the “W” value and the respective
p-values of the Wilcoxon test.
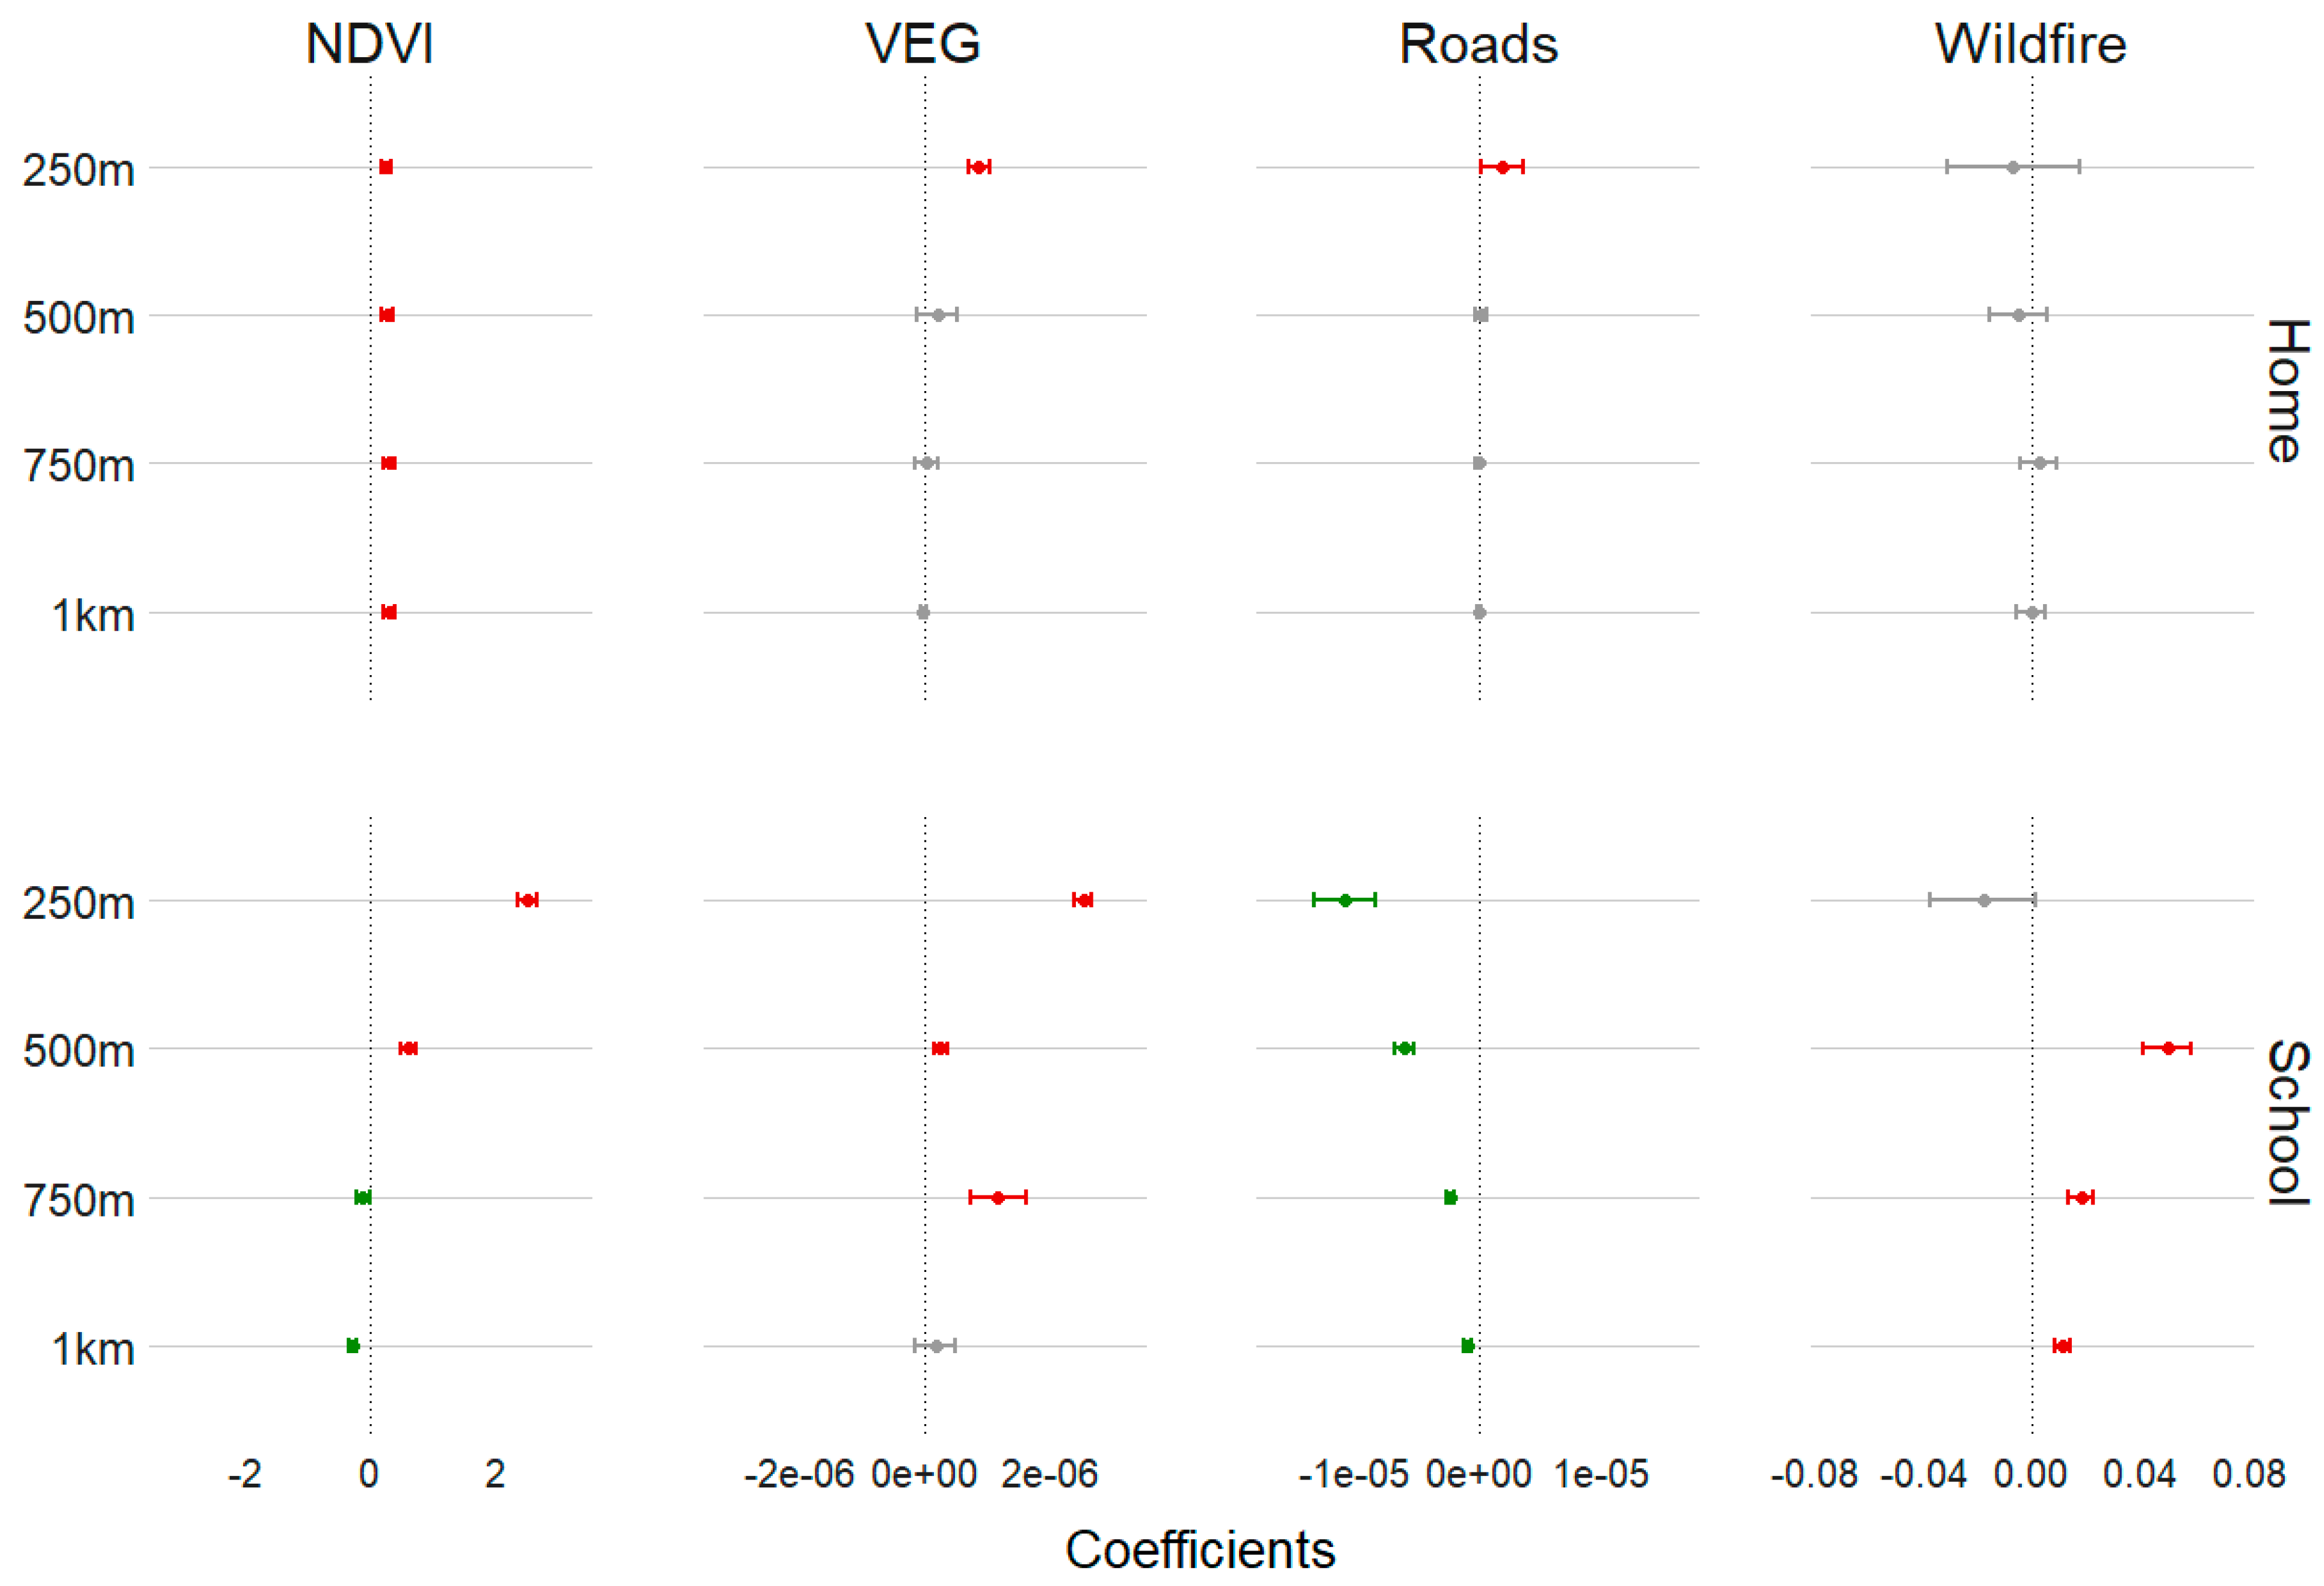
The effects of neighborhood characteristics on students’ academic performance varied significantly across the types of characteristics, buffer size, and location of the exposure (home or school). After controlling for covariates, the primary analysis showed that higher values of the NDVI were associated with better academic performance, except regarding the buffers of 750 m and 1 km around the schools (
Figure 2). For the NDVI within the buffers of 250 m and 500 m, our results suggest a higher positive association surrounding the schools, with an estimated coefficient of 2.48 (95%CI: 2.33; 2.63) for the buffer of 250 m and 0.59 (95%CI: 0.47; 0.71) for the buffer of 500 m, while, for the NDVI surrounding the homes, we estimated a coefficient of 0.23 (95%CI: 0.15; 0.30) for the buffer of 250 m and 0.25 (95%CI: 0.17; 0.33) for the buffer of 500 m (
Figure 2).
For the neighborhood characteristic represented by the area of green spaces within the buffers (
Figure 2, charts categorized as “VEG”), we found a positive association in all the analyses. However, the statistical significance for the exposure around the schools was only observed in the buffers of 250 m, 500 m, and 750 m. For the exposure around the homes, a robust association was observed only in the first buffer, 250 m. Similar to the NDVI, the presence of this greenness index around the schools had a greater positive impact on academic performance compared to this greenness index around the homes (
Figure 2).
For the characteristic represented by the length of roads, considering the exposure around the homes, only the buffer of 250 m presented a significant association, suggesting a positive effect. In contrast, the presence of roads surrounding the schools across all the buffers is negatively associated with student-level academic performance. We found that the highest effects occur in the buffer of 250 m, in which an increase of 1 km in the length of roads around schools was associated with a statistically significant decrease of 0.011 (95%CI: 0.008; 0.013) points in students’ grades (students’ academic performance varies from 0 to 10) (
Figure 2).
Finally, for wildfires around homes, we observed negative effects in the buffers of 250 m, 500 m, and 1 km, but the results were not statistically significant. For wildfires around schools, we observed unexpected results, with the coefficients indicating a positive association between the presence of wildfires around the schools and academic performance in the buffers of 500 m, 750 m, and 1 km. A negative association was observed only in the buffer of 250 m, although the coefficient did not reach statistical significance (
Figure 2).
Table S2 in the Supplementary Materials presents all the coefficients, as well as the associated random effects (σ2), including the results from the primary and sensitivity analyses. In
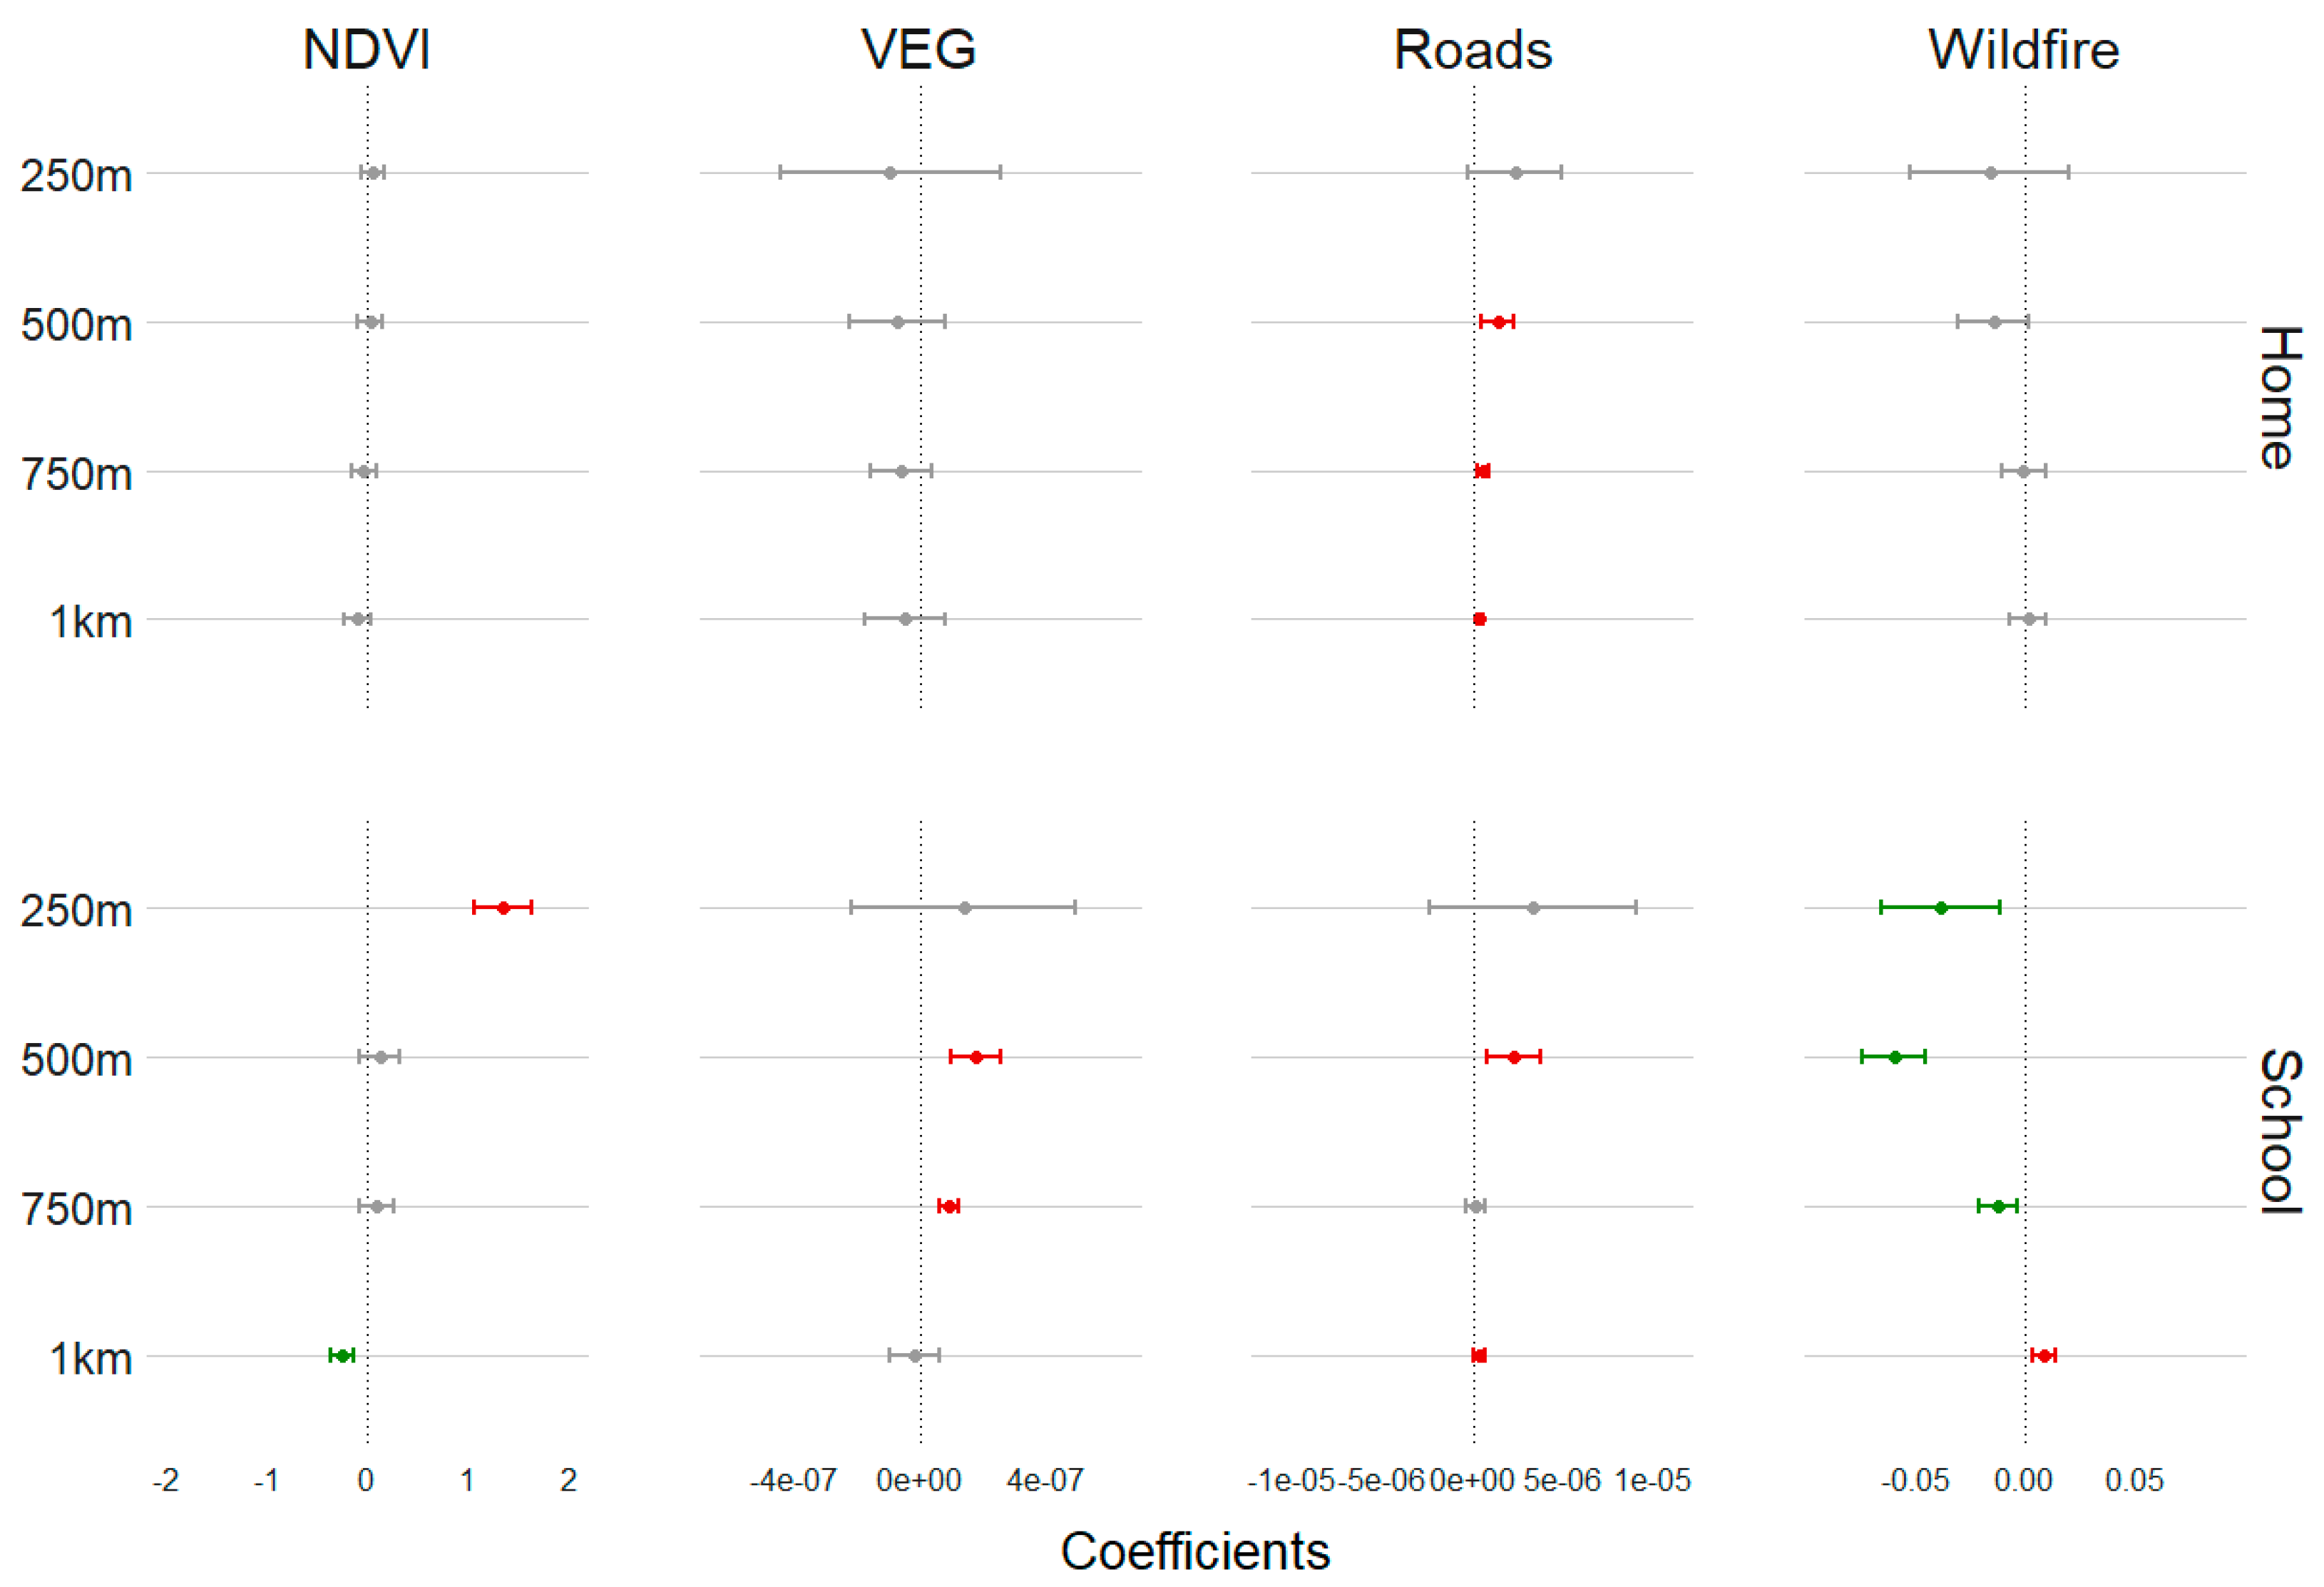
Figure 3 and
Figure 4, we present the results of the stratified analyses by type of school (urban or rural) and school level (middle- or high school). Overall, the type of school and the school level modify the effects of the neighborhood characteristics on academic performance, either strengthening or weakening them.
4. Discussion
Our study aimed to evaluate the association between the neighborhood characteristics around students’ schools and homes and academic performance in the FD, Brazil. Our results suggest that neighborhood characteristics, particularly green spaces, roads, and wildfires, can have a significant impact on academic performance.
The presence of green spaces around schools and homes was positively associated with academic performance, with a stronger effect observed around schools than around homes. Our findings are supported by the literature showing that the presence of vegetation may contribute to improved air quality [
27,
28], reduced noise pollution [
29,
30], and enhanced psychological well-being [
31], all of which may facilitate learning and cognitive function [
13,
14]. Our results are in agreement with previous investigations that have also identified the beneficial effects of green spaces on academic performance [
25,
32].
On the other hand, the length of the roads surrounding schools was negatively associated with academic performance, particularly in the buffer of 250 m around schools. The presence of roads may contribute to noise pollution [
33,
34], air pollution [
35,
36,
37], and increased stress levels, which could have detrimental effects on learning and cognitive function [
8,
18]. Our findings are consistent with previous research that has shown a negative association between the presence of roads and academic performance [
17,
18,
38].
The association between wildfires and academic performance was mixed, with negative effects observed in the buffers around homes (but statistically insignificant) and positive effects in the buffers (500 m, 750 m, and 1 km) around schools. While wildfires are known to have negative effects on air quality [
23], which could impact cognitive function and learning [
24], several factors might explain the positive association observed around schools. First, schools in wildfire-prone areas may have stronger environmental education and community engagement programs, fostering resilience and awareness among students. For instance, the schools in these areas might be equipped with improved ventilation systems, air filtration, or even wildfire response training programs that enable a more controlled and prepared response during wildfire seasons. These protective measures could help to reduce the impact of poor air quality on students’ health and cognitive function, potentially mitigating adverse effects on learning outcomes. Second, it is also possible that those schools located in areas with frequent wildfires are situated in higher-socioeconomic areas, where access to educational resources, community services, and academic support programs is greater. In such communities, the students might receive additional support from after-school programs, mental health resources, and tutoring, which could contribute to better academic performance despite the environmental stressors. Third, it is also important to consider that the positive association may reflect complex temporal effects. The data may capture a short-term association that does not fully account for the long-term impact of repeated wildfire exposure. Further research is needed to clarify these associations, ideally through longitudinal studies that account for temporal effects and possible grade-level differences in sensitivity to environmental stressors.
We found that some neighborhood characteristics had a stronger association with academic performance when they were located around schools compared to when they were located around students’ homes. This is consistent with the previous research [
9]. This finding suggests that the physical environment around schools may be particularly important for students’ academic success. One possible explanation for this is that the physical environment around schools may influence the opportunities and resources available to students, both in terms of academic resources (e.g., well-equipped classrooms, libraries, and other educational materials) and extracurricular activities (e.g., sports fields, playgrounds, and other recreational facilities). Additionally, the neighborhood characteristics around schools may affect the quality of the education that the students receive by influencing the quality of the teaching staff, the curriculum, and the overall school culture. For example, previous studies have shown that green spaces are associated with lower crime rates [
39]. This reduction in crime is relevant because schools in neighborhoods with lower crime levels may find it easier to attract and retain highly qualified teachers, whereas schools in higher-crime areas often face challenges in this regard [
40]. Regarding the curriculum, schools located in neighborhoods with poor environmental quality may be more likely to offer remedial classes and less likely to offer advanced classes [
41,
42,
43,
44]. Regarding school culture, students who attend schools located in more affluent neighborhoods (with environmental quality) may be more likely to participate in extracurricular activities and demonstrate higher levels of academic achievement [
45,
46,
47].
In contrast, the neighborhood characteristics around students’ homes may have a more indirect effect on academic performance. This may be the reason that explains the number of insignificant associations when we accounted for the neighborhood characteristics around homes. Our model may not be capturing these indirect associations for a variety of reasons, including omitted covariates and mediating variables. While students may spend a significant amount of time at home, the physical environment around their homes may not have as direct an impact on their academic success as the environment around their schools. Instead, the physical environment around homes may indirectly influence academic performance by affecting students’ health, well-being, and overall readiness to learn.
While our study provides valuable insights into the association between neighborhood characteristics and academic performance among students in the FD, Brazil, there are some limitations that should be acknowledged. First, our study was limited by the use of cross-sectional data, preventing us from establishing causal relationships between neighborhood characteristics and academic performance. Second, our study only focused on three types of neighborhood characteristics, including green spaces, roads, and wildfires. Other neighborhood characteristics, such as noise and air pollution, could also impact academic performance but were not accounted for in our study. Third, our study was conducted in a specific geographical location and may not be generalizable to other regions or countries. Different regions and countries may have different neighborhood characteristics and cultural factors that impact academic performance. Fourth, while we included socioeconomic factors such as income and education level as covariates, there may be other factors that we did not account for that could impact academic performance, such as family structure or parental involvement. Finally, while our regression model with mixed effects took into account school-specific variables related to the school’s characteristics and location, there may be unmeasured school-level factors that could impact academic performance.
Despite the limitations, our study has several strengths. First, we employed a comprehensive approach that accounted for both the neighborhood characteristics around students’ schools and homes as well as individual-level academic performance. This approach enabled us to control for potential confounding factors and to better understand the unique contributions of neighborhood characteristics to student performance. Second, we used mixed-effects regression models that account for the clustering of students within schools and the variability of neighborhood characteristics across students, thus improving the precision and accuracy of our estimates. Third, our study used objective measures of neighborhood characteristics, such as satellite data, to minimize the potential bias and measurement errors associated with self-reported data. Finally, our study provides valuable insights into the potential role of neighborhood characteristics, such as green spaces and roads, in promoting academic performance, which could have important implications for urban planning and public policy aimed at improving educational outcomes.
5. Conclusions
Overall, our results suggest that neighborhood environmental and atmospheric characteristics, such as green spaces, road density, and wildfires, significantly influence academic performance. Importantly, we found that the effects of these characteristics varied depending on the location of the exposure (home vs. school) and the type of environmental factor. For instance, proximity to green spaces was generally associated with better academic outcomes, while road density and wildfire occurrences showed adverse associations. These findings highlight the need for policymakers and urban planners to consider not only the physical infrastructure around schools and homes but also the broader environmental and atmospheric conditions when designing policies aimed at improving educational outcomes. By fostering environments that reduce exposure to harmful atmospheric factors, such as air pollution from roads or wildfires, and enhancing access to beneficial features like green spaces, we can create healthier and more supportive settings for learning.
While these results provide valuable insights for the Federal District, Brazil, it is important to recognize that the generalizability of our findings may be limited. Differences in the environmental conditions, socioeconomic factors, and educational contexts across regions could impact how neighborhood characteristics influence academic performance. Therefore, further research in diverse settings is needed to validate these findings and inform context-specific policy recommendations. Nevertheless, this holistic approach may provide students with better opportunities to succeed academically while also addressing broader public health and environmental goals.


