Abstract
This study is dedicated to the investigation of the relationship between the wave activity in February and temperature variations in the Arctic lower stratosphere in March. To study this relationship, the correlation coefficients (CCs) between the minimum temperature of the Arctic lower stratosphere in March (Tmin) and the amplitude of the planetary wave with zonal number 1 (PW1) in February were calculated. Tmin determines the conditions for the formation of polar stratospheric clouds (PSCs) following the chemical destruction of the ozone layer. The NCEP and ERA5 reanalysis data and the modern and future climate simulations of the Earth system models INM CM5 and SOCOLv4 were employed. It is shown that the maximum significant CC value between Tmin at 70 hPa in the polar region in March and the amplitude of the PW1 in February in the reanalysis data in the lower stratosphere is 0.67 at the pressure level of 200 hPa. The CCs calculated using the model data are characterized by maximum values of ~0.5, also near the same pressure level. Thus, it is demonstrated that the change in the planetary wave activity in the lower extratropical stratosphere in February can be one of the predictors of the Tmin. For further analysis of the dynamic structure in the lower stratosphere, composites of 10 seasons with the lowest and highest Tmin of the Arctic lower stratosphere in March were assembled. For these composites, differences in the vertical distribution and total ozone content, surface temperature, and residual meridional circulation (RMC) were considered, and features of the spatial distribution of wave activity fluxes were investigated. The obtained results may be useful for the development of forecasting of the Arctic winter stratosphere circulation, especially for the late winter season, when substantial ozone depletion occurs in some years.
1. Introduction
Investigation of mechanisms of interannual and intraseasonal variability of the Arctic winter stratosphere, which determines the state of the ozone layer and affects the tropospheric circulation, still stays relevant due to the high variability of the stratospheric polar vortex, which depends on wave activity propagating from the troposphere, its nonlinear interaction with the stratospheric circulation, and the stratosphere’s own oscillations (e.g., [1,2]). In addition, some external factors, such as QBO, El Niño/Southern Oscillation, and Madden–Julian Oscillation, in some winter seasons can influence the propagation of wave activity flows and, therefore, the circulation of the Arctic stratosphere.
Despite numerous studies in recent decades, the interannual and intraseasonal variability of the Arctic winter stratosphere remains poorly understood, which does not allow for its long-term forecast. In this regard, it is of interest to determine the dynamic processes–predictors that can be useful for developing forecasts of the Arctic winter stratosphere circulation, especially for the end of the winter season, when ozone destruction reaches noticeable magnitude during some years with exceptionally cold and persistent polar vortex.
One such predictor of the minimum temperature of the Arctic lower stratosphere in March, as shown in this paper, is the change in the wave activity of planetary waves in the lower extratropical stratosphere in February.
The stratospheric polar vortex is formed at the beginning of the polar night in autumn and often weakened as a result of sudden stratospheric warming (SSW) events [3]—the clearest example of the dynamic interaction of the troposphere–stratosphere and the upper atmosphere. As a result of SSW events, the temperature of the polar stratosphere can increase by 20–30° in a few days, and the zonal mean wind velocity can decrease from ~50–60 m/s to nearby zero values or, in the case of the major SSW, a reversal of zonal wind direction is observed.
The formation of SSWs is mainly associated with the nonlinear interaction of planetary waves propagating from the troposphere with the zonal circulation of the stratosphere [3,4]. Additionally, internal oscillations of stratosphere and gravity waves can also contribute to the SSW occurrence (e.g., [1,5,6]).
On average, the major SSWs are observed in the Arctic twice every three years [7]. Due to the high intraseasonal and interannual variability of dynamic processes in the stratosphere, SSW forecasting is still limited to 1–2 weeks [8,9,10], with rare exceptions, such as “New Year’s” major SSW in 2019, predicted by many participating in the sub-seasonal to seasonal project (S2S) forecast models more than 18 days in advance [11].
However, in some years, SSWs either do not occur or are observed at the beginning of the winter season, followed by the strengthening of the stratospheric polar vortex and a decrease in the stratospheric temperature. Then, in the late winter season and the end of the polar night in the lower Arctic stratosphere, activation of ozone-depleting compounds and severe destruction of the ozone layer is possible, as, for example, in 2011 and especially in 2020 (e.g., [12,13,14,15]). The destruction of the ozone layer in some days of the spring of 2020 in the lower polar stratosphere reached up to 90% [16]. This leads to a strong increase in UV radiation levels at the surface [17].
Notably, reduced ozone content and, as a consequence, increased levels of UV radiation can persist in the middle and high latitudes of the Northern Hemisphere until the summer months [18]. In addition to affecting surface UV radiation, significant destruction of the ozone layer in the Arctic can lead to the formation of surface climate anomalies [19], corresponding to the positive phase of the Arctic Oscillation [13,20].
Despite the expected reduction in the content of ozone-depleting compounds in the atmosphere as a result of the Montreal Protocol, the model simulations show, in the second half of the 21st century, a possibility of the formation in some years of conditions for severe destruction of the ozone layer in the Arctic, comparable to those observed in the spring of 2011 and 2020, which can be associated with the decrease in stratosphere temperature caused by greenhouse gases concentration growth [21,22,23].
To trigger the chemical destruction of the ozone layer in the lower polar stratosphere, temperatures below about 195 K are required, at which a formation of polar stratospheric clouds (PSCs) type 1 occurs. This temperature threshold depends on nitric acid and water concentrations, which is particularly important due to possible chemical composition changes in the coming decades (e.g., [23]).
It is necessary that such low temperatures and, consequently, a sufficient volume of PSC remain in March, when after the polar night solar rays begin to penetrate the Arctic stratosphere, leading to the chemical ozone destruction.
The temperature of the Arctic lower stratosphere in early March is determined by the zonal mean meridional heat flux in January–February [24]. The correlation between zonal mean heat flux in January–February and the temperature of the lower Arctic stratosphere in March is often used for validating the polar stratosphere dynamics calculations of atmospheric general circulation models (e.g., [25]).
The temperature of the polar stratosphere is directly influenced by the planetary wave activity: its increase, for example, can weaken the stratospheric polar vortex through Eliassen–Palm divergence and contribute to heating the polar stratosphere through meridional heat fluxes. In addition to this direct influence, the temperature also depends on the associated wave activity residual meridional circulation (RMC): intensification of the RMC descending branch in the polar region can cause an adiabatic temperature increase [26].
The present study aimed to find predictors of minimum temperature in the spring lower stratosphere leading to strong ozone depletion; for this purpose, the relationship between the temperature of the Arctic lower stratosphere in March and the dynamics of atmospheric planetary wave activity in the preceding January–February is investigated.
2. Data and Methods
Monthly mean National Centers for Environmental Prediction (NCEP) reanalysis data [27] over the period from 1948 to 2024 with the upper boundary at the pressure level 10 hPa (~30 km) and ERA5 reanalysis data [28] from 1979 to 2023 with the upper boundary at 1 hPa (~48 km) were used to analyze interannual variability of large-scale dynamical processes in the Arctic winter stratosphere. To calculate residual meridional circulation (RMC) in the troposphere–stratosphere, the MERRA-2 reanalysis data [29] with the highest level at 0.05 hPa (~65 km) were employed. As it was shown, the modern reanalyses, including those mentioned above, consistently describe large-scale dynamic processes leading to the formation of SSWs and, consequently, to changes in the circulation and temperature of the stratosphere, as well as the SSW influence on the troposphere [30].
Also, the following data of model simulations were analyzed: five ensemble calculations of the modern climate of the Earth system INM CM5 model [31] from 1960 to 2015, simulations of the future climate under the moderate (SSP2-4.5) and severe (SSP5-8.5) scenarios of greenhouse gases (GHGs) growth of the same model [32], and three ensemble simulations of the Earth system model SOCOLv4 [33,34] from 2015 to 2100, also under the same moderate and severe GHGs growth scenarios.
The concentration of carbon dioxide (CO2) will increase to ~600 ppm and radiative forcing by about 4.5 W/m2 compared to the pre-industrial climate (before 1750) under the SSP2-4.5 scenario by the end of the 21st century [35]. Under the SSP5-8.5 scenario, CO2 concentration increases four times to 1135 ppm and radiative forcing by about 8.5 W/m2. The global mean surface temperature is expected to rise by about 3 °C and 5 °C at around 2100 under these scenarios, respectively [36].
To analyze planetary wave activity changes in the extratropical boreal stratosphere, the amplitudes of planetary waves with zonal wave numbers from 1 to 3 (PW1–3 thereafter), zonal mean meridional heat flux, and three-dimensional Plumb flux vectors characterizing the wave activity propagation [37] were calculated. The 3D planetary wave activity flux by Plumb, in comparison with conventional two-dimensional Eliassen–Palm (EP) flux, can provide more regionalized information on stratosphere–troposphere dynamical interactions and peculiarities of wave activity propagation (e.g., [38,39]).
To study cause and effect relationships between the wave activity in February and temperature variations in the Arctic lower stratosphere in March, the correlation between these parameters (PW1 amplitude averaged over 45–75° N in the range of pressure levels from 700 hPa to 10 hPa and Tmin between 70° N and 90° N at 70 hPa) was calculated using the modeling and reanalysis data. For the pressure level of 200 hPa, at which the highest correlation coefficients (CCs) were found, a scatter diagram was constructed for the period from 1979 to 2024, and the seasons with the lowest and highest Tmin of the Arctic lower stratosphere in March and, accordingly, the maximum and minimum PW1 amplitudes in February were selected. To analyze the dynamics of the Arctic stratosphere, two composites were assembled, consisting of 10 “warm” and “cold” seasons following the criterion described above.
To analyze the features of the interaction of atmospheric waves with the mean flow, the residual meridional circulation (RMC) was calculated within the transformed Eulerian mean framework (TEM) [40]. The definition and concept of the RMC were discussed in detail by [41]. The meridional and vertical components of the RMC were calculated using the following formulas [40]:
where the overbars denote zonal mean values; the primes indicate wave disturbances resolved on the spatial grid (deviations from the zonal mean values); v and w—meridional and vertical wind; θ—potential temperature; z—vertical coordinate; ρ—density; φ—latitude; a is the Earth’s radius.
The following parameters describing large-scale dynamical processes associated with or capable of influencing the Arctic winter stratosphere variability were analyzed: quasi-biennial oscillation of zonal wind in the tropical stratosphere (QBO), El-Nino/Southern Oscillation (ENSO), Arctic and North Atlantic Oscillations (АО, NAO), the Madden–Julian Oscillation (MJO). These data were obtained from the following sources: QBO –NASA (Greenbelt, MD, USA) https://acd-ext.gsfc.nasa.gov/Data_services/met/qbo/qbo.html, accessed on 1 October 2024), ENSO (SOI index), АО and NAO indexes—NOAA’s Climate prediction center (University Research Court College Park, MD, USA, https://www.cpc.ncep.noaa.gov/data/indices/soi, https://www.cpc.ncep.noaa.gov/products/precip/CWlink/daily_ao_index/ao.shtml, https://www.ncei.noaa.gov/access/monitoring/nao/, accessed on 1 October 2024), MJO phases – Bureau of Meteorology of the Government of Australia (Melbourne, VIC, Australia http://www.bom.gov.au/climate/mjo/, accessed on 1 October 2024).
A statistical significance of planetary wave amplitudes and surface temperature differences between the “warm” and “cold” composites was estimated using the two-sample Welch’s unequal variances t-test [42].
3. Results
3.1. Interannual Variability of Arctic Stratosphere in March
The interannual variability of the Arctic stratosphere in March is determined by wave activity propagating from the troposphere, residual meridional circulation, as well as the state of the stratospheric polar vortex (isolation, temperature, displacement from the pole), which depends on the occurrence of the SSW events in January–February. Another factor is radiative heating; when ozone depletion is strong, the polar stratosphere warming weakens in comparison with years with weak ozone depletion.
The zonal mean and minimum temperature in the region of 70–90° N latitude are often used as parameters for the interannual variability of the polar lower stratosphere in March. (Tmin). The change in these parameters since 1948 at a pressure level of 70 hPa (~18 km) is presented in Figure 1a.
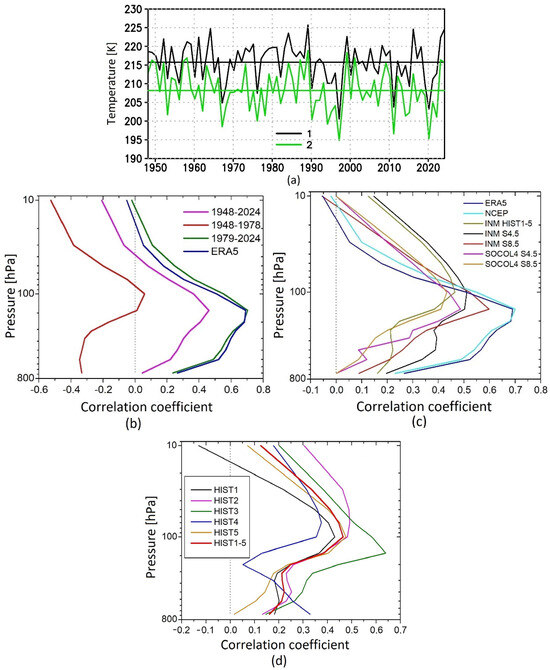
Figure 1.
The zonal mean temperature averaged over 70–90° N and Tmin in March over 1948–2024 (NCEP-R) (black and green lines 1–2, respectively) (a); vertical profile of the correlation coefficient between the amplitude of PW1 averaged over 45–75° N in the range of pressure levels from 700 hPa to 10 hPa in February and Tmin at 70 hPa in the polar cap 70–90° N in March in the following data sets: NCEP reanalysis data over the periods of 1948–2024, 1948–1978, 1979–2024, and ERA5 reanalysis (1979–2023) (b); INMCM5 historical simulations (1965–2014, mean over experiments HIST1–HIST5) under the SSP2-4.5 and SSP5-8.5 scenarios (2015–2100), ERA5 reanalysis (1979–2023), NCEP (1979–2024) reanalysis data, and SOCOLv4 simulations under SSP2-4.5 and SSP5-8.5 scenarios (2015–2099, 3 ensembles mean) (c); INM CM5 historical experiments HIST1–HIST5 and the mean for the period of 1965–2014 (d).
As expected, Tmin is several degrees lower than the zonal mean temperature, and in some years, for example, in 2020, by almost 10 K. Hence, Tmin describes interannual variability of the polar lower stratosphere better and, therefore, will be used further.
To study the relationship between wave activity in February and Tmin in the lower Arctic stratosphere in March, the correlation between Tmin and the amplitude of PW1 was assessed. At the first stage, such estimates were obtained for reanalysis data (Figure 1b).
It has been established that for the lower stratosphere, the highest value of the correlation coefficient (CC) for the “satellite” period since 1979 is 0.67. Similar calculations for the “pre-satellite” period from 1948 to 1978 showed that significant correlations were not observed, although the vertical profile of the CC has a comparable appearance to the “satellite” period, with a maximum in the lower stratosphere. When considering the whole period (“pre-satellite” + “satellite”) from 1948 to 2024, the maximum CC value is ~0.45.
The explanation of why pre-satellite data, calculated mainly using radiosonde data, do not reproduce the relationship between the amplitude of PW1 in February and Tmin in March found for the satellite era is beyond the scope of this paper. On the one hand, for such large-scale phenomena as SSWs and the associated dynamic interactions of the stratosphere and troposphere, it is recommended to use pre-satellite reanalysis data (including NCEP) since this significantly increases the analyzed interval and leads to a reduction in the sampling uncertainty associated with the large interannual variability of stratospheric dynamics [43]. On the other hand, a difference in the seasonal distribution of SSWs and their amplitude was revealed when comparing the pre-satellite and satellite data [44].
Further, similar CC estimates for 1979–2024 based on the ERA5 reanalysis data showed perfect agreement with NCEP.
For calculations of future climate under the SSP2.4-5 and SSP5.8-5 scenarios of the INM CM5 for the period from 2015 to 2100, the maximum CC value was also found in the lower stratosphere ~0.5 and ~0.6, respectively (Figure 1c). For simulations of the CCM SOCOLv4 under the same scenarios and averaging over three ensemble members, the maximum CC is ~0.45. For historical calculations of the INM CM5 for the period from 1965 to 2014, the maximum value of the CC averaged over five ensemble simulations was also found in the lower stratosphere and is ~0.5 (Figure 1d).
Thus, the maximum significant value of CC between Tmin at 70 hPa is in the region 70–90° N in March, and the amplitude of PW1 in February in the reanalysis data was revealed in the lower stratosphere around 200 hPa: in this case, CC is ~0.7, and in the simulations of the INM CM5 and SOCOLv4 for the present and future climate ~0.5.
The maximum CC value between the amplitude of PW1 in January and Tmin at 70 hPa in March does not exceed 0.25. Also, a relationship was not found between the amplitude of PW2 from the troposphere to the middle stratosphere in February and Tmin at 70 hPa in March: the values of the CC range from −0.16 to −0.27 from 1948 through 2024 and −0.1 to −0.29 from 1979 through 2024. Calculations using ERA5 reanalysis data showed that the CC values between the amplitude of PW1 in February and Tmin at 70 hPa in March for the upper stratosphere levels (5, 3, and 1 hPa) are approximately −0.1.
Further, for the pressure level of 200 hPa, at which the largest CC was revealed, a scatter diagram was constructed for the period from 1979 to 2024. As expected, the seasons with the lowest Tmin in March and the smallest PW1 amplitude in February (Figure 2, the lower left corner) include the winters of 1997, 2011, and 2020, when the Arctic experienced the greatest ozone layer depletion due to the long persisted, stable, and cold stratospheric polar vortex with a significant volume of air masses with conditions sufficient for the formation of a PSC. In turn, seasons with the highest Tmin of the polar lower stratosphere in March and the largest amplitude of PW1 (Figure 2, the upper right corner) include seasons with strong major SSW events, e.g., in January 2009 [45] and 2013 [46].
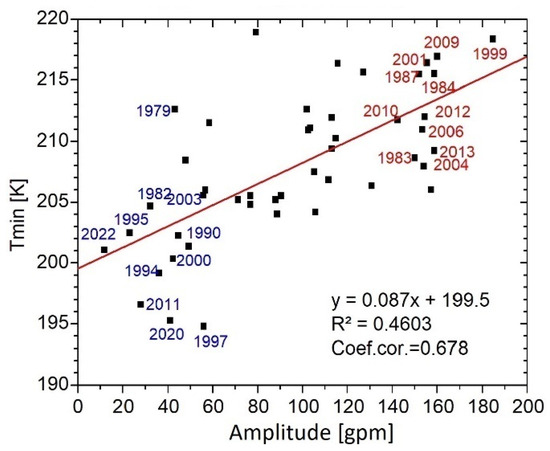
Figure 2.
Scatter diagram of PW1 amplitude in geopotential meters (gpm) at 200 hPa averaged over 45–75° N in February and Tmin in the polar cap 70–90° N at 70 hPa in March from 1979 to 2024 (years are marked by black squares). Selected in the next section for cold and warm composites 10 years with the lowest and highest Tmin in March are marked by blue and red colors, respectively.
3.2. Composite Analysis
To analyze further the features of the dynamics of the Arctic stratosphere, two composites were compiled, consisting of 10 seasons with the lowest and highest Tmin of the lower Arctic stratosphere in March and, accordingly, the maximum and minimum values of the PW1 amplitude in February.
The “warm” composite was assembled of the following winter seasons: 1983, 1984, 1987, 1999, 2001, 2004, 2006, 2009, 2012, and 2013; and the “cold” one: 1982, 1990, 1994, 1995, 1997, 2000, 2003, 2011, 2020, and 2022. The “cold” composite included seasons with Tmin of the Arctic lower stratosphere in March of 194–196 K (1997, 2010, and 2020) and, as a consequence, with maximum destruction of the ozone layer, characterized by underestimated values of the PW1 amplitude in February in the lower stratosphere (Figure 2).
The average Tmin of the lower polar stratosphere for the “warm” and “cold” composites in March for the entire period is ~213 K and ~200 K, respectively, and the amplitude of PW1 in February is ~158 gpm and ~38 gpm (i.e., in “warm” winters are around four times stronger).
3.2.1. External Climate Factors
The obtained “warm” and “cold” composites are, on average, not dominated by any of the major external climate phenomena capable of influencing the Arctic winter stratosphere: the quasi-biennial oscillation cycle of the tropical stratospheric zonal wind (QBO), El Niño/Southern Oscillation (ENSO), and Madden–Julian Oscillation (Table 1 and Table 2). For instance, in “warm” February months, two western, three eastern, and five intermediate QBO phases, five El Niño, and two La Nina events were observed (indicated as 2W, 3E, 5WE, 5El, and 2La, respectively, in Table 1), whereas in “cold” months, there were five western, three eastern, and two intermediate QBO phases and four El Niño and two La Nina events (5W, 3E, 2WE, 4El, and 2La in Table 2).

Table 1.
Warm composite: QBO phases, ENSO and MJO indexes in February, АО, NAO indexes for February and March, and SSW dates.

Table 2.
Cold composite: QBO phases, ENSO (SOI index), and MJO indexes for February, АО, and NAO for February and March.
The analysis of the dominant circulation mode of the extratropical tropo-stratosphere—Arctic Oscillation (AO)—showed that the “warm” composite is characterized, on average, by a negative AO phase, and the “cold” composite by a positive one, which is consistent with the previously obtained results indicating that seasons with a weakened stratospheric polar vortex (i.e., “warm”) correspond to a negative AO phase (higher pressure in the polar region, weakened zonal circulation), while seasons with a strong and stable vortex (“cold”) correspond to a positive AO phase (low pressure in the polar region, strong zonal circulation). Analysis of the main circulation mode of the North Atlantic troposphere (North Atlantic Oscillation, NAO) for February and March showed that for the “warm” composite, the average value of the corresponding index is close to zero. For the “cold” composite, the average value of the NAO index is approximately −1, i.e., in the polar latitudes of the Atlantic, the pressure is higher than in the subtropics. In general, the “cold” composite is characterized by a positive phase of both the AO and NAO, while the “warm” composite is characterized by a negative phase of the AO but a neutral phase of the NAO. In the “warm” composite, the eight major SSW events were observed in January–February, and two minor SSWs. The average SSW date is 30 January.
3.2.2. Comparison of the Wave Activity
The main difference between the “warm” and “cold” composites in the upper troposphere–lower stratosphere is the increased pressure over the North Atlantic, peaking eastward of southern Greenland, and low pressure over Northeastern Eurasia and the northern Pacific (Figure 3).
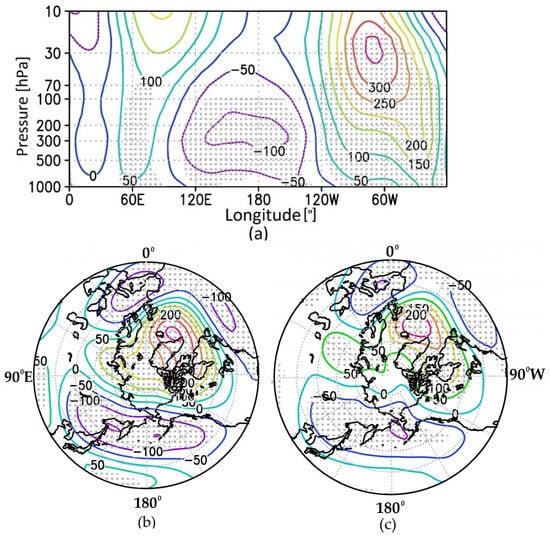
Figure 3.
Altitude–longitude cross-section of geopotential height difference (gpm) in the latitudinal belt 45–75° N (а); polar projections at the pressure levels 200 hPa (b) and 500 hPa (c) in February between “warm” and “cold” composites. The regions with significance at the 95% level for positive or negative changes are marked by gray dots.
To check the stability of the revealed results, the similar difference between composites of seven and thirteen “warm” and “cold” seasons was calculated. For a composite of 13 seasons, 2010 (minor SSW 24.01), 2023 (major SSW 16.02), and 2024 (major SSW 16.01 and minor SSW 16.02) were added as “warm”, and as “cold”, 1986, 1991, and 2014 were added. The main difference between these additional composites in the upper troposphere–lower stratosphere is still the increased pressure over the northeast Atlantic (Supplementary Figure S1).
The greatest difference in PW1 amplitude values in February between the “warm” and “cold” composites is observed in the upper troposphere–lower stratosphere near 200 hPa in the region of 50–60° N and is ~150 gpm. At the same time, the amplitude of PW2 in the “warm” composite is weaker compared to the “cold” composite: the greatest difference reaches 10 hPa in the region of 60–70° N and is up to −270 gpm (Figure 4).
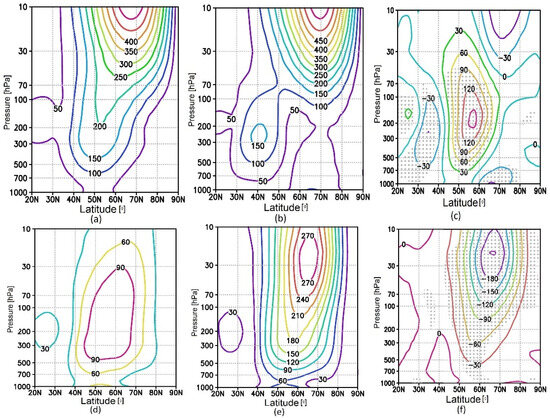
Figure 4.
Altitude–latitudinal cross-section of PW1 amplitude (gpm) in February for “warm” and “cold” composites and the difference between them ((a–c) respectively). The same but for PW2 (d–f). The regions with significance at the 95% level for positive or negative changes are marked by gray dots.
The difference between the amplitude of PW3 between the “warm” and “cold” composites in February in the lower stratosphere does not exceed 10 gpm.
A comparison of the zonal mean heat flux between the composites in February shows that the “warm” seasons are characterized by larger values in the lower and middle stratosphere in the region of 50–80° N (Figure 5a,b). The difference increases with height and is up to ~20 K m/s near the pressure level of 10 hPa and 60–70° N (Figure 5c). During the “cold” seasons in the lower stratosphere in the region of 70–80° N, a downward propagation of wave activity into the troposphere was observed (Figure 5b). When averaging over the region 45–75° N, the heat flux in “warm” seasons is ~1.5–2 times greater than in “cold” seasons in the lower and middle stratosphere.
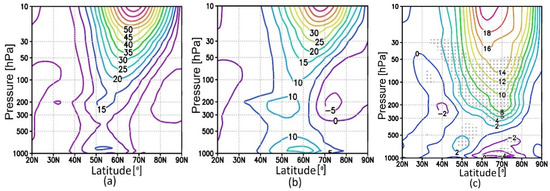
Figure 5.
Altitude–latitudinal cross-sections of zonal mean heat flux (K m/s) in February for “warm” and “cold” composites (a,b) and the difference between them (c). The regions with significance at the 95% level for positive or negative changes are marked by gray dots.
Using the calculated Plumb vectors, it was established that in the “warm” seasons, compared to the “cold” ones, an increased upward propagation of wave activity fluxes in the upper troposphere–lower stratosphere, with a maximum in the region of 60–70° N observed in February (Figure 6a–c). Note that the greatest influence on the formation of most SSWs is precisely the increase in wave activity in the stratosphere and the region above the tropopause (i.e., the lowest stratosphere) [47].
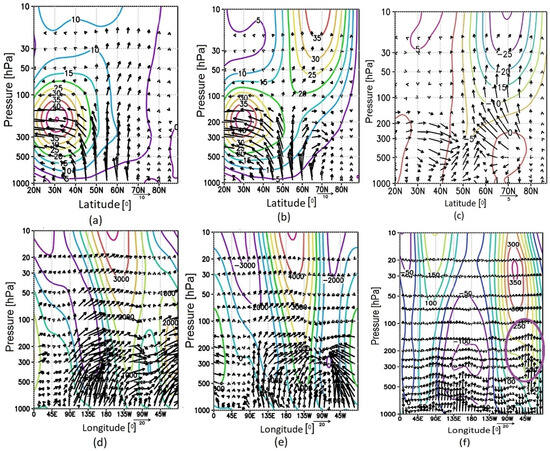
Figure 6.
Altitude–latitudinal cross-sections of Plumb fluxes (Fy, Fz components, vectors) (m2/s2) and zonal mean wind (m/s, contours) in February of “warm” and “cold” composites and the difference between them (a–c). Altitude–longitudinal cross-sections of Plumb fluxes (Fx, Fz components, vectors) and geopotential height (contours) for “warm” and “cold” composites averaged over 45–75° N (d,e) and the difference between them for geopotential height and Fz (f). Fz is multiplied by 100. The area with the strongest upward propagation of wave activity fluxes from the troposphere to the stratosphere is highlighted by a purple oval (f).
Accordingly, the speed of the zonal mean wind in “warm” seasons is significantly less (by 25–30 m/s at altitudes of 30–10 hPa) than in cold seasons. At polar latitudes near 70° N in the upper troposphere–lower stratosphere, a reflection of wave activity occurs in the “cold” seasons.
The longitudinal distribution of geopotential height and wave activity propagation (longitudinal and vertical components Fx, Fz) for the region 45–75° N for “warm” and “cold” composites is illustrated in Figure 6d,e. Two regions of enhanced upward wave activity propagation from the troposphere to the lower stratosphere are seen: over Northeastern Eurasia (~90–180° E) and North Atlantic (~50° W to Greenwich meridian) (Figure 6d). “Cold” composite is characterized by similar propagation only over Northeastern Eurasia (Figure 6e). The difference between composites shows two main points. Firstly, the downward propagation of wave activity is observed in the upper troposphere–lower stratosphere over northern North America near 90° W (Figure 6f). Secondly, the strongest vertical propagation of wave activity (Fz component) is observed in the “warm” seasons in the upper troposphere–lower stratosphere in the high-pressure region over the North Atlantic (~50–30° W). A similar increase in the Fz component in the same longitude range is observed when averaging over the region 55–75° N and 60–80° N (Supplementary Figure S2).
The greatest vertical propagation of wave activity (characterized by the Fz component) in “warm” and “cold” seasons is observed over the northeast of Northeastern Eurasia and the north Pacific Ocean (Figure 7a,b), which is consistent with previously obtained results (e.g., [38,39,48]). In the “warm” seasons, a second extensive area of this propagation is observed over the North Atlantic and Scandinavia. Downward propagation (or reflection) of wave activity into the troposphere (area of negative Fz values) is observed over northern Canada, and in the “cold” seasons, this propagation is stronger and is consistent with Figure 6b.
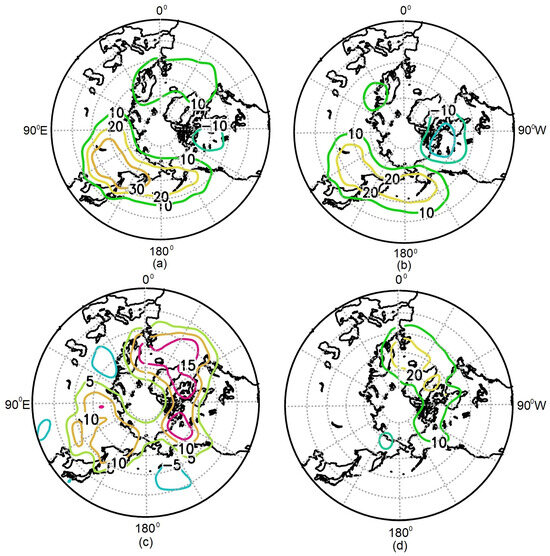
Figure 7.
Vertical Plumb fluxes Fz component of “warm” and “cold” composites in February at the pressure level of 100 hPa (a,b). Difference of Fz (m2/s2) in February between “warm” and “cold” composites at 100 hPa (c) and 30 hPa (d).
In the “warm” seasons, in comparison to the “cold” ones, an enhanced upward wave activity propagation is observed in the lower stratosphere over the North Atlantic and northern Canada, as well as over the northeast of Northern Eurasia (Figure 7c). In the middle stratosphere at a pressure level of 30 hPa, such enhanced propagation is observed in the “warm” seasons only over the North Atlantic and northern Canada (Figure 7d).
3.2.3. Polar Lower Stratosphere Temperature and Ozone Comparison
The greatest difference in the temperature of the lower Arctic stratosphere at a pressure level of 70 hPa between the “warm” and “cold” composites is up to 12 K in March (Figure 8a). This difference is related to the difference in the strength of ozone layer destruction (higher temperature => less PSC = > weak ozone destruction).
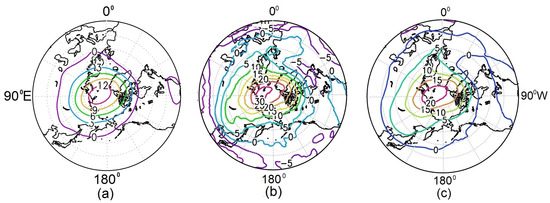
Figure 8.
Temperature difference (K) (a) and ozone concentration at 70 hPa (%) (a,b) and total ozone content (%) in March between “warm” and “cold” composites (b,c).
In the lower stratosphere, where the greatest ozone depletion occurs, the difference in ozone mixing ratio in the polar region at 70 hPa is up to 2·10−6 or up to ~30% (Figure 8b). The difference between the composites in the degree of ozone destruction in the lower stratosphere in March is also manifested in the total ozone content, which reached up to 100 Dobson units or ~20% (Figure 8c).
Note that, in addition to chemical destruction, the total ozone content in the polar region is also affected by horizontal advection (when the stratospheric polar vortex weakens, ozone-rich air masses penetrate the polar region from lower latitudes) and subsidence associated with meridional circulation (downward transport). This is important as far as a significant correlation was identified between total ozone anomalies in the Arctic in March with surface temperature anomalies in central Russia, southern Asia, and northern North America in April using the results of observational analysis and ensemble simulations of the CESM1 chemical-climate model [49].
3.2.4. Surface Temperature Comparison
A comparison of surface temperatures between the composites shows that in the “warm” seasons, the temperature of almost all of Northern Eurasia and Alaska in February–March is about 1–3 K lower than in the “cold” seasons (Figure 9a,b).
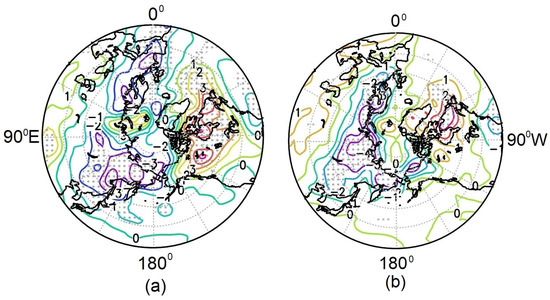
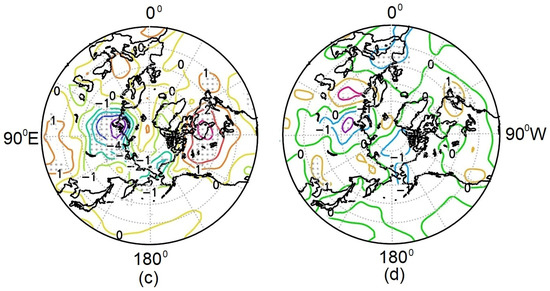
Figure 9.
Temperature difference between ”warm” and “cold” composites at 1000 hPa in February (a), March (b), April (c), and May (d). The regions with significance at the 95% level for positive or negative changes are marked by gray dots.
Higher temperatures on 1–3 K are also observed over the northern and northeastern parts of North America–the northwest Atlantic. In April, the difference between the composites is also characterized by positive values of up to 3 K over northern North America and negative values of up to −5 K over the center and east of Northern Eurasia (Figure 9c).
Note that the greatest correlation between anomalies of the surface temperature in the center of northern Russia (Northern Eurasia) in April and the total ozone content anomalies in March was revealed by [48].
In May, the area with negative temperature difference in the north of Russia remains but with a decrease in area and values to ~1–2 K (Figure 9d). In the north of North America, the area of positive values decreases sharply. Throughout the polar region, the area with significant differences is also sharply decreasing.
The obtained spatial distribution of the difference in surface temperature between the “warm” and “cold” composites corresponds to the one identified early in ensemble simulations with the WACCM4 climate model, taking into account seasons with greatly reduced ozone content in the Arctic stratosphere [19].
3.2.5. RMC Difference Between “Warm” and “Cold” Seasons
Latitude–altitude distributions of the RMC and temperature in February for the “warm” and “cold” composites, as well as changes in the corresponding quantities, are shown in the upper panels of Figure 10a–c. As described above, SSWs were detected in the “warm” seasons, which reflect the temperature change in Figure 10c in the polar region. Northward from 55° N, the temperature is higher, and the maximum change is shown at the pressure levels of 100–50 hPa and reaches 15°. This heating is accompanied by an increase in the descending branch of the RMC: the arrows of the RMC increments are directed downwards (Figure 10c). In the mid-latitude stratosphere (between 20° N and 50° N), cooling is observed, which can be explained by an increase in the meridional transport of cold air masses from the equatorial stratosphere in the “warm” seasons. To explain the RMC variations, the lower panels of Figure 10d–f show the distributions of the RMC eddy components generated by waves (the second, “eddy” terms in the right-hand sides of Equations (1) and (2)). If we consider the distributions of these components in the “warm” and “cold” seasons (Figure 10d,e) and the differences between these values (Figure 10f), it is obvious that northward of 40° N in the stratosphere, there is a significant increase in the RMC eddy component caused by the increase in wave activity in the “warm” seasons discussed above. It is this increase in the RMC eddy circulation that plays a crucial role in the strengthening of the descending branch of the RMC, which contributes to the heating of the polar region due to adiabatic processes associated with vertical movements of air parcels.
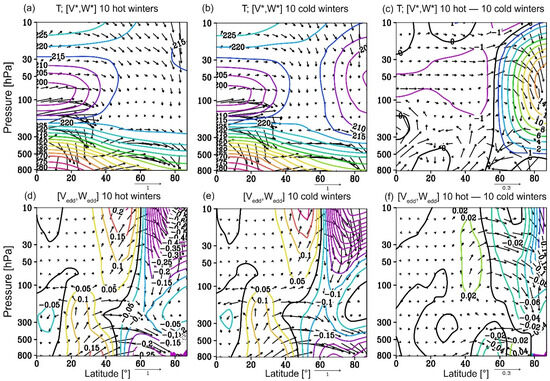
Figure 10.
Altitude–latitude distribution of temperature (K, contours) and the RMC components (m/s, arrows) for “warm” and “cold” composites ((a,b), respectively); the eddy term of the RMC (m/s, arrows) and its vertical component (contours) for the “warm” and “cold” composites ((d,e), respectively); the differences in the corresponding values are shown in panels (c,f). The vertical components are multiplied by 200.
4. Discussion and Conclusions
The present study is dedicated to researching dynamic processes in the winter Arctic related to cooling the lower stratosphere in spring, leading to strong ozone depletion.
For this purpose, the relationship between the temperature of the Arctic lower stratosphere in March and the dynamics of atmospheric planetary wave activity in the preceding period is analyzed. It was shown that correlation coefficients (CCs) between the amplitude of PW1 in February and the temperature of the lower polar stratosphere for the satellite period (1979–2024), calculated using the NCEP and ERA5 reanalysis data, are significant and agree well between these data sets. The maximum value of the CC (~0.7) between the minimum temperature (Tmin) at 70 hPa in the polar region in March and the amplitude of PW1 in February in the reanalysis data was revealed in the lower stratosphere at an isobaric level of 200 hPa. Thus, the amplitude of PW1 in the lower stratosphere in February can be considered as a predictor of Tmin of the Arctic lower stratosphere in March and, consequently, the state of the ozone layer.
To confirm the revealed trends in the relationship between temperature in March and wave activity in February, as well as to increase the studied samples, we used the data from the Earth system models of INMCM5 and SOCOLv4 simulations. The vertical profiles of the CC calculated using the model data display slightly underestimated values in the upper troposphere–lower stratosphere (~0.5) compared to the ones calculated using the reanalysis data, but the general structure of the CC profiles with a maximum nearby 200 hPa is preserved for all simulations.
Further, 10 seasons with the lowest and highest Tmin of the Arctic lower stratosphere in March from 1979 to 2024 were selected to compose “cold” and “warm” composites. The “cold” composite includes, in particular, the seasons of 2011 and 2020 with the largest ozone destruction, whereas the “warm” one includes the seasons with the major SSWs. These composites are not characterized by the dominance of the external climate phenomena capable of influencing the Arctic winter stratosphere: QBO, ENSO, and MJO.
The main conclusions from the results of this analysis can be formulated as follows:
- − “Warm” seasons are characterized by increased pressure over the North Atlantic in the upper troposphere–lower stratosphere and decreased pressure over Northeastern Eurasia and the north of the Pacific Ocean.
- − This is accompanied in “warm” seasons by increased propagation of vertical fluxes of wave activity in the lower stratosphere in February over the North Atlantic and Northeastern Eurasia. A reflection of wave activity is observed during “cold” seasons near 70° N over northern Canada in the region of ~120–90° W in the upper troposphere–lower stratosphere.
- − In the lower stratosphere, the difference in the ozone mixing ratio in the polar region at 70 hPa between the “warm” and “cold” composites reaches 30%. The difference in the rate of ozone destruction in March is also reflected in the total ozone content, which can reach up to ~20%.
- − In the “warm” seasons, in addition to the heating of the polar stratosphere in February, an increase in the descending branch of the RMC is observed. The main part of this increase is played by the wave activity amplification, leading to the acceleration of the induced by waves eddy components of the RMC.
- − In April, the difference between the composites is characterized by positive values of surface temperature up to ~3° K over the American Arctic and negative values up to −5° K over central and eastern Northern Eurasia, in the region where the highest correlation between surface temperature anomalies in April and total ozone content in March was previously found (Stone et al., 2019).
Thus, the strengthening of PW1 in the lower stratosphere and its further upward propagation in February leads to an increase in the temperature of the lower polar stratosphere in March due to the weakening of the polar vortex. In addition, the increase in wave activity determines the strengthening of the eddy RMC component, which causes an increase in descending flows; this also leads to an increase in polar stratospheric temperature. In the future, additional model experiments are required to clarify the features of the interaction of waves with stratospheric circulation, including nonlinear processes.
Supplementary Materials
The following supporting information can be downloaded at: https://www.mdpi.com/article/10.3390/atmos15101237/s1, Figure S1. Altitude–longitude cross-section of geopotential height difference (gpm) in the latitudinal belt 45–75° N (а); polar projections at the pressure levels 200 hPa (b) and 500 hPa (c) in February between “warm” and “cold” composites of seven and thirteen winters (a, b, respectively). Figure S2. Altitude–longitudinal cross-section of difference between geopotential height (contours) and vertical component Fz (vectors) averaged over 55–75° N and 60–80° N of “warm” and “cold” composites (a,b). Fz is multiplied by 100.
Author Contributions
All authors made valuable contributions in writing and editing the text, data analysis, and visualization of the results, including conceptualization of the study, providing the reanalysis data (P.V., A.K. and V.G.), modeling data (E.V. and E.R.), the wave activity analysis (P.V. and V.G.), the calculation of the residual meridional circulation, and the analysis of its changes (A.K.). All authors have read and agreed to the published version of the manuscript.
Funding
Investigation of interannual variability of Arctic stratospheric dynamics, calculation of correlation coefficients, and wave activity fluxes, analysis of NCEP and ERA5 reanalysis data, and INM CM5 and SOCOLv4 modeling data were supported by the Russian Science Foundation (grant # 24-17-00230); calculation and analysis of residual meridional circulation and processing of modeling data were supported by Saint Petersburg University (research grant # 116234986).
Data Availability Statement
The original contributions presented in the study are included in the article/Supplementary Material, further inquiries can be directed to the corresponding author.
Acknowledgments
NCEP reanalysis data were provided by the Climate Prediction Center (NOAA), ERA-Interim reanalysis dataset by Copernicus Climate Change Service. The authors are grateful to two anonymous referees for their useful comments and suggestions.
Conflicts of Interest
The authors declare no conflicts of interest.
References
- Baldwin, M.P.; Birner, T.; Brasseur, G.; Burrows, J.; Butchart, N.; Garcia, R.; Geller, M.; Gray, L.; Hamilton, K.; Harnik, N.; et al. 100 Years of progress in understanding the stratosphere and mesosphere. Meteorol. Monogr. 2019, 59, 27.1–27.62. [Google Scholar] [CrossRef]
- Butchart, N. The stratosphere: A review of the dynamics and variability. Weather Clim. Dynam. 2022, 3, 1237–1272. [Google Scholar] [CrossRef]
- Baldwin, M.P.; Ayarzagüena, B.; Birner, T.; Butchart, N.; Butler, A.H.; Charlton-Perez, A.J.; Domeisen, D.I.; Garfinkel, C.I.; Garny, H.; Gerber, E.P.; et al. Sudden Stratospheric Warmings. Rev. Geophys. 2021, 58, e2020RG000708. [Google Scholar] [CrossRef]
- Мatsuno, T. A dynamical model of sudden stratospheric warming. J. Atmos. Sci. 1971, 28, 871–883. [Google Scholar] [CrossRef]
- Pogoreltsev, A.; Savenkova, E.; Aniskina, O.; Ermakova, T.; Chen, W.; Wei, K. Interannual and intraseasonal variability of stratospheric dynamics and stratosphere-troposphere coupling during northern winter. J. Atmos. Solar-Terr. Phys. 2015, 136, 187–200. [Google Scholar] [CrossRef]
- Cullens, C.; Thurairajah, B. Gravity wave variations and contributions to stratospheric sudden warming using long-term ERA5 model output. J. Atmos. Sol.-Terr. Phys. 2021, 219, 105632. [Google Scholar] [CrossRef]
- Charlton, A.; Polvani, L. A New Look at Stratospheric Sudden Warmings. Part I: Climatology and Modeling Benchmarks. J. Clim. 2007, 20, 449–469. [Google Scholar] [CrossRef]
- Domeisen, D.I.; Butler, A.H.; Charlton-Perez, A.J. The role of the stratosphere in subseasonal to seasonal prediction: 1. Predictability of the stratosphere. J. Geophys. Res. Atmos. 2020, 125, e2019JD030920. [Google Scholar] [CrossRef]
- Karpechko, A. Predictability of Sudden Stratospheric Warmings in the ECMWF Extended Range Forecast System. Mon. Weather Rev. 2018, 146, 1063–1075. [Google Scholar] [CrossRef]
- Tsvetkova, N.D.; Vyzankin, A.S.; Vargin, P.N.; Lukyanov, A.N.; Yushkov, V.A. Investigation and forecast of Sudden Stratospheric Warming events with chemistry climate model SOCOL. In IOP Conference Series: Earth and Environmental Science; IOP Publishing: Bristol, UK, 2020; Volume 606, Available online: https://iopscience.iop.org/article/10.1088/1755-1315/606/1/012062 (accessed on 12 October 2024).
- Rao, J.; Garfinkel, C.; Chen, H.; White, I. The 2019 New Year stratospheric sudden warming and its real-time predictions in multiple S2S models. J. Geophys. Res. Atmos. 2019, 124, 11155–11174. [Google Scholar] [CrossRef]
- Kuttippurath, J.; Godin-Beekmann, S.; Lefèvre, F.; Nikulin, G.; Santee, M.L.; Froidevaux, L. Record-breaking ozone loss in the Arctic winter 2010/2011: Comparison with 1996/1997. Atmos. Chem. Phys. 2012, 12, 7073–7085. [Google Scholar] [CrossRef]
- Lawrence, Z.D.; Perlwitz, J.; Butler, A.H.; Manney, G.L.; Newman, P.A.; Lee, S.H.; Nash, E.R. The remarkably strong Arctic stratospheric polar vortex of winter 2020: Links to record-breaking Arctic Oscillation and ozone loss. J. Geophys. Res. Atmos. 2020, 125, e2020JD033271. [Google Scholar] [CrossRef]
- Manney, G.L.; Santee, M.L.; Rex, M.; Livesey, N.J.; Pitts, M.C.; Veefkind, P.; Nash, E.R.; Wohltmann, I.; Lehmann, R.; Froidevaux, L.; et al. Unprecedented Arctic ozone loss in 2011. Nature 2011, 478, 469–475. [Google Scholar] [CrossRef] [PubMed]
- Smyshlyaev, S.P.; Vargin, P.N.; Motsakov, M.A. Numerical modeling of ozone loss in the exceptional Arctic stratosphere winter-spring of 2020. Atmosphere 2021, 12, 1470. [Google Scholar] [CrossRef]
- Wohltmann, I.; von der Gathen, P.; Lehmann, R.; Maturilli, M.; Deckelmann, H.; Manney, G.L.; Davies, J.; Tarasick, D.; Jepsen, N.; Kivi, R.; et al. Near-complete local reduction of Arctic stratospheric ozone by severe chemical loss in spring 2020. Geophys. Res. Lett. 2020, 47, e2020GL089547. [Google Scholar] [CrossRef]
- Bernhard, G.H.; Fioletov, V.E.; Grooß, J.U.; Ialongo, I.; Johnsen, B.; Lakkala, K.; Manney, G.L.; Müller, R.; Svendby, T. Record-Breaking Increases in Arctic Solar Ultraviolet Radiation Caused by Exceptionally Large Ozone Depletion in 2020. Geophys. Res. Lett. 2020, 47, e2020GL090844. [Google Scholar] [CrossRef]
- Karpechko, A.Y.; Backman, L.; Thölix, L.; Ialongo, I.; Andersson, M.; Fioletov, V.; Heikkilä, A.; Johnsen, B.; Koskela, T.; Kyrölä, E.; et al. The link between springtime total ozone and summer UV radiation in Northern Hemisphere extratropics. J. Geophys. Res. 2013, 118, 8649–8661. [Google Scholar] [CrossRef]
- Calvo, N.; Polvani, L.; Solomon, S. On the surface impact of Arctic stratospheric ozone extremes. Environ. Res. Lett. 2015, 10, 094003. [Google Scholar] [CrossRef]
- Friedel, M.; Chiodo, G.; Stenke, A.; Domeisen, D.; Fueglistaler, S.; Anet, J.; Peter, T. Springtime arctic ozone depletion forces northern hemisphere climate anomalies. Nat. Geosci. 2022, 15, 541–547. [Google Scholar] [CrossRef]
- Gathen, P.; Kivi, R.; Wohltmann, I.; Salawitch, R.; Rex, M. Climate change favours large seasonal loss of Arctic ozone. Nat. Commun. 2021, 12, 3886. [Google Scholar] [CrossRef]
- Vargin, P.N.; Kostrykin, S.V.; Volodin, E.M.; Pogoreltsev, A.I.; Wei, K. Arctic stratosphere circulation changes in XXI century in simulations of INM CM5. Atmosphere 2022, 13, 25. [Google Scholar] [CrossRef]
- Vargin, P.; Kostrykin, S.; Koval, A.; Rozanov, E.; Egorova, T.; Smyshlyaev, S.; Tsvetkova, N. Arctic stratosphere changes in the 21st century in the Earth system model SOCOLv4. Front. Earth Sci. 2023, 11, 1214418. [Google Scholar] [CrossRef]
- Newman, P.; Nash, E.; Rosenfield, J. What controls the temperature of the Arctic stratosphere during the spring? J. Geophys. Res. 2001, 106, 19999–20010. [Google Scholar] [CrossRef]
- Austin, J.; Shindell, D.; Beagley, S.R.; Brühl, C.; Dameris, M.; Manzini, E.; Nagashima, T.; Newman, P.; Pawson, S.; Pitari, G.; et al. Uncertainties and assessments of chemistry-climate models of the stratosphere. Atmos. Chem. Phys. 2003, 3, 1–27. [Google Scholar] [CrossRef]
- Koval, A.V.; Didenko, K.A.; Ermakova, T.S.; Gavrilov, N.M.; Sokolov, A.V. Changes in general circulation of the middle and upper atmosphere associated with main and transitional QBO phases. Adv. Space Res. 2024. [CrossRef]
- Kalnay, E.; Kanamitsu, M.; Kistler, R.; Collins, W.; Deaven, D.; Gandin, L.; Iredell, M.; Saha, S.; White, G.; Woollen, J.; et al. The NCEP/NCAR 40-year reanalysis project. Bull. Am. Meteorol. Soc. 1996, 77, 437–470. [Google Scholar] [CrossRef]
- Hersbach, H.; Bell, B.; Berrisford, P.; Hirahara, S.; Horányi, A.; Muñoz-Sabater, J.; Nicolas, J.; Peubey, C.; Radu, R.; Schepers, D.; et al. The ERA5 global reanalysis. Q. J. R. Met. Soc. 2020, 146, 1999–2049. [Google Scholar] [CrossRef]
- Gelaro, R.; McCarty, W.; Suárez, M.J.; Todling, R.; Molod, A.; Takacs, L.; Randles, C.A.; Darmenov, A.; Bosilovich, M.G.; Reichle, R.; et al. The Modern-Era Retrospective Analysis for Research and Applications, Version 2 (MERRA-2). J. Clim. 2017, 30, 5419–5454. [Google Scholar] [CrossRef]
- Ayarzaguena, B.; Palmeiro, F.; Barriopedro, D.; Calvo, N.; Langematz, U.; Shibata, K. On the representation of major stratospheric warmings in reanalyses. Atmos. Chem. Phys. 2019, 19, 9469–9484. [Google Scholar] [CrossRef]
- Volodin, E.M.; Mortikov, E.V.; Kostrykin, S.V.; Galin VYa Lykosov, V.N.; Gritsun, A.S.; Diansky, N.A.; Gusev, A.V.; Yakovlev, N.G. Simulation of modern climate with the new version of the INM RAS climate model. Izv. Atmos. Ocean. Phys. 2017, 53, 142–155. [Google Scholar] [CrossRef]
- Volodin, E.M.; Gritsun, A.S. Simulation of Possible Future Climate Changes in the 21st Century in the INM-CM5 Climate Model. Izv. Atmos. Ocean. Phys. 2020, 56, 218–228. [Google Scholar] [CrossRef]
- Karagodin-Doyennel, A.; Rozanov, E.; Sukhodolov, T.; Egorova, T.; Sedlacek, J.; Peter, T. The future ozone trends in changing climate simulated with SOCOLv4. EGUsphere 2023, 23, 4801–4817. [Google Scholar] [CrossRef]
- Sukhodolov, T.; Egorova, T.; Stenke, A.; Ball, W.T.; Brodowsky, C.; Chiodo, G.; Feinberg, A.; Friedel, M.; Karagodin-Doyennel, A.; Peter, T.; et al. Atmosphere–ocean–aerosol–chemistry–climate model SOCOLv4.0: Description and evaluation. Geosci. Model. Dev. 2021, 14, 5525–5560. [Google Scholar] [CrossRef]
- Riahi, K.; Van Vuuren, D.P.; Kriegler, E.; Edmonds, J.; O’neill, B.C.; Fujimori, S.; Bauer, N.; Calvin, K.; Dellink, R.; Fricko, O.; et al. The Shared Socioeconomic Pathways and their energy, land use, and greenhouse gas emissions implications: An overview. Glob. Environ. Chang. 2017, 42, 153–168. [Google Scholar] [CrossRef]
- Zhao, S.; Yu, Y.; Lin, P.; Liu, H.; He, B.; Bao, Q.; Guo, Y.; Hua, L.; Chen, K.; Wang, X. Datasets for the CMIP6 Scenario Model Intercomparison Project (Scenario MIP) Simulations with the Coupled Model CAS FGOALS-f3-L. Adv. Atmos. Sci. 2020, 38, 329–339. [Google Scholar] [CrossRef]
- Plumb, R. On the Three-Dimensional Propagation of Stationary Waves. J. Atmos. Sci. 1985, 42, 217–229. [Google Scholar] [CrossRef]
- Gečaitė, I. Climatology of three-dimensional Eliassen–Palm wave activity fluxes in the northern hemisphere stratosphere from 1981 to 2020. Climate 2021, 9, 124. [Google Scholar] [CrossRef]
- Wei, K.; Ma, J.; Chen, W.; Vargin, P. Longitudinal peculiarities of planetary waves-zonal flow interaction and its role in stratosphere-troposphere dynamical coupling. Clim. Dyn. 2021, 57, 2843–2862. [Google Scholar] [CrossRef]
- Andrews, D.G.; Holton, J.R.; Leovy, C.B. Middle Atmosphere Dynamics; Academic Press: Orlando, FL, USA, 1987. [Google Scholar]
- Koval, A.V.; Chen, W.; Didenko, K.A.; Ermakova, T.S.; Gavrilov, N.M.; Pogoreltsev, A.I.; Toptunova, O.N.; Wei, K.; Yarusova, A.N.; Zarubin, A.S. Modelling the residual mean meridional circulation at different stages of sudden stratospheric warming events. Ann. Geophys. 2021, 39, 357–368. [Google Scholar] [CrossRef]
- Wilks, D.S. Statistical Methods in the Atmospheric Sciences Oxford; Elsevier: Amsterdam, The Netherlands, 2006. [Google Scholar]
- Hitchcock, P. On the value of reanalyses prior to 1979 for dynamical studies. Atmos. Chem. Phys. 2019, 19, 2749–2764. [Google Scholar] [CrossRef]
- Gómez-Escolar, M.; Fueglistaler, S.; Calvo, N.; Barriopedro, D. Changes in polar stratospheric temperature climatology in relation to stratospheric sudden warming occurrence. Geophys. Res. Lett. 2012, 39. [Google Scholar] [CrossRef]
- Ayarzagüena, B.; Langematz, U.; Serrano, E. Tropospheric forcing of the stratosphere: A comparative study of the two different major stratospheric warmings in 2009 and 2010. J. Geophys. Res. 2011, 116, D18114. [Google Scholar] [CrossRef]
- Nath, D.; Chen, W.; Zelin, C.; Pogoreltsev, A.I.; Wei, K. Dynamics of 2013 Sudden Stratospheric Warming event and its impact on cold weather over Eurasia: Role of planetary wave reflection. Sci. Rep. 2016, 6, 24174. [Google Scholar] [CrossRef] [PubMed]
- Birner, T.; Albers, J. Sudden Stratospheric Warmings and Anomalous Upward Wave Activity Flux. Sola 2017, 13A, 8–12. [Google Scholar] [CrossRef]
- Zyulyaeva, Y.A.; Zhadin, E.A. Analysis of three-dimensional Eliassen-Palm fluxes in the lower stratosphere. Russ. Meteorol. Hydrol. 2009, 34, 483–490. [Google Scholar] [CrossRef]
- Stone, K.A.; Solomon, S.; Kinnison, D.E.; Baggett, C.F.; Barnes, E.A. Prediction of Northern Hemisphere regional surface temperatures using stratospheric ozone information. J. Geophys. Res. Atmos. 2019, 124, 5922–5933. [Google Scholar] [CrossRef]
Disclaimer/Publisher’s Note: The statements, opinions and data contained in all publications are solely those of the individual author(s) and contributor(s) and not of MDPI and/or the editor(s). MDPI and/or the editor(s) disclaim responsibility for any injury to people or property resulting from any ideas, methods, instructions or products referred to in the content. |
© 2024 by the authors. Licensee MDPI, Basel, Switzerland. This article is an open access article distributed under the terms and conditions of the Creative Commons Attribution (CC BY) license (https://creativecommons.org/licenses/by/4.0/).