Article

Spatially Heterogeneous Effects of Atmospheric Circulation on Greenland Ice Sheet Melting

1
Jinan Meteorological Bureau, Jinan 250102, China
2
Key Laboratory of Regional Climate-Environment for Temperate East Asia, Institute of Atmospheric Physics, Beijing 100029, China
3
Shandong Institute of Meteorological Sciences, Jinan 250031, China
4
Shandong Meteorological Observatory, Jinan 250031, China
*
Author to whom correspondence should be addressed.
Atmosphere 2024, 15(1), 57; https://doi.org/10.3390/atmos15010057
Submission received: 23 November 2023 / Revised: 24 December 2023 / Accepted: 28 December 2023 / Published: 31 December 2023
(This article belongs to the Special Issue Arctic Atmosphere–Sea Ice Interaction and Impacts)

Abstract

:
The melting of the Greenland ice sheet (GrIS) in summer has rapidly and significantly increased in recent decades, especially for the northern GrIS. Circulation related to GrIS melting is important for understanding the contribution of the GrIS to the global sea level. In this paper, we used the SOM method to obtain three spatial patterns of GrIS melting based on model output data: overall melting, northern melting, and southern melting patterns. We also examined their linkages to the observed atmospheric circulation. GrIS melting is primarily related to Greenland blocking (GB), while different types of GB are responsible for different melting patterns. The overall and northern melting patterns are both associated with high-latitude GB, which is associated with the decay and westward movement of mid-latitude and high-latitude European blocking (EB), respectively. It is found that the generation of mid-latitude and high-latitude EBs are related to mid-latitude eastern North Atlantic warming and Greenland–Norskehavet–North Sea warming, respectively, while the movement of EB is related t upstream weakened zonal wind anomalies. Furthermore, the southern melting pattern is linked to mid-latitude GB, which is associated with the wave train from the East Pacific to Southern Greenland through North America and further related to the mid-latitude of East Pacific warming.

1. Introduction

The Greenland ice sheet (GrIS) is the largest ice mass in the Northern Hemisphere. Since the 1990s, the summer temperature in Greenland has increased by 2 °C, which is more than twice the global warming rate over the same period [1]. The melting of the GrIS has also increased at a faster rate, especially after 2000 [2,3,4]. Sensitive to both local and global climate change, the GrIS has important climate impacts [5]. The melting of the GrIS is currently one of the largest contributors to mean global sea level rise [1,6], and it also has an influence on the weakening of the Atlantic meridian overturning circulation [6,7,8,9,10]. The results of numerical models indicate that the melting of the GrIS will be further intensified in the future [6,11]. Goelzer et al. [6] pointed out that the GrIS will continue to lose mass until 2100, contributing 90 ± 50 and 32 ± 17 mm under the RCP8.5 and RCP2.6 scenarios to sea level rise, respectively. Therefore, a deeper understanding of the GrIS melting process is important for assessing future sea level rise and other related climate changes.
In recent decades, the GrIS has experienced several record-breaking melting events in summer, such as in 2012 and 2019 [11,12,13,14,15,16]. Since such severe low-probability extreme events have increased in frequency, it is necessary to explore the reasons behind them. Studies have indicated that increasing temperatures are the primary factor contributing to GrIS melting [13,17]. Surface air temperature in Greenland is closely related to atmospheric circulation, especially for Greenland blocking (GB) [14,18] and the negative phase of North Atlantic oscillation (NAO) [19,20,21,22]. Studies have indicated several factors contributing to the melting of the GrIS, such as surface temperature changes in Greenland [18], cloud cover reduction [21,23], and water vapor transport [24].
It is certain that global warming contributes to GrIS surface melting [25,26]; however, more and more studies have pointed out the important effects of internal variability on extreme events, especially a positive Atlantic multidecadal oscillation (AMO) phase (AMO+) and negative NAO phase (NAO). For the extreme melting events in 2012 and 2019, the roles of NAO and GB outweighed the impact of global warming [27]. The transition of AMO to a positive phase in the late 1990s largely explains the accelerated melting of GrIS since the 1990s [28,29,30,31]. AMO+ enhances the frequency of extratropical cyclones in the North Atlantic, which are generally generated in the upstream of GB. Warm advection from extratropical storms increases the latent heat flux, which improves the conditions for GrIS melting [32].
GrIS melting occurs mainly in the periphery of Greenland and is influenced by sub-polar North Atlantic warming. Hanna et al. [28] mentioned that NAO does not adequately explain the abnormal GB pattern, implying the involvement of intricate interactions between the atmosphere and ocean. Positive SST anomalies around Greenland will indirectly impact the melting of the GrIS by influencing local atmospheric circulation [2,28,33]. The ocean surface wind anomaly field caused by atmospheric circulation leads to the inflow of warmer and saltier water in the subtropical zone, which causes the warming of the subpolar North Atlantic [34,35,36]. This promotes GrIS melting and, in turn, influences local atmospheric circulation. The ocean surrounding Greenland is the main source of water vapor for Greenland and is sensitive to variations in local atmospheric circulation, especially the NAO [37]. Water vapor provided by the ocean not only has effects on southern Greenland but may also continue to transport northward along the blocking circulation [16,38,39,40], especially through the Davis Strait [24,41,42,43]. Fausto et al. [44] showed that the increased contribution of non-radiative flux to the western and southern GrIS melting of the 2012 extreme melting event was related to North Atlantic warming [39].
Due to its complex topography, the acceleration of GrIS melting is heterogeneous, with the most intense melting occurring in the southern and western GrIS [45,46]. However, the northern GrIS has experienced faster melting in recent years [19,31]. Tedesco et al. [17] pointed out that extreme atmospheric circulation promotes runoff in the northern GrIS while inhibiting melting of the southern GrIS. Mattingly et al. [47] attributed the increasing melting of the northern GrIS to atmospheric rivers, affecting Northwest Greenland and inducing Foehn winds in the northeast. Studies have demonstrated that GB has effects on cloud cover [20,23] and temperature advection, further influencing surface energy flux processes [17,18,48] and resulting in spatial variations in GrIS melting. Preece et al. [49] divided GB into 12 modes and pointed out that omega pattern blocking is responsible for the recent acceleration in GrIS mass loss. However, they did not further clarify the reasons for this. Differences in wind direction can also play a role in heterogeneous melting. Westerly or southerly winds lead to more cloud cover over Western Greenland in the summer, which influences surface melting [50,51]. Moreover, water vapor transport in Western Greenland is warmer and wetter than in the eastern region, also contributing to the heterogeneous melting of the GrIS [24]. Hence, it is necessary to discuss the regional differences in GrIS melting.
In this paper, we focus on the influencing factors of different spatial melting patterns. We will classify summer GrIS melting fields (from June to August) to determine different spatial patterns of GrIS melting. Then, the dominant factors affecting these patterns will be examined from the perspective of atmospheric circulation and oceanic variations, while the causes of different melting patterns will be ascertained through a comparative analysis. Section 2 describes the data and methods used in this paper. In Section 3.1, we show the melting characteristics of the GrIS from 1950 to 2021. In Section 3.2, the extreme melting events for various melting modes are identified and the corresponding atmospheric circulation characteristics are presented. In Section 3.3, we explain the generation of GB related to extreme melting events for various melting modes. In Section 3.4, we establish the factors influencing the evolution of atmospheric circulation under different backgrounds from the perspective of SST and zonal wind anomalies. Section 4 contains the conclusions and discussion.

2. Data and Methods

We used daily-mean reanalysis data from June to August with a horizontal resolution of 1° × 1° grid points from the ERA5 dataset (the fifth-generation ECMWF reanalysis for global climate and weather) during 1950–2021 [52,53], including the geopotential height at 500 hPa (Z500), surface air temperature (SAT) (air temperature at 2 m above the Earth’s surface), zonal and meridional winds at 500 hPa (U500 and V500), sea surface temperature (SST), surface-sensitive heat flux, and surface-latent heat flux (SSHF and SLHF). Furthermore, we used daily meltwater production (ME), which is the output data from version 3.12 of the regional climate model Modèle Atmosphérique Régional (MAR) [54,55], for 1950–2021 to describe the daily GrIS melting. We also used the downward shortwave radiation, upward shortwave radiation, downward longwave radiation, and upward longwave radiation data from this dataset. The net downward shortwave radiation (SWDnet) is defined as the downward shortwave radiation minus the upward shortwave radiation, while the net upward longwave radiation (LWUnet) is defined as the upward longwave radiation minus the downward longwave radiation. The daily melting area data for Greenland from April to October during 1979–2021 was taken from the National Snow and Ice Data Center (NSCDI) [56].
Self-organizing maps (SOMs) is an unsupervised clustering method that is used to transform the input signal pattern of any dimension into one-dimensional or two-dimensional discrete mapping and to perform such transformations adaptively in a topologically ordered way [57]. To classify the melting patterns for the GrIS, we performed SOMs with 2 × 2 nodes, 2 × 3 nodes, and 2 × 4 nodes. We found that an SOM with 2 × 2 nodes is not large enough to fully capture characteristic patterns, while an SOM with 2 × 4 nodes produces similar results to an SOM with 2 × 3 nodes. For the sake of convenience, we only show the results of an SOM with 2 × 3 nodes. We also performed an empirical orthogonal function (EOF) method for the ME field. Although EOF can extract independent modes, it cannot directly reflect the real modes, and the representation of a physical mechanism may require a combination of multiple modes. Therefore, we will conduct research based on the results of SOMs.
The horizontal wave activity flux (WAF) is calculated based on the formulation given by Plumb [58]:
W A F = p p 0 c o s φ v 2 1 2 ω R s i n 2 φ v Z λ u v + 1 2 ω R s i n 2 φ u Z λ
where p 0 is standard atmospheric pressure, which is 1000 hPa here; and p ,   φ ,   λ ,   ω ,   R are the pressure, latitude, longitude, earth rotation rate and earth radius, respectively. Additionally, u , v , Z are the zonal wind, meridional wind, and geopotential height zonal deviation, respectively.
We define any day when the daily ME exceeds the 90th percentile of the daily ME series to be an extreme GrIS melting day. An extreme GrIS melting event (EGIME) is defined when extreme GrIS days persist for three consecutive days or more.

3. Results

3.1. The Characteristics of GrIS Melting

Figure 1a shows the monthly GrIS melting area from April to October averaged from 1979 to 2021. It is found that although GrIS melting begins in April, it mostly occurs from June to August with the increasing temperature. Therefore, we discuss the melting from June to August. The time series of the JJA-mean melting area during the time period of 1979–2021 for non-detrended (Figure 1b, red bar) and detrended (Figure 1b, black solid line) cases are shown in Figure 1b. It can be found that the melting area has an obvious increasing trend prior to 2011. According to the calculation, the melting area of the GrIS expanded at a rate of 7.52 × 10³ km2/yr during 1979–2011, while it was 5.33 × 10³ km2/yr during 1979–2021. After removing the long-term trend, the GrIS melting area grows at a rate of 2.20 × 10³ km2/yr for 1979–2011. The increase is predominantly caused by global warming (black dashed line). In addition, it is found that the melting area in 2012 is unusually prominent.
Figure 1c shows the spatial pattern JJA-mean ME anomaly averaged from 1951 to 2021. It turns out that in the summer, GrIS melting mostly takes place in the periphery. In addition, it has been shown that the melting is more intense south of 75° N, especially for the southwestern GrIS, which is related to warmer air and sea surface temperatures and more water vapor transport [24]. Thus, Greenland is simply categorized as north and south of 75° N in this section. Figure 1d,e shows the ME anomaly averaged over all of Greenland (black bar), Northern Greenland (red line, north of 75° N) and Southern Greenland (blue line, south of 75° N) during 1951–2021 for the non-detrended (Figure 1d) and detrended (Figure 1e) cases. It is found from Figure 1d that the melting of the GrIS has noticeably increased since 2000. However, there is a more significant decadal signal for the detrended ME anomaly, which should be noted and is consistent with the phase transition of AMO (Figure 1d). For the non-detrended overall GrIS, northern GrIS and southern GrIS, the growth rates of ME between 2000 and 2021 were 0.06 mmWE/yr, 0.10 mmWE/yr, and 0.04 mmWE/yr, respectively. Meanwhile, the growth rates of ME during this period, when the long-term trend was removed, were 0.02 mmWE/yr, 0.06 mmWE/yr, and 0.00 mmWE/yr. These results suggest that, although global warming contributed to GrIS melting, the contribution of natural variability should not be underestimated. Additionally, the melting of the southern GrIS varies more gradually than that of the northern GrIS, despite the southern GrIS melting being more intense. The southern GrIS is closer to the North Atlantic and is impacted by both the atmosphere and the ocean [2], while the northern GrIS is located at an extremely high latitude, surrounded by sea ice, and is more directly influenced by atmospheric circulation (primarily GB). Furthermore, Figure 1b,f shows that AMO has an important effect on meltwater at a decadal scale but no obvious effect on the melting area of the GrIS. However, the detrended GrIS melting area has a decreasing trend after 2012, while the domain–mean ME anomaly shows an increasing trend, indicating that regional melting is increasing.
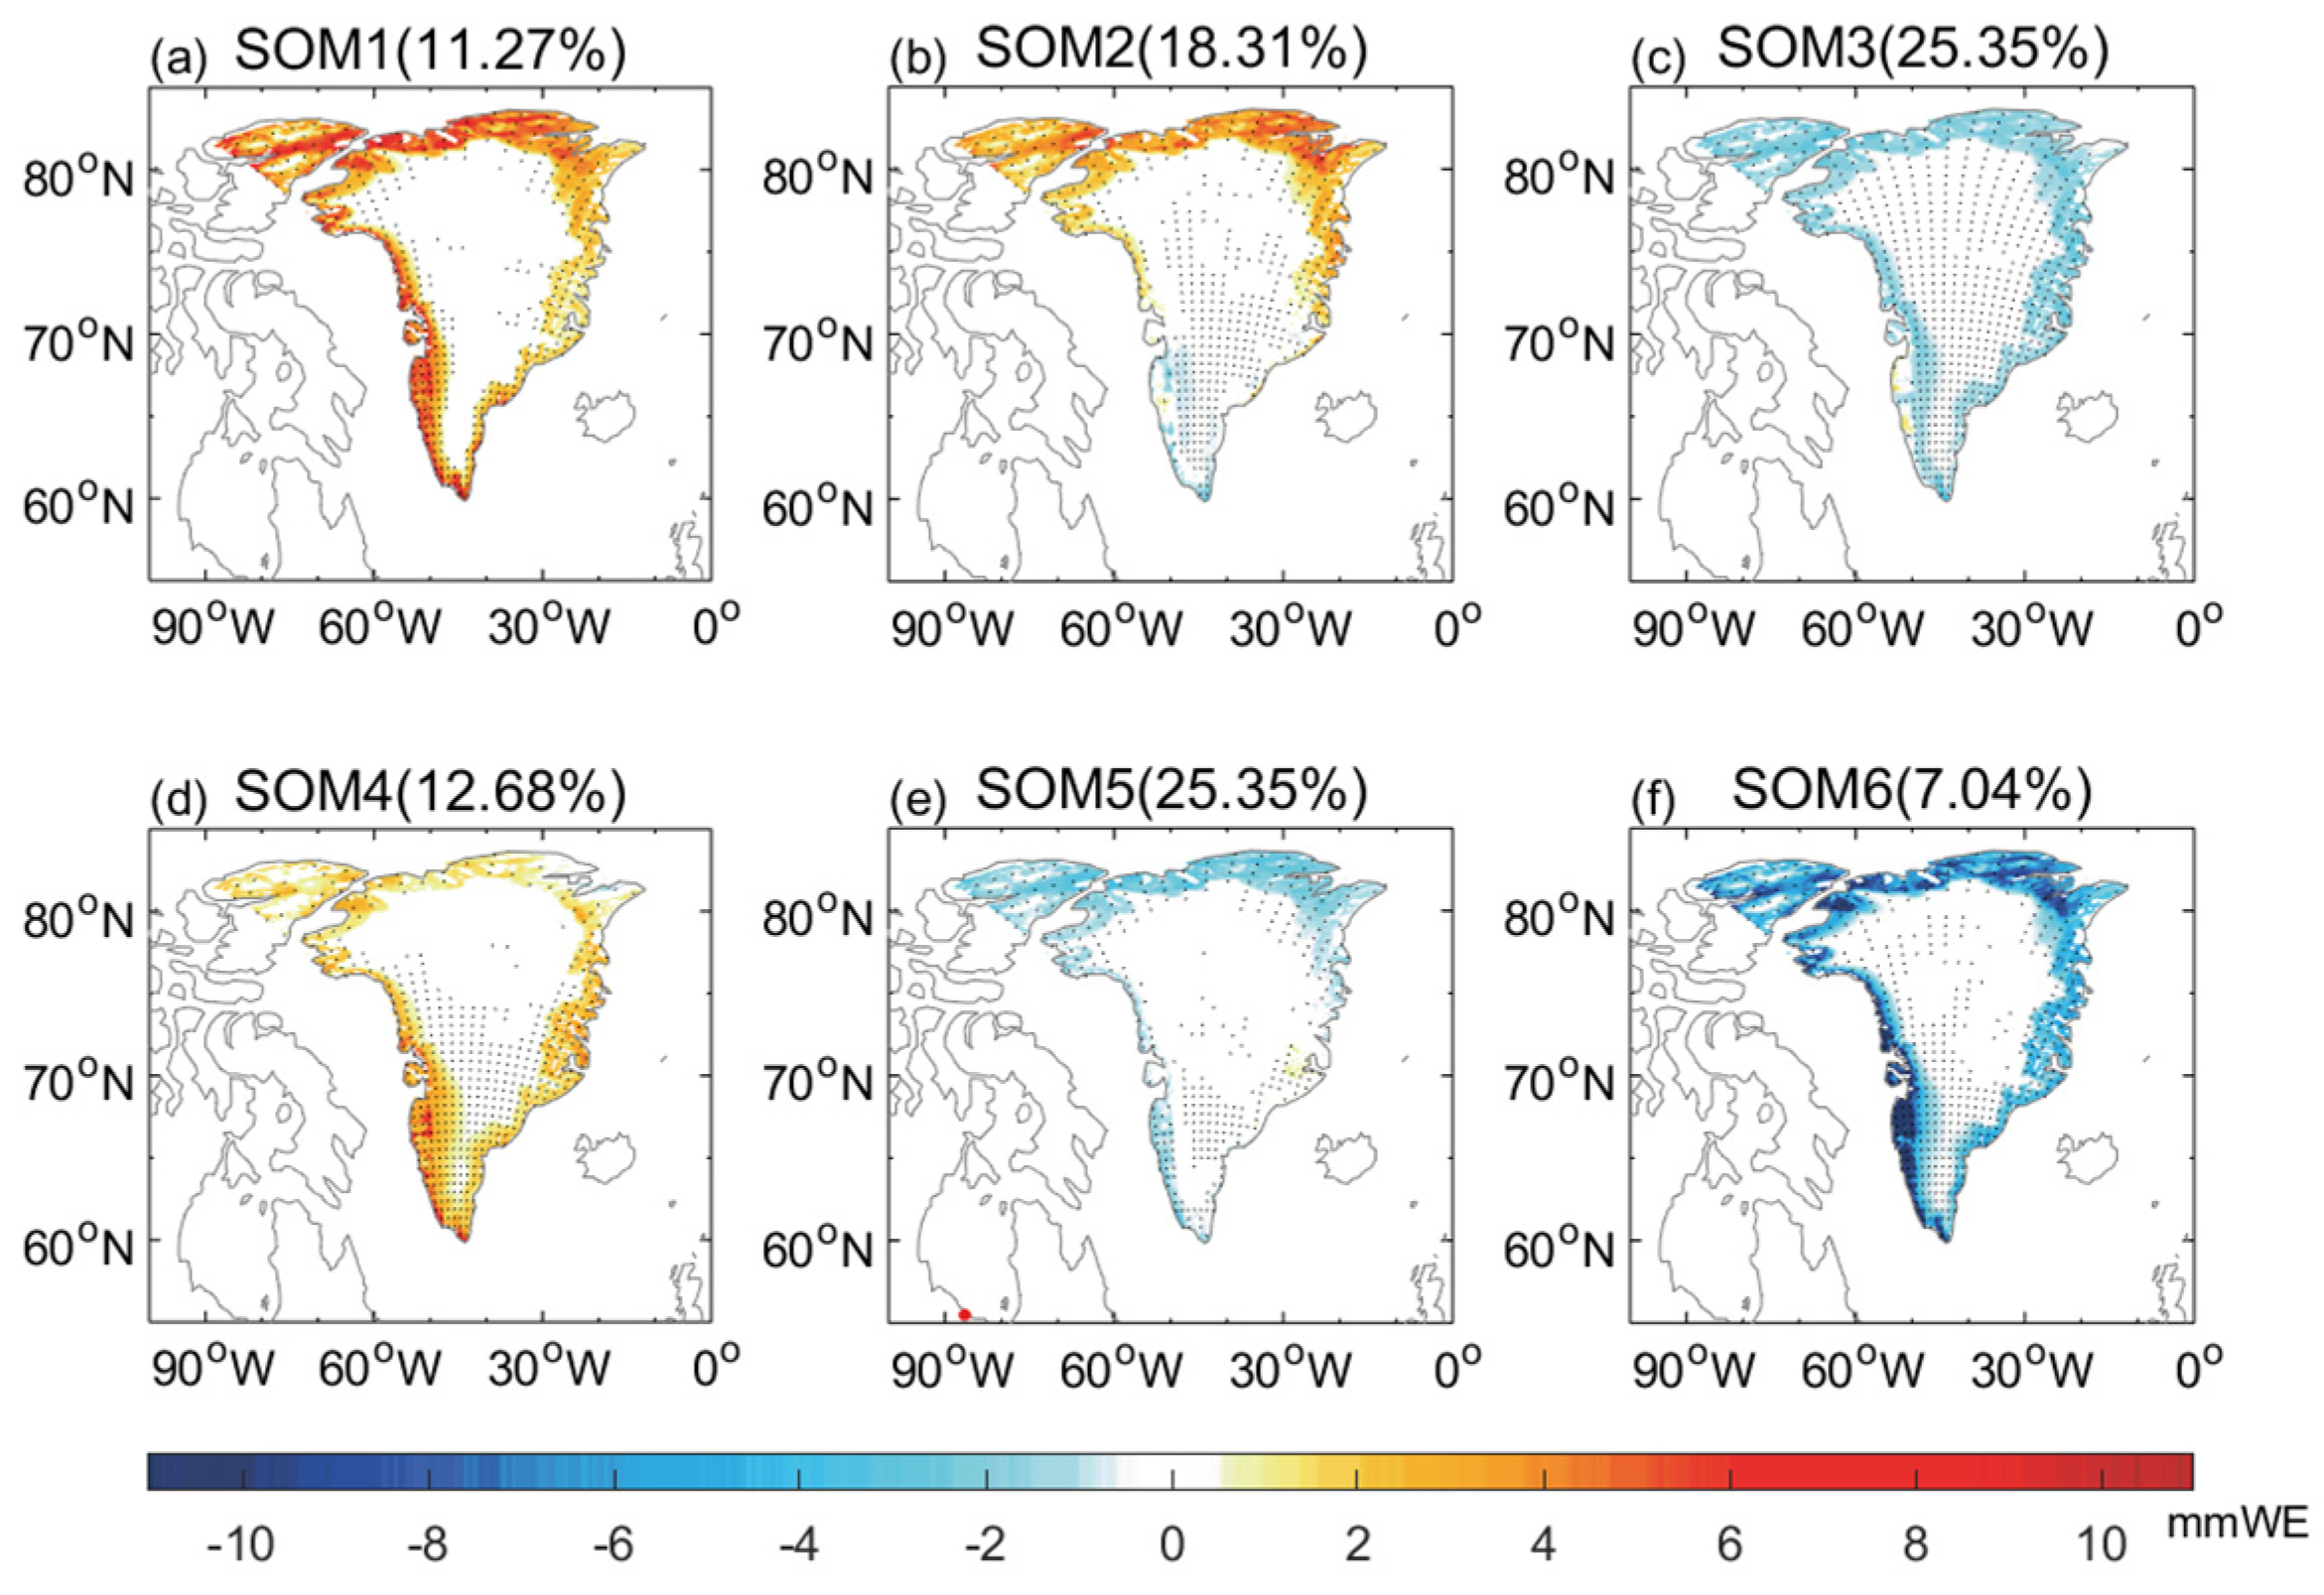
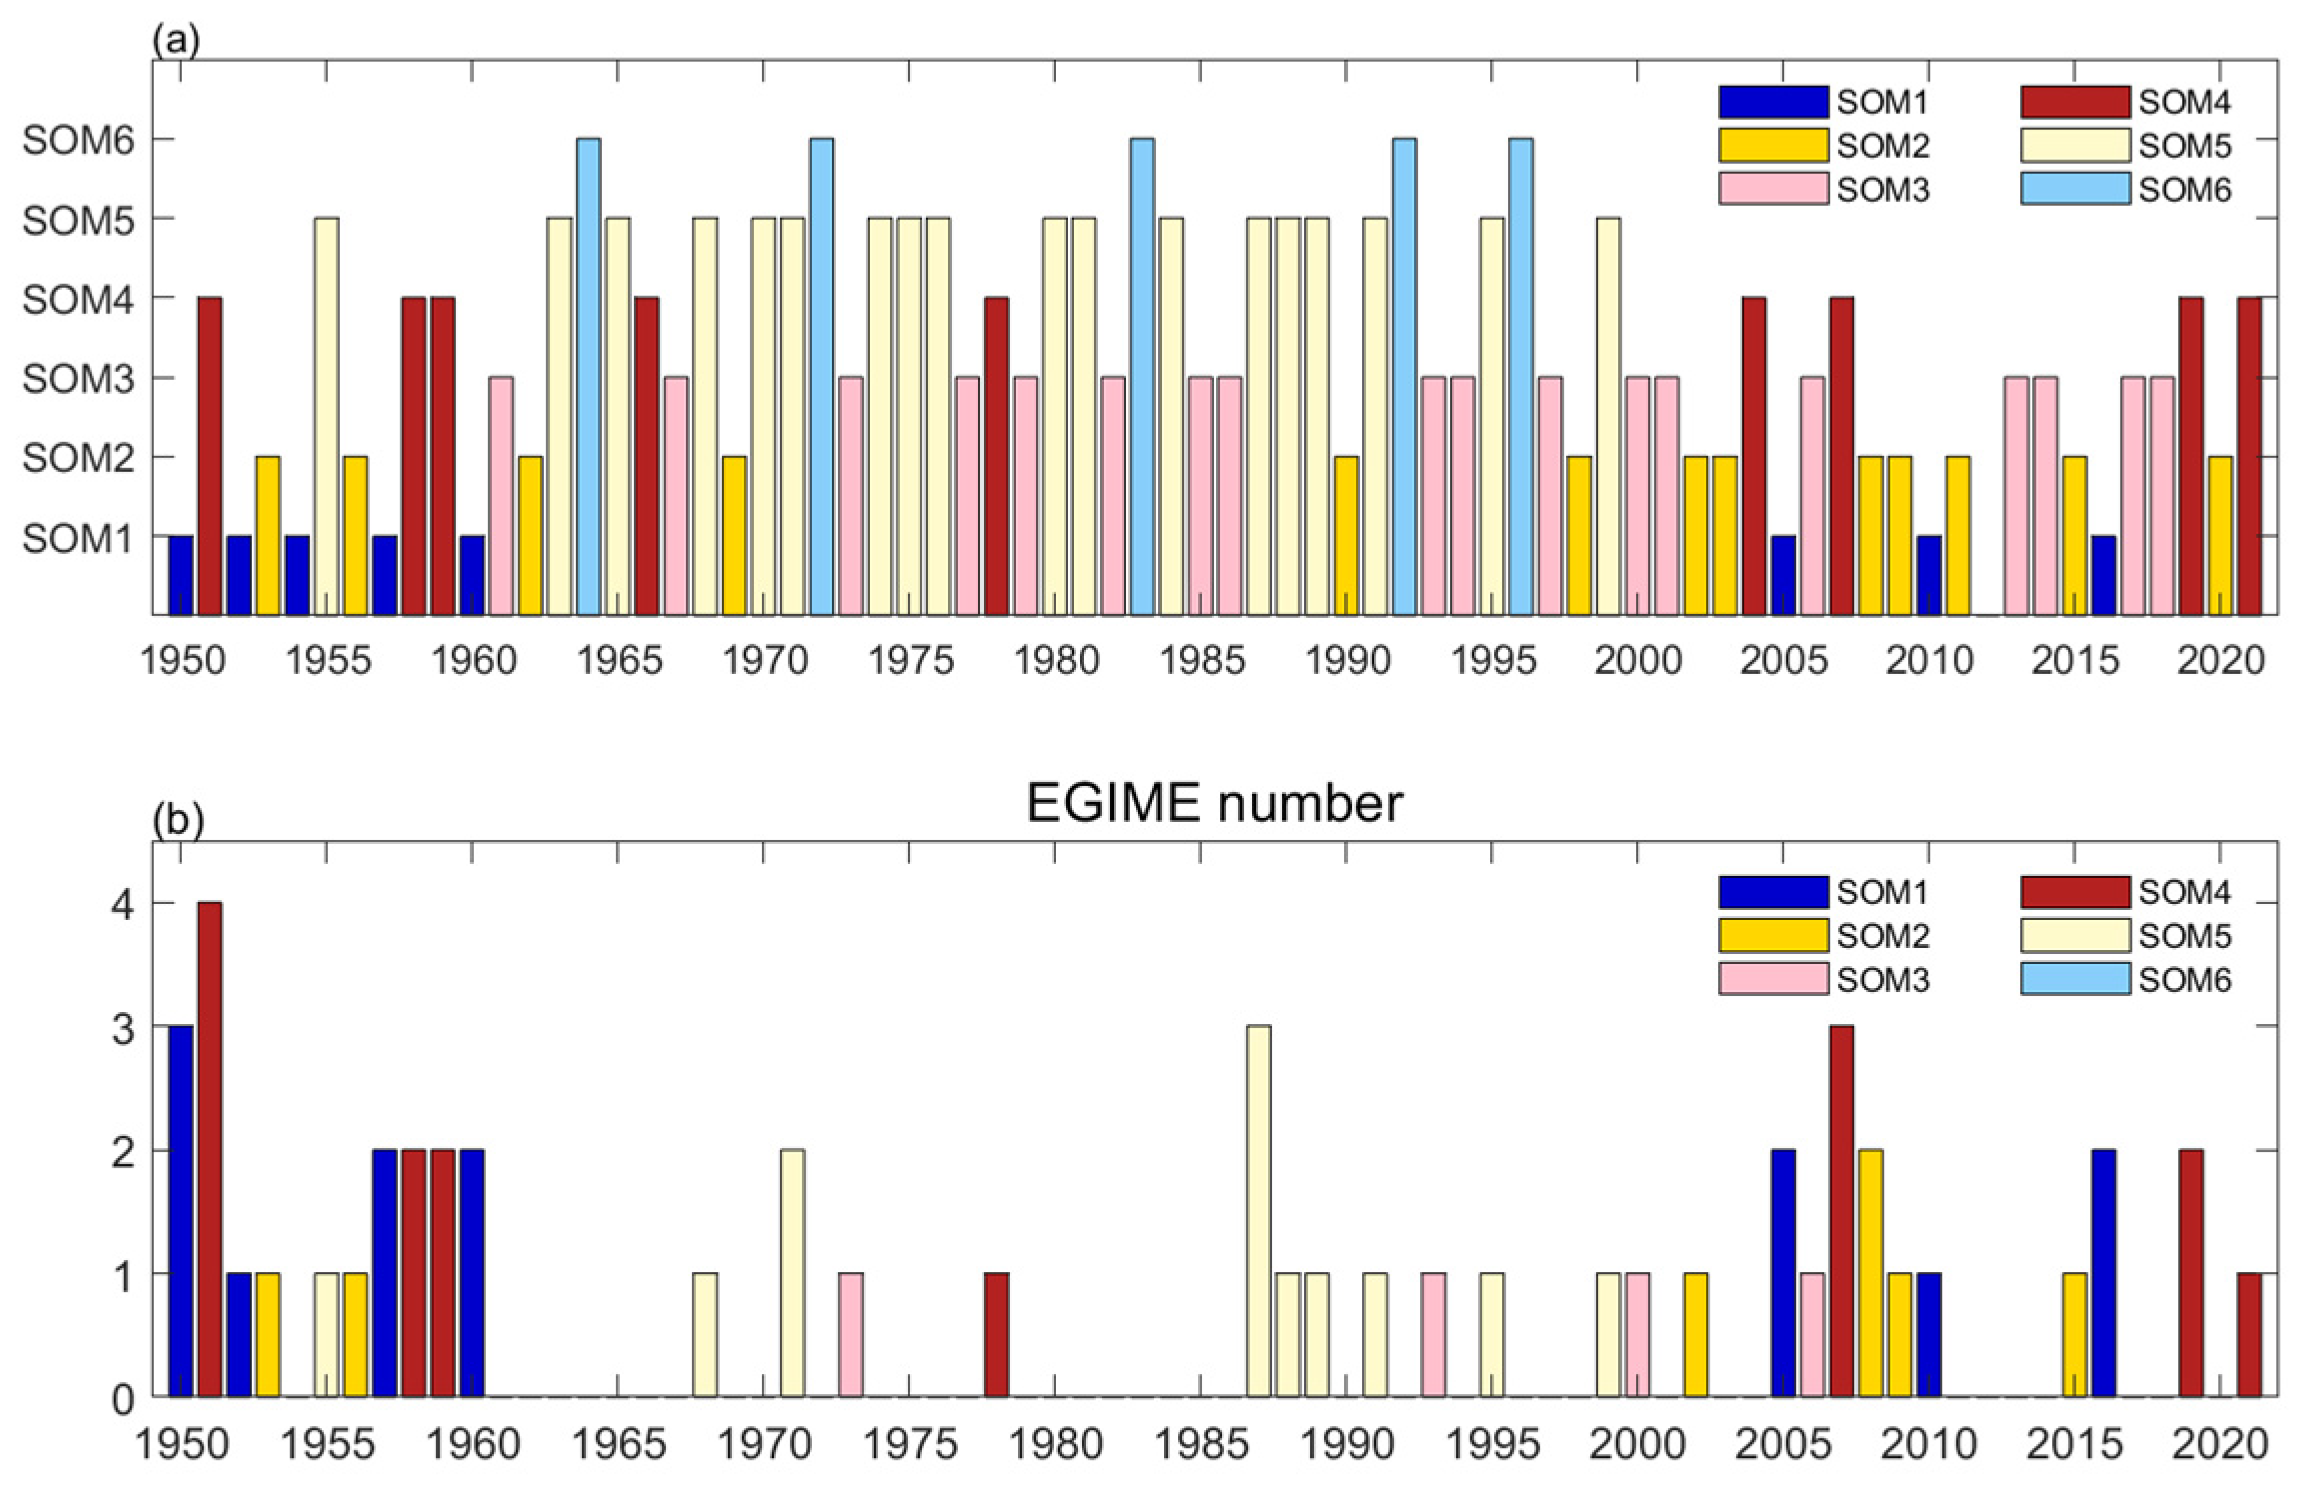
To identify the spatial and temporal distribution of GrIS melting, we classified the ME anomaly field from 1950 to 2021 using the SOM method. During the process, we discovered that the ME in 2012 was extreme, which impeded the analysis. Therefore, the year 2012 is excluded here and in all subsequent research. Figure 2a–f shows the six spatial modes for the ME anomaly based on the SOM method. Three couples of modes are identified for the ME anomaly: SOM1 and SOM6, SOM2 and SOM5, and SOM3 and SOM4, while there are three modes represent significant melting: SOM1, SOM2, and SOM4. SOM1 depicts the significant melting of the overall periphery, while SOM2 and SOM4 represent the major melting for the northern GrIS and southern GrIS, respectively. Figure 3a is the time series of the best-matching unit for these six modes. SOM1, SOM2, and SOM4 are shown to predominately occur before 1970 and after 1990, indicating the role of AMO+ [28,58]. The frequency of SOM2 has increased since 1990, while this trend is opposite for the SOM1 mode, suggesting that the northern GrIS has recently been melting at an increased rate. Since SOM2 has a smaller melting area, the increase in its frequency after 2000 may explain the decreased melting area (Figure 1b). We also noticed that there was extreme melting of the northern GrIS over the summer in 2019 [16], which is included in SOM2. Since the occurrence of extreme melting events is the predominant cause of positive melting anomalies, we will first identify extreme melting events and explore what causes the melting of different types.

3.2. Impacts of Greenland Blocking on Extreme GrIS Melting Events for Different Modes

Numerous academics have been interested in the growing frequency of extreme GrIS melting in recent years [15,16]. We further discuss the characteristics and contributing factors of extreme GrIS melting for each of the three major melting modes. It is found from Figure 3b that EGIMEs mostly occurred before 1960 and after 1990, corresponding to positive AMO years, and for the SOM1, SOM2, and SOM4 years, EGIMEs tended to occur more than two times a year.
For a better understanding, we refer to SOM1, SOM2, and SOM4 as overall GrIS melting (OGM), the northern GrIS melting (NGM), and the southern GrIS melting (SGM) modes as noted. We define the melting peak day as the lag0 day. Based on the duration of EGIME, we define the lag-5 to lag5 days as the extreme melting period, lag-15 to lag-5 days as the pre-melting period, and lag5 to lag15 days as the post-melting period. We also define the frequency of EGIME as the number of EGIMEs each year. The number of extreme GrIS melting days during an EGIME determines its duration. The ME anomaly averaged over all of Greenland from the lag-5 to lag5 days represents the intensity of one EGIME. Table 1 indicates that the SGM mode is the most likely type of EGIME, since its frequency and intensity are the highest and its duration is only second to the NGM mode’s. NGM has the longest duration despite having the lowest frequency, suggesting that it is more likely to have long-lasting impacts.
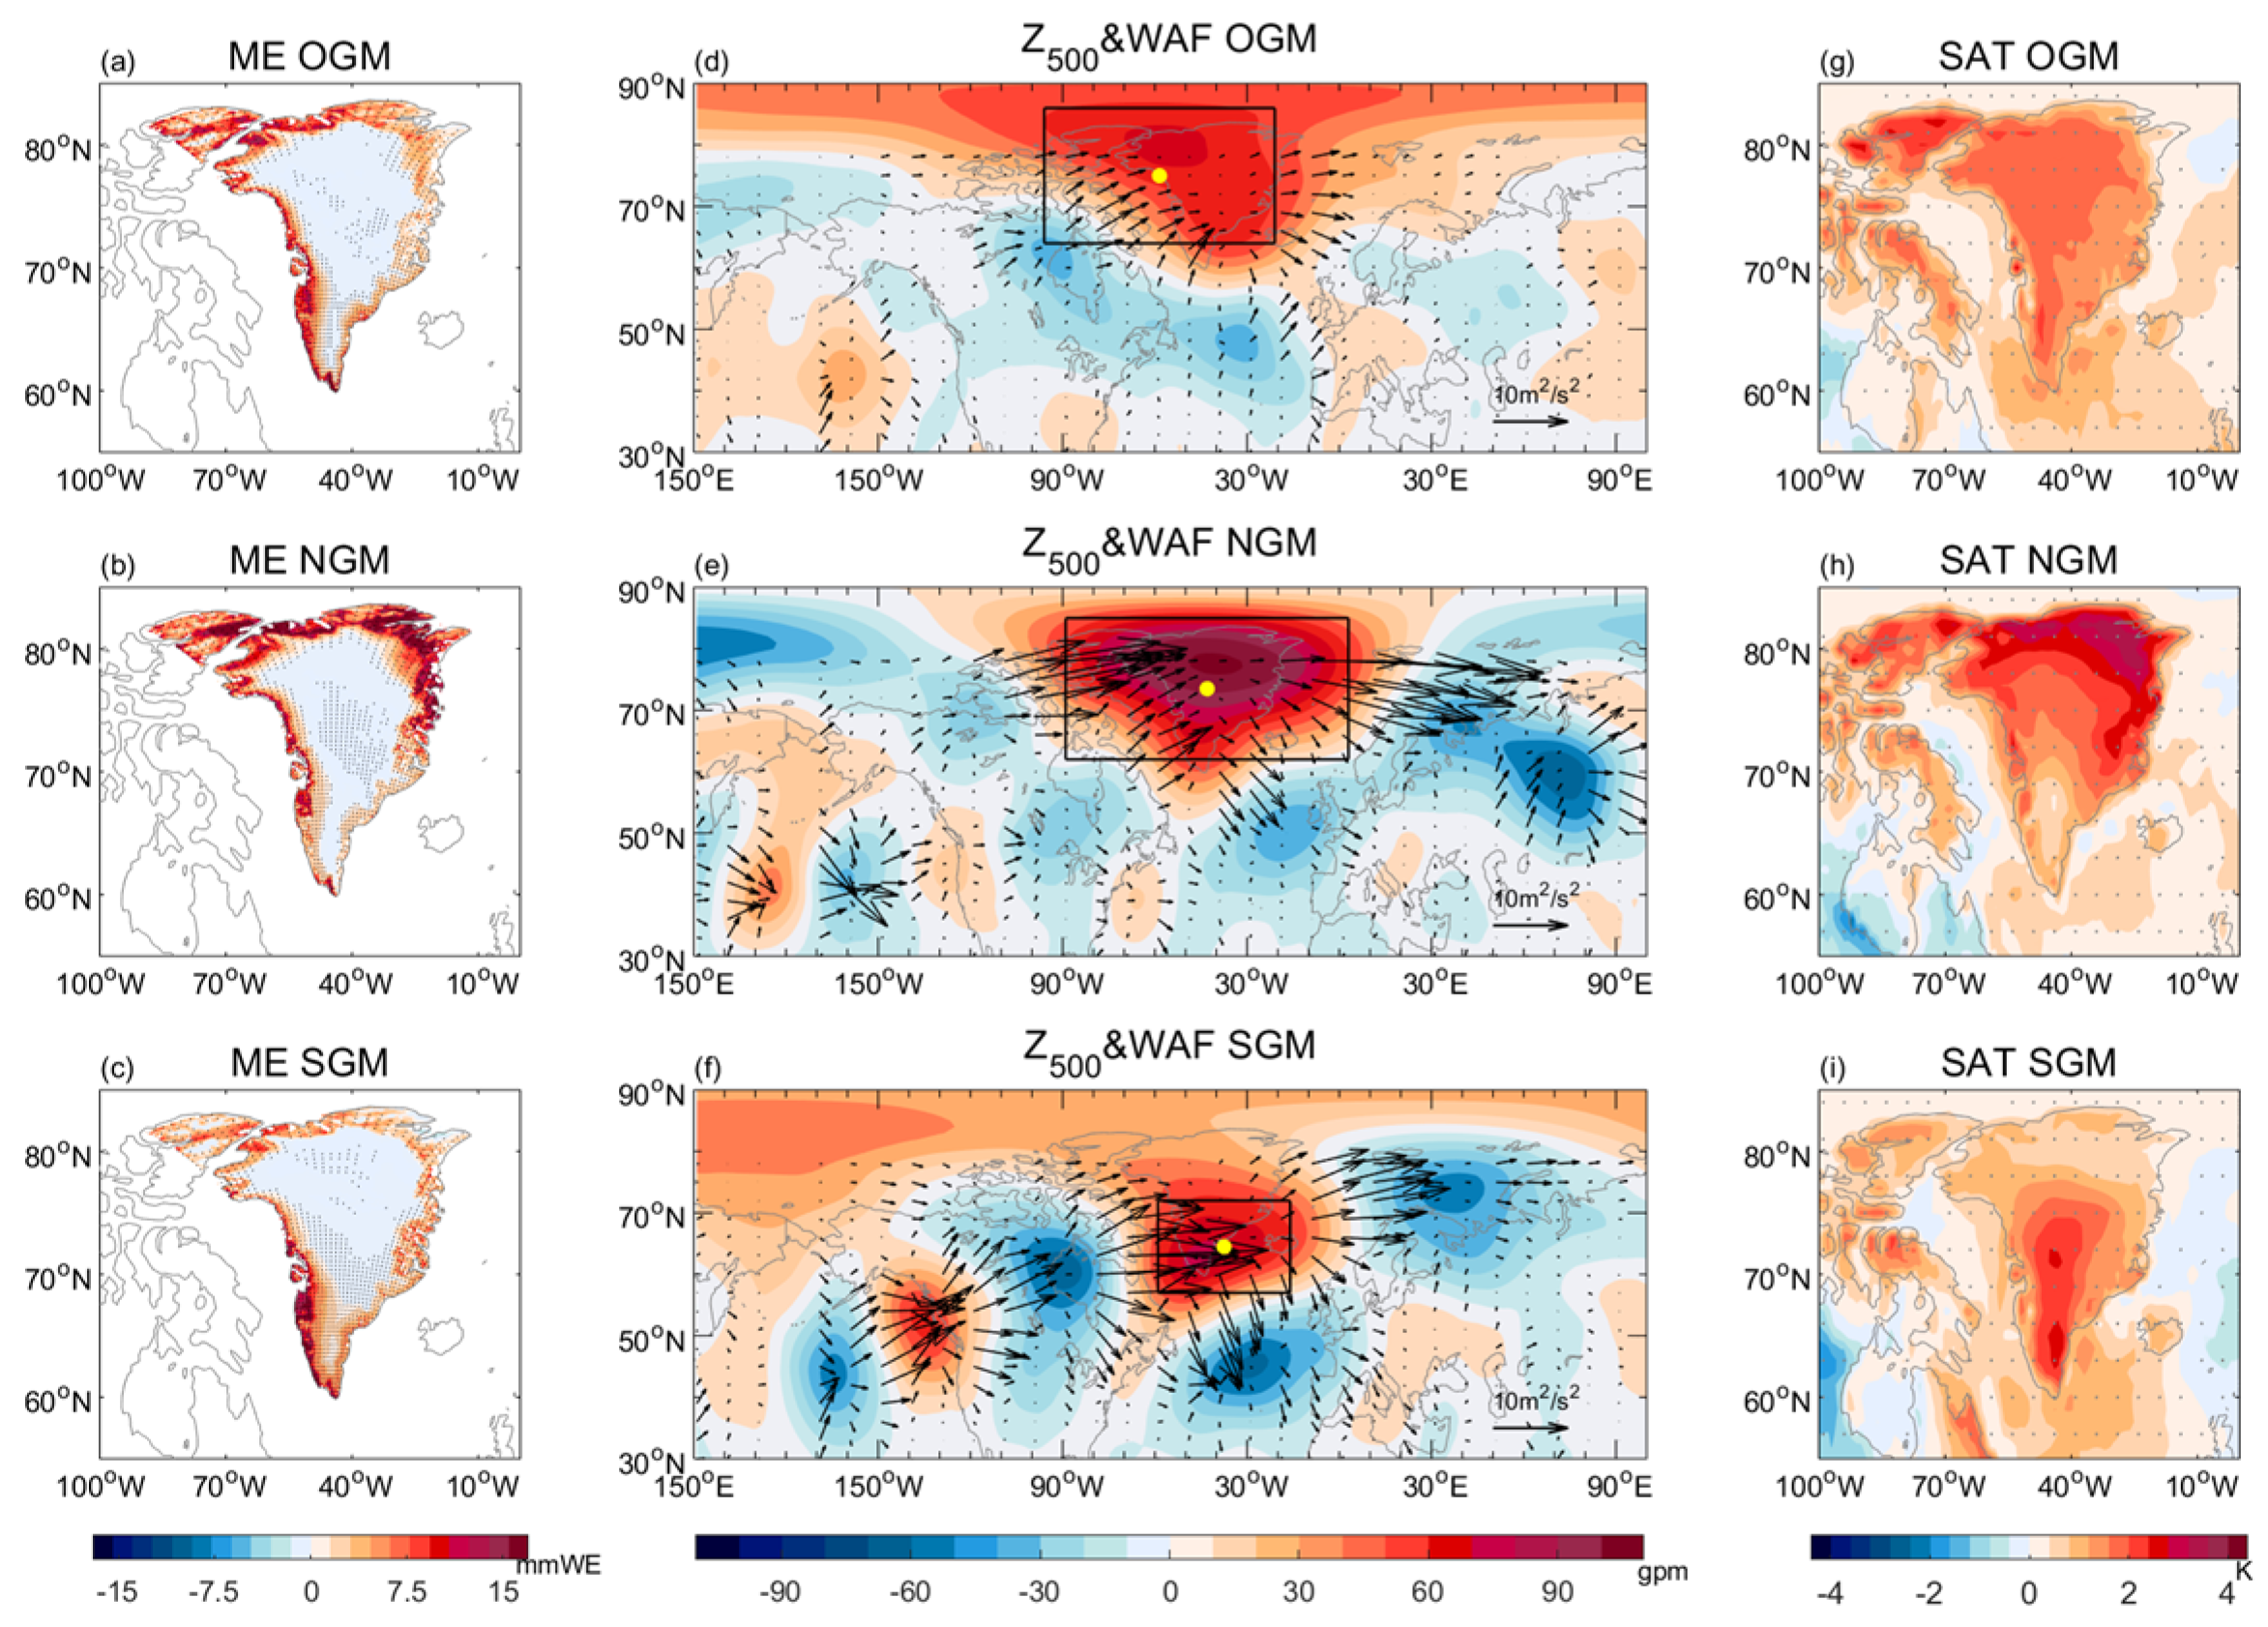
Figure 4a–c shows the composition of lag-5 to lag5 days for EGIMEs in OGM, NGM, and SGM summers, which is similar to Figure 1a,b,d. It is demonstrated that in OGM summers, there is considerable melting throughout the GrIS peripheral. The GrIS melting in NGM summers occurs mainly in the north, while the GrIS melting in SGM summers occurs mainly in Southern Greenland. Unsurprisingly, the melting of the GrIS corresponds to the region of significant positive SAT anomalies (Figure 4g–i), since SAT is an important factor affecting GrIS melting [18,27]. To further investigate how the atmospheric circulation promotes GrIS melting, it is useful to show the Z500 anomaly and WAF during the extreme melting period (from lag-5 to lag5 days) in Figure 4d–f. All three modes show an NAO-like circulation, revealing a close relationship between all the GrIS melting patterns and NAO circulation. The circulation of the SGM mode is different from that of the other two modes. There is a significant wave train upstream of Greenland, from the mid-latitude East Pacific through North America to Greenland. It is worth noting that although all the melting modes are related to GB, the location and domain of GB are different for the three modes. We calculated the minimum and maximum longitude and latitude of the 60-gpm Z500 anomaly contour to construct a rectangle that encloses GB, then we defined the center of the rectangle as the center of GB. Then, we obtained the center of GB for the OGM, NGM, and SGM modes as (58.5° W, 75° N), (43° W, 73.5° N), and (37.5° W, 64.5° N), respectively, and the domain of GB for the OGM, NGM, and SGM modes is (96° W–21° W, 64° N–86° N), (89° W–3° E, 62° N–85° N), and (59° W–16° W, 57° N–72° N), respectively. The results suggest that the OGM and NGM mode are related to high-latitude GB and induce extreme melting in the northern GrIS, while SGM mode is associated with mid-latitude GB and only causes melting in the southern GrIS. It is interesting that the GB circulations for the OGM and NGM modes are identical but correspond to distinct melting types. We also note that, in comparison to SGM summers, GBs in OGM and NGM summers have a wider zonal width, which may be related to the North Atlantic Tripole pattern [59].
Figure 5a–c displays the time evolution of GIM for different regions from lag-15 to lag15 days. For the OGM mode, the melting of the northern GrIS mainly occurs after the lag0 day, and the duration of northern GrIS melting is longer than that of the southern GrIS. The results indicate that the intense melting of the northern GrIS is due to a long duration, while it is due to large intensity for the southern GrIS. Both Figure 5b,c demonstrate that more intense single-sided GrIS melting is the cause of heterogeneous GrIS melting for the NGM and SGM modes. However, the NGM mode is quite different, as we can see a reoccurrence of melting strengthening in northern GrIS during the post-melting period, which is linked to the movement of high-latitude GB.
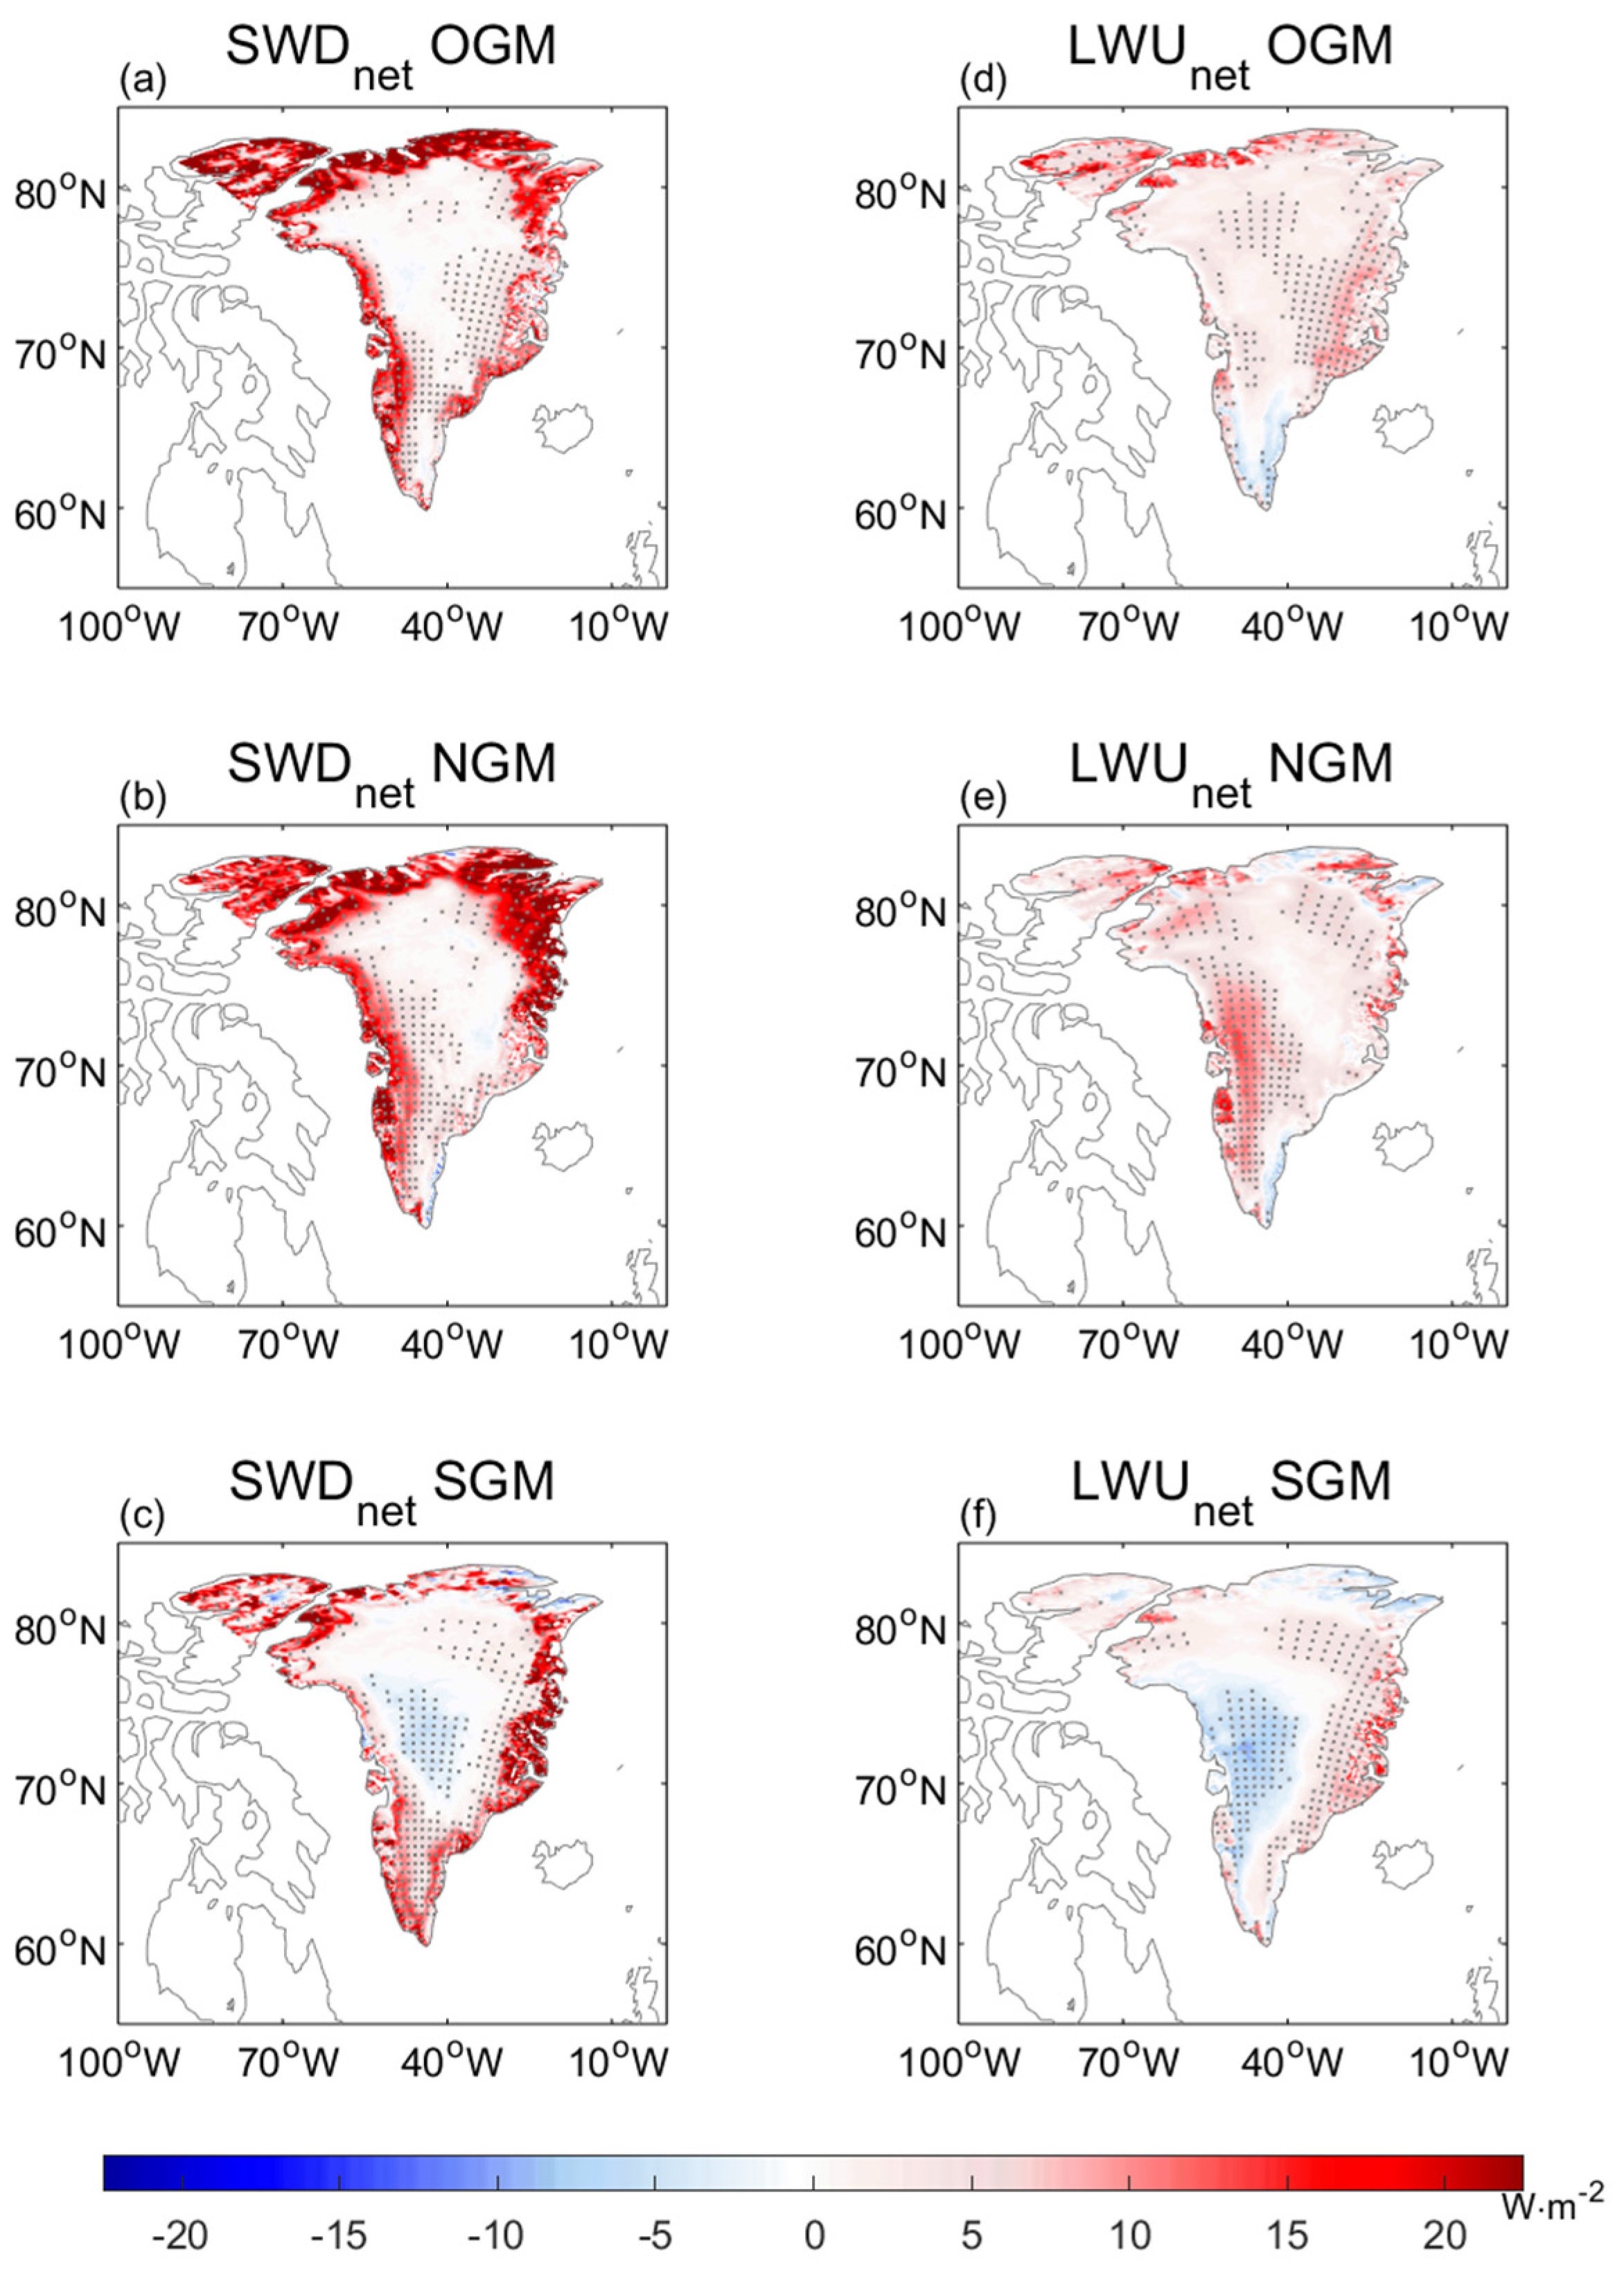
We further explain the physical mechanisms of extreme melting from the perspective of surface radiation balance (Figure 6). The surface energy budget is useful in detecting the physical processes driving surface GrIS melting [60], while GB has an influence on surface energy balance via cloud cover over Greenland and further controls surface melting [23,61]. However, the variance in cloud cover during the GB period and the associated melting mechanisms vary depending on the types of GB. During GB, the decrease in cloud cover for the southern GrIS contributes to short-wave warming, while the increase in cloud cover for the central and northern GrIS contributes to long-wave warming, both of which contribute to enhanced melting [61]. We show the temporal evolution of domain- averaged SWDnet and LWUnet for Greenland from the lag-15 to lag15 days. It shows that SWDnet has an increasing trend from the lag-5 to lag5 days for all three modes, while LWUnet shows a weak variation during the extreme melting period, with a relatively slow increasing trend in OGM and NGM summers and a relatively flat variation in SGM summers. The spatial distributions, however, can explain the role of LWUnet. GB is responsible for the notable positive SWDnet anomalies observed in the Greenland periphery during the OGM and NGM summers, as shown in Figure 6a,b. However, for the NGM mode, SWDnet is more intense in Northern Greenland, corresponding to more intense melting for the northern GrIS. The SWDnet in Northern Greenland for the SGM mode was weaker than the OGM and SGM modes, and the SWDnet on Southern Greenland was more intense, corresponding to more significant melting on the southern GrIS. Net short-wave radiation variations are predominant in GrIS melting during the GB period, while net long-wave radiation can adjust the effects of short-wave radiation. It is seen in Figure 6d that the LWUnet anomaly is positive oin Central and Northern Greenland for the OGM mode, which is not conducive to melting, while the positive anomaly in Eastern Greenland is more significant. However, the LWUnet anomaly in Southern Greenland is negative, which mitigates the impact of SWDnet’s absence there. As a result, the GrIS exhibits overall peripheral melting for the OGM mode. For the NGM mode, the significant positive anomaly in Southwestern Greenland counteracts the positive SWDnet there, resulting in melting mostly in Northern and Northeastern Greenland. Moreover, the effect of long-wave radiation is to promote melting in Western Greenland and slightly weaken melting in Eastern Greenland for the SGM mode. From Figure 5d,f, the domain-mean SWDnet anomalies are stronger than the LWUnet anomalies during the GB period for the three modes, and the LWUnet anomalies are almost positive during the GB periods, meaning that GB enhances the short-wave radiation by reducing the cloud cover while further enhancing the LWUnet by heating the surface. This also indicates that LWUnet does not play a major role. However, it has been shown that LWUnet is strongest for the NGM mode and weakest for the SGM mode, as seen in Figure 6d–f. In addition, the change in radiation continues during the post-melting period, corresponding to the decay period of GB. It is suggested that the melting caused by GB changes the surface conditions and may have a lasting effect, which may be caused by the feedback mechanism in Greenland [62,63].

3.3. Evolution of Circulation during the Pre-Melting Period

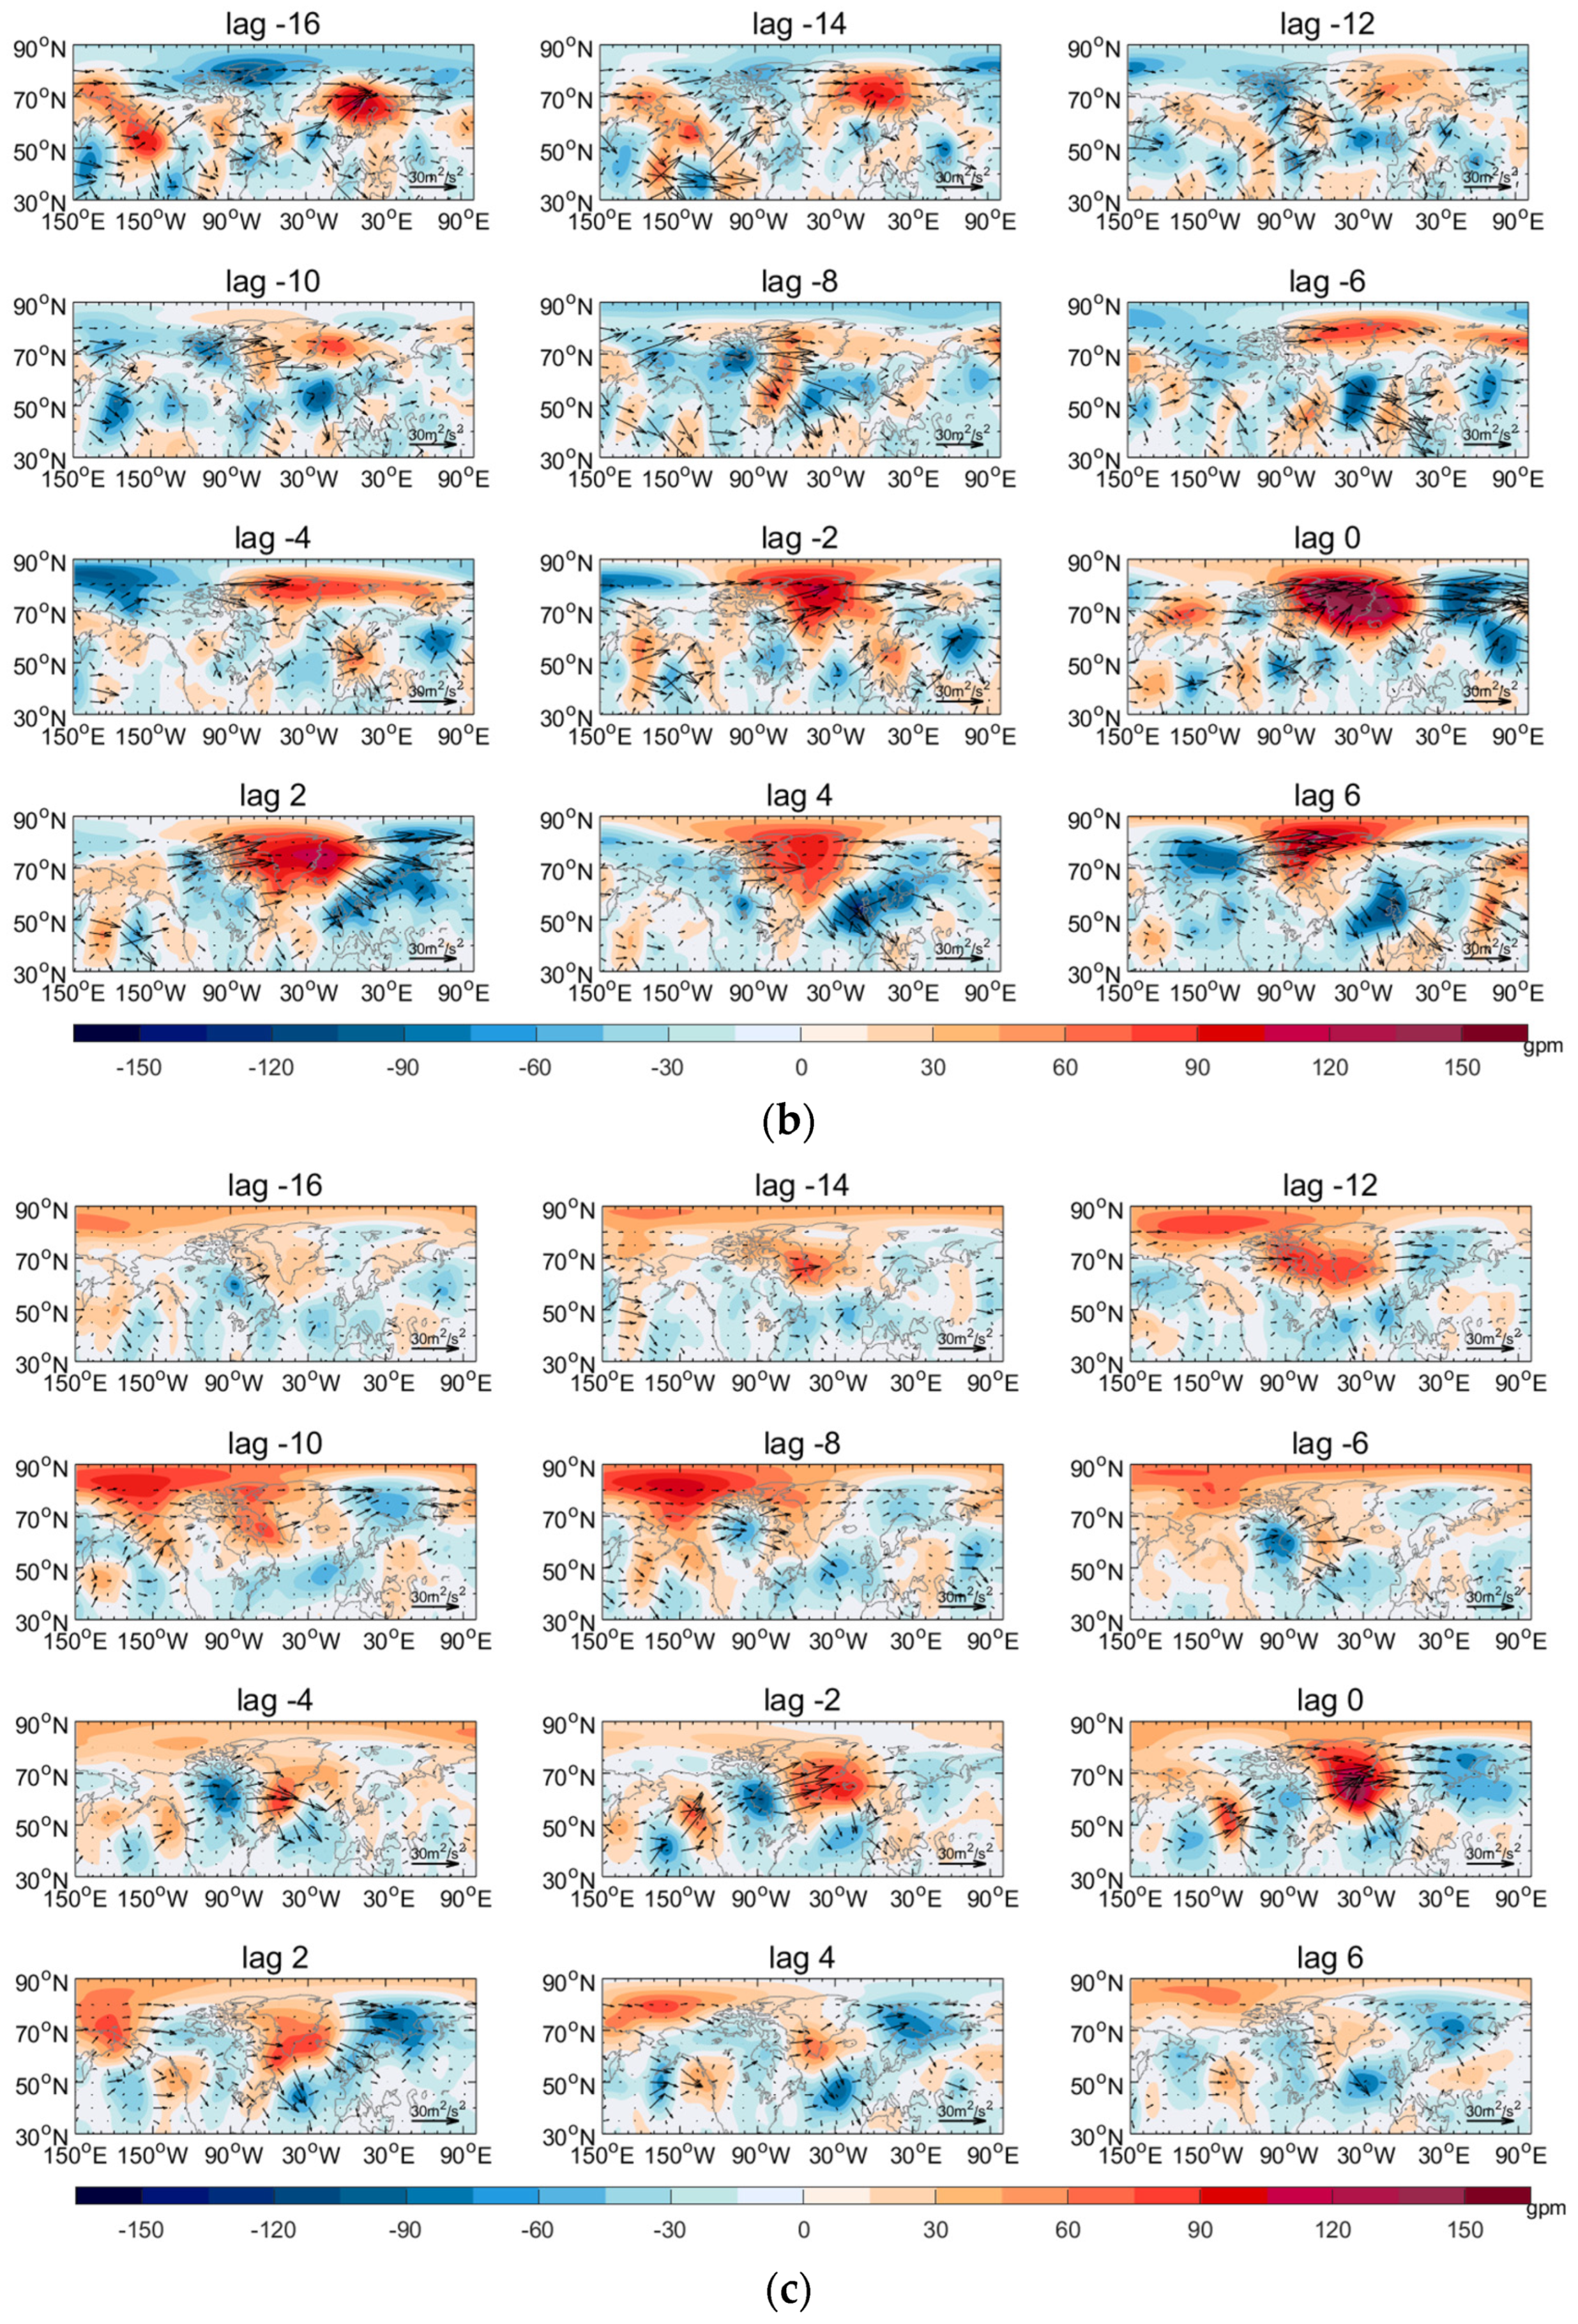
We have determined the characteristics of GB corresponding to various EGIME types, and it is beneficial to explore the circulation evolution during the pre-melting period in order to better understand how GB generates and influences extreme GrIS melting under different backgrounds. Figure 7a–c shows the 2-day evolution of 500 hPa circulation and wave activity flux for the three major GrIS melting modes during the pre-melting period. Figure 7a illustrates that there is an anticyclonic anomaly north of 80° N starting on lag-16 day (perhaps ahead of time). From the lag-12 to lag-8 days, a cyclonic anomaly over the mid-latitude Atlantic has an energy dispersion and contributes to the formation of an anticyclonic circulation over Southwestern Europe on approximately the lag-8 day, referred to as European blocking (EB, mid-latitude EB hereafter). It is clearly seen that from the lag-8 to lag-2 days, this EB gradually weakened and began to move westward to Greenland. From the lag-2 day, it intensified over Greenland to become GB, which appears to receive energy from a low pressure over the northeast of North America via energy dispersion. The GB generated under this background is centered at (45° W, 71.5° N) on the lag0 day, and its range is (100° W–10° E, 56° N–87° N), corresponding to significant melting of the overall GrIS periphery. Additionally, we note that the GB moves north from the lag2 to lag4 days, which causes the melting of the northern GrIS. It is seen from the blue line in Figure 5d that Greenland is under a high pressure control between the lag-2 and lag5 days, which lengthens the EGIME lifetime for the OGM mode. Consequently, the melting of the northern and southern GrIS does not occur simultaneously for the OGM mode.
Figure 7b illustrates that prior to the lag-16 day, a high-latitude anticyclone formed in Northwestern Europe between 60° N and 80° N, which can also be considered as an EB (high-latitude EB hereafter). From the lag-16 to lag-10 days, the anticyclone anomaly weakened and moved northwestward to Northern Greenland. With the energy dispersion over the upstream Arctic region (north of North America and the Pacific), an anticyclonic anomaly developed from Northern Greenland and gradually expanded southward, eventually forming a GB centered at (40° W, 73° N), within the rang (93° W–13° E, 60° N–86° N), which contributed to the intense melting of the northern GrIS. Moreover, we noticed a substantial energy dispersion in the high latitudes from Greenland to Eurasia after the formation of GB, which could impact atmospheric circulation and temperature in the downstream regions [64]. In addition, the NAO-like circulation under this background shows a northwest–southeast inclination compared to Figure 7a. The low pressure south of GB is located in Western Europe. The yellow line in Figure 5d indicates that GB can last longer for the NGM mode, which results in further prolonged melting (shown in Figure 5b).
It is shown from Figure 7c that from the lag-12 to lag-6 days, there is a significant anticyclonic anomaly in the northwest of North America, with energy dispersion toward Greenland from Bering Strait at a higher latitude to Southern Greenland via a high-latitude wave train. From the lag-4 day, a notable anticyclonic anomaly also emerged in the East Pacific and on the west coast of North America. It transported energy across North America to Southern Greenland via a mid-latitude wave train. The anticyclone anomaly in Southern Greenland progressively transformed into a GB, with a center of (41.5° W, 68.5° N) and a range of (75° W–8° W, 54° N–83° N). Similar to Figure 7a, NAO-like circulation was observed over the mid–high latitude Atlantic, and a cyclonic anomaly to the south of the GB was located over the mid-latitude Atlantic. For the SGM mode, the GB is located in Southern Greenland and causes the melting to concentrate on the southern GrIS for the whole life cycle of EGIME, as seen in Figure 5c.

3.4. The Influence of Sea Surface Temperature Anomalies over the Atlantic and Pacific and Zonal Wind

In Section 3.2, we concluded that GBs corresponding to GrIS melting for the OGM, NGM, and SGM modes are related to the decay of mid-latitude EB, high-latitude EB, and the wave trains from the Pacific to Greenland, respectively. In this section, we will further explore the factors that influence the atmospheric circulation evolution during the pre-melting period. As the underlying surface of the atmosphere, the sea surface often interacts with it. The ocean’s great heat capacity means it is sluggish to respond to variations in atmospheric circulation; hence, the SST anomaly mode frequently serves as a background influence on circulation on a sub-seasonal scale [65].
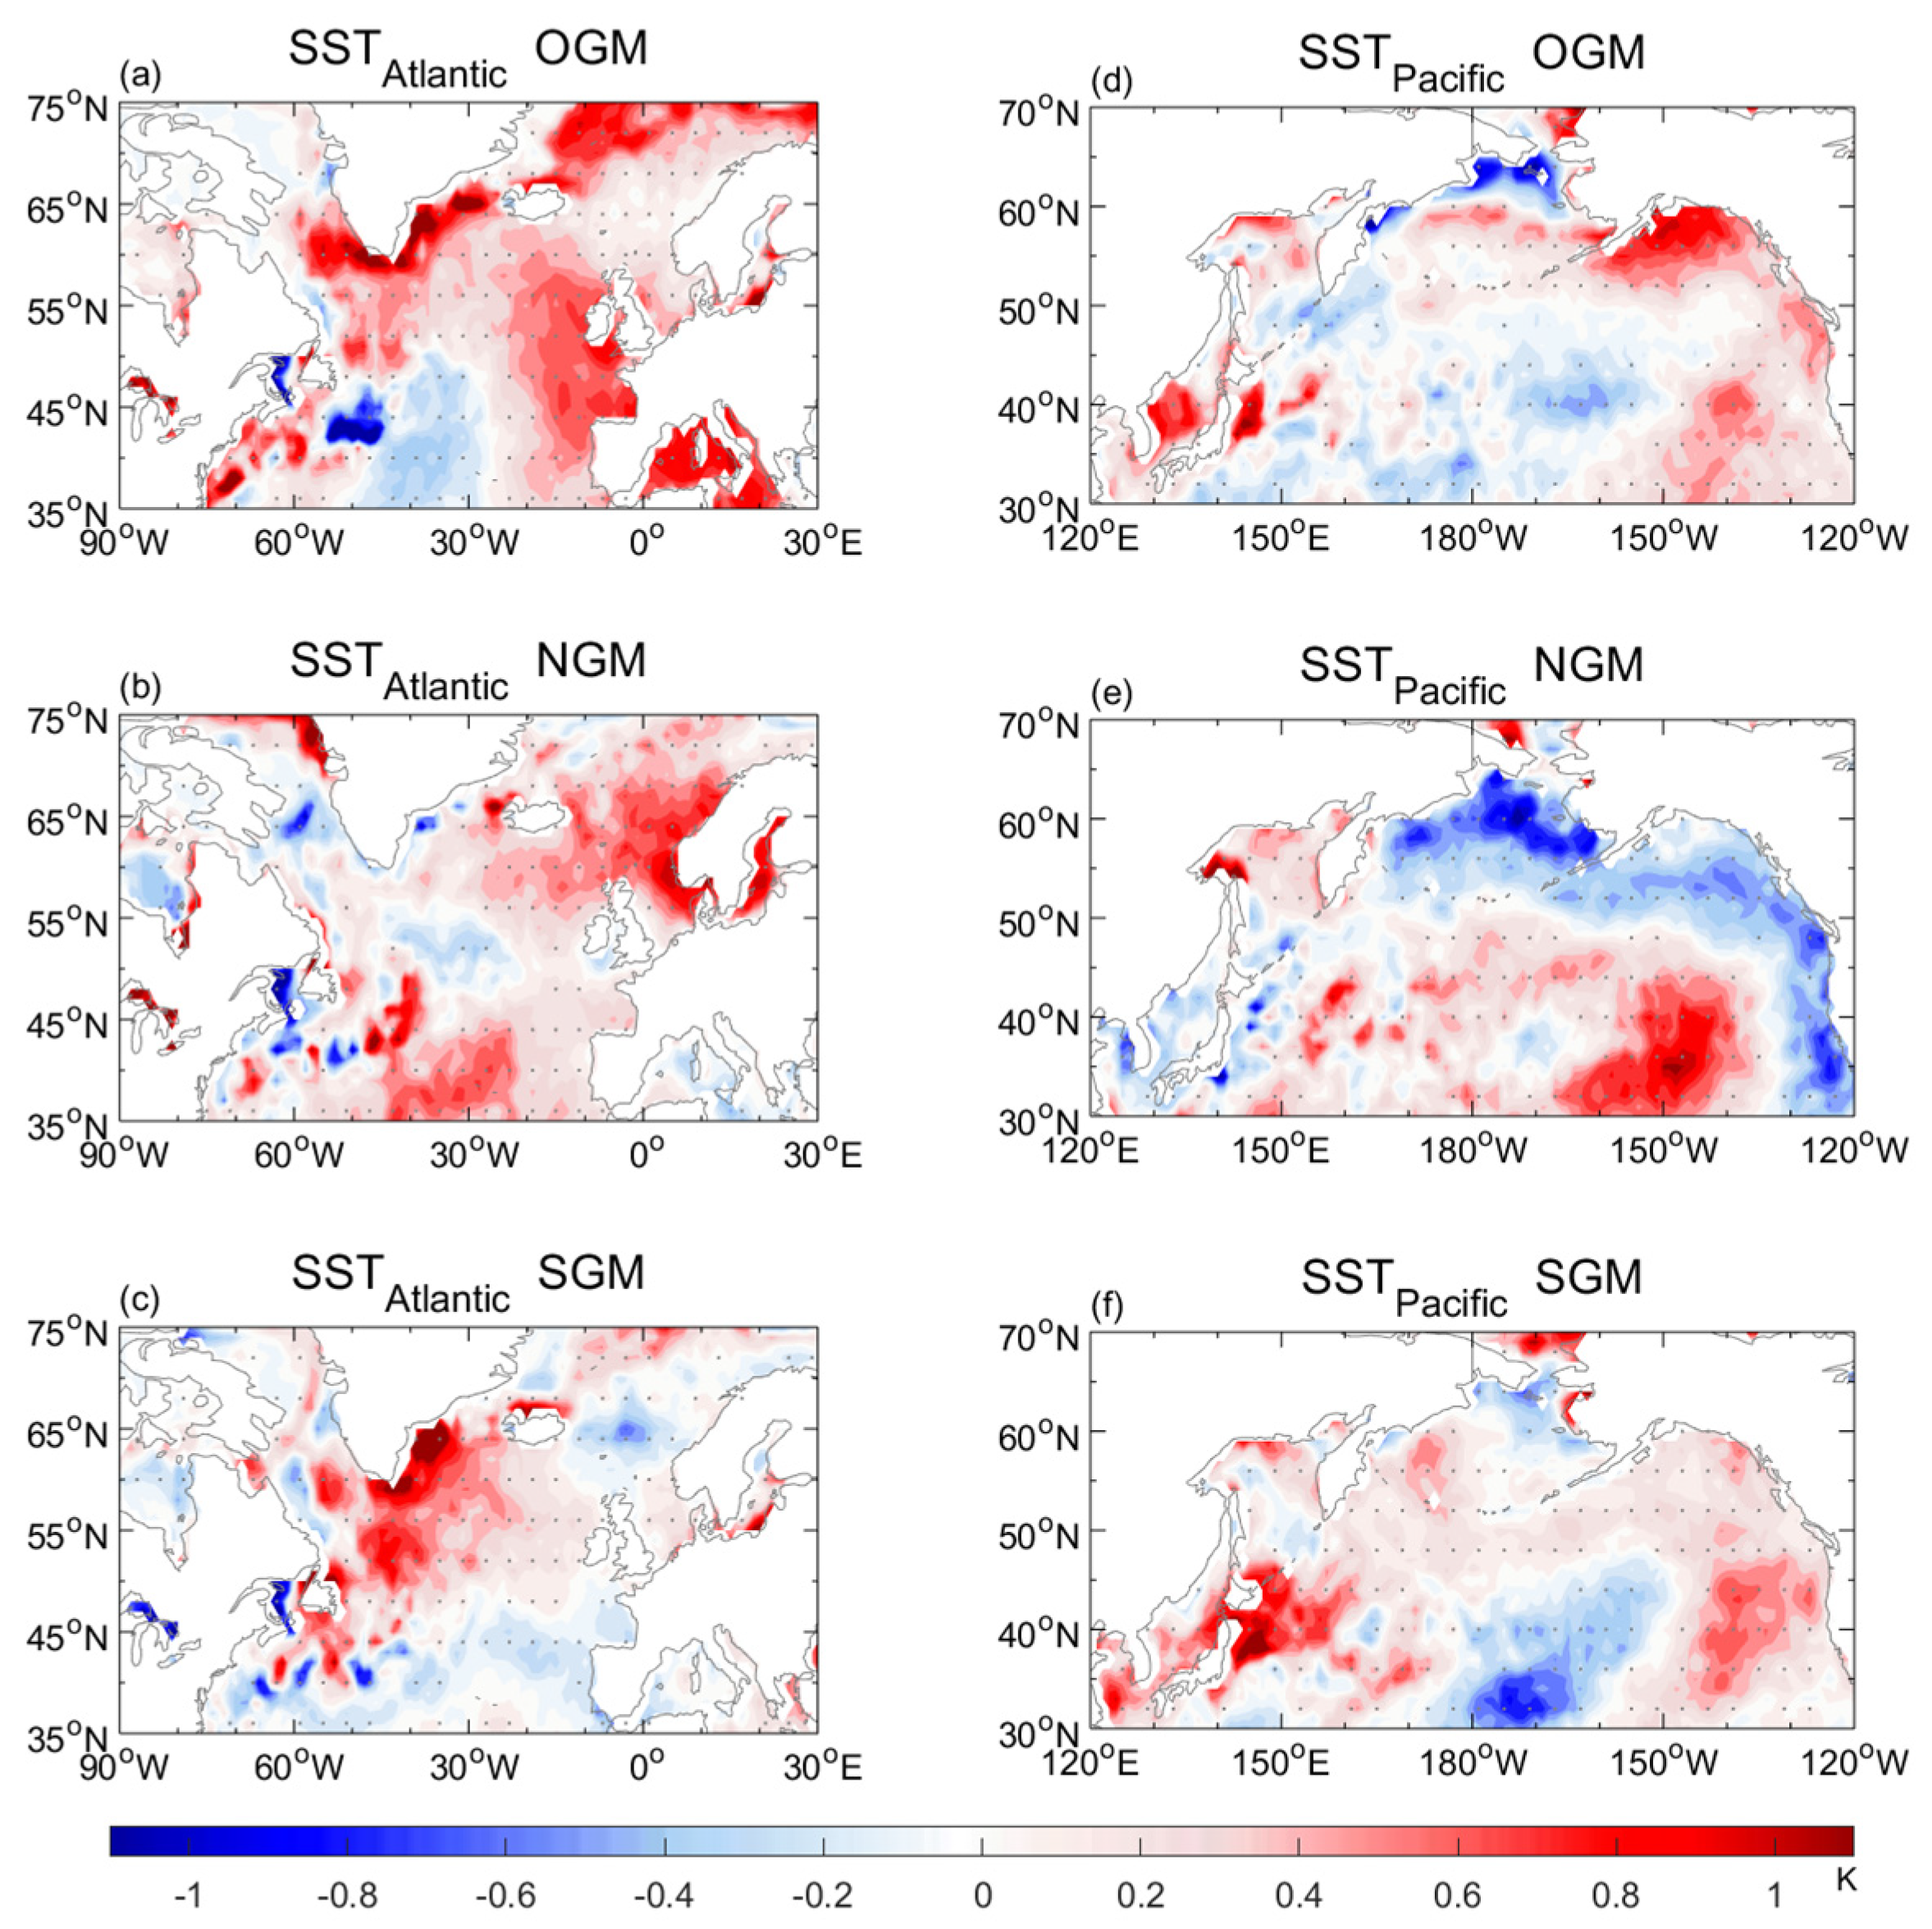
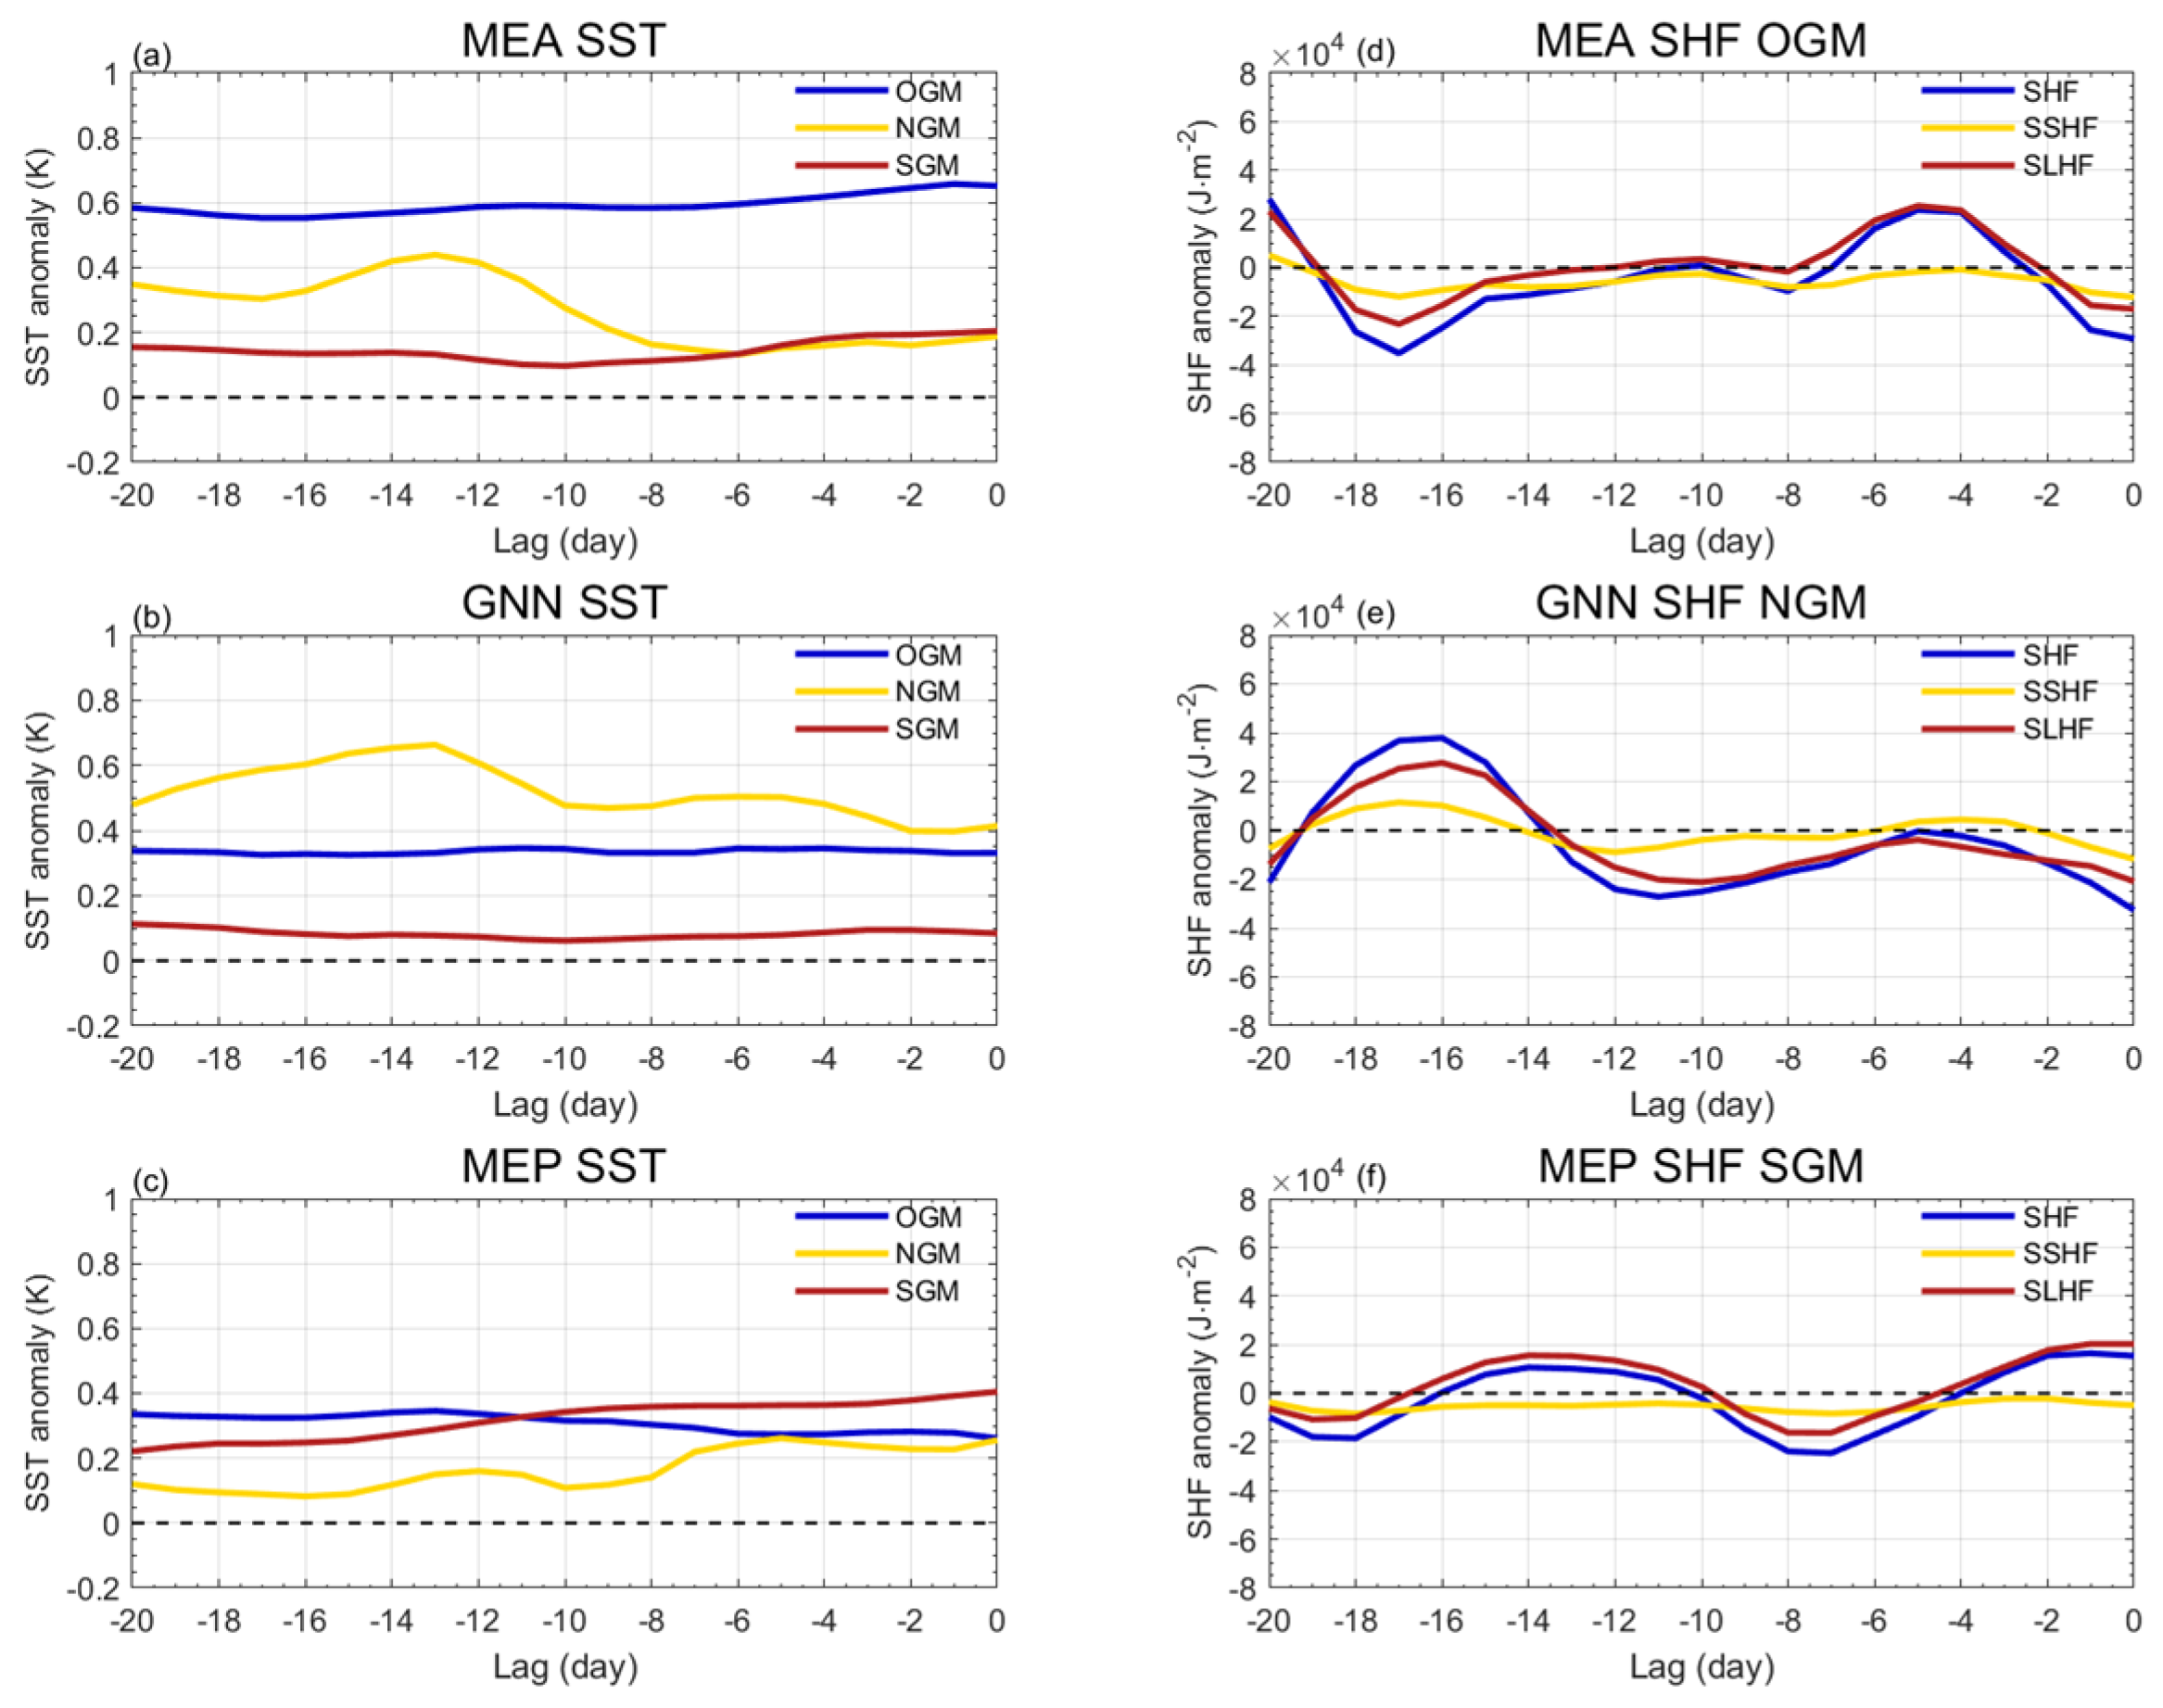
In order to further explore the influencing factors of the atmospheric circulation corresponding to the three extreme melting modes for GrIS, we first analyzed the time–mean SST anomalies in the mid-latitude Atlantic and Pacific averaged from the lag-15 to lag-5 days. Under the control of AMO+, all the three modes are related to significant SST warming in the Atlantic. However, the warming regions are quite different. It is evident that the SST warming to the south of Greenland has effects on the melting of the southern GrIS; nevertheless, the mechanisms behind these effects are complex. The ocean–atmosphere interactions have indirect impacts, while the ice–sea interactions have direct impacts on the melting of the southern GrIS [2]. Furthermore, we recognized that the SST surrounding Greenland is impacted by atmospheric circulation through surface heat flux (Figure 10a,c). Here, we pay attention to the other warming regions that are crucial to the evolution of atmospheric circulation. GB develops from the decay of mid-latitude and high-latitude EB for the OGM and NGM modes, respectively (Figure 7a,b). It is noteworthy that the distribution of Atlantic SST anomalies corresponds to the location of the EB. For the OGM mode, SST warming to the mid-latitude East Atlantic (MEA, 15° W–0°, 45° N–60° N) is significant (Figure 8a), while the SST anomaly in the Greenland–Norskehavet–North Sea (GNN, 20° W–20° E, 55° N–70° N) is obviously positive for the NGM mode (Figure 8b), implying that SST warming in different regions is closely related to the EB generated at different latitudes, modulating the location of the GB. We further display the daily SST anomalies from the lag-20 to lag0 days averaged over the MEA and GNN in Figure 9a,b. It has been found that SST anomalies vary slightly with the evolution of GIM, and the MEA (GNN)-positive SST anomaly is always the most intense one for the OGM (NGM) mode. Hence, it is reasonable to consider that stable and intense SST warming of MEA (GNN) is an advanced signal of EGIMEs for the OGM (SGM) mode.
Sea surface warming may act as an anticyclone circulation catalyst by enhancing the upward surface heat flux [66]. It is useful to discuss the variations in the surface heat flux (SHF) during the pre-melting period. Here, SHF equals SSHF plus SLHF. Figure 9d reveals that the MEA shows an upward SHF anomaly from the lag-19 to lag-10 days for EGIMEs in OGM summers, indicating that the atmospheric circulation is likely influenced by the SST warming anomaly. Additionally, it suggests that the mid-latitude EB that occurred before EGIMEs is linked to MEA warming. Similarly, GNN has an upward SHF anomaly from the lag-14 to lag-5 days for the NGM mode (Figure 9e), which suggests that high-latitude EB that occurred before GB related to GNN warming. Figure 10a,b similarly shows an upward SHF for MEA and GNN, suggesting that SST warming plays a role in the generation of EB. Moreover, it is noted that SLHF contributes the majority of the upward SHF, suggesting the role of water vapor. It is indicated that the ocean surrounding Greenland not only contributes directly to GrIS melting by transporting water vapor [24], but also indirectly by affecting atmospheric circulation.
It appears that there is no discernible signal in the Atlantic for the SGM mode. We discovered that the wave train from the East Pacific to Greenland is associated with the circulation of EGIMEs for the SGM mode, as seen in Figure 7c. As a result, we illustrate the Pacific SST anomaly during the pre-melting period (Figure 8f). Significant SST warming and an upward SHF are seen over the mid-latitude East Pacific (MEP, 150° W–110° W, 30° N–45° N) (Figure 10f). The daily evolution of the SHF anomaly over MEP for the SGM mode is shown in Figure 9f. It shows that a negative SHF anomaly appeared from the lag-10 to lag-4 days, which is when the mid-latitude wave train over North America was generated. Therefore, MEP warming contributes to the wave train corresponding to GB for the SGM mode.
Finally, we examine the upstream westerly wind anomaly field and point out its influence on the movement of EB. It can be seen from in Figure 7a,b that the generations of GBs for the OGM and SGM modes are related to the western movement of mid-latitude and high-latitude EBs, respectively. The upstream westerly wind is the primary factor affecting the movement of the blockings [67]. Since a weakened westerly wind is conducive to the westward movement of blockings, we display the time–mean zonal wind and atmospheric circulation anomalies at 500 hPa from the lag-15 to lag-5 days in Figure 11. The mid-latitude and high-latitude EBs are shown in Figure 11c and 11d, with their centers at (15.5° W, 58.5° N) and (7.5° W, 73° N), respectively. It is found that for the OGM mode, the EB is located to the southeast of Greenland, and the whole of Greenland and its west side have negative westerly anomalies, which is favorable for EB as it can move northwest towards Greenland and further to develop into GB from south to north. When it comes to the NGM mode, the EB is located north of 70° N to the east of Greenland, and the west of Greenland is considered as its upstream. Figure 11b illustrates that the westerly wind anomaly is negative north of 70° N and positive south of 70° N on the west side of Greenland. Therefore, a high-latitude EB is more likely to move westward north of 70° N than south of Greenland because of the distribution of westerly wind anomalies. As a result, a GB for the NGM mode develops in Northern Greenland and causes northern GrIS melting. In contrast, GBs for the OGM mode move from south to north, resulting in overall melting.

4. Discussion

In this study, we mostly discussed the influencing factors of different types of GrIS melting. Unlike previous research (e.g., [49,59]), we compared the formation processes of the corresponding circulations of the three melting modes. Moreover, we pointed out the influencing factors for the NGM mode, which has been neglected in previous research. In addition, we further related GrIS melting to the SST in the Pacific, although not discussed in detail, suggesting that there is a multi-scale relationship between the melting of the GrIS and the variations in the Pacific SST. Many studies have emphasized the direct role of the Atlantic on GrIS melting and its influence on atmospheric circulation in Greenland, and especially on GB. For example, McLeod and Mote [32] indicate the role of threatened cyclones in the Atlantic, and Wang et al. [59] explain the effects of the multi-scale Atlantic SST modes on the characteristics of GBs. However, GB is either related to the decay of EB (Figure 7a,b), or it may be associated with wave trains (Figure 7c), suggesting that it makes sense to establish a link between Pacific SST and GB as well as GrIS melting, which has not been significantly mentioned in previous research.
Although we have pointed out the role of SST in this paper, the link between SST and GrIS is multi-scale and includes direct and indirect connections, which are not mentioned here and thus deserve further research in the future. In addition, it is worthy of noting that the GBs for all the three modes have energy dispersion downstream, indicating the effects on the weather in Eurasia. Moreover, although GrIS melting and the Z500 anomaly almost peaked simultaneously, we recognize that the decay in GB for the three modes differs. It would be worthwhile discussing whether EGIMEs play a role during these processes.

5. Conclusions

We used the SOM method to obtain three spatial patterns of significant GrIS melting, OGM, NGM, and SGM modes, based on the daily summer ME anomalies from 1950 to 2021. The OGM mode represents significant melting of the overall periphery of Greenland, while the NGM and SGM modes represent significant melting of the northern and southern GrIS, respectively. These three melting modes are modulated by AMO+. The results show that an increasing frequency of the NGM mode contributes to the decreased melting area.
Next, we analyzed the characteristics of atmospheric circulation causing extreme melting by identifying EGIMEs in OGM, NGM, and SGM summers. The results show that the frequency and intensity of SGM are greatest, while the NGM mode has the longest duration. It is found that the three melting types are caused by distinct types of GB. Both the OGM and NGM modes are linked to high-latitude GB. The GB for the OGM mode has a shift from south to north over Greenland, causing overall melting, whereas the GB for NGM is generated in Northern Greenland, resulting in northern GrIS melting. Moreover, the SGM mode is related to mid-latitude GB. Upon analyzing the net surface radiation anomalies, it turns out that the melting of the GrIS occurs mostly due to an increase in the SWDnet, but regional melting can be enhanced or weakened by the long-wave radiation adjustment. In OGM summers, GBs enhance the melting of the southern GrIS by reducing the LWUnet, supplementing the lack of SWDnet in the south. However, GBs in NGM summers attenuate the melting of the southern GrIS by enhancing the LWUnet.
Then, we further explored the evolution of atmospheric circulation during the pre-melting period in summer for different modes. The results indicated that for the OGM and NGM modes, the generation of GB is related to the decay and westward movement of mid-latitude EB and high-latitude EB, respectively. With the decay in mid-latitude EB, it moves northwestward to Southern Greenland and develops into a GB from south to north. High-latitude EB decays and moves westward, redeveloping to generate high-latitude GB. Conversely, the generation of GB for the SGM mode is associated with a wave train from the mid-latitude East Pacific to Greenland via North America.
Finally, we discussed the influence of SST and zonal wind anomalies on atmospheric circulation in the pre-melting period of EGIME. It is concluded that the warming of MEA and GNN is beneficial in the generation of mid-latitude and high-latitude EB, respectively, while the upstream zonal wind anomaly modulates the westward movement of the two types of EBs during their decay periods. We found that the zonal winds over Greenland and the west of Greenland weakened for the OGM mode, favoring the northwestward movement of the mid-latitude EB. Meanwhile, for the NGM mode, the zonal wind strengthens to the northwest of Greenland (north of 70° N) and weakens to the southwest of Greenland (south of 70° N), which makes the high-latitude EB move toward the higher latitude, thus favoring the GB generated in Northern Greenland. For the SGM mode, the warming of MEP is conducive to the generation and propagation of the East Pacific–North America–Greenland wave train, which is conducive to the generation of a mid-latitude GB.

Author Contributions

Conceptualization, H.W. and D.L.; methodology, H.W. and Y.C.; formal analysis, H.W. and Y.G.; writing—original draft preparation, H.W.; visualization, H.W., Y.C. and Y.G.; supervision, D.L. All authors have read and agreed to the published version of the manuscript.

Funding

This research was funded by the National Natural Science Foundation of China, grant number 42305068.

Institutional Review Board Statement

Not applicable.

Informed Consent Statement

Not applicable.

Data Availability Statement

The ERA5 reanalysis data are from https://cds.climate.copernicus.eu/cdsapp#!/search?type=dataset (accessed on 26 December 2021). The MAR data are available from ftp://ftp.climato.be/fettweis/MARv3.12/Greenland (accessed on 16 January 2022). The NSIDC data are available from ftp://ftp.nsidc.org/pub/DATASETS/nsidc0755_nrt_greenland_melt_v1/greenland-daily-melt.xlsx (accessed on 26 March 2022).

Acknowledgments

The authors thank the three anonymous reviewers and the editors for their useful suggestions for improving this paper.

Conflicts of Interest

The authors declare no conflicts of interest.

Abbreviations

GrISGreenland ice sheet
GBGreenland blocking
AMOAtlantic multidecadal oscillation
NAONorth Atlantic oscillation
EGIMEExtreme GrIS melting event
Z500Geopotential height at 500 hPa
SATSurface air temperature
SSTSea surface temperature
U500Zonal winds at 500 hPa
V500Meridional winds at 500 hPa
SSHFSurface-sensitive heat flux
SLHFSurface-latent heat flux
SHFSurface heat flux
MEMeltwater production
SWDnetNet downward shortwave radiation
LWUnetNet upward longwave radiation
WAFWave activity flux
OGMOverall GrIS melting
NGMNorthern GrIS melting
SGMSouthern GrIS melting
EBEuropean blocking
MEAMid-latitude East Atlantic
GNNGreenland–Norskehavet–North sea
MEPMid-latitude East Pacific

References

  1. Hanna, E.; Mernild, S.H.; Cappelen, J.; Steffen, K. Recent warming in Greenland in a long-term instrumental (1881–2012) climatic context: I. Evaluation of surface air temperature records. Environ. Res. Lett. 2012, 7, 045404. [Google Scholar] [CrossRef]
  2. Straneo, F.; Heimbach, P. North Atlantic warming and the retreat of Greenland’s outlet glaciers. Nature 2013, 504, 36–43. [Google Scholar] [CrossRef] [PubMed]
  3. Mernild, S.H.; Hanna, E.; Yde, J.C.; Cappelen, J.; Malmros, J.K. Coastal Greenland air temperature extremes and trends 1890-2010: Annual and monthly analysis. Int. J. Climatol. 2014, 34, 1472–1487. [Google Scholar] [CrossRef]
  4. Wilton, D.J.; Jowett, A.; Hanna, E.; Bigg, G.R.; Broeke, M.R.V.D.; Fettweis, X.; Huybrechts, P. High resolution (1 km) positive degree-day modelling of Greenland ice sheet surface mass balance, 1870–2012 using reanalysis data. J. Glaciol. 2017, 63, 176–193. [Google Scholar] [CrossRef]
  5. White, R.H.; Hilgenbrink, C.; Sheshadri, A. The Importance of Greenland in Setting the Northern Preferred Position of the North Atlantic Eddy-Driven Jet. Geophys. Res. Lett. 2019, 46, 14126–14134. [Google Scholar] [CrossRef]
  6. Goelzer, H.; Nowicki, S.; Payne, A.; Larour, E.; Seroussi, H.; Lipscomb, W.H.; Gregory, J.; Abe-Ouchi, A.; Shepherd, A.; Simon, E.; et al. The future sea-level contribution of the Greenland ice sheet: A multi-model ensemble study of ISMIP6. Cryosphere 2020, 14, 3071–3096. [Google Scholar] [CrossRef]
  7. Machguth, H.; Rastner, P.; Bolch, T.; Mölg, N.; Sørensen, L.S.; Aðalgeirsdottir, G.; Van Angelen, J.H.; Van den Broeke, M.R.; Fettweis, X. The future sea-level rise contribution of Greenland’s glaciers and ice caps. Environ. Res. Lett. 2013, 8, 025005. [Google Scholar] [CrossRef]
  8. Edwards, T.L.; Fettweis, X.; Gagliardini, O.; Gillet-Chaulet, F.; Goelzer, H.; Gregory, J.M.; Hoffman, M.; Huybrechts, P.; Payne, A.J.; Perego, M.; et al. Effect of uncertainty in surface mass balance-elevation feedback on projections of the future sea level contribution of the Greenland ice sheet. Cryosphere 2014, 8, 195–208. [Google Scholar] [CrossRef]
  9. Slangen, A.B.A.; Meyssignac, B.; Agosta, C.; Champollion, N.; Church, J.A.; Fettweis, X.; Ligtenberg, S.R.M.; Marzeion, B.; Melet, A.; Palmer, M.D.; et al. Evaluating Model Simulations of Twentieth-Century Sea Level Rise. Part I: Global Mean Sea Level Change. J. Clim. 2017, 30, 8539–8563. [Google Scholar] [CrossRef]
  10. Hofer, S.; Lang, C.; Amory, C.; Kittel, C.; Delhasse, A.; Tedstone, A.; Fettweis, X. Greater Greenland Ice Sheet contribution to global sea level rise in CMIP6. Nat. Commun. 2020, 11, 6289. [Google Scholar] [CrossRef]
  11. Pattyn, F.; Ritz, C.; Hanna, E.; Asay-Davis, X.; DeConto, R.; Durand, G.; Favier, L.; Fettweis, X.; Goelzer, H.; Golledge, N.R.; et al. The Greenland and Antarctic ice sheets under 1.5 degrees C global warming. Nat. Clim. Chang. 2018, 8, 1053–1061. [Google Scholar] [CrossRef]
  12. Hall, D.K.; Comiso, J.C.; DiGirolamo, N.E.; Shuman, C.A.; Box, J.E.; Koenig, L.S. Variability in the surface temperature and melt extent of the Greenland ice sheet from MODIS. Geophys. Res. Lett. 2013, 40, 2114–2120. [Google Scholar] [CrossRef]
  13. Tedesco, M.; Fettweis, X.; Mote, T.; Wahr, J.; Alexander, P.; Box, J.E.; Wouters, B. Evidence and analysis of 2012 Greenland records from spaceborne observations, a regional climate model and reanalysis data. Cryosphere 2013, 7, 615–630. [Google Scholar] [CrossRef]
  14. Hanna, E.; Fettweis, X.; Mernild, S.H.; Cappelen, J.; Ribergaard, M.H.; Shuman, C.A.; Steffen, K.; Wood, L.; Mote, T.L. Atmospheric and oceanic climate forcing of the exceptional Greenland ice sheet surface melt in summer 2012. Int. J. Climatol. 2014, 34, 1022–1037. [Google Scholar] [CrossRef]
  15. Cullather, R.I.; Andrews, L.C.; Croteau, M.J.; Digirolamo, N.E.; Hall, D.K.; Lim, Y.; Loomis, B.D.; Shuman, C.A.; Nowicki, S.M.J. Anomalous circulation in July 2019 resulting in mass loss on the Greenland Ice Sheet. Geophys. Res. Lett. 2020, 47, e2020GL087263. [Google Scholar] [CrossRef]
  16. Tedesco, M.; Fettweis, X. Unprecedented atmospheric conditions (1948–2019) drive the 2019 exceptional melting season over the Greenland ice sheet. Cryosphere 2020, 14, 1209–1223. [Google Scholar] [CrossRef]
  17. Tedesco, M.; Mote, T.; Fettweis, X.; Hanna, E.; Jeyaratnam, J.; Booth, J.F.; Datta, R.; Briggs, K. Arctic cut-off high drives the poleward shift of a new Greenland melting record. Nat. Commun. 2016, 7, 11723. [Google Scholar] [CrossRef]
  18. Fettweis, X.; Hanna, E.; Lang, C.; Belleflamme, A.; Erpicum, M.; Gallée, H. Brief communication “Important role of the mid-tropospheric atmospheric circulation in the recent surface melt increase over the Greenland ice sheet”. Cryosphere 2013, 7, 241–248. [Google Scholar] [CrossRef]
  19. Rajewicz, J.; Marshall, S.J. Variability and trends in anticyclonic circulation over the Greenland ice sheet, 1948–2013. Geophys. Res. Lett. 2014, 41, 2842–2850. [Google Scholar] [CrossRef]
  20. Lim, Y.-K.; Schubert, S.D.; Nowicki, S.M.J.; Lee, J.N.; Molod, A.M.; Cullather, R.I.; Zhao, B.; Velicogna, I. Atmospheric summer teleconnections and Greenland Ice Sheet surface mass variations: Insights from MERRA-2. Environ. Res. Lett. 2016, 11, 024002. [Google Scholar] [CrossRef]
  21. Delhasse, A.; Fettweis, X.; Kittel, C.; Amory, C.; Agosta, C. Brief communication: Impact of the recent atmospheric circulation change in summer on the future surface mass balance of the Greenland Ice Sheet. Cryosphere 2018, 12, 3409–3418. [Google Scholar] [CrossRef]
  22. Bevis, M.; Harig, C.; Khan, S.A.; Brown, A.; Simons, F.J.; Willis, M.; Fettweis, X.; van den Broeke, M.R.; Madsen, F.B.; Kendrick, E.; et al. Accelerating changes in ice mass within Greenland, and the ice sheet’s sensitivity to atmospheric forcing. Proc. Natl. Acad. Sci. USA 2019, 116, 1934–1939. [Google Scholar] [CrossRef]
  23. Hofer, S.; Tedstone, A.J.; Fettweis, X.; Bamber, J.L. Decreasing cloud cover drives the recent mass loss on the Greenland Ice Sheet. Sci. Adv. 2017, 3, e1700584. [Google Scholar] [CrossRef]
  24. Mattingly, K.S.; Mote, T.L.; Fettweis, X. Atmospheric River Impacts on Greenland Ice Sheet Surface Mass Balance. J. Geophys. Res.-Atmos. 2018, 123, 8538–8560. [Google Scholar] [CrossRef]
  25. Chylek, P.; Box, J.E.; Lesins, G. Global Warming and the Greenland Ice Sheet. Clim. Chang. 2004, 63, 201–221. [Google Scholar] [CrossRef]
  26. Hanna, E.; Huybrechts, P.; Steffen, K.; Cappelen, J.; Huff, R.; Shuman, C.; Irvine-Fynn, T.; Wise, S.; Griffiths, M. Increased Runoff from Melt from the Greenland Ice Sheet: A Response to Global Warming. J. Clim. 2008, 21, 331–341. [Google Scholar] [CrossRef]
  27. Hanna, E.; Cappelen, J.; Fettweis, X.; Mernild, S.H.; Mote, T.L.; Mottram, R.; Steffen, K.; Ballinger, T.J.; Hall, R.J. Greenland surface air temperature changes from 1981 to 2019 and implications for ice-sheet melt and mass-balance change. Int. J. Climatol. 2021, 41, 1336–1352. [Google Scholar] [CrossRef]
  28. Hanna, E.; Jones, J.M.; Cappelen, J.; Mernild, S.H.; Wood, L.; Steffen, K.; Huybrechts, P. The influence of North Atlantic atmospheric and oceanic forcing effects on 1900-2010 Greenland summer climate and ice melt/runoff. Int. J. Climatol. 2013, 33, 862–880. [Google Scholar] [CrossRef]
  29. McLeod, J.T.; Mote, T.L. Linking interannual variability in extreme Greenland blocking episodes to the recent increase in summer melting across the Greenland ice sheet. Int. J. Climatol. 2016, 36, 1484–1499. [Google Scholar] [CrossRef]
  30. Hahn, L.; Ummenhofer, C.C.; Kwon, Y.-O. North Atlantic Natural Variability Modulates Emergence of Widespread Greenland Melt in a Warming Climate. Geophys. Res. Lett. 2018, 45, 9171–9178. [Google Scholar] [CrossRef]
  31. Jiang, S.; Ye, A.; Xiao, C. The temperature increase in Greenland has accelerated in the past five years. Glob. Planet. Chang. 2020, 194, 103297. [Google Scholar] [CrossRef]
  32. McLeod, J.T.; Mote, T.L. Assessing the role of precursor cyclones on the formation of extreme Greenland blocking episodes and their impact on summer melting across the Greenland ice sheet. J. Geophys. Res.-Atmos. 2015, 120, 12357–12377. [Google Scholar] [CrossRef]
  33. Walsh, J.E.; Ballinger, T.J.; Euskirchen, E.S.; Hanna, E.; Mård, J.; Overland, J.E.; Tangen, H.; Vihma, T. Extreme weather and climate events in northern areas: A review. Earth Sci. Rev. 2020, 209, 103324. [Google Scholar] [CrossRef]
  34. Woollings, T.; Barriopedro, D.; Methven, J.; Son, S.-W.; Martius, O.; Harvey, B.; Sillmann, J.; Lupo, A.R.; Seneviratne, S. Blocking and its response to climate change. Curr. Clim. Chang. Rep. 2018, 4, 287–300. [Google Scholar] [CrossRef]
  35. Häkkinen, S.; Hall, D.K.; Shuman, C.A.; Worthen, D.L.; DiGirolamo, N.E. Greenland ice sheet melt from MODIS and associated atmospheric variability. Geophys. Res. Lett. 2014, 41, 1600–1607. [Google Scholar] [CrossRef]
  36. Häkkinen, S.; Rhines, P.B.; Worthen, D.L. Atmospheric Blocking and Atlantic Multidecadal Ocean Variability. Science 2011, 334, 655–659. [Google Scholar] [CrossRef]
  37. Nusbaumer, J.; Alexander, P.M.; LeGrande, A.N.; Tedesco, M. Spatial Shift of Greenland Moisture Sources Related to Enhanced Arctic Warming. Geophys. Res. Lett. 2019, 46, 14723–14731. [Google Scholar] [CrossRef]
  38. Bennartz, R.; Shupe, M.D.; Turner, D.D.; Walden, V.P.; Steffen, K.; Cox, C.J.; Kulie, M.S.; Miller, N.B.; Pettersen, C. July 2012 Greenland melt extent enhanced by low-level liquid clouds. Nature 2013, 496, 83–86. [Google Scholar] [CrossRef]
  39. Neff, W.; Compo, G.P.; Ralph, F.M.; Shupe, M.D. Continental heat anomalies and the extreme melting of the Greenland ice surface in 2012 and 1889. J. Geophys. Res.-Atmos. 2014, 119, 6520–6536. [Google Scholar] [CrossRef]
  40. Gallagher, M.R.; Shupe, M.D.; Miller, N.B. Impact of Atmospheric Circulation on Temperature, Clouds, and Radiation at Summit Station, Greenland, with Self-Organizing Maps. J. Clim. 2018, 31, 8895–8915. [Google Scholar] [CrossRef]
  41. Ballinger, T.J.; Mote, T.L.; Mattingly, K.; Bliss, A.C.; Hanna, E.; van As, D.; Prieto, M.; Gharehchahi, S.; Fettweis, X.; Noël, B.; et al. Greenland Ice Sheet late-season melt: Investigating multiscale drivers of K-transect events. Cryosphere 2019, 13, 2241–2257. [Google Scholar] [CrossRef]
  42. Bennartz, R.; Shupe, M.D.; Turner, D.D.; Walden, V.P.; Steffen, K.; Cox, C.J.; Kulie, M.S.; Miller, N.B.; Pettersen, C. Extreme Greenland blocking and high-latitude moisture transport. Atmos. Sci. Lett. 2020, 21, e1002. [Google Scholar] [CrossRef]
  43. Ward, J.L.; Flanner, M.G.; Dunn-Sigouin, E. Impacts of Greenland Block Location on Clouds and Surface Energy Fluxes over the Greenland Ice Sheet. J. Geophys. Res. Atmos. 2020, 125, e2020JD033172. [Google Scholar] [CrossRef]
  44. Fausto, R.S.; van As, D.; Box, J.E.; Colgan, W.; Langen, P.L.; Mottram, R.H. The implication of nonradiative energy fluxes dominating Greenland ice sheet exceptional ablation area surface melt in 2012. Geophys. Res. Lett. 2016, 43, 2649–2658. [Google Scholar] [CrossRef]
  45. Mernild, S.H.; Mote, T.L.; Liston, G.E. Greenland ice sheet surface melt extent and trends: 1960–2010. J. Glaciol. 2011, 57, 621–628. [Google Scholar] [CrossRef]
  46. Mote, T.L. Greenland surface melt trends 1973–2007: Evidence of a large increase in 2007. Geophys. Res. Lett. 2007, 34, L22507. [Google Scholar] [CrossRef]
  47. Mattingly, K.S.; Turton, J.V.; Wille, J.D.; Noël, B.; Fettweis, X.; Rennermalm, K.; Mote, T.L. Increasing extreme melt in northeast Greenland linked to foehn winds and atmospheric rivers. Nat. Commun. 2023, 14, 1743. [Google Scholar] [CrossRef] [PubMed]
  48. Noël, B.; van de Berg, W.J.; Lhermitte, S.; Broeke, M.R.v.D. Rapid ablation zone expansion amplifies north Greenland mass loss. Sci. Adv. 2019, 5, eaaw0123. [Google Scholar] [CrossRef] [PubMed]
  49. Preece, J.R.; Wachowicz, L.J.; Mote, T.L.; Tedesco, M.; Fettweis, X. Summer Greenland blocking diversity and its impact on the surface mass balance of the Greenland ice sheet. J. Geophys. Res.-Atmos. 2022, 127, e2021JD035489. [Google Scholar] [CrossRef]
  50. Cawkwell, F.G.L.; Bamber, J.L. The impact of cloud cover on the net radiation budget of the Greenland ice sheet. Ann. Glaciol. 2002, 34, 141–149. [Google Scholar] [CrossRef]
  51. Cullather, R.I.; Nowicki, S.M.J. Greenland Ice Sheet Surface Melt and Its Relation to Daily Atmospheric Conditions. J. Clim. 2018, 31, 1897–1919. [Google Scholar] [CrossRef]
  52. Hersbach, H.; Bell, B.; Berrisford, P.; Biavati, G.; Horányi, A.; Muñoz Sabater, J.; Nicolas, J.; Peubey, C.; Radu, R.; Rozum, I.; et al. 1979 to Present. Copernicus Climate Change Service (C3S) Climate Data Store (CDS). Available online: https://cds.climate.copernicus-climate.eu/cdsapp#!/dataset/reanalysis-era5-single-levels-preliminary-back-extension?tab=overview (accessed on 26 December 2021). [CrossRef]
  53. Bell, B.; Hersbach, H.; Berrisford, P.; Dahlgren, P.; Horányi, A.; Muñoz Sabater, J.; Nicolas, J.; Radu, R.; Schepers, D.; Simmons, A.; et al. ERA5 Hourly Data on Single Levels from 1950 to 1978 (Preliminary Version). Copernicus Climate Change Service (C3S) Climate Data Store (CDS). 2020. Available online: https://cds.climate.copernicus-climate.eu/cdsapp#!/dataset/reanalysis-era5-single-levels-preliminary-back-extension?tab=overview (accessed on 26 December 2021).
  54. Fettweis, X.; Hofer, S.; Séférian, R.; Amory, C.; Delhasse, A.; Doutreloup, S.; Kittel, C.; Lang, C.; Van Bever, J.; Veillon, F.; et al. Brief communication: Reduction in the future Greenland ice sheet surface melt with the help of solar geoengineering. Cryosphere 2021, 15, 3013–3019. [Google Scholar] [CrossRef]
  55. Antwerpen, R.M.; Tedesco, M.; Fettweis, X.; Alexander, P.; van de Berg, W.J. Assessing bare-ice albedo simulated by MAR over the Greenland ice sheet (2000–2021) and implications for meltwater production estimates. Cryosphere 2022, 16, 4185–4199. [Google Scholar] [CrossRef]
  56. Mote, T.L.; Anderson, M.R. Variations in snowpack melt on the Greenland ice sheet based on passive microwave measurements. J. Glaciol. 1995, 41, 51–60. [Google Scholar] [CrossRef]
  57. Kohonen, T. Self-organized information of topologically correct features maps. Biol. Cybern. 1982, 43, 59–69. [Google Scholar] [CrossRef]
  58. Plumb, R.A. On the three-dimensional propagation of stationary waves. J. Atmos. Sci. 1985, 42, 217–229. [Google Scholar] [CrossRef]
  59. Wang, H.; Luo, D. North Atlantic Footprint of Summer Greenland Ice Sheet Melting on Interannual to Interdecadal Time Scales: A Greenland Blocking Perspective. J. Clim. 2022, 35, 1939–1961. [Google Scholar] [CrossRef]
  60. Chu, V.W.; Smith, L.C.; Rennermalm, A.K.; Forster, R.R.; Box, J.E. Greenland ice sheet albedo feedback: Thermodynamics and atmospheric drivers. Cryosphere 2012, 6, 821–839. [Google Scholar] [CrossRef]
  61. Hahn, L.C.; Storelvmo, T.; Hofer, S.; Parfitt, R.; Ummenhofer, C.C. Importance of Orography for Greenland Cloud and Melt Response to Atmospheric Blocking. J. Clim. 2020, 33, 4187–4206. [Google Scholar] [CrossRef]
  62. Kageyama, M.; Charbit, S.; Ritz, C.; Khodri, M.; Ramstein, G. Quantifying ice-sheet feedbacks during the last glacial inception. Geophys. Res. Lett. 2004, 31, L24203. [Google Scholar] [CrossRef]
  63. Le Clec’H, S.; Charbit, S.; Quiquet, A.; Fettweis, X.; Dumas, C.; Kageyama, M.; Wyard, C.; Ritz, C. Assessment of the Greenland ice sheet-atmosphere feedbacks for the next century with a regional atmospheric model coupled to an ice sheet model. Cryosphere 2019, 13, 373–395. [Google Scholar] [CrossRef]
  64. Wang, H.; Luo, D. Summer Russian heat waves and their links to Greenland’s ice melt and sea surface temperature anomalies over the North Atlantic and the Barents-Kara Seas. Environ. Res. Lett. 2020, 15, 114048. [Google Scholar] [CrossRef]
  65. Yao, Y. Spatial Asymmetric Tilt of the NAO Dipole Mode and Its Variability. Atmosphere 2019, 10, 781. [Google Scholar] [CrossRef]
  66. Qi, Y.; Shang, X.; Chen, G.; Yu, L. Eddy covariance measurements of turbulent fluxes in the surf zone. Acta Oceanol. Sin. 2020, 39, 63–72. [Google Scholar] [CrossRef]
  67. Luo, D.; Cha, J.; Zhong, L.; Dai, A. A nonlinear multiscale interaction model for atmospheric blocking: The eddyblocking matching mechanism. Q. J. R. Meteorol. Soc. 2014, 140, 1785–1808. [Google Scholar] [CrossRef]
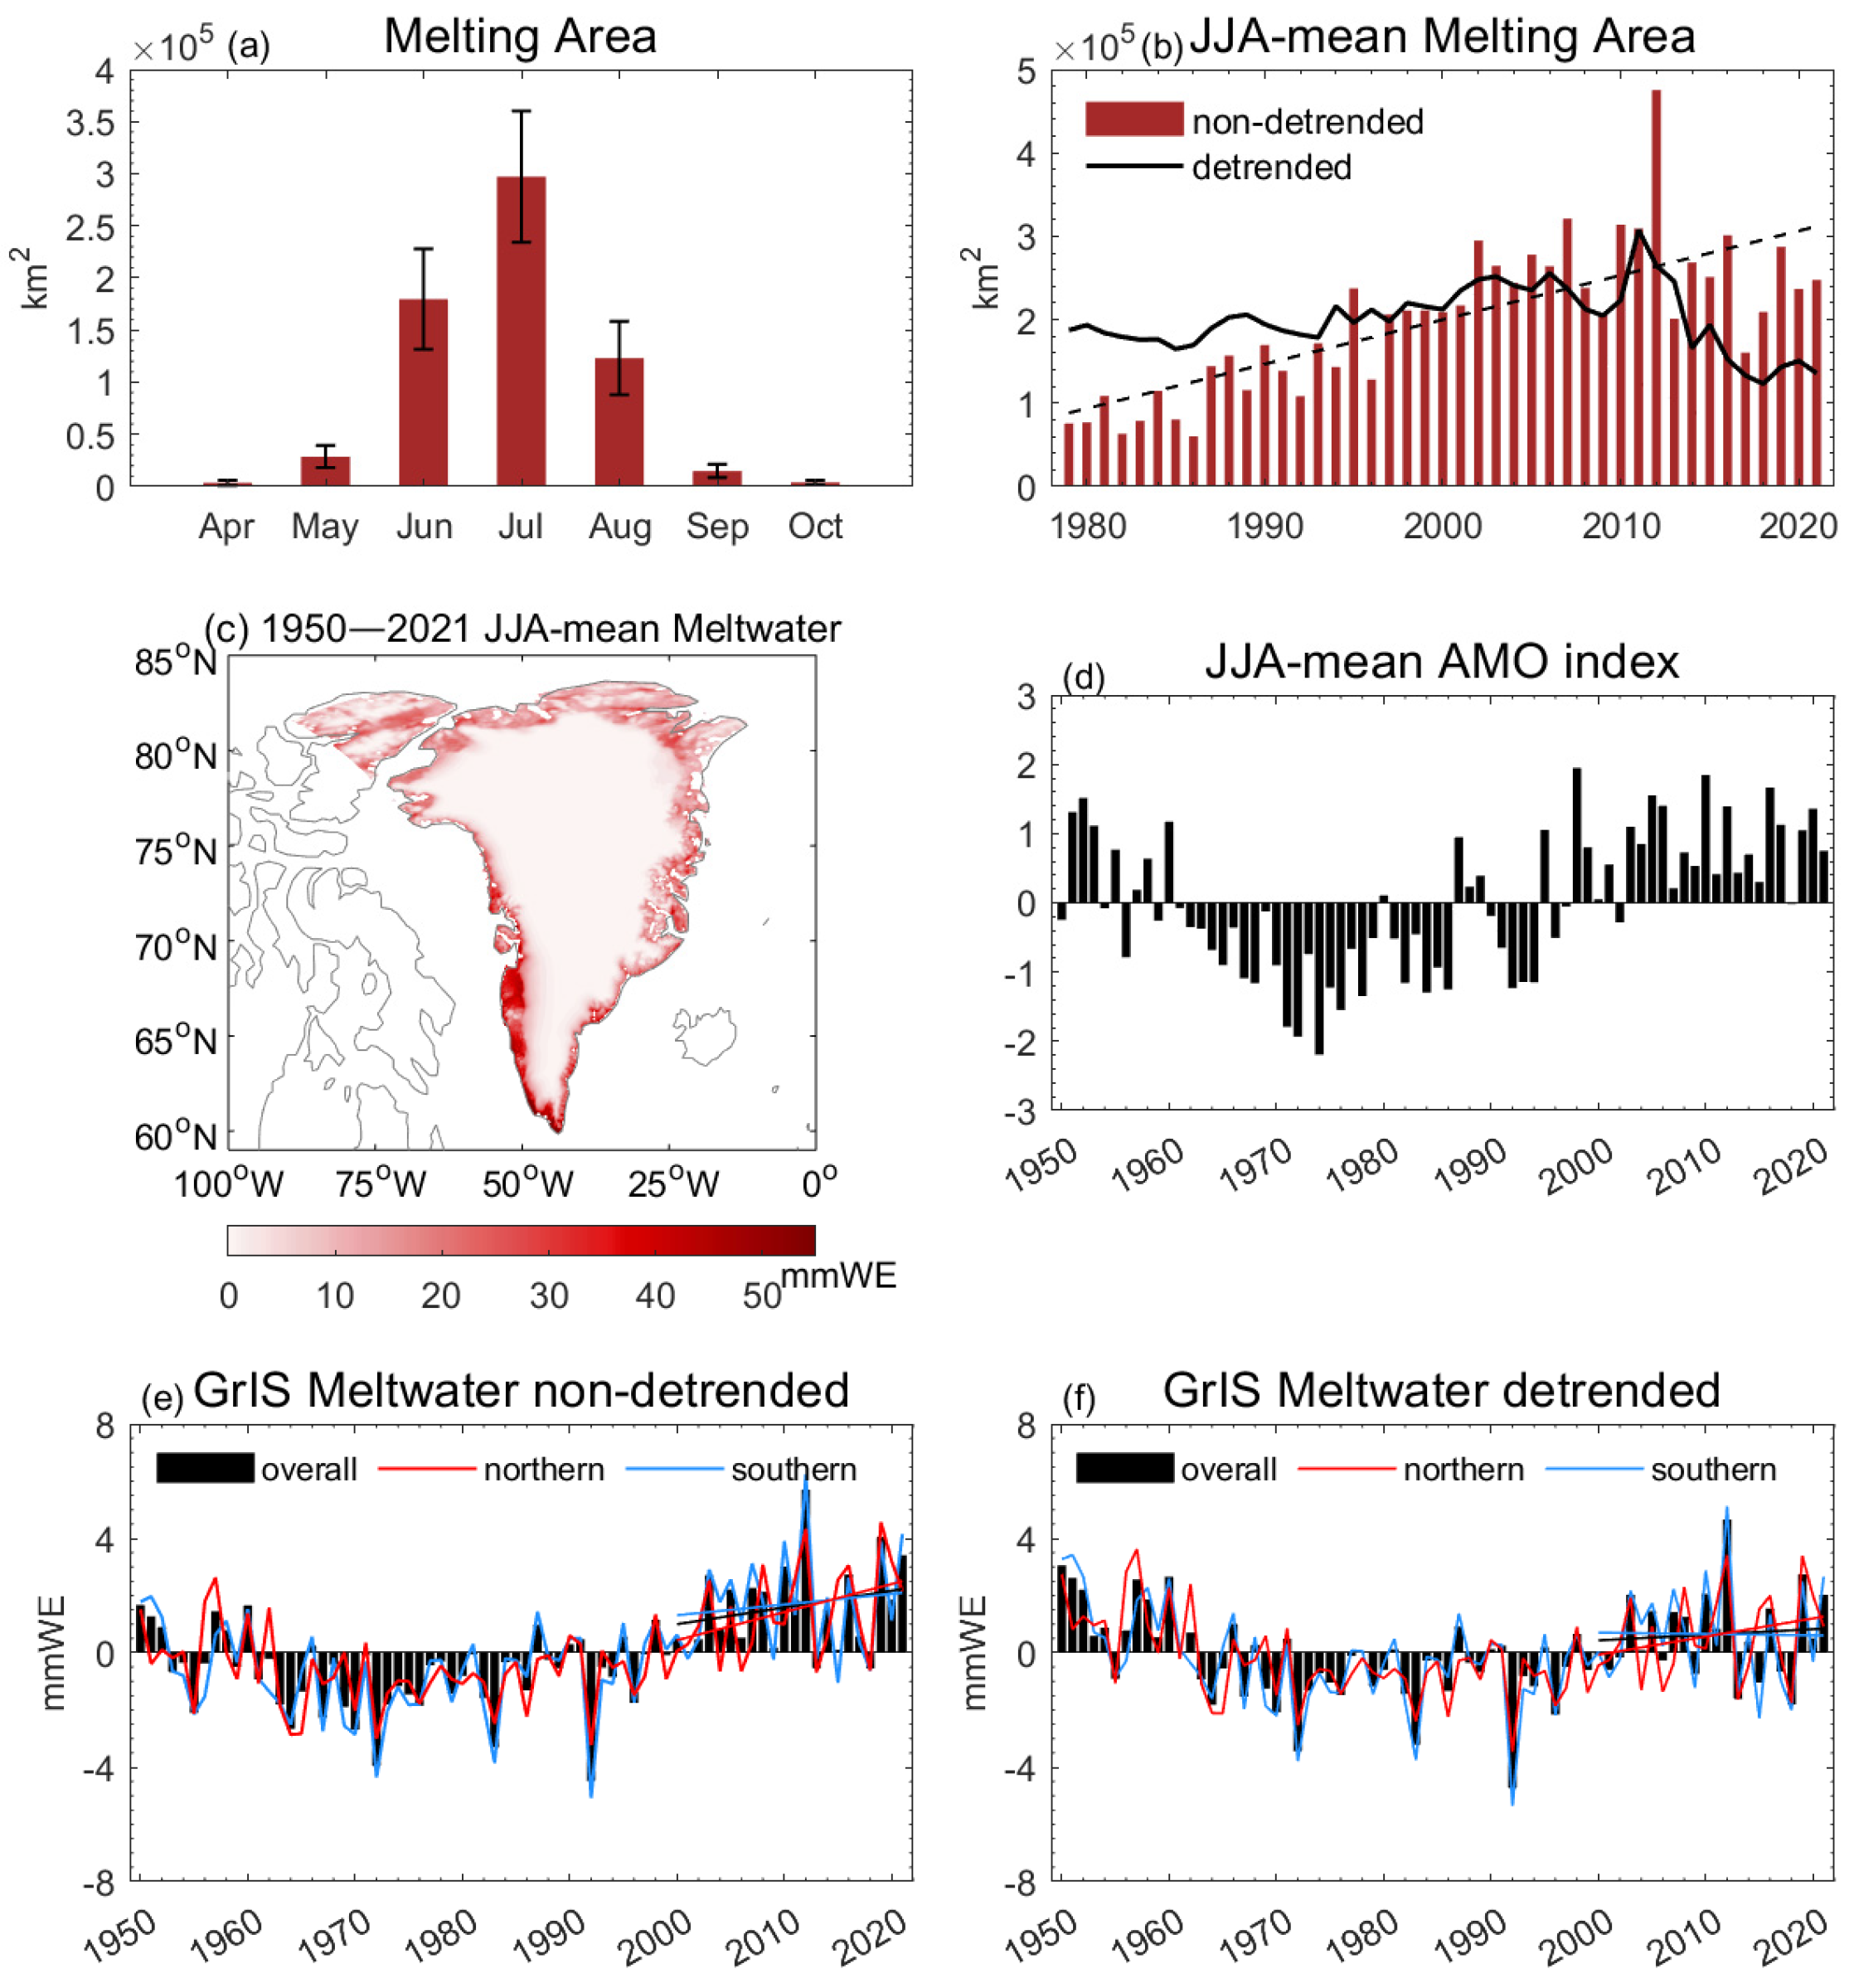
Figure 1. (a) Monthly GrIS melting area (unit: km2) from April to October averaged from 1979 to 2021. The black lines represent the fluctuation range within a 0.5 standard deviation. (b) Time series of JJA-mean GrIS melting area (unit: km2) for non-detrended (red bar) and detrended (solid black line) results from 1979 to 2021. The dashed black line is the long-term linear trend for 1979–2021. (c) JJA-mean GrIS ME anomaly (unit: mmWE) averaged from 1950 to 2021. (d) Time series of JJA-mean AMO index. (e,f) Time series of JJA-mean (e) non-detrended and (f) detrended GrIS ME anomalies (unit: mmWE) for overall (black bar), Northern (red line, north of 75° N), and Southern (blue line, south of 75° N) Greenland during 1950–2021, with solid lines representing a linear trend during 2000–2021.
Atmosphere 15 00057 g001
Figure 2. Six regime patterns of the JJA-mean ME anomalies (unit: mmWE) for Greenland based on the SOM method for (a) SOM1 (10 summers), (b) SOM2 (17 summers), (c) SOM3 (10 summers), (d) SOM4 (15 summers), (e) SOM5 (7 summers), and (f) SOM6 (11 summers) during 1950–2021.
Atmosphere 15 00057 g002
Figure 3. Time series of (a) the best-matching units and (b) the event number of summer EGIME for the six ME SOMs.
Atmosphere 15 00057 g003
Figure 4. Time–mean composite daily (ac) ME anomaly (unit: mmWE), (df) Z500 (shading; unit: gpm) and WAF (vectors; unit: m2s−2) anomalies, (gi) SAT anomaly (unit: K) averaged from the lag-5 to 5 days during the life cycle of EGIME in OGM (13 events), NGM (7 events), and SGM (15 events) summers during 1950–2021, where lag 0 denotes the peak day of GrIS melting. The black rectangles and yellow dots in (df) represent the GB domains and centers. The dots represent regions above the 95% confidence level for a two-sided Student’s t test.
Atmosphere 15 00057 g004
Figure 5. (ac) Temporal variations in the composite daily ME anomaly (unit: mmWE) averaged over Greenland (blue line), Northern Greenland (north of 75° N, yellow line) and Southern Greenland (south of 75° N, red line) during the life cycle of EGIME in (a) OGM, (b) NGM, and (c) SGM summers during 1950–2021. (df) Temporal variations in the composite daily (d) Z500 (unit: gpm), € SWDnet (unit: W·m−2), and (f) LWUnet (unit: W·m−2) anomalies averaged over Greenland during the life cycle of EGIME in OGM (blue line), (b) NGM (yellow line), and (c) SGM (red line) summers during 1950–2021.
Atmosphere 15 00057 g005
Figure 6. Time–mean composite daily for (ac) SWDnet and (df) LWUnet (unit: W·m−2) anomalies averaged from the lag-5 to 5 days during the life cycle of EGIME in OGM, NGM, and SGM summers from 1950 to 2021, where lag 0 denotes the peak day of GrIS melting. The dots represent regions above the 95% confidence level for a two-sided Student’s t test.
Atmosphere 15 00057 g006
Figure 7. Instantaneous fields of composite daily Z500 (shading; unit: gpm) and WAF (vectors; unit: m2·s−2) anomalies during the life cycle of EGIMEs in (a) OGM, (b) NGM, and (c) SGM summers during 1950–2021, where lag 0 denotes the day of the blocking peak.
Atmosphere 15 00057 g007aAtmosphere 15 00057 g007b
Figure 8. Time–mean composite daily SST (unit: K) anomalies in (ac) the Atlantic and (df) the Pacific averaged from the lag-15 to -5 days during the life cycle of EGIME in OGM, NGM, and SGM summers during 1950–2021, where lag 0 denotes the peak day of GrIS melting. The dots represent regions above the 95% confidence level for a two-sided Student’s t test.
Atmosphere 15 00057 g008
Figure 9. (ac) Temporal variations in the composite daily SST anomaly (unit: K) averaged over (a) MEA (15° W–0°, 45° N–60° N), (b) GNN (20° W–20° E, 55° N–70° N), and (c) MEP (150° W–110° W, 30° N–45° N) during the life cycle of EGIME in OGM (blue line), (b) NGM (yellow line), and (c) SGM (red line) summers during 1950–2021. (df) Temporal variations in the composite daily SHF (blue line), SSHF (yellow line), and SLHF (red line) anomalies (unit: J·m−2) averaged over (a) MEA for OGM, (b) GNN for NGM, and (c) MEP for the SGM mode during the life cycle of EGIME from 1950 to 2021.
Atmosphere 15 00057 g009
Figure 10. Time–mean composite daily SHF (unit: J·m−2) anomalies in (ac) the Atlantic and (df) the Pacific averaged from the lag-15 to -5 days during the life cycle of EGIME in OGM, NGM, and SGM summers during 1950–2021, where lag 0 denotes the peak day of GrIS melting. The dots represent regions above the 95% confidence level for a two-sided Student’s t test.
Atmosphere 15 00057 g010
Figure 11. Time–mean composite daily (a,b) U500 (unit: m·s−1), (c,d) Z500 (shading; unit: gpm), and WAF (vectors; m2·s−2) anomalies averaged from the lag-15 to -5 days during the life cycle of EGIME in OGM and NGM summers during 1950–2021, where lag 0 denotes the peak day of GrIS melting. The dots represent regions above the 95% confidence level for a two-sided Student’s t test.
Atmosphere 15 00057 g011
Table 1. The frequency, duration and intensity of EGIMEs for the OGM, NGM, and SGM modes.
ModeFrequencyDuration (day)Intensity (mmWE)
OGM1.634.853.88
NGM0.545.573.98
SGM1.675.004.05
Disclaimer/Publisher’s Note: The statements, opinions and data contained in all publications are solely those of the individual author(s) and contributor(s) and not of MDPI and/or the editor(s). MDPI and/or the editor(s) disclaim responsibility for any injury to people or property resulting from any ideas, methods, instructions or products referred to in the content.