Abstract
Dust storms have large impacts on air quality and meteorological elements; however, their relationships with atmospheric greenhouse gases (e.g., CO2) and radiation components remain uncertain. In this study, the co-variation of dust and CO2 concentrations and its possible influencing mechanism are examined using observations at the Shangdianzi (SDZ) regional Global Atmosphere Watch (GAW) station along with simulations of the Vegetation Photosynthesis and Respiration Model coupled with the Weather Research and Forecasting model (WRF-VPRM), during two dust storm events on 15 and 28 March 2021. During these events, hourly CO2 concentrations decreased by 40–50 ppm at SDZ while dust concentrations increased to 1240.6 and 712.4 µg m−3. The elevated dust increased diffusive shortwave irradiance by 50–60% and decreased direct shortwave irradiance by ~60% along with clouds. The dust events were attributed to the passages of two cold front systems over northern China. At SDZ, during the frontal passages, wind speed increased by 3–6 m s−1, and relative humidity decreased by 50–60%. The CO2 variations associated with the frontal systems were captured by the WRF-VPRM despite the overestimated surface CO2 level at SDZ. Biogenic CO2 flux plays an indistinctive role in the large CO2 variation at SDZ, as it is weak during the non-growing season. The cold fronts pushed polluted air southeastward over the North China Plain and replaced it with low-CO2 air from Northwest China, leading to the decline in CO2. These findings demonstrate that mesoscale synoptic conditions significantly affect the regional transport and dispersion of CO2, which can influence the prediction of terrestrial carbon balance on a regional scale.
1. Introduction
Dust storms are natural hazardous weather phenomena that typically occur over arid and semi-arid areas worldwide [1]. They are generated when massive mineral dust particles are emitted from dry, bare soil surfaces into the atmosphere due to strong winds. Dust storms can cause severe environmental and health problems in many countries adjacent to and downwind of dust source areas [2,3,4,5]. East Asia is the second largest dust source worldwide and contributes ~40% (8~13 Tg) of the global dust loading, with the two largest contributors being the Taklimakan and Gobi deserts in northern China [6]. The impacts of Asian dust storms on air quality in nearby countries and regions have been extensively investigated via satellite data, in situ observations, and numerical simulations (e.g., [7,8,9,10]). For instance, Nan and Wang [11] found that surface ozone concentrations on dusty days were usually lower than those on non-dusty days over northern China in spring 2015–2017, and ozone concentrations generally decreased with the increase in coarse particulate matter, which is related to the direct uptake of ozone by Asian dust. Liu et al. [8] noted that the concentrations of SO2, NO2, and CO varied with meteorological conditions during different dust storm events in Lanzhou, a megacity in northwestern China. Compared with these air pollutants, the variation and distribution of atmospheric CO2 during dust storms have rarely been investigated, even though CO2 and air pollutants are sometimes co-emitted [12]. Furthermore, due to its large spatiotemporal variability over land, CO2 is usually considered one of the main uncertainties in predicting the terrestrial carbon balance, especially on a regional scale [13]. It is thus worthwhile to explore the potential impacts of Asian dust storms on atmospheric CO2 in China.
Dust storms can affect the variation and distribution of CO2 concentrations in two major ways. First, a change in wind caused by specific synoptic systems—such as cold fronts [12,14] during dust storms—directly affects CO2 transport and dispersion and results in large fluctuations in CO2 concentration. Second, the changes in ambient temperature and surface radiation during dust storm events can potentially modify the biogenic CO2 uptake and emission thanks to the photosynthesis and respiration processes of terrestrial ecosystems. A weather–biosphere online coupled model (WRF-VPRM), in which the Vegetation Photosynthesis and Respiration Model (VPRM) is coupled with the Weather Research and Forecast (WRF) model, has been used to examine the impacts of the biogenic CO2 flux and the transport process of CO2 over different regions. This mesoscale model with a fine spatial resolution (e.g., ~10 km × ~10 km) has the advantage of reproducing the effects of mesoscale synoptic systems on regional CO2 variation compared with some global CO2 models [12,14,15,16], such as the Carbon Tracker model with the spatial resolution of 3° × 2° over the whole globe and 1° × 1° on regional scales [17]. For instance, Li et al. [16] found that enhanced local biotic respiration due to an abrupt increase in air temperature (Ta) partly caused a high surface CO2 episode on 15 October 2016, over a mixed forest in Northeast China. Hu et al. [14] indicated that the daytime bands of elevated CO2 mole fraction ahead of a cold front on 4 August 2016 over the Northern Great Plains in the United States were formed in part due to the accumulation of nighttime respiration. In addition, VPRM is fully coupled with the WRF model that considers the impact of WRF-simulated meteorological fields on the calculation of terrestrial CO2 fluxes every time step and computes the transport of CO2 using simulated continuous meteorological fields [15]. Compared with offline simulation, the online-coupled WRF-VPRM can capture the real-time feedback between synoptic weather and land-surface dynamics and can reduce uncertainties in the simulated CO2 fluxes/concentrations [16]. In the past decade, the WRF-VPRM model has been applied in different countries and regions over the world, such as North America [14,18,19], Europe [20], and China [16,21].
Considering that the radiative/climate forcing is exerted by greenhouse gases in the whole column of the atmosphere rather than only from the surface, a few studies have examined the relationship between the occurrence of dust storms and column CO2 concentration in terms of satellite data. For example, based on the products from the Moderate Resolution Imaging Spectral Radiometer (MODIS) and Greenhouse Gas Observing Satellite (GOSAT) in the spring from 2009 to 2010, Guo et al. [22] found that the column CO2 concentrations increased and reached peak values on the last or penultimate days of dust storms in China, which was mainly related to the country’s atmospheric flows from north to south. Due to limitations of coarse spatial and temporal resolutions, as well as the low accuracy of satellite products, it is difficult to use satellite data to reveal the detailed co-variation (e.g., hourly) of dust and CO2 concentrations, as well as the underlying influencing mechanisms.
In this study, we used the simultaneous in situ observations of CO2 and dust concentrations as well as meteorological parameters at the Shangdianzi (SDZ) regional Global Atmosphere Watch (GAW) station to examine the co-variation of CO2 and dust aerosols under various meteorological conditions during two mega dust storm events in March 2021 in China. We also conducted three-dimensional CO2 simulations using the WRF-VPRM to investigate the impacts of dust storms on the regional transport and biogenic contribution of CO2.
This article is organized as follows. Section 2 introduces the observational site and data and describes the WRF-VPRM and simulation setup. Section 3 analyzes the fine-resolution variation and spatial distribution of surface CO2 concentration in relation to meteorological conditions and biogenic contributions during the two dust storm events. Conclusions and discussions are summarized in Section 4.
2. Materials and Methods
2.1. Observational Site and Data
SDZ (40.65° N, 117.12° E; 293.3 m a.s.l.), one of the four earliest regional GAW stations of the World Meteorological Organization in China, is located in the northern North China Plain, ~120 km northeast of Beijing (Figure 1). Thanks to its excellent geolocation and fewer anthropogenic emission sources around the site, SDZ provides representative background data for investigations of climate and atmospheric environments [23]. The SDZ station is primarily surrounded by shrubs, orchards, and farmland, and it is predominately controlled by west-northwesterly winds in spring, the peak season of Asian dust outbreaks [24].
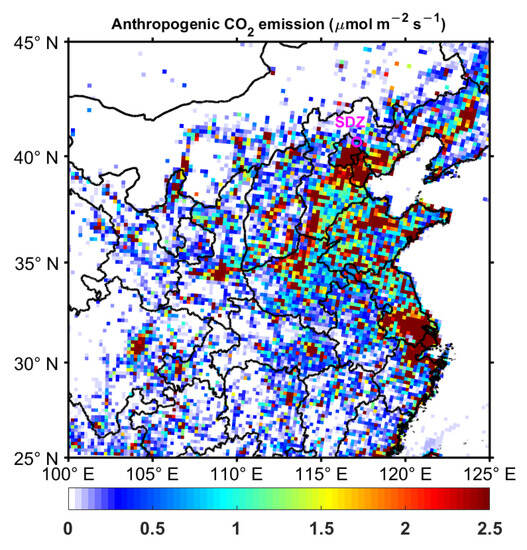
Figure 1.
Geographical location of Shangdianzi (SDZ) station (represented by a circle) in China and the distribution of 0.5° × 0.5° anthropogenic CO2 emissions in March 2021 obtained from the Open-source Data Inventory for Anthropogenic CO2 (ODIAC) emission dataset.
CO2 concentrations were continuously observed by a low-cost light sensor (K30) developed by the Institute of Atmospheric Physics (IAP), Chinese Academy of Sciences, which was installed on a bracket 1.5 m above the top of the SDZ building or ~8 m above ground level. The K30 sensor is a microprocessor-controlled device based on non-dispersive infrared technology since the infrared energy can pass through an atmospheric sampling chamber without deformation. An optical filter is designed in the K30 sensor to eliminate all light except the wavelength that CO2 gas molecules can absorb (4.26 µm) [25]. It has a measurement range of 0 to 10,000 ppm and an accuracy within ±5 ppm compared with the high-precision CO2 measurements from Picarro after calibration and environmental correction in the laboratory [26,27], and it has been used to monitor CO2 in different regions and countries [28,29,30,31,32]. Turbulent fluctuations of CO2 concentration, wind speed (WS), and Ta were measured using an open-path CO2/H2O analyzer (LI-7500; Li-Cor, Lincoln, NE, USA) and a three-dimensional sonic anemometer (CSAT3; Campbell Scientific, Logan, UT, USA) mounted on a 63-m-high platform on an observation tower at SDZ, with a frequency of 10 Hz. Based on the turbulent measurements, the CO2 flux—also known as net ecosystem exchange (NEE)—in each 30-minute interval can be calculated according to Equation (1) [33]:
where c′ and w′ are the fluctuations of CO2 concentration (c) and vertical velocity (w), respectively.
In addition to being one of the earliest GAW stations in China, SDZ is also a meteorological station with more than 60 years of observations of meteorological elements, including Ta, WS, wind direction (WD), relative humidity (RH), Pa, and atmospheric visibility (Vis), etc. Moreover, a new baseline surface radiation system has been carried out since 2013, in which nine radiation components are observed using radiation instruments, for example, global shortwave irradiance (GSWI), direct shortwave irradiance (DSWI), diffuse shortwave irradiance (DifSWI), and downward longwave irradiance (DnLWI) are measured by a CMP11 pyranometer (Kipp and Zonen, Delft, South Holland, The Netherlands), a CHP1 pyrheliometer (Kipp and Zonen), a CMP11 pyranometer shaded by a ball installed on a two-axis automatic sun tracker (FT-ST22; Jiangsu Radio Science Research Institute Co., Wuxi, Jiangsu province, China), and an IR02 pyrgeometer (Hukseflux, Delft, South Holland, The Netherlands), respectively. To examine the impacts of clouds on the surface radiation budget, the total cloud fraction is measured using a fisheye camera mounted on the top of the HY-WP1A Intelligent Weather Observation System (Huayun Sounding Meteorological Technology Inc., Beijing, China). The fisheye camera has a 180° field of view and takes full-sky photographs at 1 min intervals. The photographs are then processed using an artificial intelligence image-detecting system to yield hourly data of cloud fraction with less than 10% uncertainty [34]. Mass concentrations of particulate matter with diameters less than or equal to 2.5 µm (PM2.5) and 10 µm (PM10) were simultaneously measured using an ambient particulate monitor (TEOM 1400a; Thermo Electron Corporation, Waltham, MA, USA). PM10 can roughly represent dust particles during dust storm events [35], and the ratio of PM2.5 to PM10 (<0.4–0.5) can be used as an indicator to identify dust storms [36,37]. All of the aforementioned variables at SDZ were converted to 1 h averages for further analysis. Detailed information on the measurements and devices used in this study is summarized in Table 1.

Table 1.
Basic description of observational variables and associated devices at the SDZ.
2.2. WRF-VPRM Simulation
We conducted three-dimensional CO2 simulations using the WRF-VPRM to examine the impacts of biogenic emission and uptake and meteorological conditions on atmospheric CO2. In the WRF-VPRM, the WRF model is used to simulate atmospheric flows and CO2 transport and diffusion while the VPRM handles the terrestrial CO2 fluxes, where NEE is simulated as the sum of gross ecosystem exchange (GEE) and ecosystem respiration (ER) [38,39]:
NEE = ER + GEE,
GEE depends on the maximum light use efficiency (λ), temperature scale (Tscale), water stress scale (Wscale), phenology scale (Pscale), photosynthetically active radiation (PAR), its half-saturation value (PAR0), and the fraction of PAR absorbed by the photosynthetically active portion of the vegetation (FAPARPAV). The calculations of Tscale, Wscale, and Pscale follow the method of Hu et al. [14]. The FAPARPAV, which is proportional to the enhanced vegetation index (EVI), was set to equal the MODIS 8-day-updated EVI in this study, and PAR was calculated as PAR = shortwave downward radiation/0.505 according to Mahadevan et al. [38]. We adopted an improved terrestrial respiration parameterization developed by Gourdji et al. [39] instead of the original parameterization (ER = α × T + β, where T is the simulated 2 m air temperature, and α and β are two empirical parameters for respiration) in the VPRM [38]. The improved ER parameterization considers the impacts of EVI and Wscale on respiration and its interactions with temperature to capture soil moisture effects and a quadratic dependence on T. The values of several empirical parameters (α1, α2, β, γ, k1, k2, k3, λ, and PAR0) for seven land use categories in the VPRM and parameter calibration can be found in [14,39]. The offline simulation using the original VPRM is conducted during March at SDZ, driven by meteorological parameters using WRF model output, to examine the improvement in CO2 simulation using the updated VPRM.
In this study, the simulation area covers China and has a horizontal grid spacing of 20 km with 47 vertical layers extending from the surface to 10 hPa. The simulation was initialized at 0000 Universal Time (UT) on 1 January 2021 and was run throughout the whole year using spectral nudging and climate down-scaling techniques following [40,41,42]. Table 2 lists the dataset used in the WRF-VPRM simulation. More detailed information on the model setting can be found in [16,42].
Table 2.
List of input datasets for the WRF-VPRM simulation.
3. Results
3.1. Two Dust Storms over Northern China in March 2021
Two strong dust storm events occurred on 15–17 and 27–29 March 2021 over northern China. The first has been described as the strongest sand dust storm in almost a decade [43]; during this event, 10 people were reported dead, hundreds of people were reported missing in Mongolia, thousands of flights were grounded, and public transportation systems halted in China [44]. Researchers have analyzed meteorological drivers and synoptic conditions, aerosol optical and radiative properties, and dust composition and transport processes during the two dust storm events [10,45,46,47]. According to the true-color images from the Himawari-8 satellite [45], a dense dust plume covered a large part of China on 15 March, with an area of more than 3.8 × 10⁶ km2 (accounting for 40% of China’s land area), while the dust plume intensity on 27 March was relatively weaker, along with a reduced eastward influence and scope. Both dust storms were triggered by an exceptionally strong Mongolian cyclone along the central and eastern plateau of Inner Mongolia in conjunction with a surface-level cold high-pressure system at the rear [45].
The two dust storms caused a remarkable rise in PM10 concentration and a distinct decline in CO2 concentration near the surface at SDZ. During the first dust storm event on 15 March, the hourly mean PM10 concentration increased from 103.9 µg m−3 at 07:00 Beijing Time (BT) to 1240.6 µg m−3 at 09:00 BT, and the surface CO2 concentration correspondingly decreased by 43.2 ppm during this period (Figure 2a). During the second dust storm event on 28 March, the hourly mean PM10 concentration increased from 79.4 µg m−3 at 06:00 BT to 712.4 µg m−3 at 10:00 BT, while CO2 concentration decreased by 48.2 ppm (Figure 2b). The variation range of CO2 concentration on the two dust-storm days was distinctly higher than the mean diurnal variation range of CO2 concentration in spring (from March to May) in 2021 at SDZ (~28 ppm, gray line in Figure 2a,b). The surface CO2 concentration at SDZ usually begins to increase after 16:00 and reaches a peak in the early morning, which is inconsistent with previous studies on different ecosystems in Northeast China [16]. The PM2.5/PM10 ratio decreased from 0.7–0.9 to 0.3–0.5 during the two dust storms, reflecting the increase in the proportion of coarse dust particles in the air. We will discuss the possible reasons for the large decrease in near-surface CO2 concentration during the two dust storms in the next section.
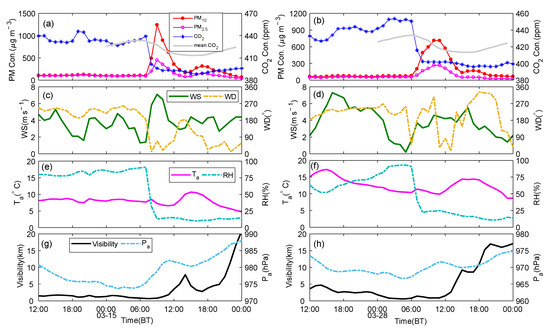
Figure 2.
Variation of hourly mean (a,b) concentrations of particulate matter (PM2.5, PM10) and CO2, (c,d) wind speed and direction, (e,f) air temperature and relative humidity, (g,h) atmospheric visibility and air pressure from 12:00 Beijing Time (BT) on 14 March to 00:00 BT on 16 March and from 12:00 BT on 27 March to 00:00 BT on 29 March 2021, observed at SDZ. The gray line in (a,b) represents the mean diurnal variation of CO2 concentration in spring (from March to May) 2021 at SDZ.
3.2. Impact of Dust Storm Events on the Variation of CO2 Concentration
3.2.1. Variations of Surface Meteorological Conditions
We first examined the variations of near-surface meteorological conditions during the two dust storm events observed at SDZ (Figure 2 and Table 3). Wind speed increased by 3–6 m s−1, and wind direction changed abruptly after the outbreaks of the dust storm events (Figure 2c,d). Strong winds provided necessary dynamic conditions for the emission and transport of dust particles, and the changes in winds could also affect the transport and diffusion of atmospheric CO2 mainly due to the impact of turbulence. Meanwhile, the ambient RH decreased from ~90% to below 20–30% due to the intruding dry air masses (Figure 2e,f). High ambient RH and enhanced dust loading contributed to low visibility (<1 km) before and during the dust storms. Ta initially increased slightly due to the enhanced turbulent mixing by strong wind shears [48] and then decreased by <1 °C due to the intrusion of cold air masses. With the movement of Mongolian cyclones, the surface Pa at SDZ gradually increased (Figure 2g,h).
Table 3.
Values of meteorological parameters and PM10 and CO2 concentrations before and after the outbreak of two dust storm events observed at Shangdianzi.
Dust storms also modified the surface radiation budget at SDZ (Figure 3). On dusty days (15 and 28 March), the daytime values of GSWI and DSWI were mostly lower than on non-dusty days (16 and 29 March). For instance, the maximum DSWI on 15 March was 248 W m−2 (~38% of the peak value on 16 March), which may have been caused by a reduction in sunlight arriving at the surface due to massive dust aerosols and clouds (Figure 3a,b). The total cloud fraction was much higher on dust days (~80%) than on non-dusty days (~20%) (Figure 3c,d), and the daily mean total cloud fraction had a negative correlation with daily mean GSWI and DSWI under different PM10 levels in March 2021 overall, with correlation coefficients (R) reaching −0.64 (with significant level p < 0.001) and −0.54 (p < 0.005), respectively (Figure 4a,b). Furthermore, the daily mean DSWI markedly decreased with the increasing PM10 levels; when the daily mean PM10 concentration exceeded 100 µg m−3, the DSWI remained lower than 80 W m−2 (Figure 4b). Meanwhile, the maximum values of DifSWI reached 371 and 443 W m−2 on the two dusty days, increasing by 49% and 61% compared with the peaks on non-dusty days, which was due to the enhanced scattering effect of ambient dust particles during dust storms. Additionally, the DnLWI on dusty days was higher than on non-dusty days (Figure 4c,d), which mainly depended on sky conditions (e.g., clouds, fog, smoke, blowing snow, smog, etc.), air temperature, and air-water content [49,50]. Atmospheric inverse radiation often increases with higher air temperature, more water vapor in the air (affecting the atmospheric emissivity), and higher cloud cover. Given the small variations in Ta (Figure 2e,f) and water vapor pressure (Figure 3c,d) during the two dust storm events, the rise in DnLWI on dusty days primarily depended on the increasing cloud cover. Overall, a positive correlation between the daily mean DnLWI and total cloud fraction (with R = 0.57 and p < 0.005) was found in March 2021 at SDZ. Compared with other radiative components, the correlation between DifSWI and cloud fraction was weaker because DifSWI not only depends on cloud fraction but also on aerosols and other molecular constituents [51].
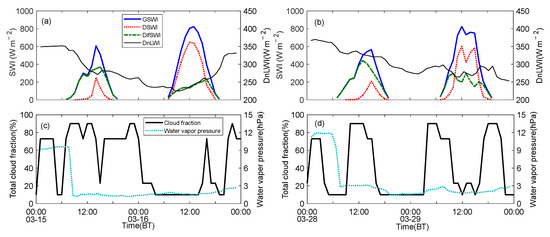
Figure 3.
Variation of the hourly mean (a,b) global shortwave irradiance (GSWI), direct shortwave irradiance (DSWI), diffuse shortwave irradiance (DifSWI), and downward longwave irradiance (DnLWI), and (c,d) total cloud fraction and water vapor pressure on 15–16 and 28–29 March 2021, at SDZ.
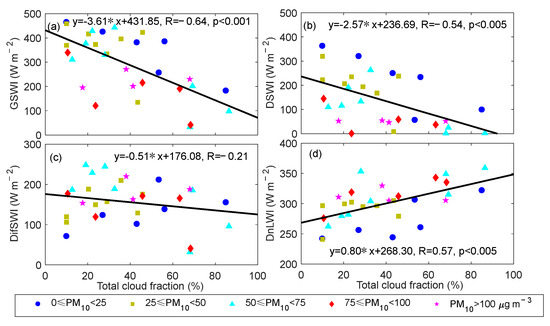
Figure 4.
Scatter plots of daily mean (a) global shortwave irradiance (GSWI), (b) direct shortwave irradiance (DSWI), (c) diffuse shortwave irradiance (DifSWI), and (d) downward longwave irradiance (DnLWI) against daily mean total cloud fraction under different daily mean PM10 levels at SDZ in March 2021. The fitting equations and their correlation coefficients (R) with significant levels (p) are also shown in each subplot.
The changes in meteorological conditions during dust storm events likely influence the variation of CO2 concentration via the following aspects. First, the changes in air temperature and surface shortwave radiation probably modify NEE and CO2 concentration due to plants’ photosynthesis and respiration processes. Second, changes in wind fields caused by cyclone systems can dominantly affect the transport and dispersion of atmospheric CO2. We examined these potential impacts of dust storms on atmospheric CO2 using observations of NEE and WRF-VPRM simulations.
3.2.2. Evaluation of the WRF-VPRM Simulation
We used the WRF-VPRM simulations to probe the potential impacts of dust storm events on variations of CO2 concentration. First, we evaluated the WRF-VPRM performance by comparing the simulated hourly mean CO2 concentration, NEE, and several meteorological parameters with the observations at SDZ during March 2021 (Figure 5). The day-to-day variability of CO2 concentration was well reproduced using the WRF-VPRM, with an R-value between the observed and simulated data of 0.57. Most of the simulated and observed NEE values varied between a range of ±2 µmol m−2 s−1 during March at SDZ, which was significantly smaller than the range of NEE (±15 µmol m−2 s−1) during the growing season (from May to September) at SDZ. The CO2-decline episodes on the two dusty days were also captured by the model despite an overestimation of the surface CO2 level (Figure 5a), which was partly due to the overestimation of NEE, especially after 10 March (Figure 5b). To clarify the bias of simulated NEE, we separated NEE into GEE and ER during March at SDZ (Figure 6). The overestimation of NEE is mainly due to the overestimation of ER; GEE remained at low levels during early March. Although the improved VPRM made NEE closer to the observations compared with the original schemes, it still has uncertainty in CO2 simulation in China, which is partly due to the choices of VPRM parameters (Figure 6). Moreover, the bias of NEE was also related to the difference in height between simulations and observations. The height of simulated NEE is the lowest level in the model (near the surface), whereas the observation height of NEE is 63 m. Different height of NEE represents different source areas of CO2 fluxes. In addition, the WRF-VPRM well reproduced the day-to-day variation of meteorological conditions (Figure 5c–f), with high R-values for Ta (0.89) and specific humidity (q, R = 0.82) and relatively lower R-values for WS (0.50) and WD (0.31). Overall, the WRF-VPRM had a good performance for simulating CO2 concentration and meteorological conditions and thus can be adapted to display the variation and distribution of atmospheric CO2 during dust storm events.
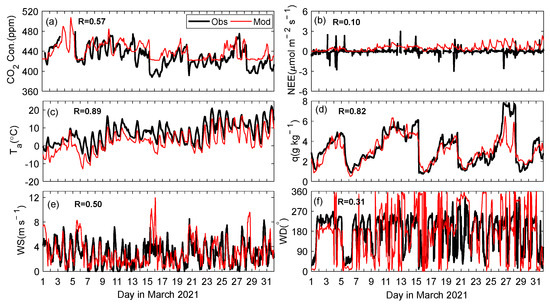
Figure 5.
Comparison of the hourly mean (a) CO2 concentration, (b) CO2 flux (NEE), (c) air temperature, (d) specific humidity, (e) wind speed, and (f) wind direction in March 2021 observed at SDZ with that simulated with the WRF-VPRM. Correlation coefficients (R) between simulated and observed values for each parameter are also shown in the corresponding subplot.
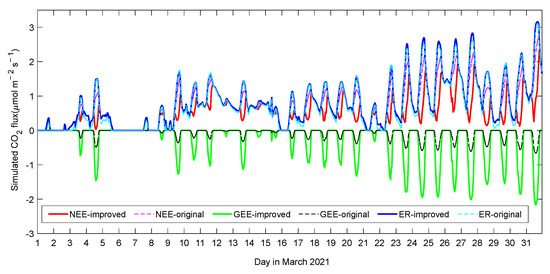
Figure 6.
Comparison of the hourly mean CO2 flux (NEE, GEE, and ER) simulated with improved and original VPRM in March 2021 at SDZ.
3.2.3. Impact on Biogenic CO2 Contribution
After evaluating the WRF-VPRM simulation, we subsequently examined the possible impacts of dust storms on biogenic CO2 fluxes and atmospheric CO2 concentration at SDZ. Figure 7 shows the variation of observed and simulated hourly mean CO2 concentrations and NEE at SDZ during the two dust storm events. The simulated surface CO2 concentration decreased by 36–40 ppm after the occurrence of dust storms, which was comparable to the observed degree of decline in CO2 concentration at SDZ (Figure 7a,b). However, the simulated CO2-decline episodes occurred 1 h later on 15 March and 3 h earlier on 28 March than the actual events, and the surface CO2 concentration was overestimated by about 10–20 ppm on average during the two dust storm events.
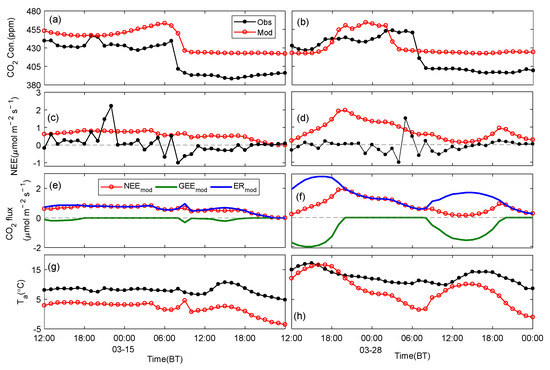
Figure 7.
Variation of observed and simulated (a,b) hourly mean CO2 concentration, (c,d) NEE, (e,f) gross ecosystem exchange (GEE) and ecosystem respiration (ER) split from NEE, and (g,h) air temperature during the two dust storm events at SDZ.
Both the observed and simulated NEE did not show obvious changes after the beginning of the dust storm events, meaning the large decline in CO2 concentration was scarcely related to the change in biogenic CO2 flux at SDZ during the two dust storm events (Figure 7c,d). The observed NEE remained near zero at most times, and the simulated NEE generally varied within 0–1 µmol m−2 s−1 but reached nearly 2 µmol m−2 s−1 at times. The overestimation of NEE partly resulted in the overestimation of surface CO2 concentration at SDZ.
To further explore the reason for the bias in simulated NEE during the two dust storm events, the variation of simulated GEE and ER were analyzed (Figure 7e,f). GEE remained zero during the first dust storm event due to low EVI (0.11) in early March, and the overestimation of NEE was mainly due to the overestimation of ER. During the second dust storm event, the GEE had negative values (>−2 µmol m−2 s−1) during the daytime with the slightly enhanced EVI (0.12); the ER became even larger (2–3 µmol m−2 s−1) due to higher Ta and EVI, eventually leading to an overestimation of NEE. Some studies have reported the overestimation of nighttime respiration and NEE by the VPRM based on the original ER parameterization. For instance, Li et al. [16] found the NEE and, thus, CO2 concentration were overestimated over a rice paddy area from April to June and over a mixed forest in May 2016 in Northeast China when the EVI was low, and Ta increased above zero in the WRF-VPRM. Although the improved ER parameterization showed a better performance than the original parameterization in the VPRM over different terrestrial ecosystems in the United States [14,39], it still overestimated ER and NEE at SDZ. This is probably because the values of empirical parameters in the VPRM calibrated in the United States are not suitable in China due to different climate and terrestrial ecosystem properties [21,52,53]. Long-term observations of CO2 flux over different ecosystems in China are needed to optimize VPRM parameters and validate the model performance. We also noted that Ta was underestimated by about 5.3 ± 2.7 °C (Figure 7g,h) during the two dust storms, which weakened the overestimation of NEE, as well as CO2 concentration to some degree.
3.2.4. Impact on Regional Transport of Atmospheric CO2
Since the large decline of CO2 concentration during the dust storms scarcely depended on biogenic CO2 flux, we subsequently examined the impact of synoptic conditions on the regional transport of atmospheric CO2. The spatial distributions of surface CO2 concentration during the two dust storm events in China are shown in Figure 8 and Figure 9. The upper four plots are simulation outputs with both anthropogenic emissions and biogenic fluxes, while the bottom four plots are with anthropogenic emissions only.
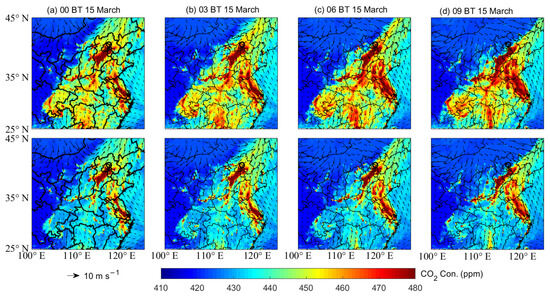
Figure 8.
Spatial distributions of simulated surface CO2 concentrations over North China Plain at (a) 00:00 BT, (b) 03:00 BT, (c) 06:00 BT, and (d) 09:00 BT on 15 March 2021. Upper subplots represent biogenic and anthropogenic CO2 contributions, and lower subplots represent anthropogenic CO2 contribution. The location of SDZ is denoted with black circles.
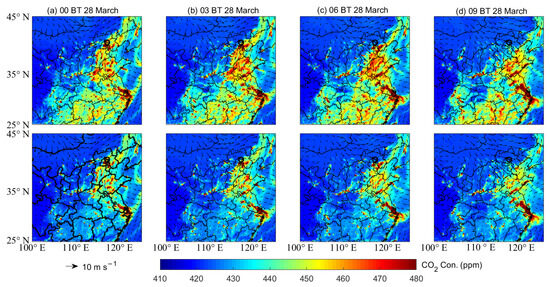
Figure 9.
Spatial distributions of simulated surface CO2 concentrations over North China Plain at (a) 00:00 BT, (b) 03:00 BT, (c) 06:00 BT, and (d) 09:00 BT on 28 March 2021. Upper subplots represent biogenic and anthropogenic CO2 contributions, and lower subplots represent anthropogenic CO2 contribution. The location of SDZ is denoted with black circles.
There was a large gradient in CO2 concentration across the cold fronts, with high/low CO2 concentration ahead/behind the cold fronts; similar characteristics of CO2 distribution influenced by cold fronts have been reported previously (e.g., [14]). With the cold fronts moving southeastward, CO2 concentration at SDZ increased at first, then significantly decreased after the passage of the dust storms (Figure 8a–d and Figure 9a–d). Without biogenic CO2 fluxes, the simulated surface CO2 concentrations did not change much over northern China (including SDZ) but exhibited a decreasing trend over central and southern China. This phenomenon is derived from enhanced EVI (Figure 10a), and warmer weather over the regions at lower latitudes contributed to large CO2 emissions due to plant respiration.
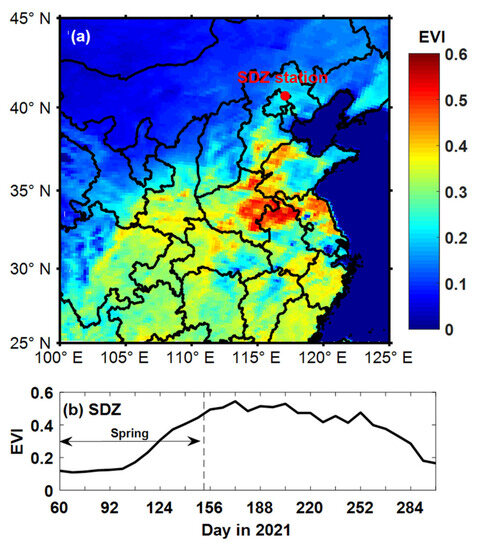
Figure 10.
(a) Spatial distributions of the enhanced vegetation index (EVI) averaged for March 2021 and (b) variation of the 8-day EVI at SDZ from March to mid-October 2021.
Overall, the aforementioned analysis revealed that the large variation of surface CO2 concentration at SDZ was mainly attributed to the strong CO2 dispersion caused by synoptic conditions rather than the change in biogenic CO2 fluxes. In addition, the observed significant decline in surface CO2 concentration during dust storm events appeared different from the results of Guo et al. [21], who reported an increase in column CO2 concentration during dust storm events in China based on satellite products. On one hand, the variation of column CO2 concentration is probably not consistent with that of the surface CO2 concentration, which is related to the vertical distribution of atmospheric CO2. On the other hand, the spatial and temporal resolutions of satellite data cannot reflect the detailed variation of atmospheric CO2.
4. Conclusions
The impacts of Asian dust storm events on atmospheric CO2 in China have been rarely studied. Based on dust, CO2, and meteorological observations at SDZ in Beijing and WRF-VPRM simulations during two dust storm events on 15 and 28 March 2021, we examined the co-variation of dust and CO2 concentrations and discussed the potential influencing mechanisms.
The surface CO2 concentration declined by 40–50 ppm after the beginning of the two dust storm events, corresponding to the marked increase in PM10 concentration with peak values of 1240.6 and 712.4 µg m−3, respectively. Surface meteorological conditions changed significantly during the two dust storms, with enhanced wind speed (increasing by 3–6 m s−1), abrupt changes in wind direction, and decreasing ambient relative humidity (by 60–70%). Massive dust particles suspended in the air and clouds caused a ~60% decrease in direct shortwave irradiance and a 50–60% increase in diffusive shortwave irradiance compared to non-dusty days. The changes in meteorological conditions during dust storm events likely affect the biogenic CO2 fluxes of terrestrial ecosystems and the transport and dispersion of atmospheric CO2.
The eddy covariance-measured CO2 flux at SDZ varied insignificantly and remained close to zero at most times after the beginning of the dust storm events. Thus, the large decline in surface CO2 concentration scarcely depended on the variation in CO2 uptake and emission by the terrestrial ecosystem. The WRF-VPRM captured the CO2-decline episodes despite overestimations of NEE and surface CO2 concentration at SDZ. Due to low EVI in early spring over northern China, biogenic CO2 fluxes also had small impacts on the regional distribution of simulated surface CO2 concentration in this region.
The WRF-VPRM simulation showed CO2-rich zones and CO2-poor zones located ahead of and behind the cold fronts, respectively. With the arrival of cold fronts, strong winds and wind shears favored the vertical mixing and regional transport of atmospheric CO2, which is the main reason for the large declines in surface CO2 concentration during the two dust storms.
The limitations of this study should be noted. First, the two dust storms investigated in this study only represent a typical situation in northern China in early spring. The impacts of dust storm events on atmospheric CO2 in other regions and seasons or months should be further investigated using multi-year observations at more stations. Particularly, the biogenic CO2 fluxes over lower latitude regions or during the growing season are more likely to change during dust storm events due to enhanced EVI (Figure 10). Xie et al. [54] indicated aerosols enhance gross primary production by 0.36 Pg C yr−1 (5%), which primarily stems from Southwest and Southeast China. Second, it was difficult to examine the variation of column CO2 concentration using satellite products due to high cloud cover during the two dust storm events. The fine-resolution profiles of CO2 concentration are necessary to investigate the impacts of dust storms on the vertical distribution of CO2. Third, although the WRF-VPRM model can well capture the influence of mesoscale synoptic systems on CO2 transport and dispersion, the surface CO2 level and NEE were still overestimated to some degree. The calibration of newly improved VPRM empirical parameters is required over different terrestrial ecosystems in China to improve the simulation of CO2 fluxes and concentration. Nevertheless, this study will improve our comprehensive understanding of the impacts of dust storms on CO2 variation.
Author Contributions
Conceptualization, X.L.; methodology, X.L. and W.Q.; software, X.L. and X.-M.H.; formal analysis, X.L. and Y.Z.; investigation, F.D. and H.Z.; resource, W.Q. and Q.J.; data curation, Z.M. and W.Q.; writing—original draft preparation, X.L and W.Q.; writing—review and editing, X.L. and X.-M.H.; visualization, D.W.; supervision, W.Q.; project administration, X.L. and Q.J.; funding acquisition, Q.J. All authors have read and agreed to the published version of the manuscript.
Funding
This research was supported by the National Key R&D Program of China (2022YFF0801301), National Natural Science Foundation of China (No. 41730647), Basic Research Funds of Central Public Welfare Research Institutes (No. 2021SYIAEZD2, No. 2022SYIAEJY2), and Key Research Project of Liaoning Meteorological Administration (No. LNCP202205). We thank Dr. Pengfei Han from the Institute of Atmospheric Physics, Chinese Academy of Sciences, for providing the K30 analysis meter.
Institutional Review Board Statement
Not applicable.
Informed Consent Statement
Not applicable.
Data Availability Statement
The data presented in this study are available on request from the corresponding author.
Conflicts of Interest
The authors declare no conflict of interest.
Abbreviations
List of abbreviations and symbols in this paper
| Symbols | Full Name | Symbols | Full Name |
| WS | wind speed | PAR | photosynthetically active radiation |
| WD | wind direction | PAR0 | half-saturation value of PAR |
| Ta | air temperature | FAPARPAV | the fraction of PAR absorbed by the photosynthetically active portion of the vegetation |
| RH | relative humidity | EVI | enhanced vegetation index |
| Pa | air pressure | GSWI | global shortwave irradiance |
| Vis | atmospheric visibility | DSWI | direct shortwave irradiance |
| q | specific humidity | DifSWI | diffuse shortwave irradiance |
| NEE | net ecosystem exchange | DnLWI | downward longwave irradiance |
| GEE | gross ecosystem exchange | w’ | fluctuation for vertical velocity |
| ER | ecosystem respiration | c’ | fluctuation in CO2 concentration |
| λ | the maximum light use efficiency | R | correlation coefficient |
| Tscale | temperature scale | UT | Universal Time |
| Wscale | water stress scale | BT | Beijing Time |
| Pscale | phenology scale | SDZ | Shangdianzi station |
References
- Shao, Y. Physics and Modelling of Wind Erosion; Springer: Dordrecht, The Netherlands, 2008. [Google Scholar]
- Zhang, X.Y.; Gong, S.L.; Shen, Z.X.; Mei, F.M.; Xi, X.X.; Liu, L.C.; Zhou, Z.J.; Wang, D.; Wang, Y.Q.; Cheng, Y. Characterization of soil dust aerosol in China and its transport and distribution during 2001 ACE-Asia: 1. Network observations. J. Geophys. Res.-Atmos. 2003, 108, 1–13. [Google Scholar] [CrossRef]
- Yu, H.; Tan, Q.; Zhou, L.; Zhou, Y.; Bian, H.; Chin, M.; Ryder, C.L.; Levy, R.C.; Pradhan, Y.; Shi, Y.; et al. Observation and modeling of the historic “Godzilla” African dust intrusion into the Caribbean Basin and the southern US in June 2020. Atmos. Chem. Phys. 2021, 21, 12359–12383. [Google Scholar] [CrossRef]
- Griffin, D.W.; Kellogg, C.A. Dust storms and their impact on ocean and human health: Dust in Earth’s atmosphere. EcoHealth 2004, 1, 284–295. [Google Scholar] [CrossRef]
- Hashizume, M.; Ueda, K.; Nishiwaki, Y.; Michikawa, T.; Onozuka, D. Health effects of Asian dust events: A review of the literature. Jpn. J. Hyg. 2010, 65, 413–421. [Google Scholar] [CrossRef] [PubMed]
- Kok, J.F.; Adebiyi, A.A.; Albani, S.; Balkanski, Y.; Checa-Garcia, R.; Chin, M.; Colarco, P.R.; Hamilton, D.S.; Huang, Y.; Ito, A.; et al. Contribution of the world’s main dust source regions to the global cycle of desert dust. Atmos. Chem. Phys. 2021, 21, 8169–8193. [Google Scholar] [CrossRef]
- Huang, X.X.; Wang, T.J.; Jiang, F.; Liao, J.B.; Cai, Y.F.; Yin, C.Q.; Zhu, J.L.; Han, Y. Studies on a severe dust storm in East Asia and its impact on the air quality of Nanjing, China. Aerosol Air Qual. Res. 2013, 13, 179–193. [Google Scholar] [CrossRef]
- Liu, X.; Wang, J.; Qiu, J.; Li, Q.; Dong, J.; Wei, L. Influence of dust storms on air pollution for replacement and addition in Lanzhou. China Environ. Sci. 2018, 38, 1646–1652, (In Chinese with English abstract). [Google Scholar]
- Li, J.; Hao, X.; Liao, H.; Yue, X.; Li, H.; Long, X.; Li, N. Predominant type of dust storms that influence air quality over northern China and future projections. Earth’s Future 2022, 10, e2022EF002649. [Google Scholar] [CrossRef]
- Filonchyk, M. Characteristics of the severe March 2021 Gobi Desert dust storm and its impact on air pollution in China. Chemosphere 2022, 287, 132219. [Google Scholar] [CrossRef]
- Nan, Y.; Wang, Y. Observational evidence for direct uptake of ozone in China by Asian dust in springtime. Atmos. Environ. 2018, 186, 45–55. [Google Scholar] [CrossRef]
- Hu, X.-M.; Hu, J.; Gao, L.; Cai, C.; Jiang, Y.; Xue, M.; Zhao, T.; Crowell, S.M. Multisensor and multimodel monitoring and investigation of a wintertime air pollution event ahead of a cold front over eastern China. J. Geophys. Res. Atmos. 2021, 126, e2020JD033538. [Google Scholar] [CrossRef]
- Chan, D.; Yuen, C.W.; Higuchi, K.; Shashkov, A.; Liu, J.; Chen, J.; Worthy, D. On the CO2 exchange between the atmosphere and the biosphere: The role of synoptic and mesoscale processes. Tellus B Chem. Phys. Meteorol. 2004, 56, 194–212. [Google Scholar] [CrossRef]
- Hu, X.-M.; Gourdji, S.M.; Davis, K.J.; Wang, Q.; Zhang, Y.; Xue, M.; Feng, S.; Moore, B.; Crowell, S.M. Implementation of improved parameterization of terrestrial flux in WRF-VPRM improves the simulation of nighttime CO2 peaks and a daytime CO2 band ahead of a cold front. J. Geophys. Res. Atmos. 2021, 126, e2020JD034362. [Google Scholar] [CrossRef]
- Ahmadov, R.; Gerbig, C.; Kretschmer, R.; Koerner, S.; Neininger, B.; Dolman, A.J.; Sarrat, C. Mesoscale covariance of transport and CO2 fluxes: Evidence from observations and simulations using the WRF-VPRM coupled atmosphere-biosphere model. J. Geophys. Res. 2007, 112, D22107. [Google Scholar] [CrossRef]
- Li, X.; Hu, X.-M.; Cai, C.; Jia, Q.; Zhang, Y.; Liu, J.; Xue, M.; Xu, J.; Wen, R.; Crowell, S.M. Terrestrial CO2 fluxes, concentrations, sources and budget in Northeast China: Observational and modeling studies. J. Geophys. Res. Atmos. 2020, 125, e2019JD031686. [Google Scholar] [CrossRef]
- Cheng, Y.; Aa, X.; Yun, F.; Zhou, L.; Liu, L.; Fang, S.; Xu, L. Simulation of CO2 variations at Chinese background atmospheric monitoring stations between 2000 and 2009: Applying a CarbonTracker model. Chin. Sci. Bull. 2013, 58, 3986–3993. [Google Scholar] [CrossRef][Green Version]
- Feng, S.; Lauvaux, T.; Newman, S.; Rao, P.; Ahmadov, R.; Deng, A.; Díaz-Isaac, L.I.; Duren, R.M.; Fischer, M.L.; Gerbig, C.; et al. Los Angeles megacity: A high-resolution land-atmosphere modelling system for urban CO2 emissions. Atmos. Chem. Phys. 2016, 16, 9019–9045. [Google Scholar] [CrossRef]
- Park, C.; Gerbig, C.; Newman, S.; Ahmadov, R.; Feng, S.; Gurney, K.R.; Carmichael, G.R.; Park, S.-Y.; Lee, H.-W.; Goulden, M.; et al. CO2 transport, variability, and budget over the Southern California Air Basin using the high-resolution WRF-VPRM model during the CalNex 2010 campaign. J. Appl. Meteorol. Clim. 2018, 57, 1337–1352. [Google Scholar] [CrossRef]
- Pillai, D.; Gerbig, C.; Ahmadov, R.; Rödenbeck, C.; Kretschmer, R.; Koch, T.; Thompson, R.; Neininger, B.; Lavrié, J.V. High-resolution simulations of atmospheric CO2 over complex terrain–representing the Ochsenkopf mountain tall tower. Atmos. Chem. Phys. 2011, 11, 7445–7464. [Google Scholar] [CrossRef]
- Diao, Y.; Huang, J.; Liu, C.; Cui, J.; Liu, S. A modeling study of CO2 flux and concentrations over the Yangtze River Delta using the WRF-GHG model. Chin. J. Atmos. Sci. 2015, 39, 849–860, (In Chinese with English abstract). [Google Scholar]
- Guo, M.; Wang, X.; Liu, Y.; Li, J.; Wang, H.; Matsuoka, N.; Tani, H. The effects of sand dust storms on greenhouse gases. Int. J. Remote Sens. 2012, 33, 6838–6853. [Google Scholar] [CrossRef]
- Zhou, H.G.; Quan, W.J.; Wang, Z.F.; Li, X.L.; Li, Y.R.; Zhao, H.J. Comparison of sunshine duration measurements between a Jordan sunshine recorder and three automatic sensors at Shangdianzi GAW station. J. Meteorol. Res. 2021, 35, 716–728. [Google Scholar] [CrossRef]
- An, X.; Zhou, L.; Yao, B.; Xu, L.; Ma, L. Analysis on source features of halogenated gases at Shangdianzi regional atmospheric background station. Atmos. Environ. 2012, 57, 91–100. [Google Scholar] [CrossRef]
- Ali, A.S.; Zanzinger, Z.; Debose, D.; Stephens, B. Open Source Building Science Sensors (OSBSS): A low-cost Arduino-based platform for long-term indoor environmental data collection. Build. Environ. 2016, 100, 114–126. [Google Scholar] [CrossRef]
- Martin, C.R.; Zeng, N.; Karion, A.; Dickerson, R.R.; Ren, X.; Turpie, B.N.; Weber, K.J. Evaluation and environmental correction of ambient CO2 measurements from a low-cost NDIR sensor. Atmos. Meas. Tech. 2017, 10, 2383–2395. [Google Scholar] [CrossRef] [PubMed]
- Sense Air. K30 Products Sheets. 2019. Available online: https://senseair.com/products/flexibility-counts/k30/ (accessed on 20 July 2020).
- Khan, A.; Schaefer, D.; Tao, L.; Miller, D.J.; Sun, K.; Zondlo, M.A.; Harrison, W.A.; Roscoe, B.; Lary, D.J. Low Power Greenhouse Gas Sensors for Unmanned Aerial Vehicles. Remote Sens. 2012, 4, 1355–1368. [Google Scholar] [CrossRef]
- Shusterman, A.A.; Teige, V.E.; Turner, A.J.; Newman, C.; Kim, J.; Cohen, R.C. The BErkeley Atmospheric CO2 Observation Network: Initial evaluation. Atmos. Chem. Phys. 2016, 16, 13449–13463. [Google Scholar] [CrossRef]
- Müller, M.; Graf, P.; Meyer, J.; Pentina, A.; Brunner, D.; Perez-Cruz, F.; Hüglin, C.; Emmenegger, L. Integration and calibration of non-dispersive infrared (NDIR) CO2 low-cost sensors and their operation in a sensor network covering Switzerland. Atmos. Meas. Tech. 2020, 13, 3815–3834. [Google Scholar] [CrossRef]
- Bao, Z.; Han, P.; Zeng, N.; Liu, D.; Cai, Q.; Wang, Y.; Tang, G.; Zheng, K.; Yao, B. Observation and modeling of vertical carbon dioxide distribution in a heavily polluted suburban environment. Atmos. Ocean. Sci. Lett. 2020, 13, 371–379. [Google Scholar] [CrossRef]
- Liu, D.; Sun, W.; Zeng, N.; Han, P.; Yao, B.; Liu, Z.; Wang, P.; Zheng, K.; Mei, H.; Cai, Q. Observed decreases in on-road CO2 concentrations in Beijing during COVID-19 restrictions. Atmos. Chem. Phys. 2021, 21, 4599–4614. [Google Scholar] [CrossRef]
- Mauder, M.; Foken, T.; Clement, R.; Elbers, J.A.; Eugster, W.; Grünwald, T.; Heusinkveld, B.; Kolle, O. Quality control of CarboEurope flux data? Part 2: Inter-comparison of eddy-covariance software. Biogeosciences 2008, 5, 451–462. [Google Scholar] [CrossRef]
- Hua, H.X.; Zhang, R.Q.; Li, Z.H.; Tian, X. Installation, application and maintenance of HY-WP1 intelligent weather observation instrument. Henan Sci. Tech. 2021, 31, 6–8, (In Chinese with English abstract). [Google Scholar]
- Li, X.; Zhang, H. Seasonal variations in dust concentration and dust emission observed over Horqin Sandy Land area in China from December 2010 to November 2011. Atmos. Environ. 2012, 61, 56–65. [Google Scholar] [CrossRef]
- Tian, P.; Zhang, L.; Ma, J.; Tang, K.; Xu, L.; Wang, Y.; Cao, X.; Liang, J.; Ji, Y.; Jiang, J.H.; et al. Radiative absorption enhancement of dust mixed with anthropogenic pollution over East Asia. Atmos. Chem. Phys. 2018, 18, 7815–7825. [Google Scholar] [CrossRef]
- Fan, H.; Zhao, C.; Yang, Y.; Yang, X. Spatio-temporal variations of the PM2.5/PM10 ratios and its application to air pollution type classification in China. Front. Environ. Sci. 2021, 9, 692440. [Google Scholar] [CrossRef]
- Mahadevan, P.; Wofsy, S.C.; Matross, D.M.; Xiao, X.; Dunn, A.L.; Lin, J.C.; Gerbig, C.; Munger, J.W.; Chow, V.Y.; Gottlieb, E.W. A satellite-based biosphere parameterization for net ecosystem CO2 exchange: Vegetation Photosynthesis and Respiration Model (VPRM). Glob. Biogeochem. Cycles 2008, 22, GB2005. [Google Scholar] [CrossRef]
- Gourdji, S.M.; Karion, A.; Lopez-Coto, I.; Ghosh, S.; Mueller, K.L.; Zhou, Y.; Williams, C.A.; Baker, I.T.; Haynes, K.D.; Whetstone, J.R. A modified Vegetation Photosynthesis and Respiration Model (VPRM) for the eastern USA and Canada, evaluated with comparison to atmospheric observations and other biospheric models. J. Geophys. Res. Biogeo. 2022, 127, e2021JG006290. [Google Scholar] [CrossRef]
- Hu, X.-M.; Xue, M.; McPherson, R.A. The importance of soil-type contrast in modulating August precipitation distribution near the Edwards Plateau and Balcones Escarpment in Texas. J. Geophys. Res. 2017, 122, 10711–10728. [Google Scholar] [CrossRef]
- Hu, X.-M.; Xue, M.; McPherson, R.A.; Martin, E.; Rosendahl, D.H.; Qiao, L. Precipitation dynamical downscaling over the Great Plains. J. Adv. Model. Earth Syst. 2018, 10, 421–447. [Google Scholar] [CrossRef]
- Hu, X.-M.; Crowell, S.; Wang, Q.; Zhang, Y.; Davis, K.J.; Xue, M.; Xiao, X.; Moore, B.; Wu, X.; Choi, Y.; et al. Dynamical Downscaling of CO2 in 2016 over the contiguous United States using WRF-VPRM, a weather-biosphere-online-coupled model. J. Adv. Model. Earth Syst. 2020, 12, e2019MS001875. [Google Scholar] [CrossRef]
- Takahashi, T.; Sutherland, S.C.; Wanninkhof, R.; Sweeney, C.; Feely, R.A.; Chipman, D.W.; Hales, B.; Friederich, G.; Chavez, F.; Sabine, C.; et al. Climatological mean and decadal change in surface ocean pCO2, and net sea-air CO2 flux over the global oceans. Deep-Sea Res. Part II Top. Stud. Oceanogr. 2009, 56, 554–577. [Google Scholar] [CrossRef]
- Jin, J.; Pang, M.; Segers, A.; Han, W.; Fang, L.; Li, B.; Feng, H.; Lin, H.; Liao, H. Inverse modeling of the 2021 spring super dust storms in East Asia. Atmos. Chem. Phys. 2022, 22, 6393–6410. [Google Scholar] [CrossRef]
- Gui, K.; Yao, W.; Che, H.; An, L.; Zheng, Y.; Li, L.; Zhang, X. Record-breaking dust loading during two mega dust storm events over northern China in March 2021: Aerosol optical and radiative properties and meteorological drivers. Atmos. Chem. Phys. 2022, 22, 7905–7932. [Google Scholar] [CrossRef]
- Liang, P.; Chen, B.; Yang, X.; Liu, Q.; Li, A.; Mackenzie, L.; Zhang, D. Revealing the dust transport processes of the 2021 mega dust storm event in northern China. Sci. Bull. 2021, 67, 21–24. [Google Scholar] [CrossRef]
- Filonchyk, M.; Peterson, M. Development, progression, and impact on urban air quality of the dust storm in Asia in March 15–18, 2021. Urban Clim. 2022, 41, 101080. [Google Scholar] [CrossRef]
- Hu, X.-M.; Klein, P.M.; Xue, M.; Shapiro, A.; Nallapareddy, A. Enhanced vertical mixing associated with a nocturnal cold front passage and its impact on near-surface temperature and ozone concentration. J. Geophys. Res. Atmos. 2013, 118, 2714–2728. [Google Scholar] [CrossRef]
- Jiang, Y.; Wang, Q.; Zhang, H.; Wang, Z.; Hu, B. Radiation characteristics of urban boundary layer measured on the meteorological tower in Beijing. Plateau Meteorol. 2010, 29, 918–928, (In Chinese with English abstract). [Google Scholar]
- Li, X.; Ma, Y.; Wang, Y.; Lu, S.; Zhao, H.; Liu, N.; Wang, D. Characteristics of turbulence and aerosol optical and radiative properties during haze–fog episodes in Shenyang, Northeast China. Atmosphere 2021, 12, 1658. [Google Scholar] [CrossRef]
- Halthore, R.N.; Schwartz, S.E. Comparison of model-estimated and measured diffuse downward irradiance at surface in cloud-free skies. J. Geophys. Res. Atmos. 2000, 105, 20165–20177. [Google Scholar] [CrossRef]
- Zhang, J.R.; Wang, Y.W.; Zhang, M.; Diao, Y.W.; Liu, C. Optimization and validation of the vegetation photosynthesis and respiration model in a temperate broad-leaved Korean pine forest. Acta Ecol. Sin. 2017, 37, 6679–6690, (In Chinese with English abstract). [Google Scholar]
- Dayalu, A.; Munger, J.W.; Wofsy, S.C.; Wang, Y.; Nehrkorn, T.; Zhao, Y.; McElroy, M.B.; Nielsen, C.P.; Luus, K. Assessing biotic contributions to CO2 fluxes in northern China using the Vegetation, Photosynthesis and Respiration Model (VPRM-CHINA) and observations from 2005 to 2009. Biogeosciences 2018, 15, 6713–6729. [Google Scholar] [CrossRef]
- Xie, X.; Wang, T.; Yue, X.; Li, S.; Zhuang, B.; Wang, M. Effect of atmospheric aerosols on terrestrial carbon fluxes and CO2 concentrations in China. Atmos. Res. 2020, 237, 1. [Google Scholar] [CrossRef]


Disclaimer/Publisher’s Note: The statements, opinions and data contained in all publications are solely those of the individual author(s) and contributor(s) and not of MDPI and/or the editor(s). MDPI and/or the editor(s) disclaim responsibility for any injury to people or property resulting from any ideas, methods, instructions or products referred to in the content. |
© 2023 by the authors. Licensee MDPI, Basel, Switzerland. This article is an open access article distributed under the terms and conditions of the Creative Commons Attribution (CC BY) license (https://creativecommons.org/licenses/by/4.0/).