Abstract
This paper analyzed the variations of two air temperature indices, diurnal temperature range (DTR) and annual temperature range (ATR), calculated based on observations at the Zagreb Grič Observatory over a period of 133 years (1887–2019). In intense climate changes strongly manifested by the increased air temperature, these two climate indices were determined to significantly impact human health and the environment. This effect is especially evident in urban areas. The Zagreb Grič Observatory is located in the center of Zagreb and has not changed its location during the observed period. It has a long homogeneous series of climatological observations, enabling a detailed study of climate variation in the city, which is strongly influenced by various urbanization processes. In 133 years, both of the analyzed indicators showed a statistically insignificant downward trend. The Rescaled Adjusted Partial Sums (RAPS) method revealed statistically significant differences in DTR’s time series between three sub-periods: 1887–1953, 1954–1989, and 1990–2019. The time series of ATR during 133 years behaved statistically differently in four sub-periods: 1887–1905; 1906–1926; 1927–1964; and 1965–2019. The analysis of monthly values of DTR showed that the DTR values are the highest in the warm part of the year, from May to August, when they are twice as high as those during the cold period from November to December. With an increase in precipitation, the DTR values decrease, while they increase as the mean annual temperature increases.
1. Introduction
The daily range of surface air temperature reflects the differences between each location’s day and night temperatures. The term diurnal temperature range, abbreviated as DTR, is mostly used in the international scientific literature. Therefore, it is used in this paper, as well. DTR is accepted as an important meteorological indicator related to global climate change. The annual range of surface air temperature is calculated as the difference between the mean monthly temperatures measured in the warmest and coldest months of each year. The term annual temperature range, abbreviated as ATR, is used in the international scientific literature and throughout this paper. ATR indicates the difference between summer and winter mean monthly temperatures. It is also used as an indicator of global climate change. The importance of studying variations in DTR and ATR values as a critical uncertainty in studying climate change was emphasized by [1].
Trends and variations in climate indices differ depending on the time scale used. The variations in longer (monthly, seasonal, yearly, decadal, etc.) time scales have been studied in detail, and much is known about their potential environmental consequences. Changes in shorter time scales, for example, a day or a week, have not been studied as much. This situation has changed significantly in recent decades, as it has been established that these changes can severely and perilously affect human health and the whole environment [2,3]. Ref. [4] points out that it is crucial to understand the relationship between DTR and its effect on organisms in light of accelerated climate changes and global warming. Evolutionary adaptation to sudden changes in air temperature cannot protect humans, animals, or plants. It was pointed out that analyses of the effects of climate change on aquatic and terrestrial ecosystems must focus on studying the mechanisms by which changes in DTR affect biogeography and species survival.
Ref. [5] considers, “Contrary to rising temperatures, the diurnal temperature range has decreased over the past several decades.” There are many reasons for concern regarding the changes in DTR as a consequence of climate change, and they necessitate a detailed planetary study. Increasing DTR values have been shown to cause an increase in the number of deaths or serious health problems in humans and animals [2,6,7,8,9,10]. Some papers have presented evidence that even short-term exposure to a large range of DTR causes premature mortality [11].
The range of DTR variations significantly affects the processes of photosynthesis [12], the life cycle of insects [13], and the seasonal dynamics of the microbial population in the soil [14]. Ref. [15] found that the amplitude between night and day temperatures, i.e., the size of the DTR, has a less significant influence on the growth and yield of vegetation than the mean daytime temperature. In the USA, Ref. [16] studied the influence of land use and land cover on DTR variation. The analysis indicated that the DTR observed at meteorological stations was strongly affected by land use and land cover within a radius of 10 km from the station, where observations were observed. The influence of cloud cover, soil moisture, precipitation, and water vapor on DTR was studied by [17,18] using measurements at about 6500 stations worldwide. They found that cloud cover combined with the secondary effect of soil moisture can reduce DTR by 25 to 50% compared to clear weather. Atmospheric water vapor affects night and day temperatures similarly and therefore has little influence on DTR. A cloud system with a low base affects the reduction in DTR the most.
Ref. [19] emphasizes that DTR represents a significant indicator of climate change. By analyzing the variations of DTR in the continental part of the USA during the past 100 years, they found that the trends are of different behavior in each region. Mean annual values of DTR have been steadily decreasing over the last decades, but the intensity of the decrease varies by season. DTR has a statistically significant downward trend during autumn and summer, while the decrease has been small during winter and spring. Ref. [20] examined the change in DTR at many stations across the planet from 1901 to 2000. They confirmed the lowering of the DTR value during the last century. They concluded that such behavior could not be just natural but also related to climate changes caused by anthropogenic influences. They believe that while minimum and maximum temperatures are strongly related to changes in mean global temperatures, DTR can provide additional information to help explain recent climate changes in individual locations.
It is widely accepted that DTR has been decreasing globally during the second half of the 20th century. However, Ref. [21] analyzed this parameter at European stations and came to somewhat different conclusions. They found that the trend of annual DTR values had been reversed from a decrease to an increase. In Western Europe, the trend of growth began in the seventies, while in Eastern Europe, this phenomenon appeared somewhat later, during the eighties of the last century.
Analyzing temperatures and DTR on the Indian subcontinent in 1931–2002, Ref. [22] determined significant increasing trends in both the minimum and maximum temperatures. The existence of trends of an increase and decrease in DTR, which are mostly not statistically significant, was confirmed. Only during the summer in Kashmir was its statistically significant lowering found. They connected the variation in DTR values to the appearance of cloud systems that affected the reduction in DTR in the entire subcontinent during the winter and summer seasons and was especially significant during summer in Kashmir.
Using temperature data measured at 33 stations in the Aral Sea basin, [23] analyzed changes in DTR during the two decades, 1991 to 2000 and 2001 to 2010. They found that the DTR values during the second decade were higher than those during the first decade. They definitively determined that the drying up of the Aral Sea significantly affected the dynamics of the DTR increase in the region. The biggest increases occurred during spring and summer. Ref. [24] analyzed time series trends (1954–1995) of mean minimum, and maximum temperatures and DTR observed at two mountain stations in Croatia: Zavižan (1954 m a.s.l.) and Puntijarka (988 m a.s.l.). An increasing trend was confirmed for all three analyzed parameters.
Increasing cloudiness and precipitation affect the reduction in DTR. Analyses showed that DTR decreased particularly intensively in West Africa in the Sahel region during drought [25]. The trend of lowering DTR in the Sahel area stops with the onset of precipitation and vegetation development. This fact leads to the conclusion that deforestation and natural or anthropogenic vegetation removal, followed by soil drying, significantly affect the change in DTR. Therefore, Ref. [25] believes that better anthropogenic management of the vegetation and soil system in the Sahel area could help mitigate the negative consequences of the increase in DTR.
Ref. [26] analyzed the trends of DTR and ATR in the entire territory of the USA during the period of 1951–2000. Analyses were performed on US Standard Regions for Temperature and Precipitation defined by the NOAA/National Climatic Data Center. Their research suggests that most regions had increasing trends from 1951 to 1980. In 1961–1990, in most regions, both indicators were stable. During 1971–2000 in seven climate regions, a significant trend of decreasing ATRs was determined. The authors cite atmospheric variability and the occurrence of continental polar air masses as possible reasons for the different behavior of ATRs. They believe that warmer winters can affect the production of more atmospheric moisture in some regions, resulting in more cloud cover. ATR values showed significant variations in space and time during the analyzed period (1951–2000), so it was impossible to draw consistent conclusions.
In accordance with the presented insight into the state-of-the-art and providing research and experiences, it is clear that the inclusion of DTR and ATR in climatological time series analysis is well motivated.
This article analyzes the series of annual and monthly DTRs and ATRs calculated based on air temperatures observed at the Zagreb Grič Observatory during 133 years (1887–2019). The results presented here should contribute to a better understanding of this important climate indicator. This is particularly important for Zagreb, where a strong increase in air temperature has been observed during the last decades [27,28]. This paper compares the DTR variations with the simultaneous air temperature and precipitation variations measured at the Zagreb Grič Observatory.
2. Materials and Methods
Analyzed Location and Used Materials
The paper used official climatological data from Zagreb’s Croatian Meteorological and Hydrological Service. A series of minimum, mean, and maximum daily air temperatures and monthly and annual precipitation measured at the Zagreb Grič Observatory (45°48′52″ N; 15°58′19″ E; H = 157 m a.s.l.) (Figure 1) were analyzed for the period from 1 January 1887 to 31 December 2019. These are homogeneous sequences observed in a location whose environment remained unchanged and natural despite the city’s rapid development [29,30,31,32].
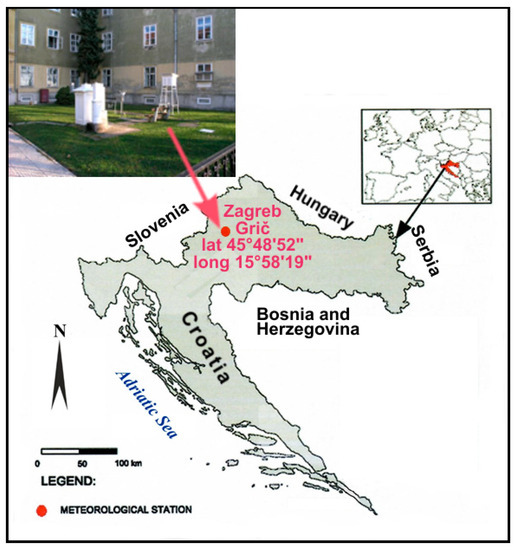
Figure 1.
Study area map.
The results of numerous studies of the behavior of a series of air temperature indices of different lengths and time scales measured at the Zagreb Grič Observatory were published in a series of papers [33,34,35,36,37,38,39,40,41,42,43,44,45,46,47,48].
Long and reliable precipitation series of various time increments, measured at the Zagreb Grič Observatory, enabled numerous and different analyses of the precipitation regime published in a series of papers [49,50,51,52,53,54,55,56].
This paper investigated whether and to what extent the relationship between air temperature and precipitation affected DTR changes during 133 years or 1596 months from 1887 to 2019.
The daily range of the surface air temperature in a day, i, given as DTRi, represents the difference between the maximum, Tmax,i, and the minimum, Tmin,i, daily temperature of each day, i, within the analyzed period:
DTRi = Tmax,i − Tmin,i
The annual (monthly) DTRs are calculated as the mean of daily DTRs during the analyzed period.
The annual range of air temperatures in the year, j, given as ATRj, is the difference between the maximum mean monthly temperature, Tmax,j, and the minimum mean monthly temperature, Tmin,j, of each year, j (Snow and Snow, 2005).
ATRj = Tmax,j − Tmin
The following statistical methods were used to analyze the time series of DTR, ATR, air temperature, and precipitation observed at the Zagreb Grič Observatory: (1) linear regression and correlation; (2) tests (F-test; t-test, Mann–Kendall test); (3) RAPS.
The linear regression method was used to quantitatively express the association (correlation) between the dependent, y, and independent, x, variables. The linear regression equation reads as follows:
y = (a • x) + b
The mathematical procedure for finding the regression line that passes through a, given a set of points, is based on minimizing the sum of the squares of the deviations of the given points from that line, and is called the method of least squares. This method was used to analyze the trend of different series: DTR, ATR, air temperature, T, and precipitation, P, as a dependent variable, and time, t, as an independent variable, in 133 analyzed years. The coefficient, a, represents the slope of the regression line whose dimension is °C/year or mm/year during the analyzed time series. Therefore, it indicates the average rate of increase or decrease in values for the analyzed time series.
The linear regression method was used to analyze the strength of the relationship between the daily range of DTR, as a dependent variable, and precipitation, P, or temperature, T, as an independent variable.
The statistical significance of linear trends in the paper was determined using the non-parametric Mann–Kendall test (M-K test) [57,58] using the pyMannKendall package for Python [59]. The null hypothesis is that no statistically significant monotonic trend exists in the analyzed time series. An alternative hypothesis is that there is a trend. The probability values, p < 0.05, and p < 0.01, were adopted as criteria for accepting the hypothesis of a statistically significant linear trend.
The Rescaled Adjusted Partial Sums (RAPS) method [59,60,61] is used to analyze time series using the summary deviation curve. The graphic display based on the RAPS transformation overcomes the small systematic and random changes, errors, and variability within the analyzed time series, and indicates the existence of several sub-periods with similar characteristics, more trends, sudden jumps or drops in value, irregular fluctuations, the existence of periodicity, etc. The expression for the calculation reads as follows:
where Yav is the average value of the considered time series, which consists of n, members and SY, the standard deviation of the series, while k = 1, 2, …, n, represents the counter during the summation.
RAPSk = Σk ((Yk − Yav)/SY)
The statistical significance of the differences between the average values of two adjacent sub-periods defined by the RAPS method (two adjacent subseries) was determined using the F-test and t-test [62,63]. The F-test was used to examine the equality of variances of two normally distributed populations (two subsets). In contrast, the t-test was used to quantitatively assess whether the average values of two adjacent time subsets are statistically significantly different. In both tests, the probabilities, p < 0.05 and p < 0.01, were chosen as the level for accepting the hypothesis that the average values of the subsets are statistically significantly different.
3. Results and Discussion
3.1. Analysis of Series of Annual Values of Temperature Indices, Precipitation, and DTR
Differences in the behavior of the time series of characteristic annual temperatures (minimum, mean, and maximum) indices, precipitation, and DTR in the period of 1887–2019 are analyzed on a time scale of one year. Table 1 contains the average values of the analyzed annual climatological parameters, the slope of linear regression, a; the linear correlation coefficient, R; and the probabilities defined by the M-K test, p, in 1887–2019.

Table 1.
The average annual values of the time series of Tmin; Tmean; Tmax; P; DTR; the slope of linear equation, a; the coefficient of linear correlation, R; and the results of probability, p, from the M-K test for the whole period of 1887–2019.
Figure 2 shows a series of annual DTRs observed at the Zagreb Grič Observatory from 1887 to2019. A statistically insignificant downward trend is observed. However, the RAPS method indicates three sub-periods in which the values of average neighboring DTRs are statistically significantly different, as shown in Figure 3. There was no trend in the first sub-period from 1887 to 1953. Annual DTR values varied between 6.90 °C (1937) and 8.71 °C (1921), with an average value of 7.94 °C. In the second sub-period, from 1954 to 1989, the average value dropped to 7.37 °C, and the annual values varied between 6.61 °C (1975) and 8.19 °C (1961). A trend of increasing annual DTR values appeared in the recent sub-period, from 1990 to 2019. The average value was 8.01 °C and the annual values ranged between 7.12 (1996) and 8.98 °C (2017).
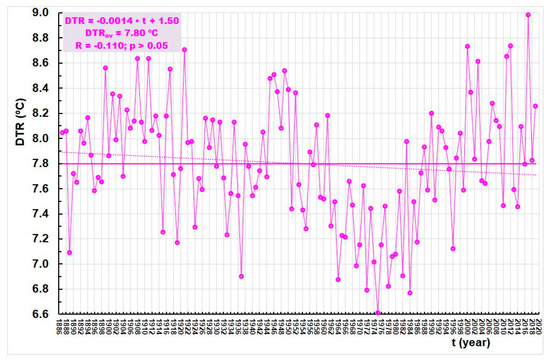
Figure 2.
Annual DTR at Zagreb Grič (1887–2019).
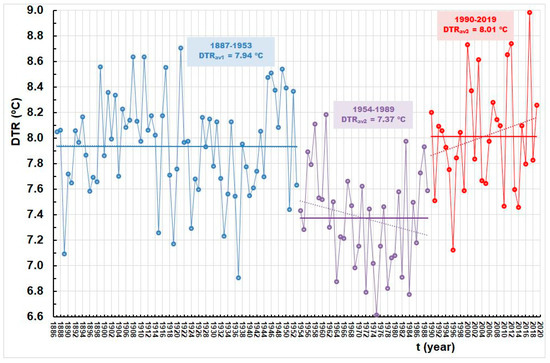
Figure 3.
Annual DTR at Zagreb Grič in three sub-periods: (1) 1887–1953; (2) 1954–1989; and (3) 1990–2019.
Figure 4A–C show the series of minimum annual air temperatures, Tmin, (Figure 4A), mean annual air temperatures, Tav, (Figure 4B), and maximum annual air temperatures, Tmax, (Figure 4C) observed at the Zagreb Grič Observatory during the period of 1887–2019. The figures show regression lines defined by the least squares method. It is observed that there is a statistically significant upward trend in all three temperature indices. It is the largest for the time series of minimum annual temperature (but more significant for the annual average temperature because the correlation coefficient is higher: 0.641 > 0.439).
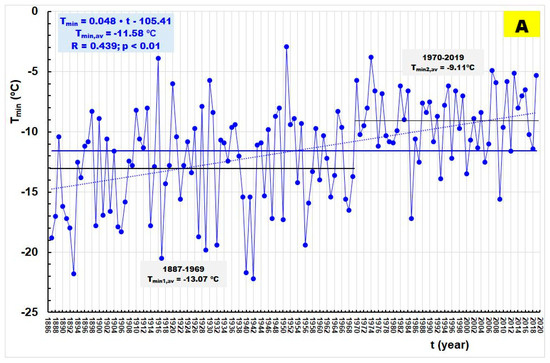
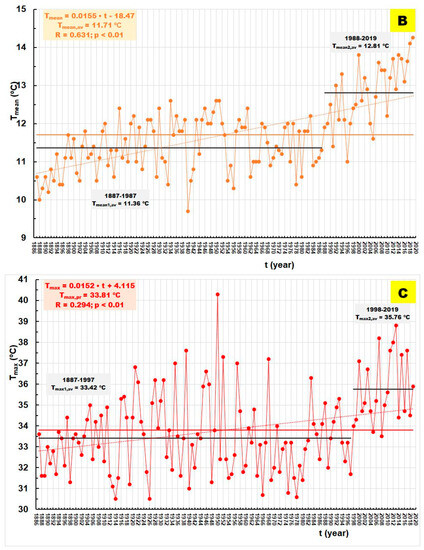
Figure 4.
(A) Annual, Tmin, at Zagreb Grič (1887–2019). (B) Annual, Tav, at Zagreb Grič (1887–2019). (C) Annual, Tmax, at Zagreb Grič (1887–2019).
The RAPS method determines that in each of the analyzed temperature indices, there are two sub-periods whose average values are statistically significantly different. The results of the F-test and t-test can be found in Table 2. It is important to note that sudden jumps appeared first in a series of minimum annual temperatures in 1970. They appeared in a series of mean annual temperatures (in 1988), and at the latest, with a series of maximum annual temperatures (in 1998).

Table 2.
The average values of Tmin, Tmean, Tmax, and DTR for the sub-periods defined by the RAPS method, and the results of the probability, p, of the F-test and t-test between consecutive sub-periods.
Figure 5 shows the annual precipitation series, P, observed at the Zagreb Grič Observatory from 1887 to 2019. There is no trend in this climate parameter.
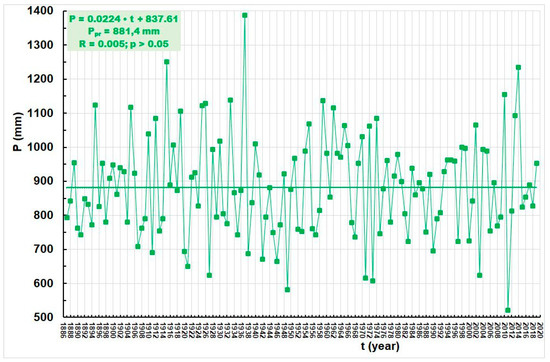
Figure 5.
Annual, P, at Zagreb Grič (1887–2019).
Table 3 shows the values of the linear correlation coefficients, R, between the annual series of DTR and precipitation, P, and mean annual temperatures, T, for the entire period (1887–2019) and three sub-periods (1887–1953; 1954–1989; 1990–2019). It is important to note that the values of the linear correlation coefficients, R, are by far the highest in the recent sub-period for both observed relationships. It should be emphasized that with an increase in annual precipitation, DTR values decrease, while they increase when the mean annual temperature increases.

Table 3.
Coefficients of linear correlation, R, of the time series of the differences between annual values of DTR and rainfall, P, (DTR-P), and DTR, and mean annual temperature, Tmean, (DTR-Tmean), for the whole analyzed period (1887–2019), and three sub-periods defined by RAPS method (1887–1953; 1954–1989; 1990–2019).
3.2. Analysis of Variations of Monthly DTRs
To document and understand the variation of DTR in more depth than allowed by annual values alone, the monthly means of DTR are analyzed in this section”. In shorter time scales, it is possible to establish their different behavior and, in this way, to explain better the factors that influence the development of the analyzed parameter. Therefore, in this section, the variations of DTRs are analyzed monthly.
Table 4 shows the mean monthly minimum (DTRmin), average (DTRav), and maximum (DTRmax) values of DTR in 1887–2019, together with the slope of linear regression (a), the linear correlation (R) and the probability from the M-K test (p) for the DTRav time series. In the period of 1887–2019., i.e., a, r, and P are related to the DTRav time series. The highest values occur during the warm part of the year in July (DTRJul = 10.19 °C) and are 2.22 times higher than in December (DTRDec = 4.58 °C). Statistically insignificant increasing trends are observed in March, April, and May, while the trend in December is statistically significant at the p < 0.05 level. In the remaining eight months, there are decreasing trends that are mostly statistically insignificant, except in the case of August and September, when they are significant at the p < 0.01 level.

Table 4.
The average values of the time series of monthly minimum, DTRmin, mean, DTRav, and maximum, DTRmax, slope of linear equation, a, coefficient of linear correlation, R, and the results of probability, p, of the M-K test, for the whole period of 1887–2019.
Table 5 shows the values of average monthly values of air temperatures, Tav, precipitation, Pav, linear correlation coefficient, R, probability, p, defined by the M-K test, for the series of mean monthly air temperatures, Tav, and monthly precipitation, P, in the period of 1887–2019. In the series of average monthly air temperatures, during the period of 1887–2019, in all months except September, there are no statistically significant trends at <0.01 level. In the monthly precipitation series, P, no statistically significant trends of either increase or decrease in any month during the analyzed period of 1887–2019.

Table 5.
The average values of mean monthly air temperature (Tav) and monthly precipitation (Pav), the corresponding coefficients of linear correlation (R) and the probability results from the M-K test (p) for the whole period of 1887–2019.
The behavior of the time series of monthly DTRs in the three sub-periods (1887–1953; 1954–1898; 1990–2019) defined by the RAPS method (see Figure 3) will be further analyzed. Table 6 gives the monthly averages of DTRav in these three sub-periods and the p-values for the inter-period differences in variance (from the F-test) and mean (from the t-test). In none of the analyzed cases did the F-test show that the variances in the adjacent sub-periods are statistically significantly different. The t-test showed that the average values of neighboring DTRs differed significantly during the seven months from February to August. They differ statistically insignificantly in January and December. The DTR in the second sub-period of 1954–1989 was in nearly all months smaller than in the other two periods. DTR was the largest in 1990–2019 in the eight months from November to June, whereas the largest values from July to October were observed in 1887–1953”. The average monthly values of DTRav in the three sub-periods can be visually compared in Figure 6.

Table 6.
The average values of DTRav for the sub-periods are defined by the RAPS method, and the results of the probability, p, of the F-test and t-test between the consecutive sub-periods.
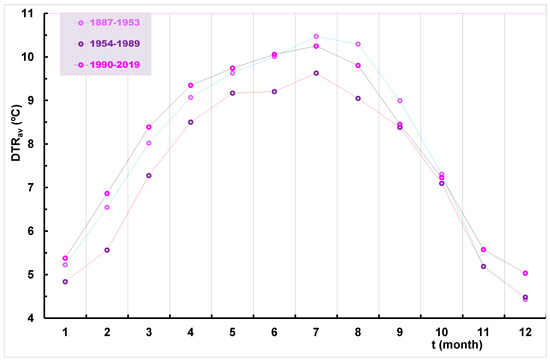
Figure 6.
Average monthly DTR at Zagreb Grič in three sub-periods: (1) 1887–1953; (2) 1954–1989; (3) 1990–2019.
When the behavior of DTRs is analyzed on a monthly scale, it is observed that the variations vary during the year. They are the lowest in the second sub-period, while in the first and third sub-periods, they are relatively similar, although a difference is observed during each month of the year. In the eight months from November to June, the values are higher in the recent third sub-period, while the situation is reversed from July to October.
Table 7 gives the monthly averages of the mean temperature in the earlier defined three sub-periods and the p-values for the inter-period differences in variance (from the F-test) and mean (from the t-test). None of the cases analyzed by the F-test showed statistically significant differences in the variances in adjacent sub-periods. The t-test reveals no significant differences in the mean values between 1887–1953 and 1954–1989, whereas there is significant warming in all months from 1954–1989 to 1990–2019. Figure 7 visually confirms the warmth of the 1990–2019 period compared with 1954–1989 and 1887–1953. It can be seen that the third, i.e., the recent period is the warmest, which can be explained both by the effect of global warming and the effect of the urban heat island.

Table 7.
The average values of the mean monthly air temperatures, Tav, for the sub-periods defined by the RAPS method, and the results of the probability, p, of the F-test and t-test between the consecutive sub-periods.
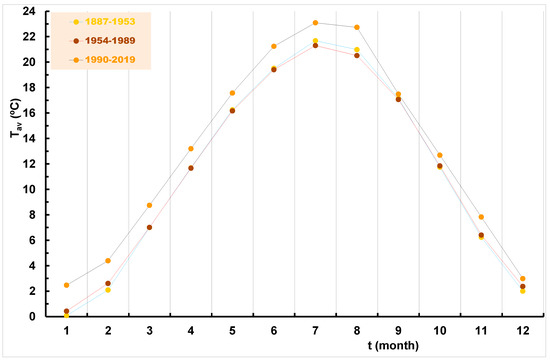
Figure 7.
Average monthly, Tav, at Zagreb Grič in three sub-periods: (1) 1887–1953; (2) 1954–1989; and (3) 1990–2019.
Table 8 gives the averages of monthly precipitation in the three sub-periods together with the p-values for the inter-period differences in variance (from the F-test) and mean (from the t-test). The F-test only showed a statistically significant difference in variance in two cases: in June, a significant decrease in variance from 1954–1989 to 1990–2019, and in September, a significant increase from 1954–1989 to 1990–2019. The t-test also shows only two cases in which the average precipitation differs significantly between two adjacent periods: an increase from 1954–1989 to 1990–2019 in September, and a decrease from 1887–1953 to 1954–1989 in October. The mean values of monthly precipitation in the three sub-periods are graphically displayed in Figure 8.

Table 8.
The average values of monthly rainfall, Pav, for the sub-periods defined by the RAPS method, and the results of the probability, p, of the F-test and t-test between the consecutive sub-periods.
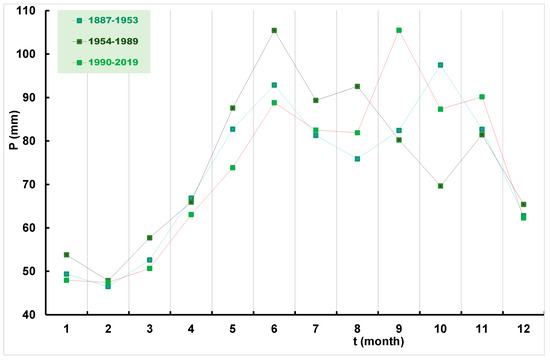
Figure 8.
Average monthly, P, at Zagreb Grič in three sub-periods: (1) 1887–1953; (2) 1954–1989; and (3) 1990–2019.
Table 9 gives the linear correlation coefficients of monthly mean DTR with both precipitation P and the mean temperature Tav for the entire period (1887–2019). In each month of the year, the relationship between DTRs and precipitation, P, is inversely proportional, unlike the relationship between DTRs and average monthly air temperatures, in which DTR values and temperature increase simultaneously. The absolute values of the linear correlation coefficients, R, behave similarly. They are highest in the warm part of the year and lowest in the cold, especially from November to January.

Table 9.
Values of the linear correlation coefficient, R, for the time series of differences, DTR-P, and DTR-Tmean, for the whole period of 1887–2019.
Table 10 shows the linear correlation coefficients of monthly DTR with monthly precipitation (P) and monthly mean temperature (Tmean), in three sub-periods: 1887–1953; 1954–1989; 1990–2019. In each month of the year and the three analyzed sub-periods, the relationship between DTRs and precipitation is inversely proportional, unlike the relationship between DTRs and mean monthly air temperatures, where DTR and the mean temperature are positively correlated in all months but February. The values of the linear correlation coefficients, R, between DTR and precipitation are the highest in the first sub-period and the lowest in the second. The values of the linear correlation coefficients, R, between DTR and mean monthly air temperatures are the highest in the third sub-period and the lowest in the first.

Table 10.
The linear correlation (R) between DTR and precipitation (DTR-P) and between DTR and mean temperature (DTR-Tmean) in the three sub-periods (1887–1953; 1954–1989; 1990–2019), defined by the RAPS method.
Figure 9 shows graphically three series of differences, Δ = Tav − DTRav, between average monthly air temperatures, Tav, and average, DTRav, defined in three sub-periods. It is important to note that the differences, Δ, increase over time in each month of the year. They are the lowest in the first sub-period and the highest in the third. Average air temperatures, Tav, are lower than DTRav, in January, February, and December. In March, the average air temperatures, Tav, are lower than DTRav, in the first (1887–1953) and second (1954–1989) sub-periods. The situation changes in the third (1990–2019) sub-period, so the average air temperature, Tav, becomes slightly higher than DTRav.
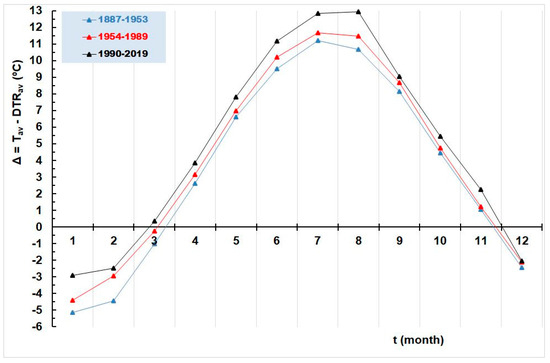
Figure 9.
Average monthly, Δ = Tav − DTR, at Zagreb Grič in three sub-periods: (1) 1887–1953; (2) 1954–1989; and (3) 1990–2019.
3.3. Analysis of Variations of Daily DTRs
Figure 10 shows a series of daily minimum, DTRmin, average, DTRav, maximum, DTRmax, and average daily air temperatures, Tav, from 1 January 1887 to 31 December 2018. The dates when minimum and maximum average DTR and mean air temperature, Tav, appear are noted. The average value of the mean air temperature, Tav, is observed to be lower than that of DTR from 25 November to 21 March, which is 118 days a year. When the average values of daily DTRs are compared with the average values of mean air temperatures, Tav, as shown in Figure 11, it is possible to better observe and understand the interaction between these two climate indices during the days of the year.
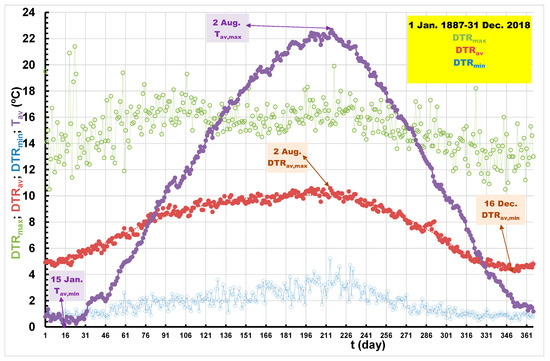
Figure 10.
Average daily, DTRmin, DTRmean, DTRmax, and Tav, based on data from 1 January 1887 to 31 December 2018.
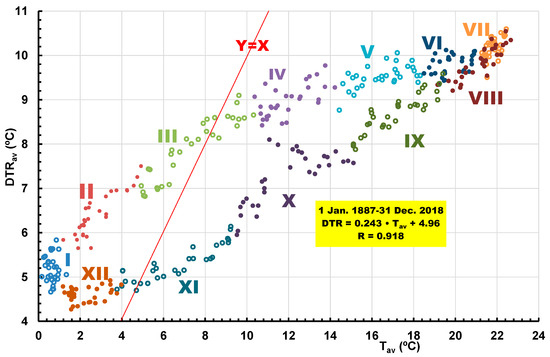
Figure 11.
The relationship between daily, DTRav, and Tav, based on data from 1 January 1887 to 31 December 2018.
While the climate indices analyzed in Figure 10 and Figure 11 are presented in chronological order, Figure 12 shows three duration curves calculated for three different sub-periods defined by the RAPS method. In the second sub-period (1954–1989), the values of DTRs are much lower than in the other two sub-periods. It should be pointed out that in the third sub-period (1990–2019), when DTR < 7.7 °C, DTRs are higher than in the first sub-period (1887–1953). For DTR > 7.7 °C, the duration curves for the first and third sub-periods mostly match. The conclusion is that in the recent period, the value of DTRs increased during the colder period of the year.
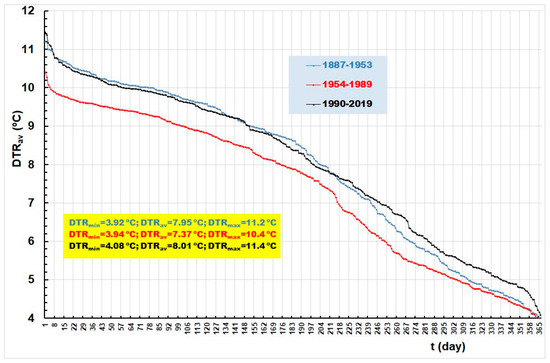
Figure 12.
Duration curves of average daily, DTRav, in three sub-periods: (1) 1887–1953; (2) 1954–1989; and (3) 1990–2019.
Figure 13 graphically shows a three-time series of average daily values of differences, Δ, among concurrent average mean daily air temperatures, Tav, and DTRav, in three sub-periods: 1887–1953; 1954–1989; 1990–2019. Figure 14 shows the duration curves for the three-time sub-series shown in Figure 13. It is clear that the differences, Δ, are by far the largest in the recent sub-period. It is important to note that they are higher in the second sub-period (1953–1989) than in the first (1887–1953).
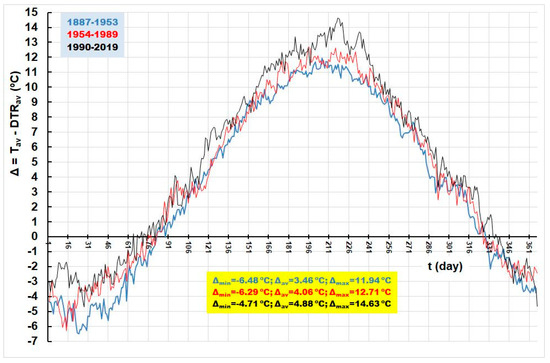
Figure 13.
Average daily, Δ = Tav − DTR, based on data from 1 January 1887 to 31 December 2018.
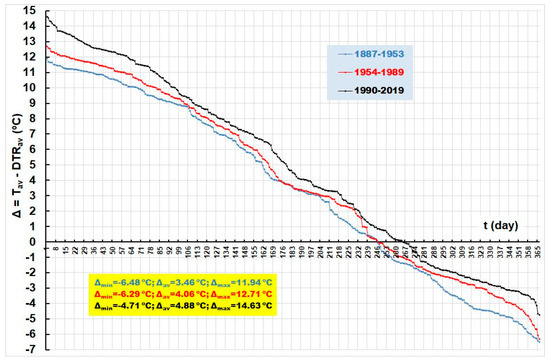
Figure 14.
Duration curves of average daily, Δ = Tav − DTR, in three sub-periods: (1) 1887–1953; (2) 1954–1989; and (3) 1990–2019.
It is a definite conclusion that with the increase in air temperature, the values of DTRs also increase, as well as the difference, Δ, between air temperatures and DTRs.
3.4. Analysis of Variations of Annual ATRs
Figure 15 shows the time series of ATRs from 1887 to 2019. The values range between the minimum, ATR = 17.0 °C (2014), and the maximum, ATR = 29.5 °C (1929). The average value in the 133-year-long period is ATRav = 23.29 °C. The downward trend is not statistically significant.
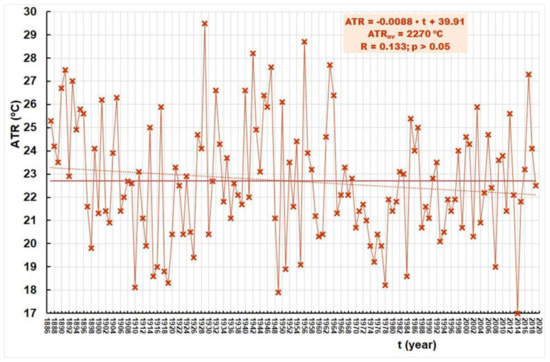
Figure 15.
Annual ATR at Zagreb Grič (1887–2019).
The RAPS method defines the following sub-periods within the analyzed sequence of 133 years: 1887–1905; 1906–1926; 1927–1964; and 1965–2019. Figure 16 shows these four subseries, and the average values of each of them are plotted. In Table 11, the average monthly values, ATRav, for the four sub-periods are shown together with the probabilities at which the inter-sub-period differences between the mean values (based on the t-test) and the variances (based on the F-test) would arise by chance. Based on the previous analysis and available sources, we could not establish any regularity or pattern in the behavior of ATRs and their connection with global warming processes and the influence of the urban heat island.
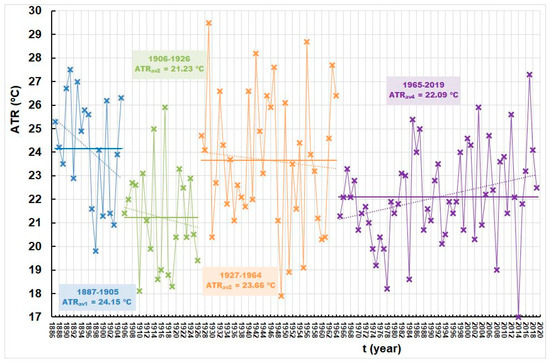
Figure 16.
Annual ATR at Zagreb Grič in four sub-periods: (1) 1887–1905; (2) 1906–1926; (3) 1927–1964; and (4) 1965–2019.

Table 11.
The average values of ATRav for the sub-periods defined by the RAPS method, and the results of the probability, p, of the F-test and t-test between four consecutive sub-periods (1887–1905; 1906–1926; 1927–1964; 1965–2019).
Minimum mean monthly temperatures during the year in the analyzed period of 133 years (1887–2019) occurred in November (1 time or 0.8%), December (32 times or 24.1%), January (78 times or 58.6%), and February (22 times or 16.5%). Maximum average monthly temperatures occurred in June (4 times or 3.0%), July (88 times or 66.2%), and August (41 times or 30.8%).
4. Conclusions
The process of climate change, which manifests itself most obviously as global warming, is present on the entire planet. One should accept that it manifests differently in various regions, locations, and time scales when studying it. The reasons for this are numerous and are found in the complexity of interactive natural and human-managed processes. Climate change processes are very complex, and one could say that they are still not sufficiently explained. Internal climate variability is a consequence of internal natural processes. Simultaneously with internal processes, the climate is also affected by external factors caused by anthropogenic intervention. It is sometimes difficult to precisely separate the interior from external factors and assess how and to what extent they affect climate change at different locations. That is why various methods are used to better explain this important issue. In the last thirty years, DTR and ATR methods, as relatively new, have been applied.
Ref. [5] concludes, “The global decrease in DTR is attributed to an anthropogenic signal, primarily driven by greenhouse gas forcing. Aerosol forcing had a detectable positive (negative) impact on the DTR in Europe (East Asia)”. They stress that it remains unclear whether humans have a detectable influence on the DTR and to what extent anthropogenic greenhouse gases may be driving such changes.
At the Zagreb Grič Observatory, a downward trend in DTR and ATR was confirmed during the analyzed period of 133 years (1887–2019) (Figure 2 and Figure 15). However, the analysis of DTRs using the RAPS method indicated that they behave differently in three sub-periods (Figure 3): 1887–1953, 1954–1989, and 1990–2019. This behavior of DTRs at the Zagreb Grič Observatory agrees with the conclusions presented in the work of Makowski et al. (2008). ATR values for 133 years behaved differently in four sub-periods (Figure 16): 1887–1905; 1906–1926; 1927–1964; 1965–2019. An attempt was made to determine the reasons for this behavior of the analyzed indicators by analyzing the relationship between annual and monthly DTRs and mean yearly and monthly air temperatures and precipitation. However, no firm conclusions can be drawn. The fact is that numerous factors, such as cloud cover, fog, urban heat island effect, aerosol concentration, water vapor, greenhouse gas emissions, land use change, vegetation cover, changes in atmospheric circulation properties, snow melting, intensity and amount of precipitation, etc., significantly affect the variability of DTR and ATR. Unfortunately, there are no continuous measurements of any of these indicators, and it is impossible to make reliable conclusions about why variations appeared between different sub-periods.
The analyses performed in this paper indicated the necessity of a much subtler study of all climate indicators, especially DTR in urban areas, considering its significant impact on the environment and human health. The analysis of ATRs and DTRs represents an emerging approach to explaining the causes and consequences of global warming. Creating a system of continuous monitoring of numerous parameters will be necessary to make reliable conclusions, some factors are natural while others are anthropogenic, and the latter appear to be becoming more and more numerous and influential. The example of varying DTRs and ATRs discussed here indicates the complexity and importance of the issue. Intensive and creative interdisciplinary cooperation between multiple scientific disciplines (e.g., climatology and meteorology, hydrology, ecology, etc.) will help to better explain climate change and its impact on processes in different types of environments and to mitigate the negative consequences of climate change.
Author Contributions
Conceptualization, O.B.; methodology, O.B.; software, B.Ð.; validation, O.B.; formal analysis, B.Ð.; investigation, O.B.; resources, B.Ð.; data curation, B.Ð.; writing—original draft preparation, O.B.; writing—review and editing, B.Ð.; visualization, O.B.; supervision, B.Ð.; project administration, B.Ð.; funding acquisition, O.B. All authors have read and agreed to the published version of the manuscript.
Funding
This research is partially supported by the project KK.01.1.1.02.0027, a project co-financed by the Croatian Government and the European Union via the European Regional Development Fund—the Competitiveness and Cohesion Operational Programme.
Institutional Review Board Statement
Not applicable.
Informed Consent Statement
Not applicable.
Data Availability Statement
All data is available upon reasonable request to the author.
Conflicts of Interest
The authors declare no conflict of interest.
References
- IPCC. Climate Change 2007. Synthesis Report. Contribution of Working Groups I, II and III to the Fourth Assessment Report of the Intergovernmental Panel on Climate Change; IPPC: Genève, Suisse, 2007; Available online: https://www.ipcc.ch/site/assets/uploads/2018/02/ar4_syr_full_report.pdf (accessed on 20 June 2022).
- Briga, M.; Verhulst, S. Large diurnal temperature range increases bird sensitivity to climate change. Sci. Rep. 2015, 5, 16600. [Google Scholar] [CrossRef]
- Pörtner, H.O.; Gutt, J. Impacts of climate variability and change on (marine) animals: Physiological underpinnings and evolutionary consequences. Integr. Comp. Biol. 2016, 56, 31–44. [Google Scholar] [CrossRef] [PubMed]
- IPCC. Climate Change 2014: Synthesis Report. Contribution of Working Groups I, II and III to the Fifth Assessment Report of the Intergovernmental Panel on Climate Change; IPCC: Genève, Suisse, 2014; Available online: https://www.ipcc.ch/report/ar5/syr/ (accessed on 20 June 2022).
- Liu, J.; Feng, X.; Gu, X.; Zhang, J.; Slater, L.J.; Kong, D. Detection and attribution of human influence on the global diurnal temperature range decline. Geophys. Res. Lett. 2022, 49, e2021GL097155. [Google Scholar] [CrossRef]
- Lee, M.; Shi, L.; Zanobetti, A.; Schwartz, J.D. Study on the association between ambient temperature and mortality using spatially resolved exposure data. Environ. Res. 2016, 151, 610–617. [Google Scholar] [CrossRef] [PubMed]
- Song, X.; Wang, S.; Hu, Y.; Yue, M.; Zhang, T.; Liu, Y.; Tian, J.; Shang, K. Impact of ambient temperature on morbidity and mortality: An overview of reviews. Sci. Total Environ. 2017, 586, 241–254. [Google Scholar] [CrossRef]
- Zaninović, K. Limits of warm and cold bioclimatic stress in different climatic regions. Theor. Appl. Clim. 1992, 45, 65–70. [Google Scholar] [CrossRef]
- Zaninović, K.; Matzarakis, A. Impact of heat waves on mortality in Croatia. Int. J. Biometeorol. 2013, 58, 1135–1145. [Google Scholar] [CrossRef] [PubMed]
- Zhang, Y.; Yu, C.; Yang, J.; Zhang, L.; Cui, F. Diurnal temperature range in relation to daily mortality and years of life lost in Wuhan, China. Int. J. Environ. Res. Public Health 2017, 14, 891. [Google Scholar] [CrossRef]
- Wang, Z.; Zhou, Y.; Luo, M.; Yang, H.; Xiao, S.; Huang, X.; Ou, Y.; Zhang, Y.; Duan, X.; Hu, W.; et al. Association of diurnal temperature range with daily hospitalization for exacerbation of chronic respiratory diseases in 21 cities, China. Respir. Res. 2020, 21, 251. [Google Scholar] [CrossRef]
- Mohotti, A.J.; Lawlov, D.W. Diurnal variation of photosynthesis and photoinhibition in tea: Effects of irradiance and nitrogen supply during growth in the field. J. Exp. Bot. 2002, 53, 313–322. [Google Scholar] [CrossRef]
- Chen, S.; Fleischer, S.J.; Saunders, M.C.; Thomas, M.B. The influence of diurnal temperature variation on degree-day accumulation and insect life history. PLoS ONE 2015, 10, e0120772. [Google Scholar] [CrossRef]
- Hu, A.; Nie, Y.; Yu, G.; Han, C.; He, J.; He, N.; Liu, S.; Deng, J.; Shen, W.; Zhang, G. Diurnal temperature variation and plants drive latitudinal patterns in seasonal dynamics of soil microbial community. Front. Microbiol. 2019, 10, 674. [Google Scholar] [CrossRef]
- Bakker, J.C.; Uffelen, J.A.M. The effects of diurnal temperature regimes on growth and yield of glasshouse sweet pepper. Neth. J. Agric. Sci. 1988, 36, 201–208. [Google Scholar] [CrossRef]
- Gallo, K.P.; Easterling, D.R.; Peterson, T.C. The influence of land use/land cover on climatological values of the diurnal temperature range. J. Clim. 1996, 9, 2941–2944. [Google Scholar] [CrossRef]
- Dai, A.; DelGenio, A.D.; Fung, I.Y. Clouds, precipitation, and temperature range. Nature 1997, 386, 665–666. [Google Scholar] [CrossRef]
- Dai, A.; Trenberth, K.E.; Karl, T.R. Effects of clouds, soil moisture, precipitation, and water vapor on Diurnal Temperature Range. J. Clim. 1999, 12, 2451–2473. [Google Scholar] [CrossRef]
- Qu, M.; Wan, J.; Hao, X. Analysis of diurnal air temperature range change in the continental United States. Weather Clim. Extrem. 2014, 4, 86–95. [Google Scholar] [CrossRef]
- Braganza, K.; Karoly, D.J.; Arblaster, J.M. Diurnal temperature range as an index of global climate change during the twentieth century. Geophys. Res. Lett. 2004, 31, L13217. [Google Scholar] [CrossRef]
- Makowski, K.; Wild, M.; Ohmura, A. Diurnal temperature range over Europe between 1950 and 2005. Atmospheric Chemistry and. Physics 2008, 8, 6483–6498. [Google Scholar] [CrossRef]
- Roy, S.S.; Balling, R.C. Analysis of trends in maximum and minimum temperature, diurnal temperature range, and cloud cover over India. Geophys. Res. Lett. 2005, 32, L12702. [Google Scholar] [CrossRef]
- Roget, E.; Khan, V.M. Decadal differences of the diurnal temperature range in the Aral Sea region at the turn of the century. Tellus A Dyn. Meteorol. Oceanogr. 2018, 70, 1513290. [Google Scholar] [CrossRef]
- Gajić-Čapka, M.; Zaninović, K. Changes in temperature extremes and their possible causes at the SE boundary of the Alps. Theor. Appl. Climat. 1997, 57, 89–94. [Google Scholar] [CrossRef]
- Zhou, L.; Dickinson, R.E.; Tian, Y.; Vose, R.S.; Dai, Y. Impact of vegetation removal and soil aridation on diurnal temperature range in a semiarid region: Application to the Sahel. Proc. Natl. Acad. Sci. USA 2007, 104, 17937–17942. [Google Scholar] [CrossRef] [PubMed]
- Snow, R.K.; Snow, M.M. Annual temperature range time-series trends and long-range forecasting. Natl. Weather Dig. 2005, 29, 3–12. [Google Scholar]
- Bonacci, O.; Bonacci, D.; Roje-Bonacci, T. Different air temperature changes in continental and Mediterranean regions: A case study from two Croatian stations. Theor. Appl. Climat. 2021, 145, 1333–1346. [Google Scholar] [CrossRef]
- Nimac, I.; Herceg-Bulić, I.; Cindrić-Kalin, K.; Perčec-Tadić, M. Changes in extreme air temperatures in the mid-sized European city situated on southern base of a mountain (Zagreb, Croatia). Theor. Appl. Climat. 2021, 146, 429–441. [Google Scholar] [CrossRef]
- Likso, T. Inhomogeneities in temperature time series in Croatia. Hrvat. Meteorološki Časopis 2003, 38, 3–9. [Google Scholar]
- Pandžić, K.; Likso, T. Homogeneity of average annual air temperature time series for Croatia. Int. J. Climat. 2010, 30, 1215–1225. [Google Scholar] [CrossRef]
- Penzar, I.; Juras, J.; Marki, A. Long-term meteorological measurements at Zagreb: 1862–1990. Geofizika 1990, 9, 1–171. [Google Scholar]
- Rasol, D.; Likso, T.; Milković, J. Homogenisation of temperature time series in Croatia. In Proceedings of the Sixth Seminar for Homogenization and Quality Control in Climatological Databases, Hungary, Budapest, 26–30 May 2008; pp. 85–93. [Google Scholar]
- Bonacci, O. What is above average air temperature!? Theor. Appl. Climat. 2022, 150, 85–101. [Google Scholar] [CrossRef]
- Bonacci, O.; Andrić, I.; Roje-Bonacci, T. Increasing trends of air temperature in urban area: A case study from four stations in Zagreb City area. Vodoprivreda 2018, 50, 203–214. [Google Scholar]
- Bonacci, O.; Roje-Bonacci, T.; Vrsalović, A. The day-to-day temperature variability method as a tool for urban heat island analysis: A case of Zagreb-Grič Observatory (1887–2018). Urban Clim. 2022, 45, 101281. [Google Scholar] [CrossRef]
- Bonacci, O.; Roje-Bonacci, T. Analyses of the Zagreb Grič Observatory air temperatures indices for the period 1881 to 2017. Acta Hydrotech. 2018, 31, 67–85. [Google Scholar] [CrossRef]
- Bonacci, O.; Roje-Bonacci, T. Primjena metode dan za danom varijabilnosti temperature zraka na podatcima opaženim na opservatoriju Zagreb-Grič (1887–2018). Hrvat. Vode 2020, 28, 125–134. [Google Scholar]
- Cvitan, L.; Sokol Jurković, R. Secular trends in monthly heating and cooling demands in Croatia. Theor. Appl. Climat. 2016, 125, 565–581. [Google Scholar] [CrossRef]
- Juras, J. Neke karakteristike promjene klime Zagreba u posljednja tri desetljeća. Geofizika 1985, 2, 93–102. [Google Scholar]
- Makjanić, B.; Penzar, B.; Penzar, I. Prilog poznavanju klime grada Zagreba, I; Radovi Geofizički Zavod: Zagreb, Croatia, 1977; Volume III, pp. 1–45. [Google Scholar]
- Nimac, I.; Perčec Tadić, M. Complete and homogeneous monthly air temperature series for the construction of 1981–2010 climatological normals in Croatia. Geofizika 2017, 34, 225–249. [Google Scholar] [CrossRef]
- Nitis, T.; Bencetić Klaić, Z.; Moussiopoulos, N. Effects of topography on the Urban Heat Island. In Proceedings of the 10th International Conference on Harmonisation within Atmospheric Dispersion Modelling for Regulatory Purposes, Sissi, Greece, 17–20 October 2005; pp. 1–5. [Google Scholar]
- Penzar, B.; Penzar, I.; Juras, J.; Marki, A. Brief review of climatic fluctuations recorded in Zagreb between 1862 and 1990. Geofizika 1992, 9, 57–67. [Google Scholar]
- Radić, V.; Pasarić, N.; Šinik, N. Analiza zagrebačkih klimatoloških nizova pomoću empirijski određenih prirodnih sastavnih funkcija. Geofizika 2004, 21, 15–36. [Google Scholar]
- Šegota, T. Srednja temperatura zraka u Zagrebu. Hrvat. Geogr. Glas. 1986, 48, 13–25. [Google Scholar]
- Šegota, T. Maksimalne temperature zraka u Zagrebu. Radovi 1987, 22, 5–18. [Google Scholar]
- Šegota, T. Minimalne temperature zraka u Zagrebu. Hrvat. Geogr. Glas. 1988, 50, 7–21. [Google Scholar]
- Šinik, N. Signifikantnost recentnih klimatskih fluktuacija u Zagrebu. Geofizika 1985, 2, 81–91. [Google Scholar]
- Bonacci, O.; Andrić, I.; Vrsalović, A.; Bonacci, D. Precipitation regime changes at four Croatian meteorological stations. Atmosphere 2021, 12, 885. [Google Scholar] [CrossRef]
- Bonacci, O.; Matešan, D. Analysis of precipitation appearance in time. Hydrol. Proc. 1999, 13, 1683–1690. [Google Scholar] [CrossRef]
- Bonacci, O.; Roje-Bonacci, T. Analiza dnevnih, mjesečnih i godišnjih oborina Zagreb Griča (1862–2017) za potrebe inženjerske hidrologije. Hrvat. Vode 2019, 27, 7–20. [Google Scholar]
- Cindrić, K. Statistical analysis of wet and dry spells in Croatia by the binary DARMA (1,1) model. Hrvat. Meteorološki Časopis 2006, 41, 43–51. [Google Scholar]
- Gajić-Čapka, M. Varijabilnost prosječnog oborinskog režima šire zagrebačke regije. Rasprave 1982, 17, 23–40. [Google Scholar]
- Gajić-Čapka, M. Stationarity, trend and periodicity of precipitation at the Zagreb-Grič Observatory from 1862 to 1990. Hrvat. Meteorološki Časopis 1992, 27, 68291. [Google Scholar]
- Gajić-Čapka, M.; Čapka, B. Analiza ljetnih oborina na području grada Zagreba. Hrvat. Meteorološki Časopis 1985, 20, 31–40. [Google Scholar]
- Pandžić, K.; Likso, T.; Curić, O.; Mesić, M.; Pejić, I.; Pasarić, Z. Drought indices for the Zagreb-Grič Observatory with an overview of drought damage in agriculture in Croatia. Theor. Appl. Climat. 2020, 142, 555–567. [Google Scholar] [CrossRef]
- Mann, H.B. Non-parametric test of randomness against trend. Econometrica 1945, 13, 245–259. [Google Scholar] [CrossRef]
- Kendall, M.G. Rank Correlation Methods, 4th ed.; Charles Griffin: London, UK, 1975. [Google Scholar]
- Husain Shourov, M.M.; Mahmud, I. pyMannKendall: A python package for nonparametric Mann Kendall family of trend tests. J. Open Source Softw. 2019, 4, 1556. [Google Scholar] [CrossRef]
- Garbrecht, J.; Fernandez, G.P. Visualization of trends and fluctuations in climatic records. Water Resour. Bull. 1994, 30, 297–306. [Google Scholar] [CrossRef]
- Đurin, B.; Ptiček Siročić, A.; Muhar, A. Analiza povezanosti pokazatelja kakvoće otpadne vode s temperaturom i oborinama pomoću RAPS metode. Hrvat. Vode 2017, 25, 247–252. [Google Scholar]
- Pavlić, I. Matematička Statistika (Primjena u Proizvodnji); Privreda: Zagreb, Croatia, 1962. [Google Scholar]
- McGhee, J.W. Introductory Statistics; West Publishing Company: New York, NY, USA, 1985. [Google Scholar]
Disclaimer/Publisher’s Note: The statements, opinions and data contained in all publications are solely those of the individual author(s) and contributor(s) and not of MDPI and/or the editor(s). MDPI and/or the editor(s) disclaim responsibility for any injury to people or property resulting from any ideas, methods, instructions or products referred to in the content. |
© 2023 by the authors. Licensee MDPI, Basel, Switzerland. This article is an open access article distributed under the terms and conditions of the Creative Commons Attribution (CC BY) license (https://creativecommons.org/licenses/by/4.0/).