Abstract
The serious and frequent typhoon activities can easily cause extreme precipitation weather in the eastern coastal area of China, which is affected by land and sea differences. To explore the temporal and spatial characteristics of Precipitable Water Vapor (PWV) and rainfall during the typhoon period, the data of the conspicuous case named ‘Meihua’ in 2022 is adopted in analysis. In this paper, firstly, the accuracy of the PWV retrieved by ERA5 was evaluated, which met the experimental analysis requirements, compared with the conference value of the Radiosonde (RS). Secondly, the correlation between PWV, rainfall and the typhoon path were analyzed qualitatively and quantitatively, using 16 meteorological stations in the typhoon path. The results indicated that PWV reached its peak value 2–6 h than rainfall, which was an important reference for rainfall forecasting. Then, the ‘Pearson correlation coefficient’ method was used for the quantitative evaluation of the correlation between PWV and the distance of the ‘weather station-typhoon’. The results showed that PWV had an obvious upward trend, with a decrease in the distance between the ‘weather station-typhoon’. The variation in PWV is intense at a reduced distance, and can reach its peak 16 h before the arrival of the typhoon. A strong negative correlation was demonstrated, with an average value of −0.73 for the Pearson correlation coefficient. Analyzing the temporal and spatial changes of the typhoon track, PWV and rainfall, the results show that before the typhoon passes through the region, both the PWV and rainfall certainly reach their maximum. The variation trends of PWV and rainfall in the period of the typhoon are significantly consistent. The center of PWV and rainfall is mainly located on the northwest side of the typhoon center, which showed obvious asymmetry.
1. Introduction
The troposphere is the atmosphere most closely related to human life, and is an important part of global space. Water vapor is one of the most active greenhouse gases in the troposphere, and its changes directly affect surface temperature, humidity and surface rainfall. Typhoons cause long-term rainstorms, which seriously affect people’s lives and easily cause disasters, such as floods and mudslides. Therefore, it is very important to explore the changing relationships between typhoons and PWV, rainfall and extreme meteorological disasters.
The traditional methods of water-vapor observation mainly include radiosondes, microwave radiometers, satellite remote sensing, and so on. These methods have a high accuracy in the detection of water vapor; however, these methods have some negative issues, such as a low time resolution, a sparse distribution of stations, a high cost, they cannot satisfy small- and medium-scale meteorological research, their detection accuracy is easily affected by weather conditions, and so on [1,2,3].
With the sustained development of GNSS technology, the method of atmospheric water-vapor monitoring based on GNSS has been widely used. GNSS water-vapor-detection technology has the characteristics of a high resolution, low cost, continuous operation and high precision. The inverted PWV by GNSS is also used for analyzing the PWV’s correlation with rainfall to predict extreme weather and improve the temporal–spatial resolution of PWV inverted using the radiosonde measurements [4,5,6,7]. He et al. investigated the usability of real-time PWV retrieved from GNSS for the characterization typhoons by analyzing the correlation between PWV and atmospheric parameters, including pressure, temperature, precipitation, wind speed, and so on [8]. However, due to the uneven distribution of GNSS weather stations, it is difficult to obtain sufficient GNSS PWV data in areas where GNSS weather stations are scarce, which limits the applications of GNSS technology to invert PWV in climate research [5].
Compared with traditional PWV monitoring methods and GNSS technology, PWV calculated using Numerical Weather Prediction (NWP) data has the advantage of high temporal and spatial resolution. The main institutions providing NWP data are the European Centre for Medium-Range Weather Forecasts (ECMWF), National Centers for Environmental Prediction (NCEP) and China Meteorological Administration (CMA). Among them, ECMWF provides the latest global atmospheric numerical forecast reanalysis data and forecast data for users, which is adopted in a lot of research by many institutions and scholars at home and abroad. Using RMSE, ME and other indicators, researchers evaluated the PWV estimation value inverted by the latest generation of MERRA-2 and ERA5 NWP data [9,10,11], and finally found that the PWV estimation value inverted by ERA5 is more accurate.
In recent years, many researchers have analyzed the temporal and spatial distribution and variation characteristics of atmospheric precipitable water. The ERA5 data are used to study and analyze the water-vapor balance in the Yangtze-Huai-Hai region [12]. The reanalysis data of rainfall from meteorological stations in Shandong Province have been used to analyze the atmospheric rainfall in the whole layer of Shandong in summer [13]. Now, PWV is usually analyzed in connection with typhoon and rainfall, where there is a strong correlation between them [14,15,16]. In order to scientifically verify the correlation between PWV, typhoon and rainfall, researchers built models and correlation coefficients [17,18,19]. For the correlation between PWV and rainfall during typhoon transit, the distribution characteristics of PWV and its correlation with actual rainfall during two typical rainfall processes in 2018 were analyzed using the Pearson correlation coefficient method [19]. Most researchers analyzed the correlation between typhoons and PWV in a certain area. The interaction between the intensity of typhoon Rammasun (1409) and rainfall changes were analyzed by combining Fourier transform and the Liang–Kleeman information flow [20]. To analyze the temporal and spatial variation characteristics of PWV during a typhoon, the PWV data were inverted based on the observation data of a Chongming continuous-operation reference station system in Chongming area from 2019 to 2020 [21]. To explore the temporal and spatial interaction characteristics of PWV and actual rainfall during typhoon ‘Chandu’ and three other typhoon events in Taiwan from 2015 to 2017, they were investigated using the PWV retrieved from the real-time precise point positioning technology or ground-based GPS data [22,23]. Kim et al. found that the most intense rainfall events occurred after a rapid increase in PWV along with a strong southwesterly water-vapor flow during convective instability [24]. Zhao et al. used the anomalous variations of the PWV inverted by ERA5 with other atmospheric parameters related to typhoons to analyze a typhoon-monitoring method with and without considering the typhoon’s acceleration during the time of the maximum value of the PWV during the typhoon period [25]. In terms of the influencing factors of PWV in the north and south of the eastern coastal areas of China, Tian et al. analyzed the influencing factors of PWV in the North China Plain based on the meteorological data of its sounding stations and ground stations, and found that PWV is affected by the season and precipitation efficiency [26]. Through the study of typhoon rainfall factors, Niu et al. found that the factors affecting typhoon precipitation are topography, cold-air intrusion, and continental and offshore humidity [27].
The above research literature took a single region as the research subject, and explored the temporal and spatial changes of precipitation and PWV affected by typhoons in different regions during the passage of strong typhoons to a lesser extent. Therefore, this paper chooses typhoon ‘Meihua’ as the research subject to discuss its impact on different regions in the eastern coastal areas of China during its whole process, and then deeply explores the correlation between the track of typhoon ‘Meihua’, PWV and rainfall at meteorological stations.
In this paper, the PWV of 16 meteorological stations on the typhoon track are calculated using the NWP data. The Pearson correlation coefficient method is adopted to analyze the temporal and spatial characteristics for the typhoon track with rainfall and PWV quantitatively. These works will provide benefit for exploring the roles of PWV and rainfall in the eastern coastal areas of China with typhoon movements [28].
2. Data and Methodology
2.1. Data Sources
In order to analyze the correlation among the typhoon track, PWV and rainfall, the data of the typhoon track, PWV and rainfall in different regions on the track were used. Firstly, PWV was calculated by ERA5 reanalysis data. Then, the distance between the typhoon and the meteorological station at different times was calculated by the three-dimensional coordinates of the meteorological station and the hourly coordinate data of the typhoon. Rainfall data are obtained through the ‘Xihe Energy Big Data Platform’.
(1) Typhoon Data Source
The typhoon data were obtained from the real-time release system of the typhoon track by Zhejiang Provincial Department of Water Resources, including the hourly typhoon position (latitude and longitude), hourly average wind speed and typhoon intensity.
(2) Three-dimensional Coordinate Data of Meteorological Station
The three-dimensional coordinate data of the meteorological station were downloaded from the website of the National Oceanic and Atmospheric Administration (NOAA), selecting the coordinate data of the meteorological station that was close to the typhoon track (https://www.ncei.noaa.gov/maps/daily/, accessed on 5 May 2023).
(3) Rainfall Data
According to the coordinates of the weather station, the hourly resolution rainfall data released by the European Centre for Medium-Range Weather Forecasts (ECMWF) was downloaded through the ‘Xihe Energy Big Data Platform’ (https://xihe-energy.com, accessed on 7 May 2023). These data have the characteristics of a high temporal resolution and high data accuracy.
(4) RS Data
The data of the RS observatory were collected from the Integrated Global Radiosonde Archive Version 2 (IGRA2), which is generated by the National Climate Data Center of the United States. And it includes pressure, temperature, relative humidity, potential height, wind speed and other data. The temporal resolution of data is 12 or 6 h, respectively [29].
(5) ERA5 Data
The ERA5 reanalysis data derived from radiosonde data are the latest atmospheric reanalysis product provided by ECMWF (https://cds.climate.copernicus.eu/, accessed on 7 May 2023). They can provide parameter data, such as air pressure, wind speed, temperature, relative humidity, and elevation (high altitude). They are layered data and their time resolution is 12 h. Their horizontal resolution is 0.25° × 0.25° (longitude × latitude). Their vertical resolution is 37 layers (the top height is about 47 km), and the time resolution of the layered and surface data is 1 h [30].
2.2. PWV Calculation Method Based on Integral Method
The inversive data of PWV based on RS and ERA5 data can be calculated using an integral method. The formula is as follows:
where q is the specific humidity; e is the water-vapor pressure; p is the atmospheric pressure; ps is the surface pressure; and g is the acceleration constant of gravity. Considering the different gravity acceleration constants in different regions, the Formula (3) is used to calculate the local gravity acceleration constant:
where φ is latitude; H is geodetic height. The elevation of ERA5 reanalysis data is geodetic height.
2.3. Precision Analysis Indicators
(1) RMSE
The root-mean-squared error, which is also known as the standard error, is the square root of the ratio of the square of the deviation between the observed value and the true value (or the simulated value) to the number of observations m, and is used to measure the deviation between the observed value and the true value. RMSE is an important criterion for the accuracy of the expected data in statistics, which is widely used to judge the accuracy of the data. In the actual measurement, the number of observations m is always limited, so the true value can be replaced by the most reliable (best) value [31]. The formula is as follows:
where m represents the total number of observations; represents the observed value; and represents the true value.
(2) MAE
The mean absolute error represents the average value of the absolute value of the error between the observed value and the true value [32]. The formula is as follows:
where m represents the total number of observations; represents the observed value; and represents the true value.
When there are some extreme outliers in the data, the MAE value is not amplified, which makes up for the fact that RMSE will amplify the large error square. Therefore, MAE was used to further verify the accuracy.
2.4. Correlation Analysis Based on Pearson Correlation Coefficient
(1) Pearson correlation coefficient
The Pearson correlation coefficient can be used to describe the degree of linear correlation between the two variables. The greater the absolute value of r, the stronger the correlation. In the field of natural science, the coefficient is widely used to measure the degree of correlation between two variables and functions as an important statistical tool. In this paper, the Pearson correlation coefficient was used to quantitatively analyze the correlation between ‘weather station-typhoon’ distance and PWV. The expression of the Pearson correlation coefficient r is
where n is the number of samples; is the average value of sample ; and is the average value of sample . The |r| value is less than or equal to 1, which denotes the extremely strong correlation between 0.8~1.0, strong correlation between 0.6~0.8, moderate correlation between 0.4~0.6, weak correlation between 0.2~0.4, and no correlation between 0.0~0.2.
(2) Calculation of ‘weather station-typhoon’ distance
Based on the latitude and longitude coordinates of the typhoon and the meteorological station, the distance between the typhoon and each meteorological station was calculated using the semi-positive vector formula:
where Lat1 and Lat2 are the latitudes of the two places; Lng1 and Lng2 are the longitudes of the two places; a is the difference between the latitudes of the two places; b is the difference between the longitudes of the two places; and R is the equatorial radius of the earth. According to the previous literature, the average error of the Formula (7) is 0.16%, which means that the error is about 1.6 km when the distance is 1000 km. This has little effect on the overall accuracy.
3. Results and Analysis
3.1. Precision Analysis
In this paper, two RS stations, CAM00071802 (41.8° N, 126.8833° E) and CHM00054374 (47.5167° N, 52.7833° W), were selected to evaluate the PWV accuracy. The PWVs of 365 days in 2022 were calculated from RS and ERA5 by Formula (2). For the high accuracy of PWV obtained using RS, it was set as the reference values to evaluate the precision of ERA5 PWV. The RMSE and MEA of ERA5 PWV for the two stations were calculated, as demonstrated in Table 1, which shows that the RMSE was 1.968 for the CAM00071802 station and 2.458 for the CHM00054374 station, and the MAE was 1.411 and 1.349, respectively. The RMSE and MEA indicate that the ERA5 PWV accuracy meets the requirements between −2 and 2. It can be seen from the table that the RMSE value of the CHM00054374 station was slightly larger than 2, but its MAE value was less than 2, excluding the impact of extreme outliers. Therefore, the PWV calculated by ERA5 can be used for exploring the correlation of the PWV, rainfall and typhoon track.

Table 1.
RMSE and MEA values of CAM00071802 and CHM00054374 (mm).
By drawing a box line diagram of the CAM00071802 and CHM00054374 RS stations (Figure 1), the difference between the RS PWV and ERA5 PWV at the two stations is visually represented. A line in the middle of the box in the figure represents the median of the data. The upper and lower limits of the box are the upper quartile and the lower quartile of the data, which means that the box contains 50% of the data, and the width of the box reflects the degree of fluctuation of the data to a certain extent. There is a line above and below the box, which represents the maximum and minimum. From the diagram, we can see that the data fluctuation of CAM00071802 station was small, and the extreme anomaly value was not obvious compared with CHM00054374, which is consistent with the data expressed in Table 1.
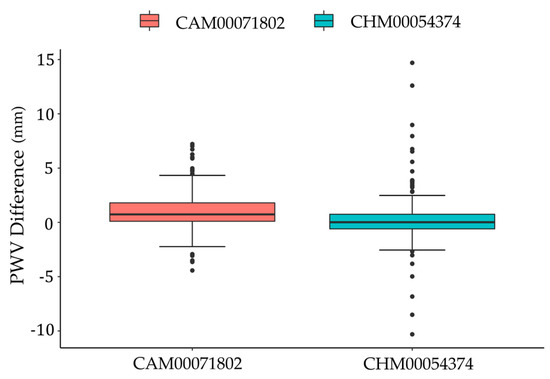
Figure 1.
Difference between RS PWV and ERA5 PWV at CAM00071802 and CHM00054374 (The dots in the graph represent outliers).
3.2. Experiments and Analysis
The eastern coastal areas of China mainly include the Liaoning, Shandong, Jiangsu, Zhejiang, Fujian, Shanghai, Guangdong, Hainan and Taiwan provinces, which cover an area of 950,000 square kilometers and are mainly hills and plains. Typhoons occur frequently in summer in this area because of the large difference between the sea and land, which has a great impact on the local economy and people’s livelihoods. Therefore, studying the correlation between typhoon with PWV and rainfall can help to predict the extreme weather during typhoons, and effectively reduce the impact of typhoon disasters on the local area [33].
Typhoon ‘Meihua’, which took place September 2022, and is studied in this paper, originated from the western Pacific Ocean and moved from 17.4° north latitude and 132.9° east longitude to 41.5° north latitude and 124.8° east longitude. It caused landfall in Zhoushan, Zhejiang Province at about 20:30 on the evening of 14 September 2022, due to it being a strong typhoon, and affected 12 provinces, including Taiwan, Fujian, Jiangxi, Zhejiang, Shanghai, Anhui, Jiangsu, Shandong, Hebei, Henan (eastern local), Liaoning, and Jilin. ‘Meihua’ had a strong representativeness due to its characteristics of strong landfall intensity, wide impact range, long duration of strong winds and large rainfall intensity.
During the typhoon’s journey, the rainfall in some areas of Shaoxing, Ningbo, Zhoushan and Qingdao reached 250 to 500 mm, and the maximum rainfall was 707 mm in Xiajialing, Yuyao, Zhejiang. A total of 23 national meteorological observation stations exceeded the extreme value in September. In this study, 16 meteorological stations were selected, starting from the vicinity of Taiwan Island to Liaoning Province, covering six provinces (cities) including Zhejiang, Shanghai and Jiangsu, and the latitude was from 24.344° to 41.3166° north latitude, and the longitude was from 119.133° east longitude to 124.186°. The location distributions of the selected meteorological stations and their correlations with the typhoon are shown in Figure 2, where the size difference of the blue dots indicates the intensity of the typhoon.
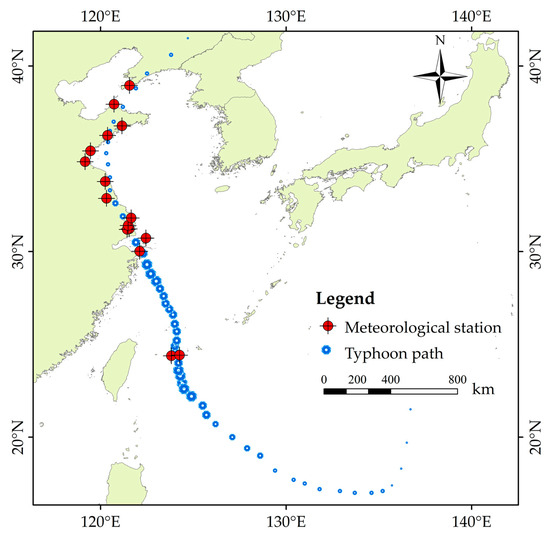
Figure 2.
The location distribution of the meteorological station and its correlation with the typhoon (The size difference of the blue dots indicates the intensity of the typhoon).
This paper explored the temporal and spatial correlation between the distance of typhoon ‘Meihua’ to various locations, PWV, and rainfall using quantitative and qualitative analysis. Additionally, it examined the rainfall activity and PWV change process in China’s eastern coastline regions during the passage of typhoon ‘Meihua’.
3.2.1. The Qualitative Correlation Analysis of the PWV and Rainfall
In this study, we investigated the hourly variation of PWV and rainfall from 0:00 on 10 September 2022 to 19:00 on 16 September 2022, and the time when the typhoon passed the meteorological station, which was marked with a purple vertical line (Figure 3). The experimental research period of this experience was up to 7 days, and the latitude span of the meteorological station was large (the longitudinal span was 21°, and the detailed location of the meteorological station is shown in Table 2). However, at different times, the influencing factors of rainfall at the meteorological station were diverse [27]. This paper mainly explored the temporal and spatial correlation between typhoon and PWV and precipitation under the influence of the ‘Meihua’ super-typhoon.
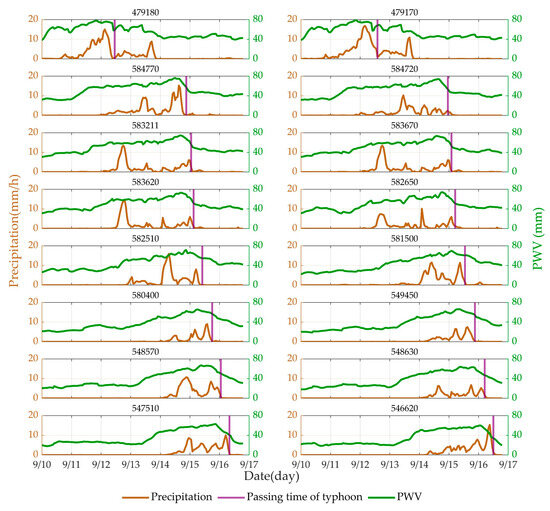
Figure 3.
The correlation between PWV and rainfall at 16 meteorological stations (The stations are represented by the 6-digit numbers).

Table 2.
Summary of 16 meteorological station locations (sorted by typhoon transit sequence).
Through the above experiments, it can be seen from Figure 3 that there is a strong correlation between rainfall and PWV. Before each rainfall event, PWV has a significant stage of continuous climbing, and PWV reaches its peak about 2~6 h earlier than rainfall. Before the arrival of the typhoon, PWV and precipitation will reach the peak in advance. Due to the influence of water-vapor content and water-vapor retention rate, the water-vapor supply of meteorological stations in the eastern coast of China is slow after the typhoon, and it is not easy to accumulate due to the influence of monsoon and plain terrain. Therefore, PWV shows a significant downward trend, and there is little rainfall when PWV decreases to 40 mm and below. The 479180 and 479170 meteorological stations located at the sea after the typhoon, due to the low latitude, the water-vapor supply is fast, the PWV rises significantly, and the obvious secondary rainfall occurs in a short time.
3.2.2. Correlation Analysis of the PWV and ‘Weather Station-Typhoon’ Distance
According the above experiments, there was a strong correlation between rainfall and PWV. The distance between typhoon and meteorological station is an important factor affecting rainfall and PWV, so we analyzed the correlation between the distance between typhoon and meteorological station and PWV. It was found that there was a negative correlation between the PWV and distance. The variation of distance and PWV is always opposite, and the closer the distance is, the more drastic the variation is (Figure 4).
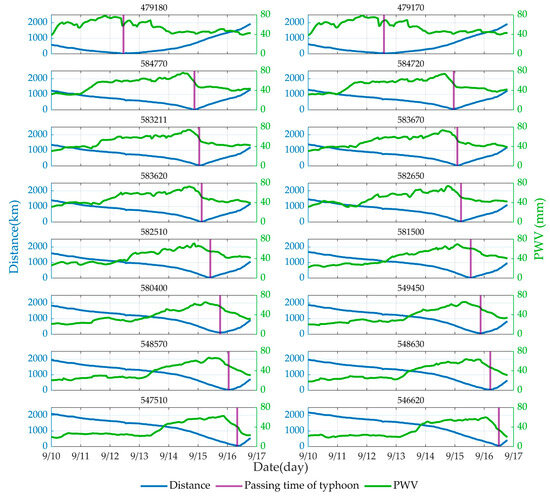
Figure 4.
The correlation between PWV and ‘weather station-typhoon’ distance at 16 weather stations (The stations are represented by the 6-digit numbers).
In order to express the relationship between the two times more accurately and intuitively, the indicator coefficient was set to 00:00 on 10 September 2022 as the starting time, and set to 0, and then the indicator coefficient was increased by 1 hour to analyze the correlation between the two times. The final results are shown in Table 3. According to the indicator coefficient, ‘the time of the maximum PWV’ and ‘the time passing through the station’ were the X and Y axis fitting lines (Figure 5), and the coefficient of determination R2 was 0.9908, which shows that the two have a high degree of closeness. Because the peak time of PWV was earlier than the time of typhoon passing through the weather station, a in Y = X − a represents the time interval between the two. Therefore, the PWV always peaks around 16 h before the arrival of the typhoon and the ‘weather station-typhoon’ distance has a negative correlation with PWV at the weather station.

Table 3.
The time difference between the maximum value of PWV and the arrival time of the typhoon. (September 2022).
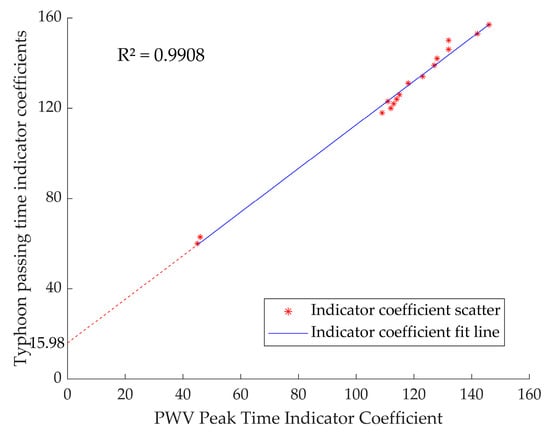
Figure 5.
The correlation line between ‘the time of maximum PWV’ and ‘the time passing through the station’ (The time indicator coefficient means the hours to the typhoon generation time, and dotted line intersecting the vertical axis shows the average lead time).
In this paper, in order to more intuitively judge the local PWV change before the arrival of the typhoon, and then provide the basis for judging the rainfall situation, the Pearson correlation coefficient was used to quantitatively describe the correlation between the distance of typhoon ‘Meihua’ to the meteorological station and the PWV of the meteorological station.
The PWV and ‘weather station-typhoon’ distance of the selected 16 weather stations at different times were quantitatively analyzed (Equation (6)). Among them, the PWV of the weather station was the x-value, and the distance between the weather station and the typhoon was the y-value. The PWV at each weather station had a strong negative correlation or a very strong negative correlation with the “weather station-typhoon” distance (Table 4). The correlation difference shows that PWV is not only affected by typhoon wind, water-vapor transport, air pressure, etc., but also by atmospheric circulation, topography and other factors, in the eastern coastal areas of China [26].

Table 4.
Peason correlation coefficient between PWV and ‘weather station-typhoon’ distance.
3.2.3. Spatial Distribution Analysis of PWV, Rainfall and Typhoon Track
Figure 6 is the spatial distribution map of rainfall in the eastern coastal areas of China at daily UTC 00:00 and 12:00 from the 10 to 16 September 2022. It can be seen that as the track of the typhoon moved from south to north, the track of the rainfall distribution center gradually moved to the northwest and finally moved to the northeast. And the rainfall from south to north showed a decreasing trend. Table 5 shows the 24 h cumulative rainfall of each weather station during the typhoon, which shows the same trend as that in Figure 6.
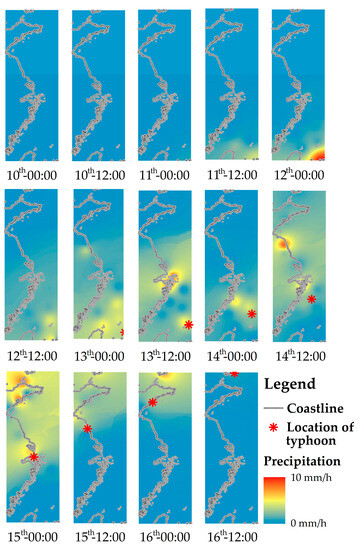
Figure 6.
The spatial distribution map of rainfall in the eastern coastal areas of China at daily UTC 00:00 and 12:00 from 10 to 16 September 2022.

Table 5.
The 24 h cumulative rainfall (mm) at 16 meteorological stations during typhoon ‘Meihua’.
Regarding the relative correlation between the typhoon position and the rainfall center (Figure 6), the rainfall caused by the typhoon had an obvious asymmetry. The rainfall was mainly located on the northwest side of the typhoon center, and with the increase (decrease) in intensity, the absolute value of vertical helicity on the west side of the typhoon center increased (decreases), to some extent, which promoted (hinders) the development of ascending motion in the region, resulting in more (less) water-vapor condensation and rain. Therefore, regarding Figure 2 and Figure 5, the rainfall caused by typhoon transit was less, or there was no rainfall, with a weakening typhoon intensity [11].
Figure 7 shows the spatial distribution of PWV in the eastern coastal areas of China at daily UTC 0:00 and 12:00 from the 10 to the 16 September 2022. It can be seen that during the typhoon affecting the eastern coast of China, the orange-red region moved from southeast to northwest and finally to northeast. The change in PWV showed a decreasing trend from southeast to northwest, and decreased significantly after the rainstorm. From Figure 6 and Figure 7, we can see that the variation trend of the PWV distribution center during the rainstorm was similar to the regional rainfall center, and the peaks of PWV and rainfall appeared before the arrival of the typhoon, and were asymmetrically distributed on the northwest side of the typhoon center, which further verifies the correlation between them.
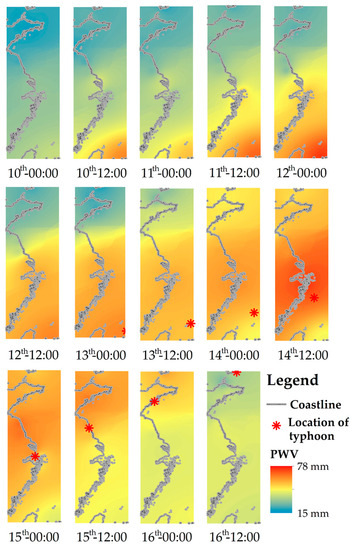
Figure 7.
The spatial distribution of PWV in the eastern coastal areas of China at daily UTC 0:00 and 12:00 from the 10 to the 16 September 2022.
4. Discussion
The comprehensive and systematic monitoring of PWV changes is necessary for studying the movement of typhoons and forecasting extreme weather. The method of GNSS used to invert PWV is constantly improving and being optimized; for example, Liu et al. proposed a new model that included three prediction factors—PWV value, PWV increase, and maximum hourly PWV increase [34]. In this paper, we mainly studied the PWV data inverted by NWP, and the accuracy of ERA5 PWV was assessed using RS PWV. The experimental results showed that, compared with RS PWV, the RMSE of PWV estimated using ERA5 was 1.968 mm and 2.458 mm in the RS stations CAM00071802 and CHM00054374, and the MAE of PWV estimated by ERA5 was 1.411 mm and 1.349 mm. Both values were less than 2. Consequently, the accuracy of the ERA5 PWV was slightly higher. This result was consistent with Huang’s research [19].
From Figure 3, we can see tha there is a strong correlation between rainfall and PWV in coastal areas; the PWV peak occurred about 2~6 h earlier compared with that of the rainfall. This was consistent with Chen’s research [5] and the research of S M R [7].
In previous reports, it was found that the factors affecting typhoon precipitation are topography, cold air intrusion, continental and offshore humidity [27]. This paper showed that after the typhoon transited, due to the influence of water-vapor content and other factors, there was no rainfall or very little rainfall when PWV was reduced to 40 mm or below. Figure 6 and Figure 7 show that the spatial distribution of PWV was consistent with the spatial distribution of rainfall. Therefore, they were asymmetrically distributed on the northwest side of the typhoon center.
From Table 3 and Figure 4, we can see that the, PWV at the weather station affected by the typhoon had a strong negative correlation with the ‘weather station-typhoon’ distance, and the average of the Pearson correlation coefficient was −0.73. This is consistent with Du’s research [19]. From Table 3 and Figure 5, the Coefficient of Determination R2 was 0.9908, and the PWV always peaks around 16 h before the arrival of the typhoon. The correlation between the two was further verified. This is consistent with Wang’s research [22].
In addition, in this paper, NWP PWV, RS PWV and the distance were calculated using our own program. ArcGIS software was used as statistical software.
5. Conclusions
In this paper, to analyze the correlation between PWV, rainfall and typhoon track using qualitative and quantitative methods, we selected the strongest typhoon ‘Meihua’, occurring in September 2022, and 16 meteorological stations in the typhoon path to research, which was in the eastern coastal areas of China The following conclusions were drawn:
(1) Before the typhoon arrived, there was a strong correlation between rainfall and PWV in coastal areas, and PWV would increase earlier than the increase in rainfall. PWV reaching the peak would occur 2~6 h earlier than that of the rainfall. After the typhoon transited, due to the influence of water-vapor content and other factors, there was no rainfall or very little rainfall when PWV dropped to 40 mm or below.
(2) Affected by the typhoon, PWV at the weather station had a strong negative correlation with the ‘weather station-typhoon’ distance. With a decrease in the distance between the typhoon and the weather station, the PWV at the weather station will increase, and the closer the distance is, the faster the PWV at the weather station increases, and the PWV always peaks around 16 h before the arrival of the typhoon. The analysis of the Pearson correlation coefficient showed that there were 5 strong negative correlations and 11 strong negative correlations between the PWV and ‘weather station-typhoon‘ distance at the 16 weather stations.
(3) PWV and rainfall reached maximum before the typhoon passed through the area, and the variation trend of rainfall and PWV caused by typhoon was significantly consistent and obviously asymmetrical with the typhoon, and was shown as mainly being located on the northwest side of the typhoon center.
Author Contributions
Conceptualization, Z.L.; methodology, Z.L.; software, J.Y.; validation, J.Y. and C.W.; formal analysis, Z.L. and C.W.; data curation, Z.L.; writing-original draft preparation, Z.L. and C.W.; writing-review and editing, J.W.; visualization, J.Y.; supervision, J.W.; funding acquisition, J.W. All authors have read and agreed to the published version of the manuscript.
Funding
This work was supported by grants from the State Key Laboratory of Geo-Information Engineering (No. SKLGIE2020-M-2-1), the National Natural Science Foundation of China (No.42204032), and the Shandong Province Science Foundation for Youths (No. ZR2022QD015).
Data Availability Statement
Not applicable.
Conflicts of Interest
The authors declare no conflict of interest.
References
- Dalu, G. Satellite remote sensing of atmospheric water vapour. Int. J. Remote. Sens. 1986, 7, 1089–1097. [Google Scholar] [CrossRef]
- Bei, L.; Yong, W.; Zesheng, L.; Wei, Z. MODIS PWV correction in mainland China under CMONOC observation constraints. J. Surv. Mapp. 2019, 48, 9. [Google Scholar]
- Bevis, M.; Businger, S.; Herring, T.A.; Rocken, C.; Anthes, R.A.; Ware, R.H. GPS meteorology: Remote sensing of atmospheric water vapor using the global positioning system. J. Geophys. Res. Atmos. 1992, 97, 15787–15801. [Google Scholar] [CrossRef]
- Chuang, S.; Weixing, Z.; Yunchang, C.; Yidong, L.; Hong, L.; Lei, F.; Satirapod, C.; Trakolkul, C. Analysis of atmospheric water vapor climate characteristics and precipitation in China-Zhongnan Peninsula based on Beidou/GNSS. J. Surv. Mapp. 2020, 49, 1112–1119. [Google Scholar]
- Xu, Y.; Chen, X.; Liu, M.; Wang, J.; Zhang, F.; Cui, J.; Zhou, H. Spatial–Temporal Relationship Study between NWP PWV and Precipitation: A Case Study of ‘July 20’ Heavy Rainstorm in Zhengzhou. Remote. Sens. 2022, 14, 3636. [Google Scholar] [CrossRef]
- Tang, X.; Hancock, C.M.; Xiang, Z.; Kong, Y.; de Ligt, H.; Shi, H.; Quaye-Ballard, J.A. Precipitable Water Vapour Retrieval from GPS Precise Point Positioning and NCEP CFSv2 Dataset during Typhoon Events. Sensors 2018, 18, 3831. [Google Scholar] [CrossRef]
- Li, L.; Zhang, K.; Wu, S.; Li, H.; Wang, X.; Hu, A.; Li, W.; Fu, E.; Zhang, M.; Shen, Z. An Improved Method for Rainfall Forecast Based on GNSS-PWV. Remote. Sens. 2022, 14, 4280. [Google Scholar] [CrossRef]
- He, Q.; Zhang, K.; Wu, S.; Zhao, Q.; Wang, X.; Shen, Z.; Li, L.; Wan, M.; Liu, X. Real-Time GNSS-Derived PWV for Typhoon Characterizations: A Case Study for Super Typhoon Mangkhut in Hong Kong. Remote. Sens. 2019, 12, 104. [Google Scholar] [CrossRef]
- Vey, S.; Dietrich, R.; Rülke, A.; Fritsche, M.; Steigenberger, P.; Rothacher, M. Validation of Precipitable Water Vapor within the NCEP/DOE Reanalysis Using Global GPS Observations from One Decade. J. Clim. 2010, 23, 1675–1695. [Google Scholar] [CrossRef]
- Huang, L.; Mo, Z.; Liu, L.; Zeng, Z.; Chen, J.; Xiong, S.; He, H. Evaluation of Hourly PWV Products Derived from ERA5 and MERRA-2 Over the Tibetan Plateau Using Ground-Based GNSS Observations by Two Enhanced Models. Earth Space Sci. 2021, 8, e2020EA001516. [Google Scholar] [CrossRef]
- Zhang, S.; Liu, F.; Li, H.; Zhou, Q.; Chen, Q.; Ma, W.; Luo, J.; Huang, Y. Global Navigation Satellite System-Based Retrieval of Precipitable Water Vapor and Its Relationship with Rainfall and Drought in Qinghai, China. Atmosphere 2023, 14, 517. [Google Scholar] [CrossRef]
- Dingan, H.; Chuhan, L.; Yang, K.; Fei, X.; Yujing, Q. Diagnostic analysis of water vapor source in Jianghuai region in June 2020 based on ERA5 reanalysis data. Meteorol. Sci. 2022, 42, 44–50. [Google Scholar]
- Na, W.; Weizong, G.; Can, Q.; Xiangxin, M.; Fang, Z. Shandong summer air water vapor distribution and water vapor transmission characteristics. Plateau Weather. 2021, 40, 159–168. [Google Scholar]
- Asaly, S.; Gottlieb, L.-A.; Yair, Y.; Price, C.; Reuveni, Y. Predicting Eastern Mediterranean Flash Floods Using Support Vector Machines with Precipitable Water Vapor, Pressure, and Lightning Data. Remote. Sens. 2023, 15, 2916. [Google Scholar] [CrossRef]
- Ren, D.; Wang, Y.; Wang, G.; Liu, L. Rising trends of global precipitable water vapor and its correlation with flood frequency. Geodesy Geodyn. 2023, 14, 355–367. [Google Scholar] [CrossRef]
- Wang, H.; Liu, Y.; Liu, Y.; Cao, Y.; Liang, H.; Hu, H.; Liang, J.; Tu, M. Assimilation of GNSS PWV with NCAR-RTFDDA to Improve Prediction of a Landfall Typhoon. Remote. Sens. 2022, 14, 178. [Google Scholar] [CrossRef]
- Tu, M.; Zhang, W.; Bai, J.; Wu, D.; Liang, H.; Lou, Y. Spatio-Temporal Variations of Precipitable Water Vapor and Horizontal Tropospheric Gradients from GPS during Typhoon Lekima. Remote. Sens. 2021, 13, 4082. [Google Scholar] [CrossRef]
- Serrano-Vincenti, S.; Condom, T.; Campozano, L.; Escobar, L.A.; Walpersdorf, A.; Carchipulla-Morales, D.; Villacís, M. Harmonic Analysis of the Relationship between GNSS Precipitable Water Vapor and Heavy Rainfall over the Northwest Equatorial Coast, Andes, and Amazon Regions. Atmosphere 2022, 13, 1809. [Google Scholar] [CrossRef]
- Aijun, D.; Qiang, Z.; Shiqi, Y.; Xingwei, L.; Chaoqi, X.; Qinyu, Y. The relationship between atmospheric precipitation detected by Beidou CORS and rainfall in Chongqing. Geod. Geodyn. 2020, 40, 134–139. [Google Scholar]
- Hao, Q.; Fengqin, Z.; Liquan, W. The interaction between the intensity of Typhoon Wilson (1409) and the change of precipitation. J. Appl. Meteorol. 2022, 33, 477–488. [Google Scholar]
- Xiaojing, X. Research on Atmospheric Precipitation Inversion and Typhoon Monitoring in Chongming District Based on GNSS; East China Normal University: Shanghai, China, 2022. [Google Scholar]
- Qin, W.; Yibin, Y.; Chen, L.; Chaoqi, X. Study on the Correlation between GNSS-PWV and Rainfall during Typhoon—Take Shanghai as an Example; Surveying and Mapping Geographic Information: Wuhan, China, 2022; pp. 1–4. [Google Scholar]
- Jingying, Z.; Yiyong, L.; Jian, D.; Yuanrong, H.; Cheng, H. Correlation analysis of PWV and rainfall during typhoon. Geod. Geodyn. 2020, 40, 491–495+501. [Google Scholar]
- Kim, Y.-J.; Jee, J.-B.; Lim, B. Investigating the Influence of Water Vapor on Heavy Rainfall Events in the Southern Korean Peninsula. Remote. Sens. 2023, 15, 340. [Google Scholar] [CrossRef]
- Zhao, Q.; Ma, X.; Yao, W.; Yao, Y. A New Typhoon-Monitoring Method Using Precipitation Water Vapor. Remote. Sens. 2019, 11, 2845. [Google Scholar] [CrossRef]
- Xiaolei, T.; Baofu, L.; Xuewei, L.; Ting, L.; Mingbo, Z.; Longfei, W. The spatial and temporal changes of atmospheric precipitation in the North China Plain from 1970 to 2012 and its influencing factors. J. Liaocheng Univ. (Nat. Sci. Ed.) 2019, 32, 81–88. [Google Scholar]
- Xuexin, N.; Huiliang, D.; Teng Dai High School. Analysis of the main factors affecting the precipitation of the landing typhoon. Rainstorm Disaster 2010, 29, 76–80. [Google Scholar]
- Yongfeng, W.; Shaofeng, X.; Jihong, Z.; Yin, Z. Accuracy analysis of ERA5/MERRA-2 data calculation PWV in a rainstorm process in Guilin. Chin. Sci. Technol. Pap. 2023, 18, 103–108. [Google Scholar]
- Oloyede, O.A.; Nicolas, L.; Simeon, O.; Philip, A.; Emmanuel, E.; Alexander, A. Upper-air meteorological dataset for Uyo, using radiosonde. Data Brief 2023, 46. [Google Scholar] [CrossRef]
- Lu, C.; Zhang, Y.; Zheng, Y.; Wu, Z.; Wang, Q. Precipitable water vapor fusion of MODIS and ERA5 based on convolutional neural network. GPS Solut. 2022, 27, 15. [Google Scholar] [CrossRef]
- Bondarev, A.S. Root Mean Square Error Estimates for the Projection-Difference Method for the Approximate Solution of a Parabolic Equation with a Periodic Condition for the Solution. J. Math. Sci. 2023, 272, 866–871. [Google Scholar] [CrossRef]
- Robeson, S.M.; Willmott, C.J. Decomposition of the mean absolute error (MAE) into systematic and unsystematic components. PLoS ONE 2023, 18, e0279774. [Google Scholar] [CrossRef]
- Qinghong, G.; Xiaocui, M.; Xiaofeng, F.; Zhengming, Y.; Xiao, L.; Xia, X. Effects of stand age and inter-annual precipitation variability on fine root biomass in poplar plantations in the eastern coastal China. For. Ecol. Manag. 2022, 505. [Google Scholar]
- Rose, M.S.; Sunil, P.S.; Zacharia, J.; Sreejith, K.M.; Sunda, S.; Mini, V.K.; Sunil, A.S.; Kumar, K.V. Early detection of heavy rainfall events associated with the monsoon in Kerala, India using GPS derived ZTD and PWV estimates: A case study. J. Earth Syst. Sci. 2023, 132, 23. [Google Scholar] [CrossRef]
Disclaimer/Publisher’s Note: The statements, opinions and data contained in all publications are solely those of the individual author(s) and contributor(s) and not of MDPI and/or the editor(s). MDPI and/or the editor(s) disclaim responsibility for any injury to people or property resulting from any ideas, methods, instructions or products referred to in the content. |
© 2023 by the authors. Licensee MDPI, Basel, Switzerland. This article is an open access article distributed under the terms and conditions of the Creative Commons Attribution (CC BY) license (https://creativecommons.org/licenses/by/4.0/).