Local and Regional Contributions to Tropospheric Ozone Concentrations
Abstract
1. Introduction
2. Method
2.1. Data Analysis Method
2.2. Description of Data
3. Results and Discussion
3.1. Linear Regression Analysis of Oxidizer Concentrations against NOx Concentrations
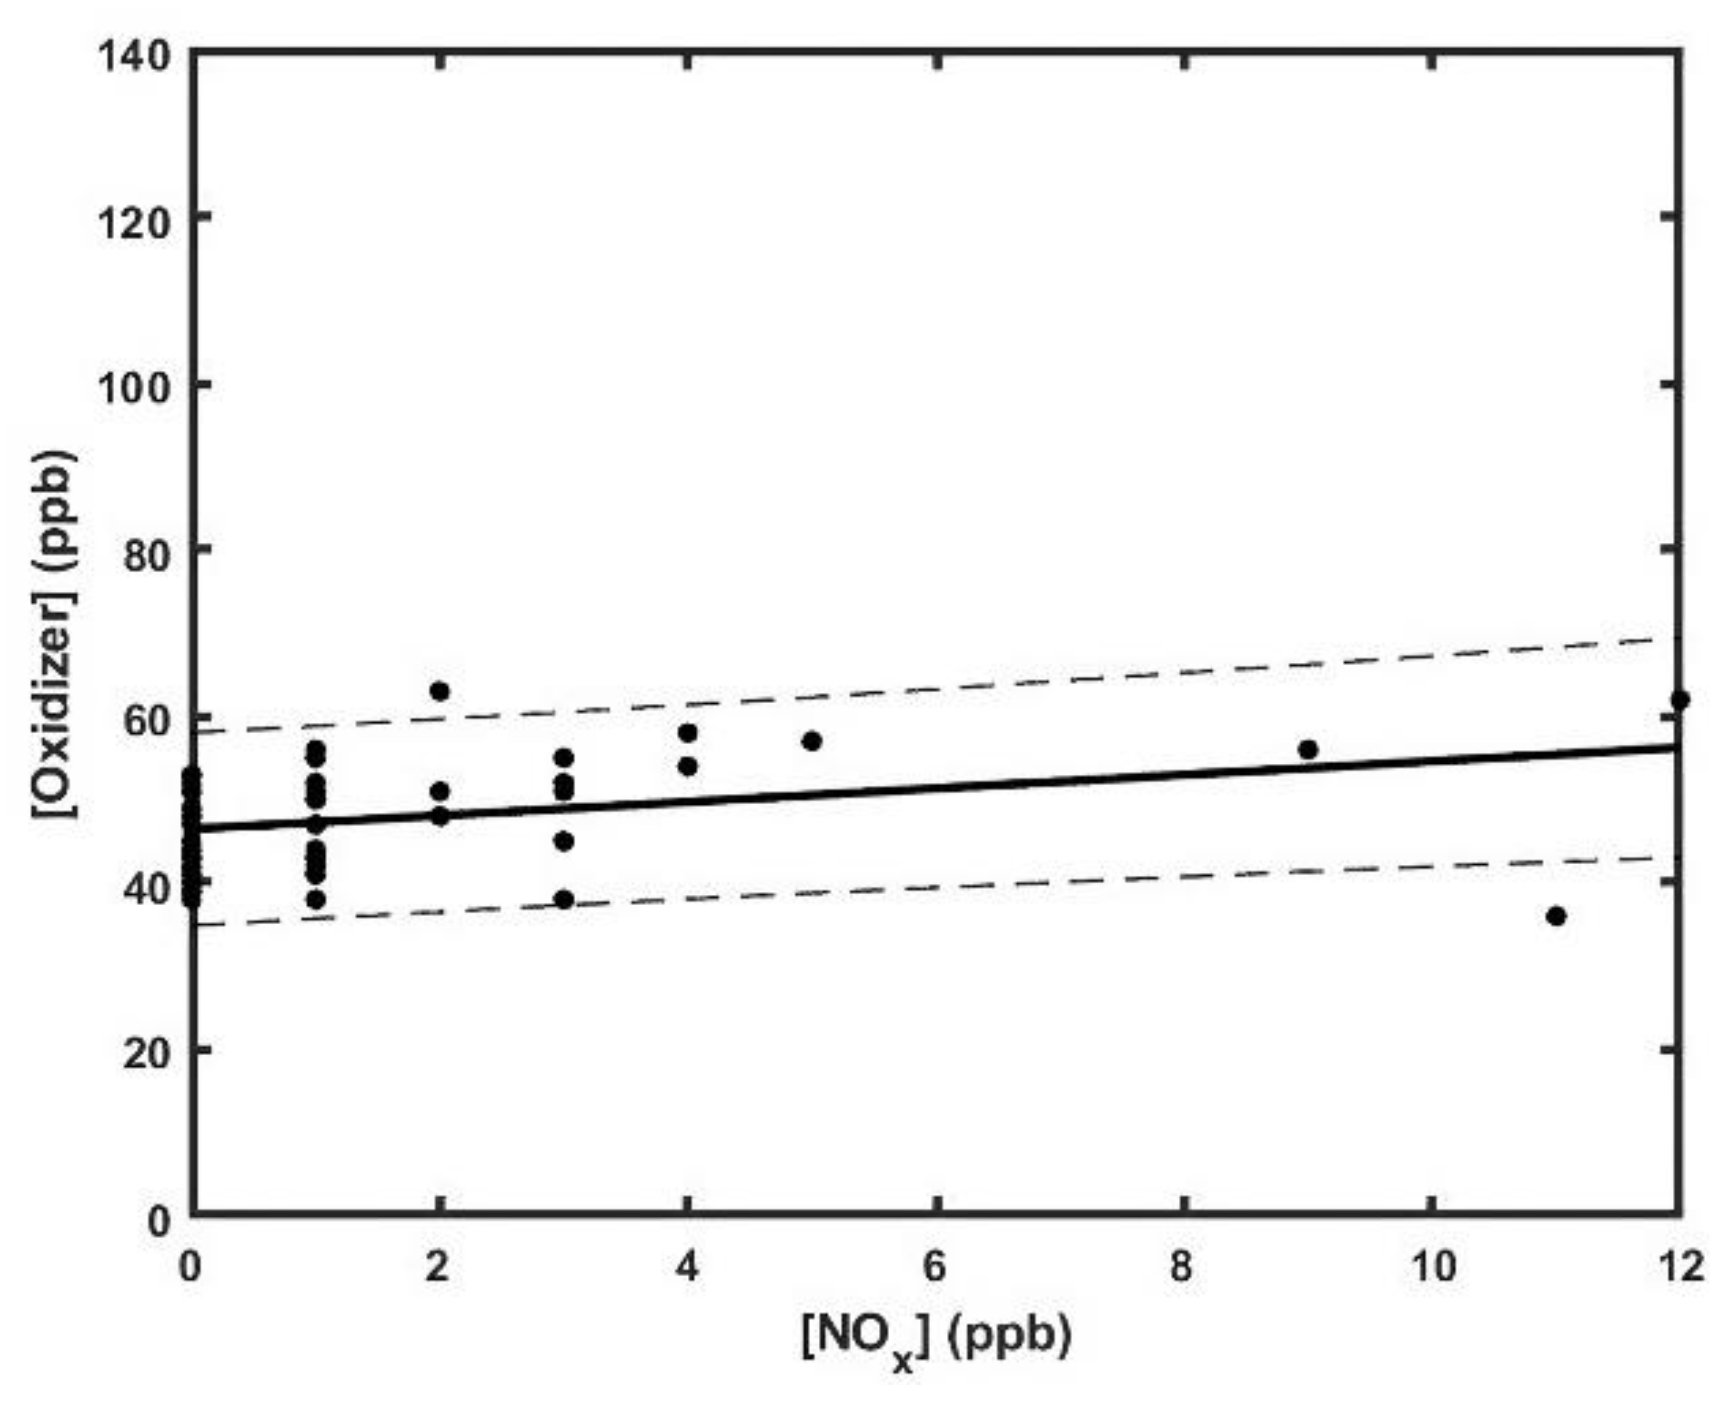
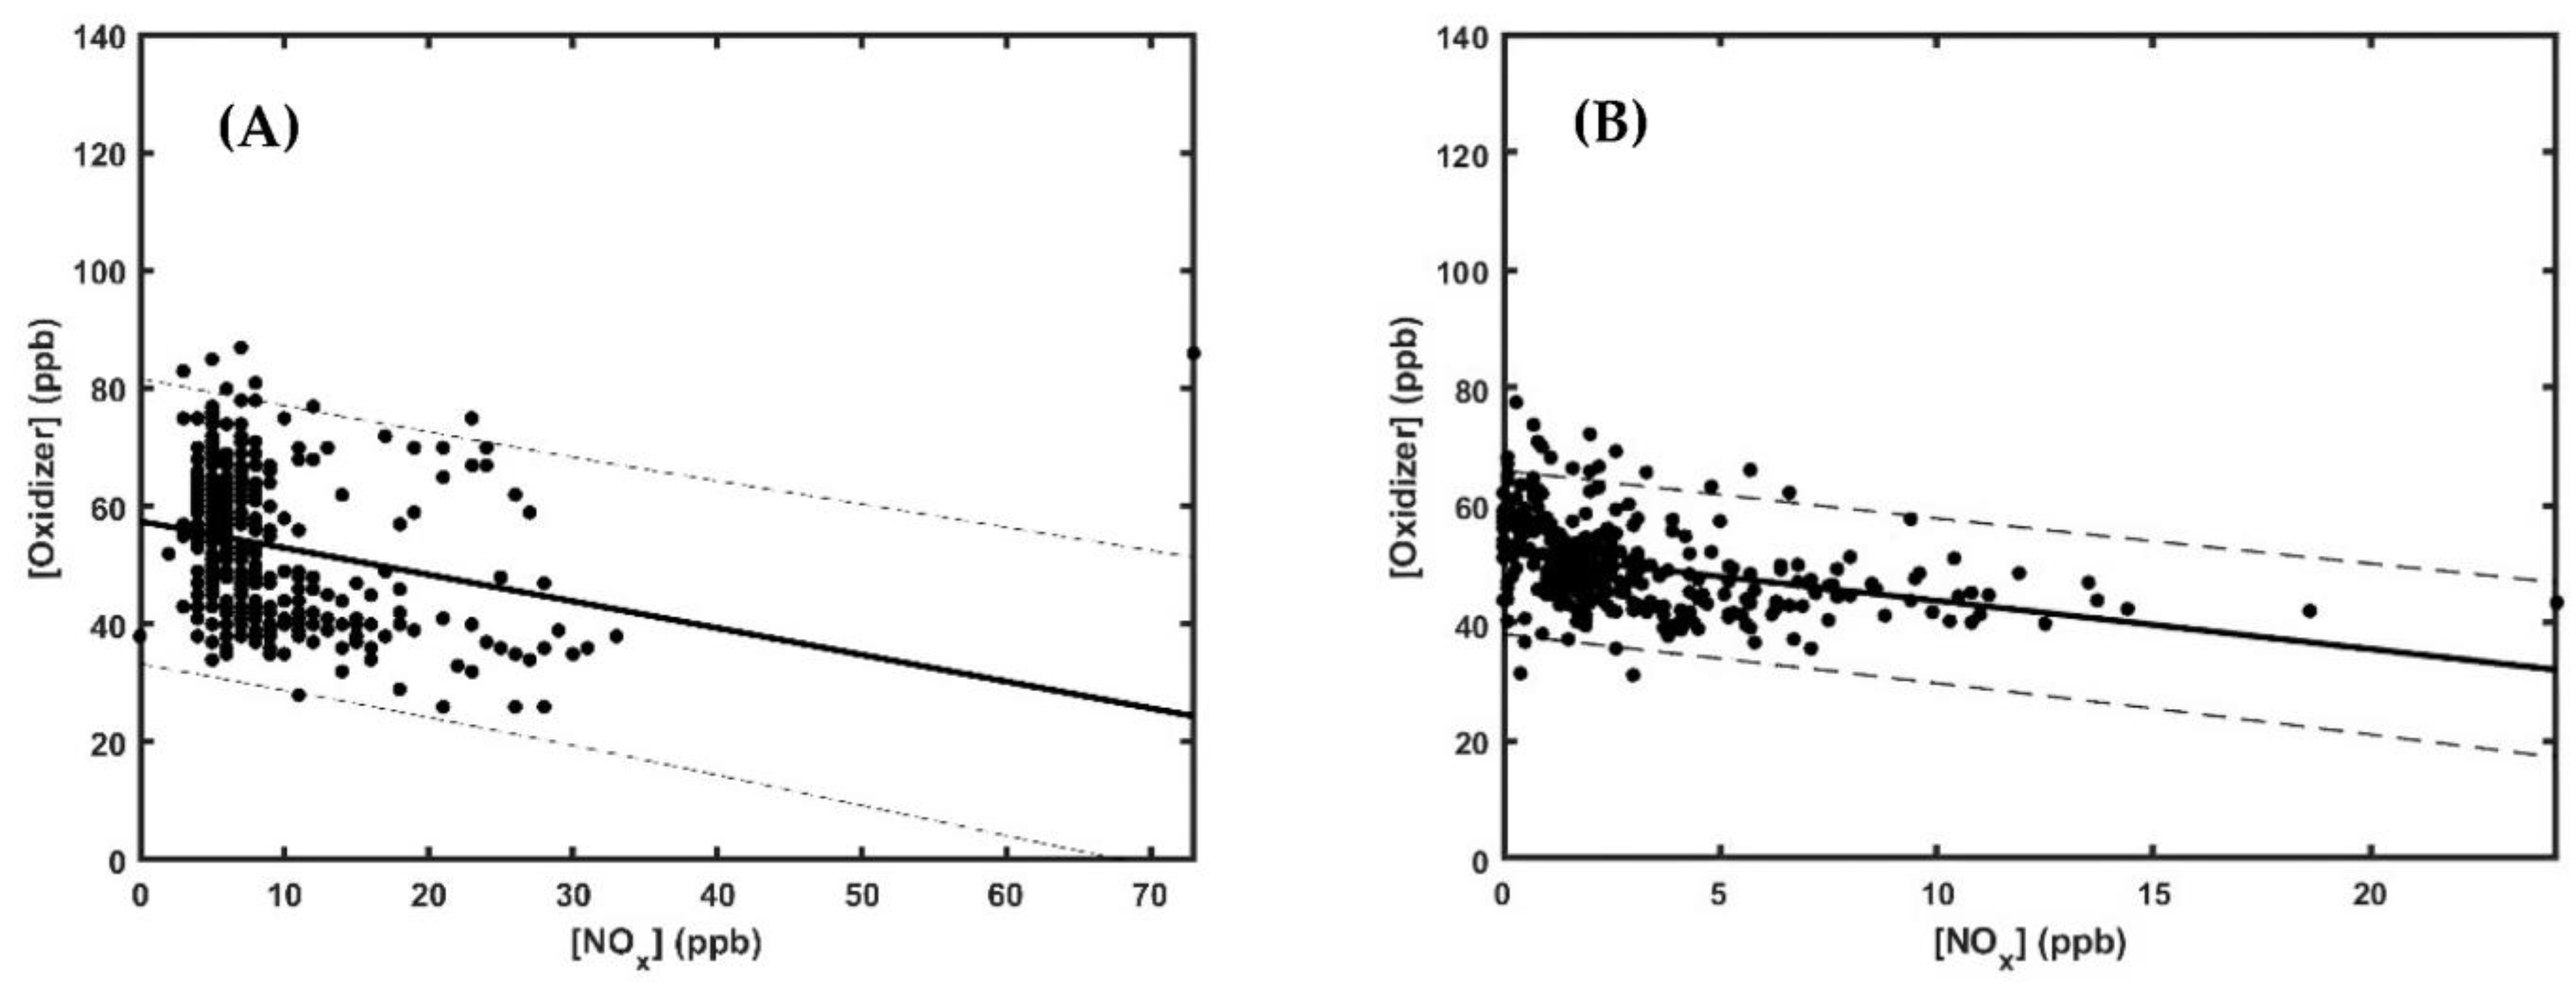
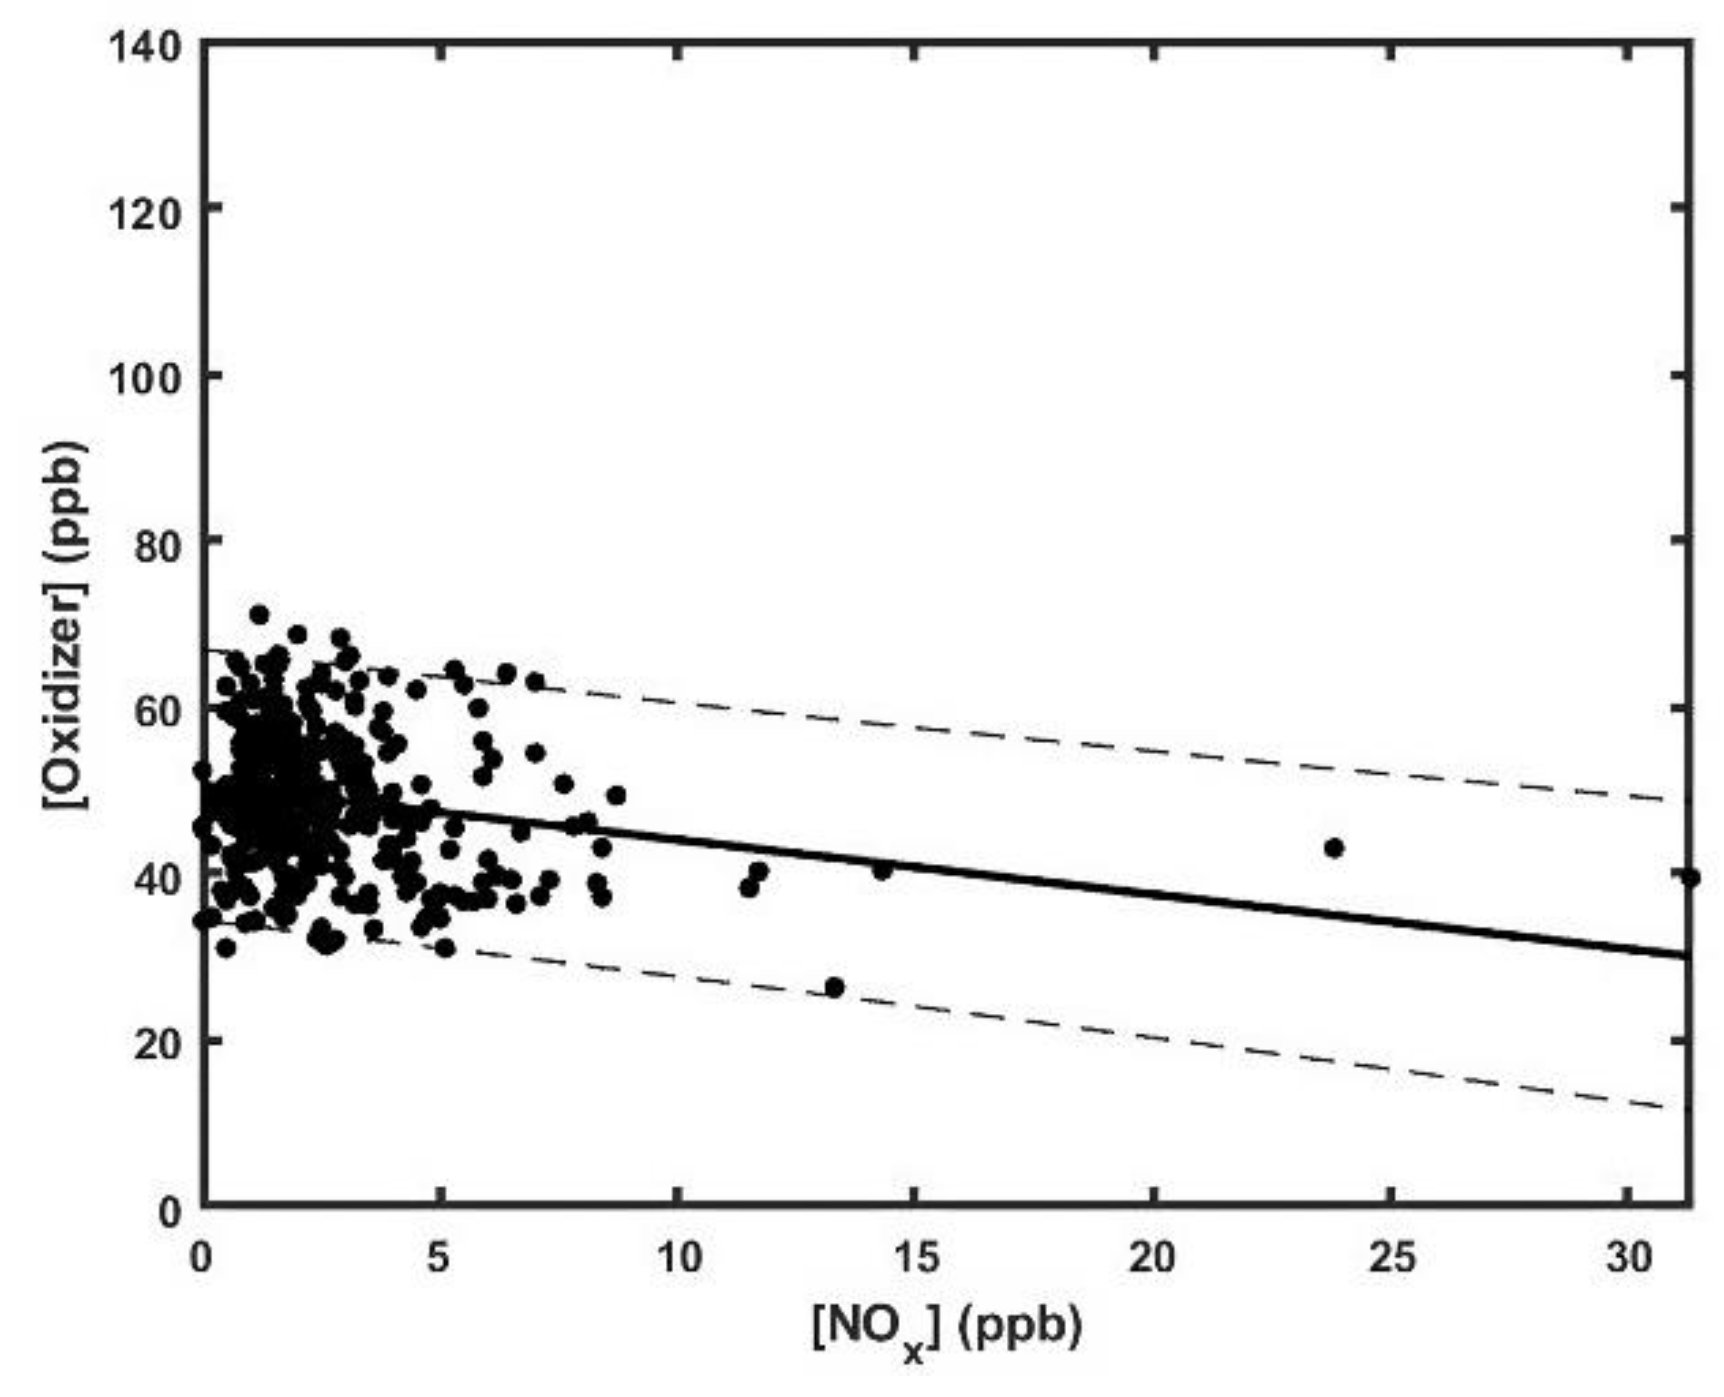
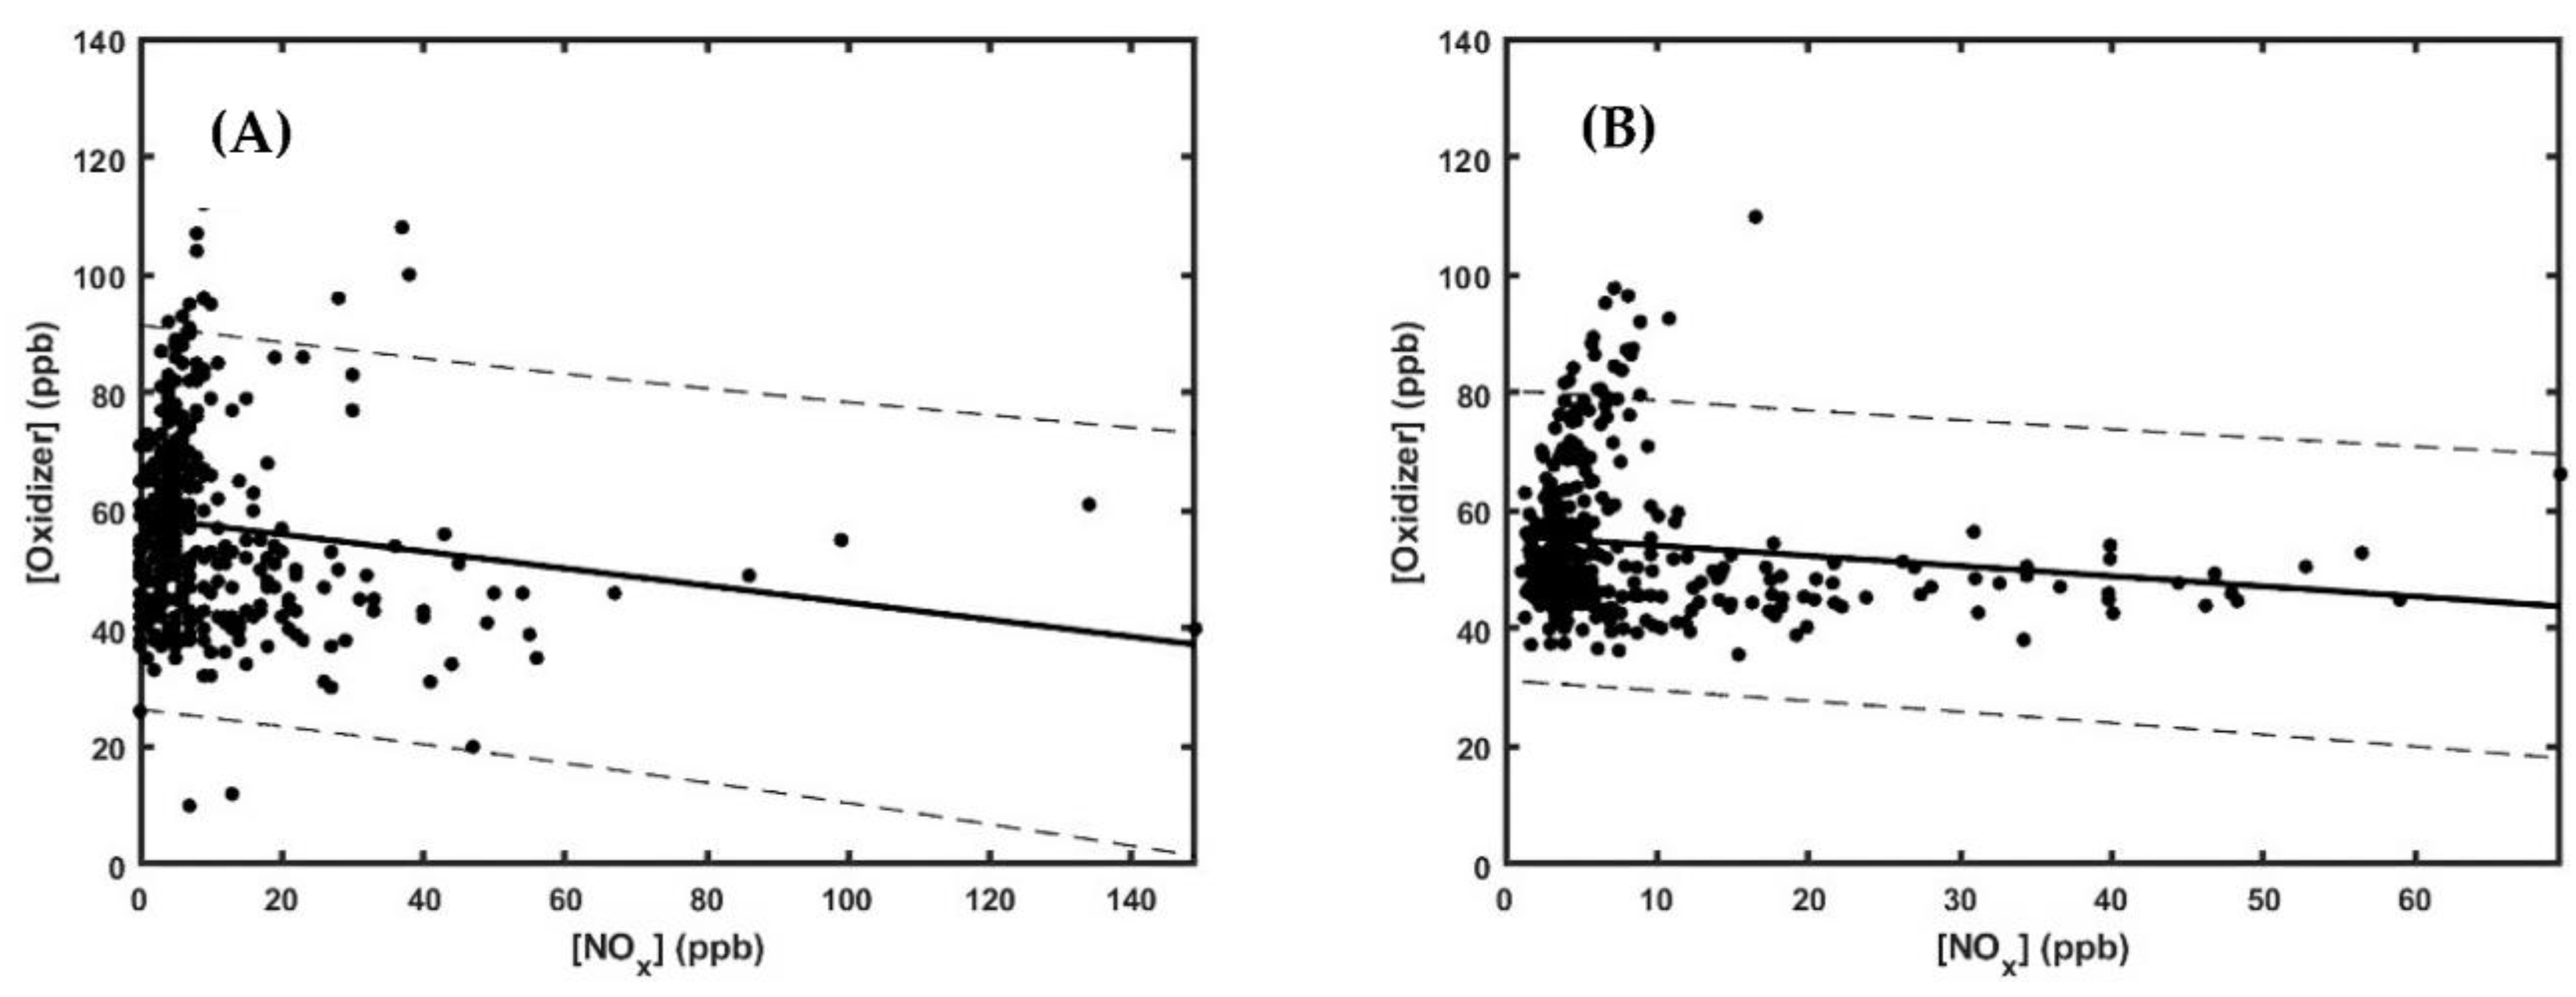
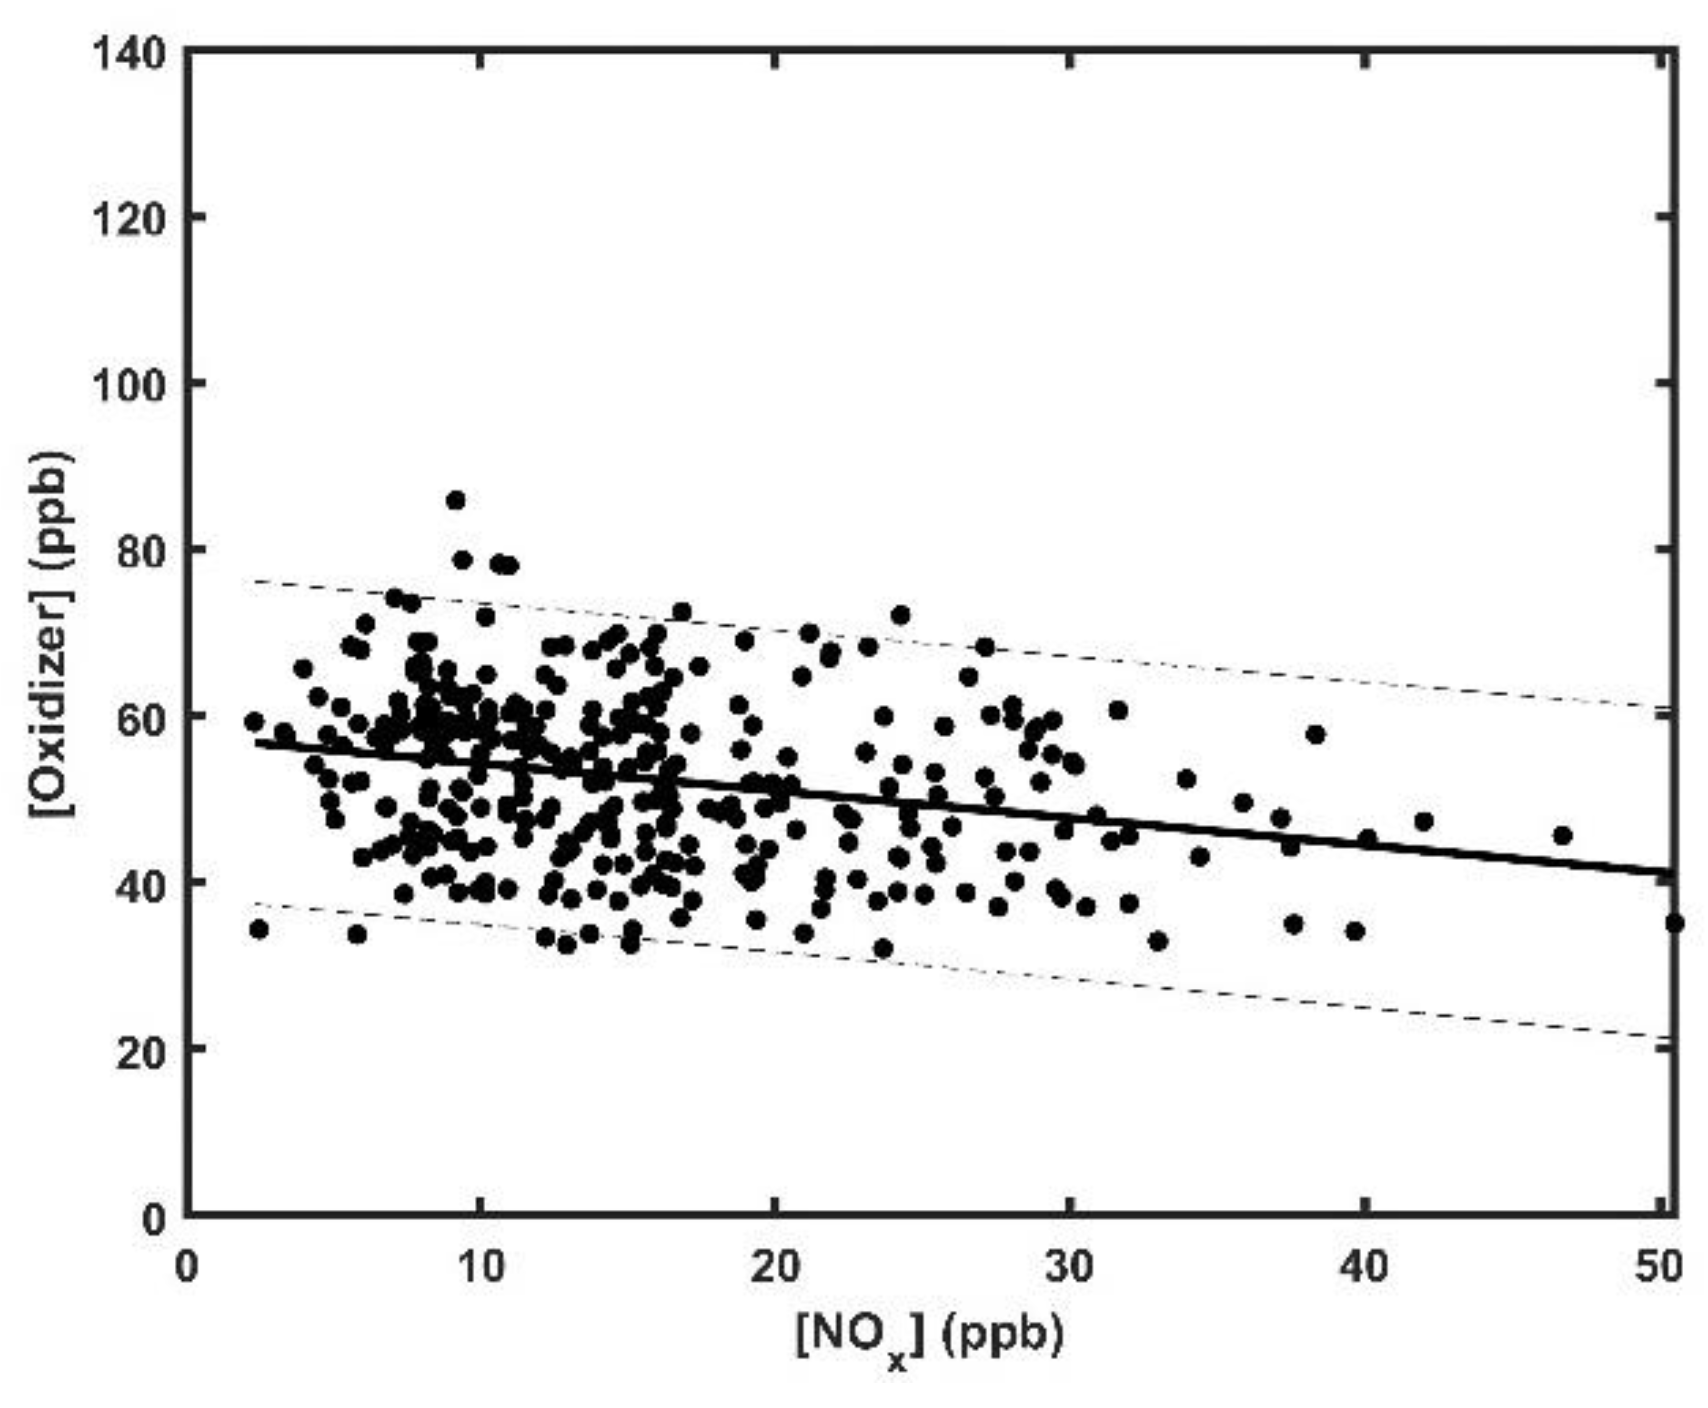
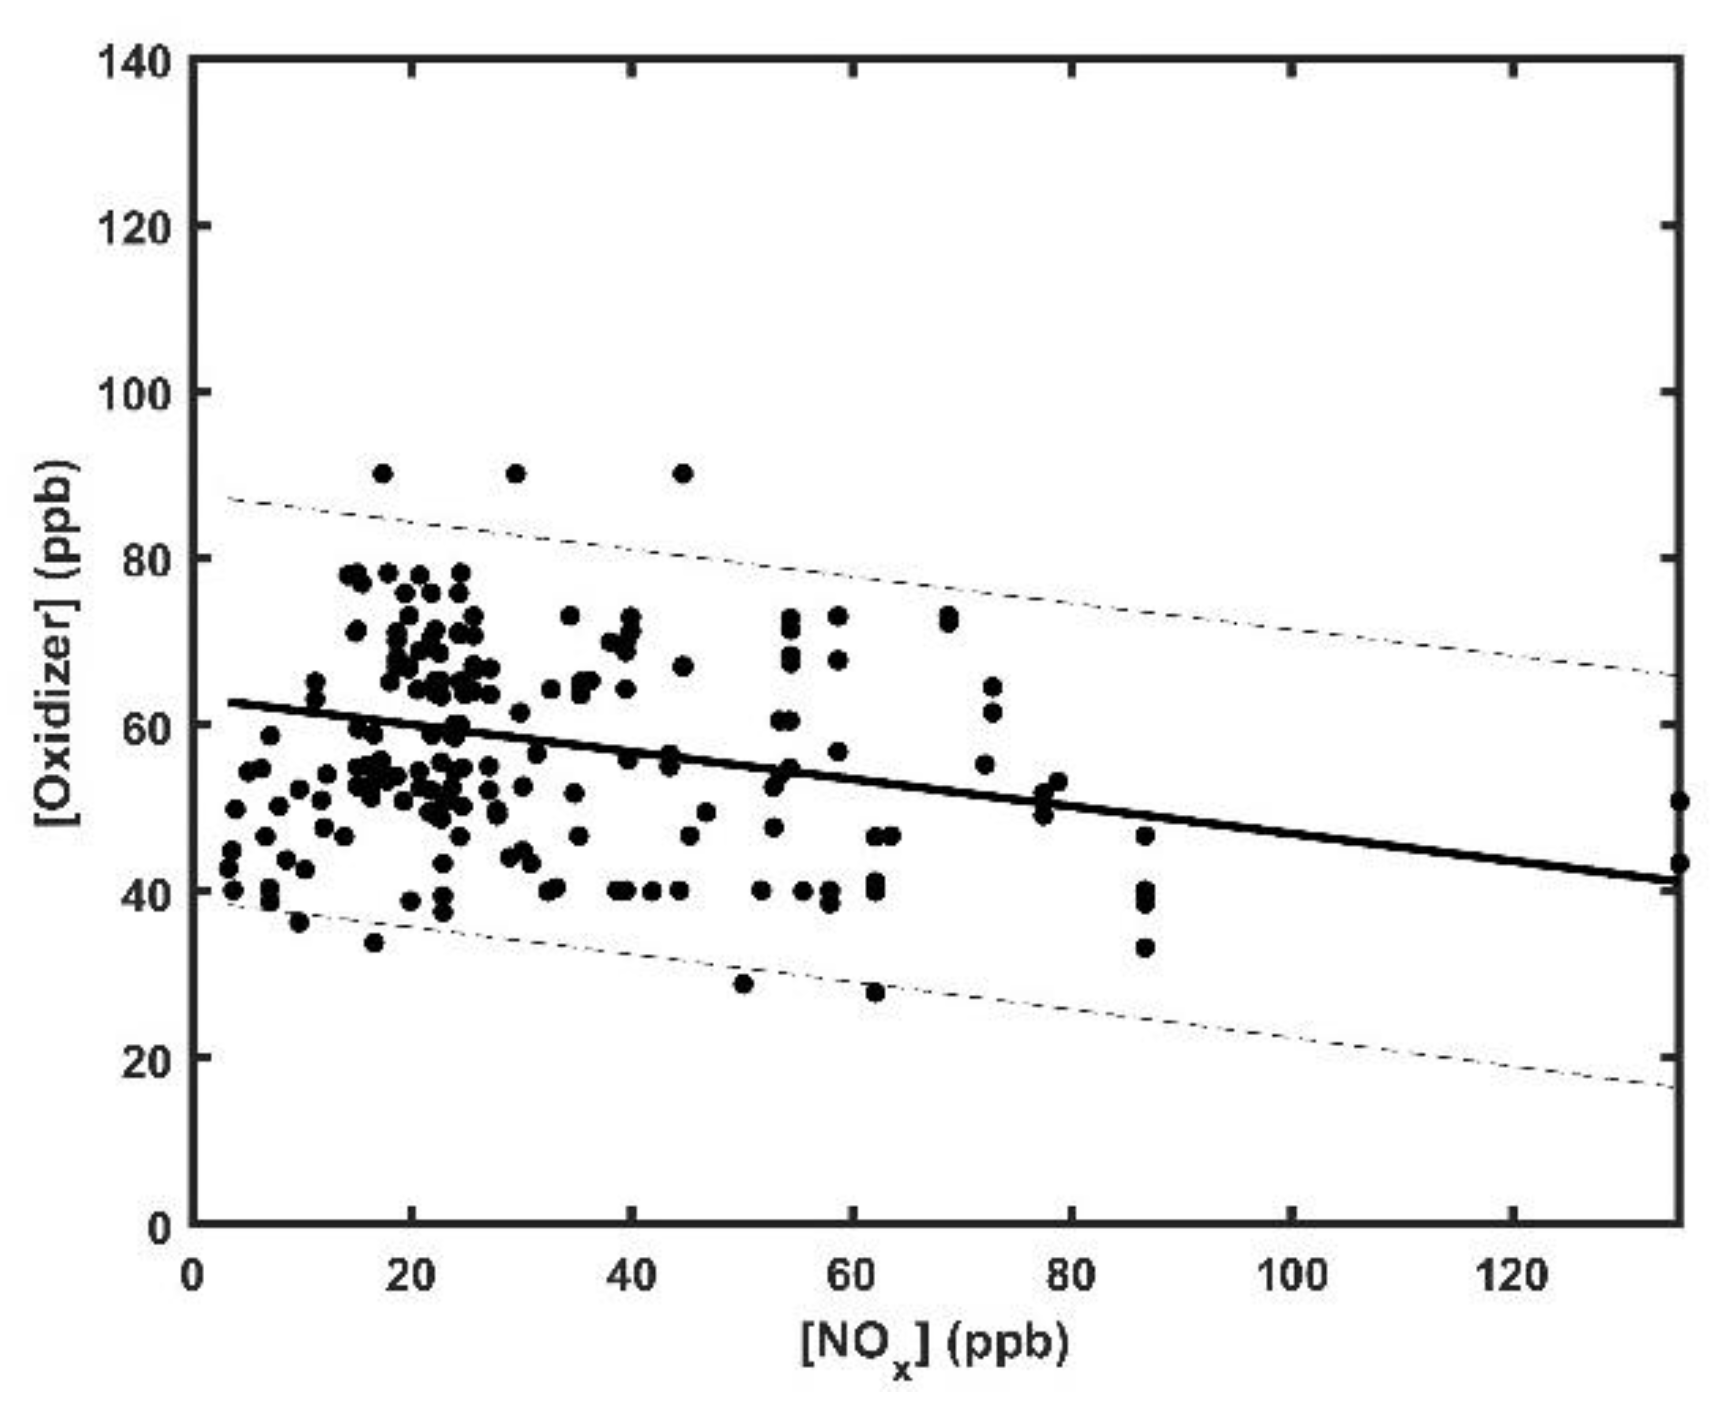
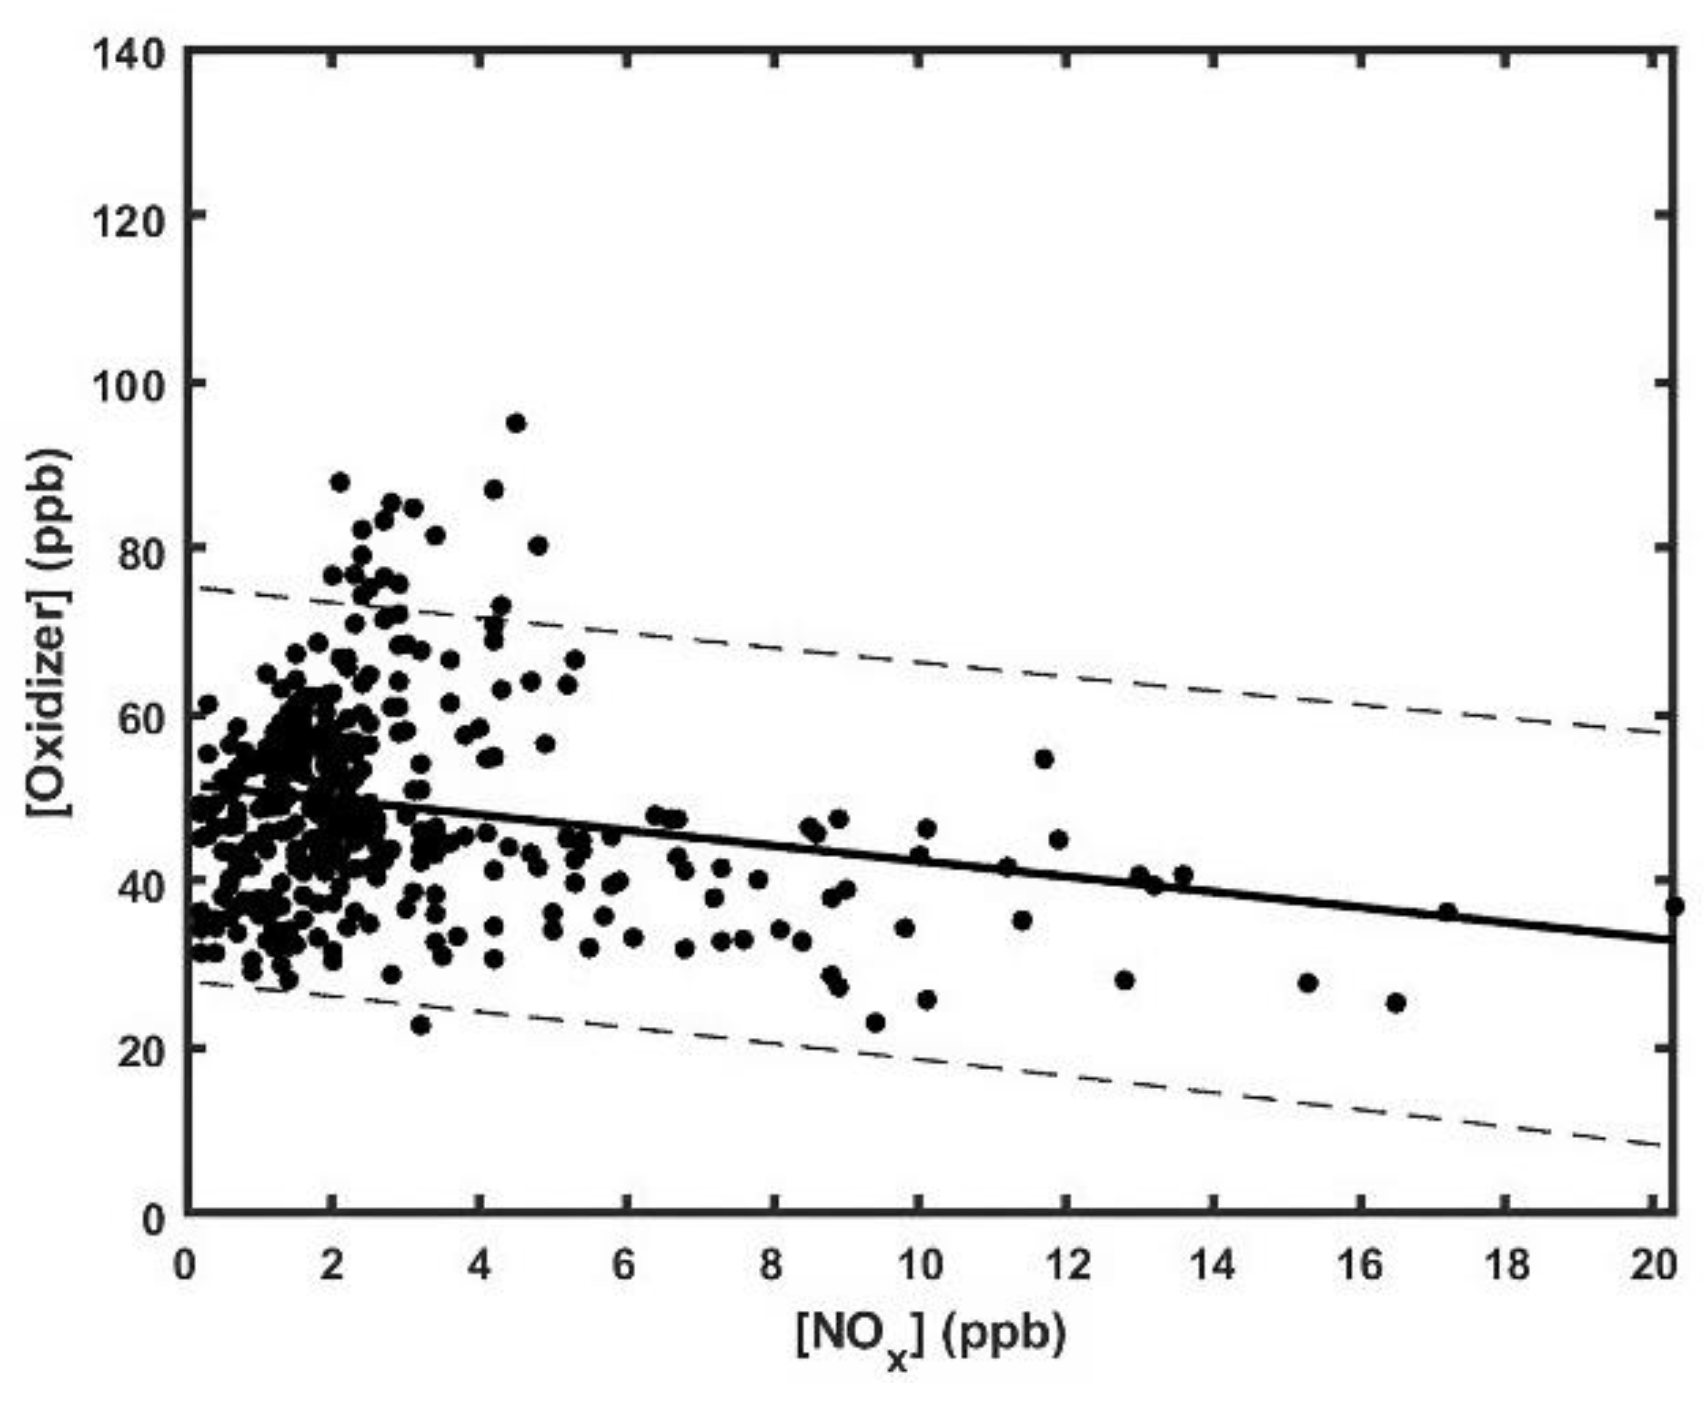
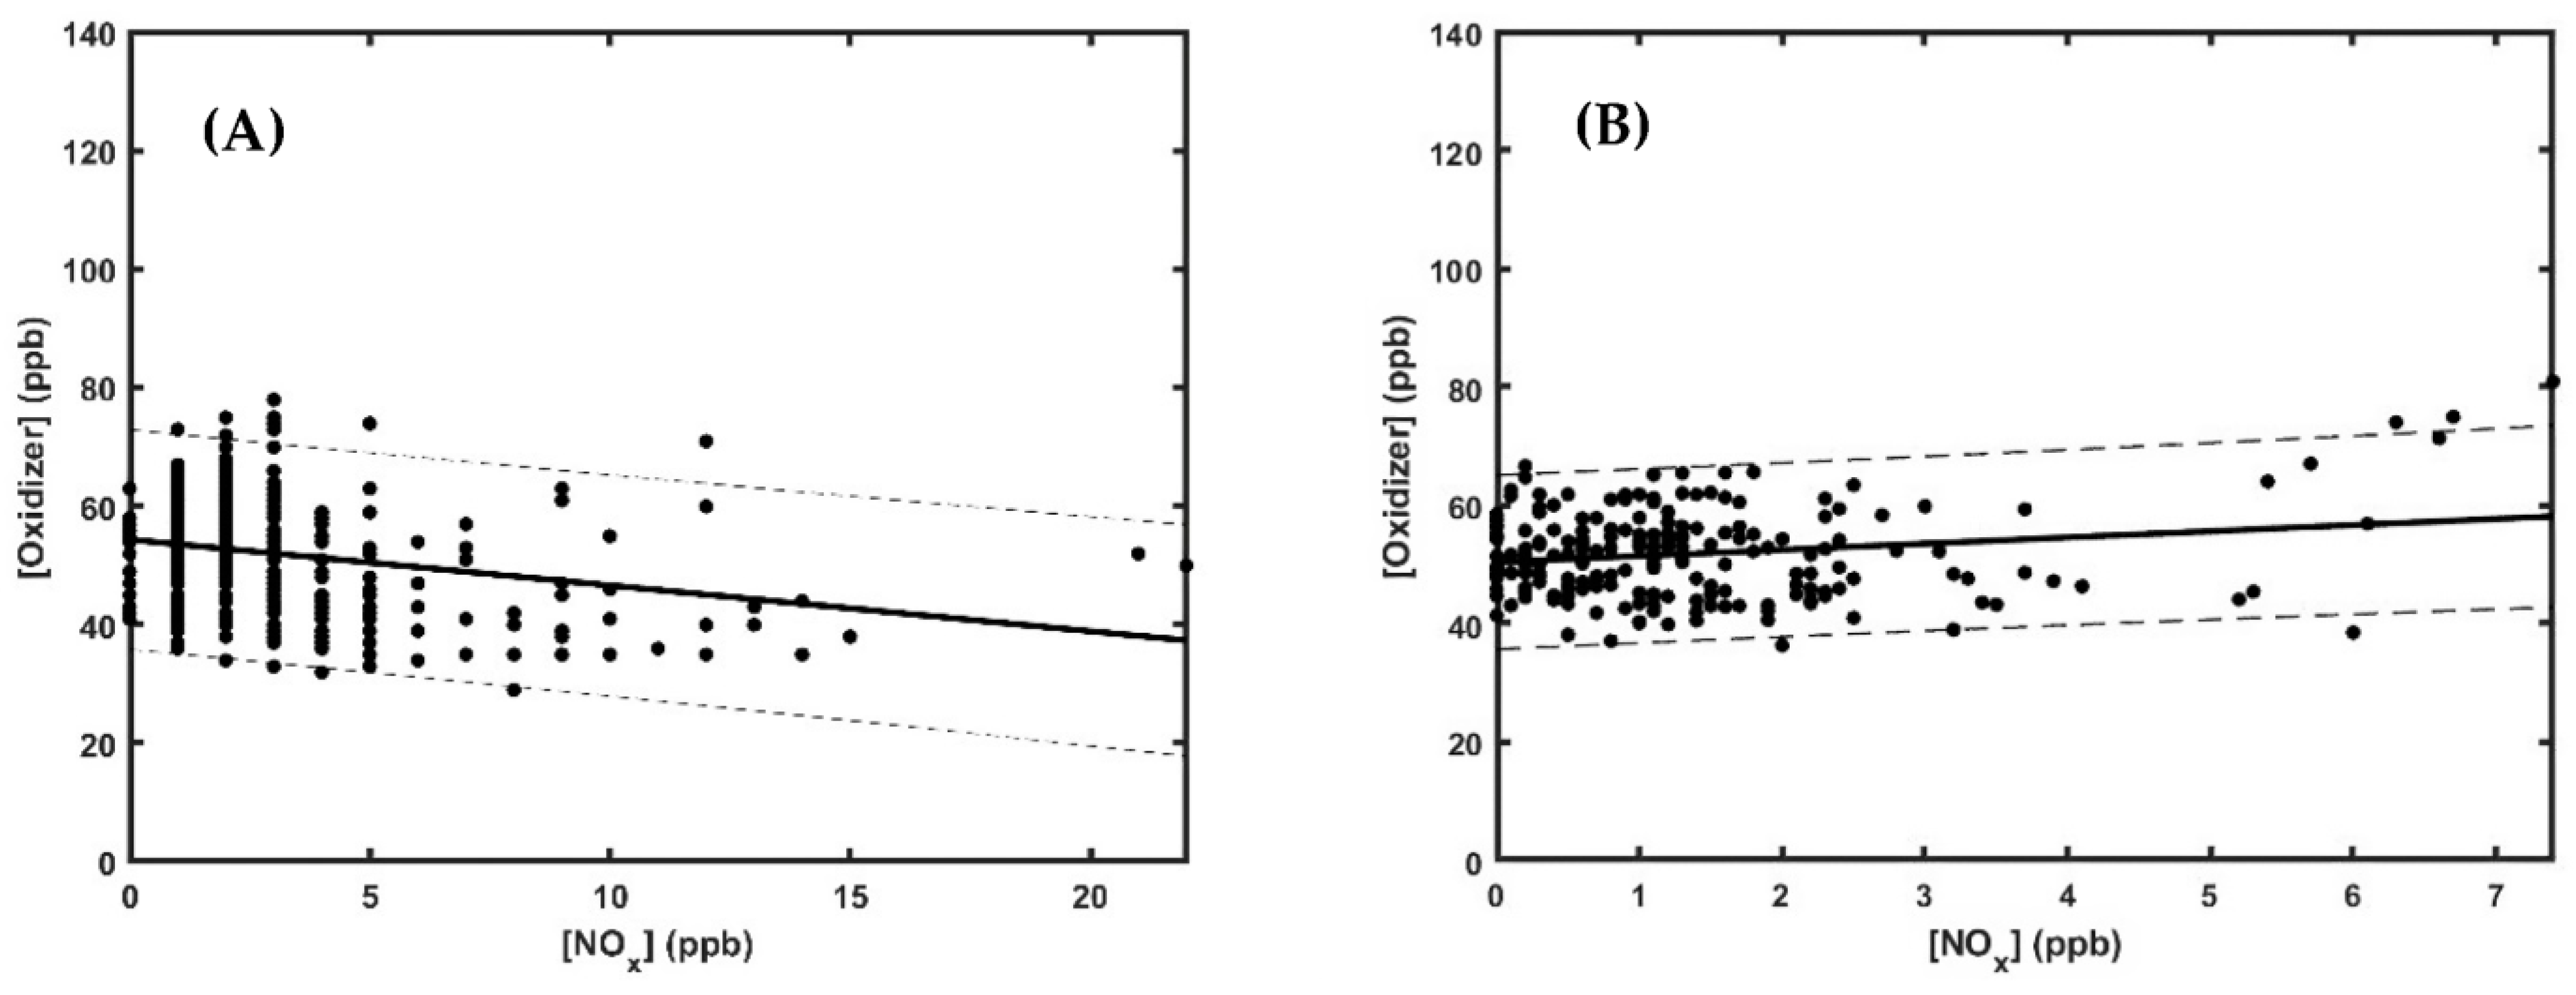
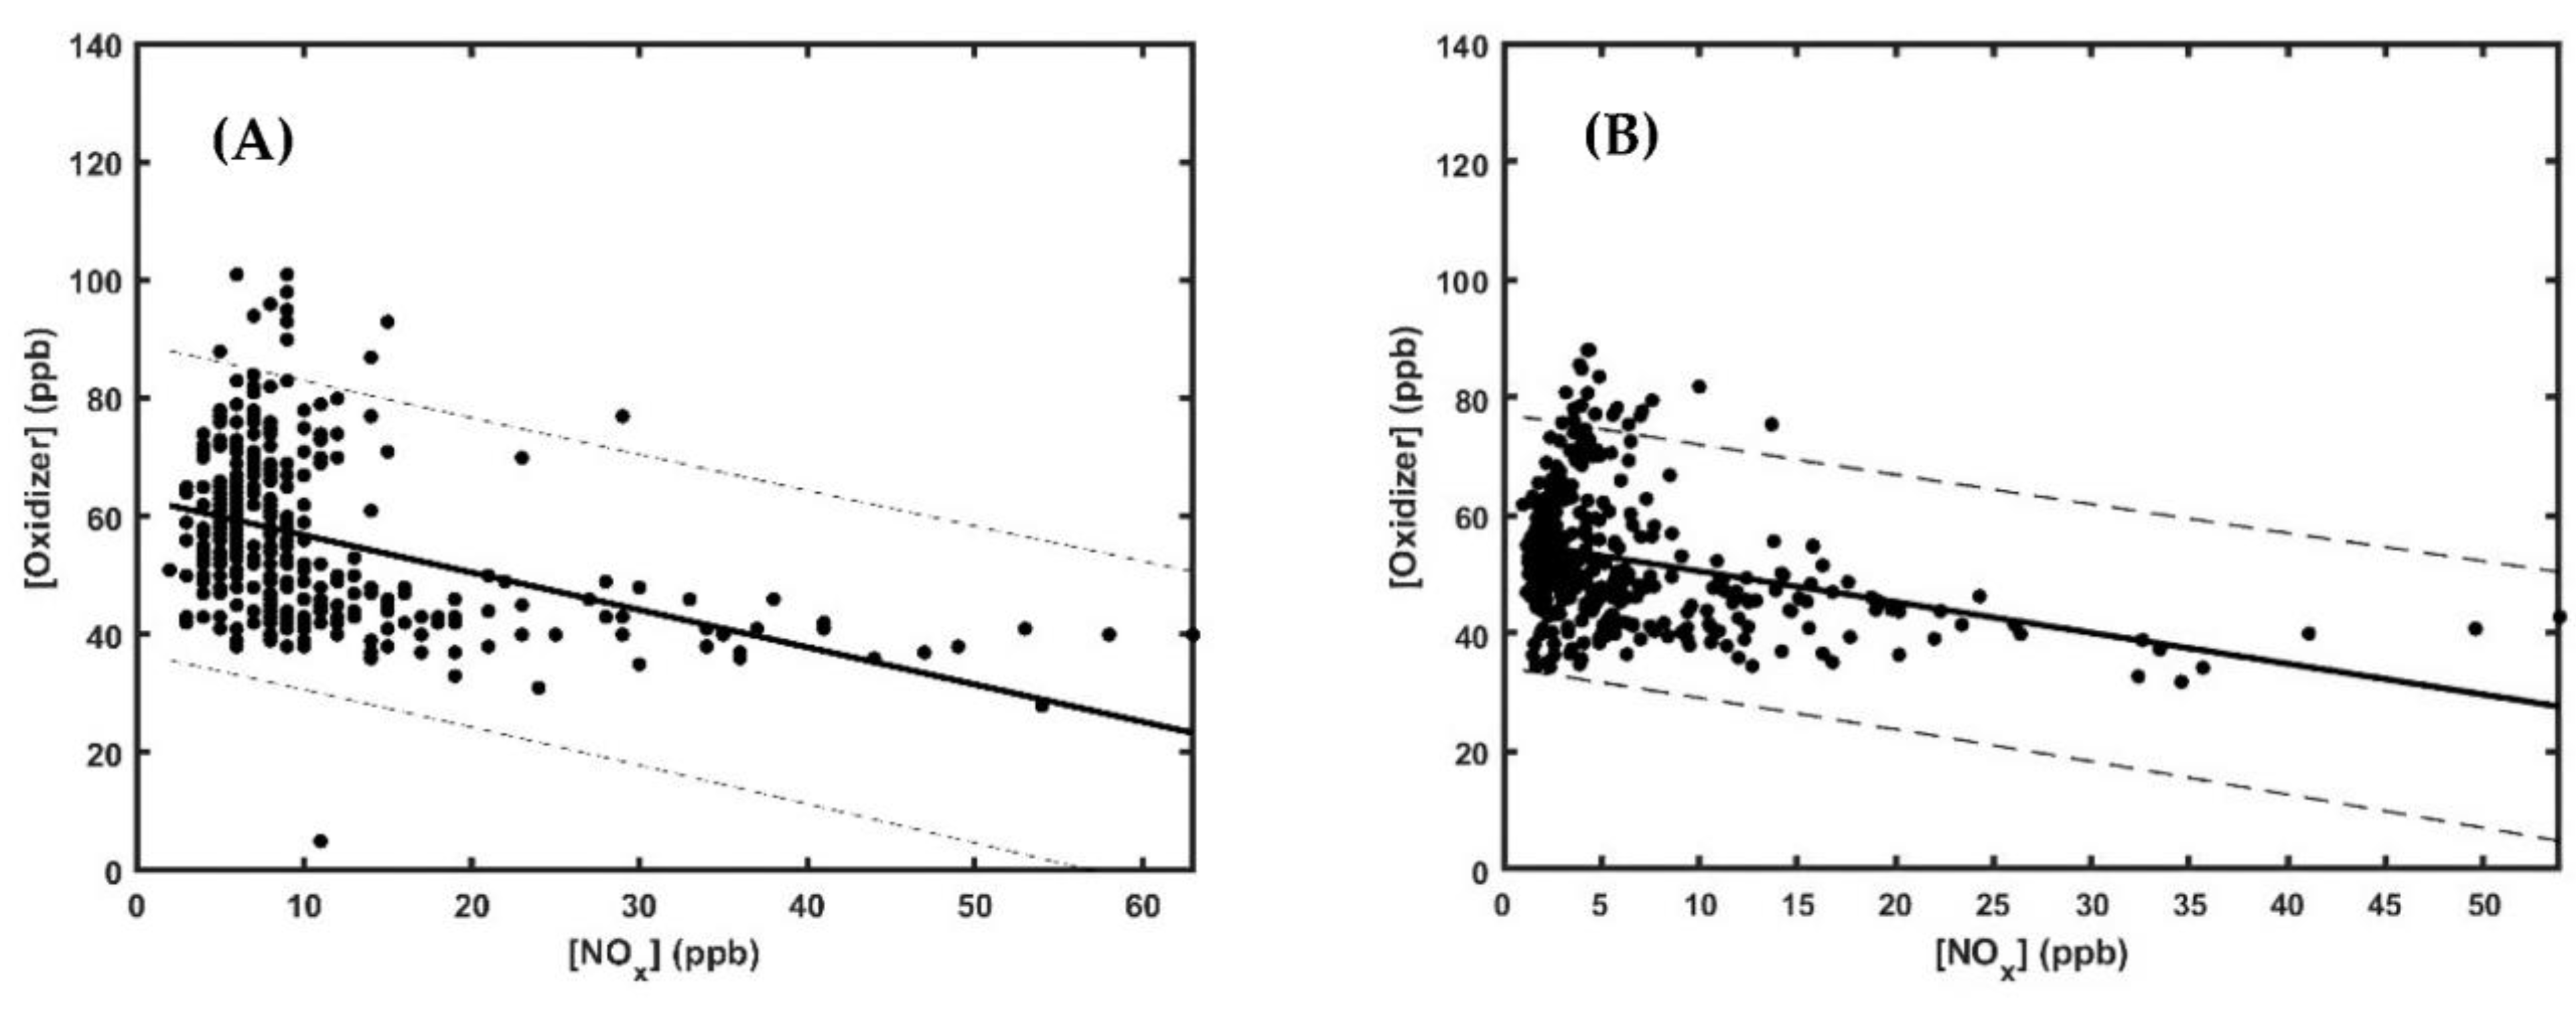
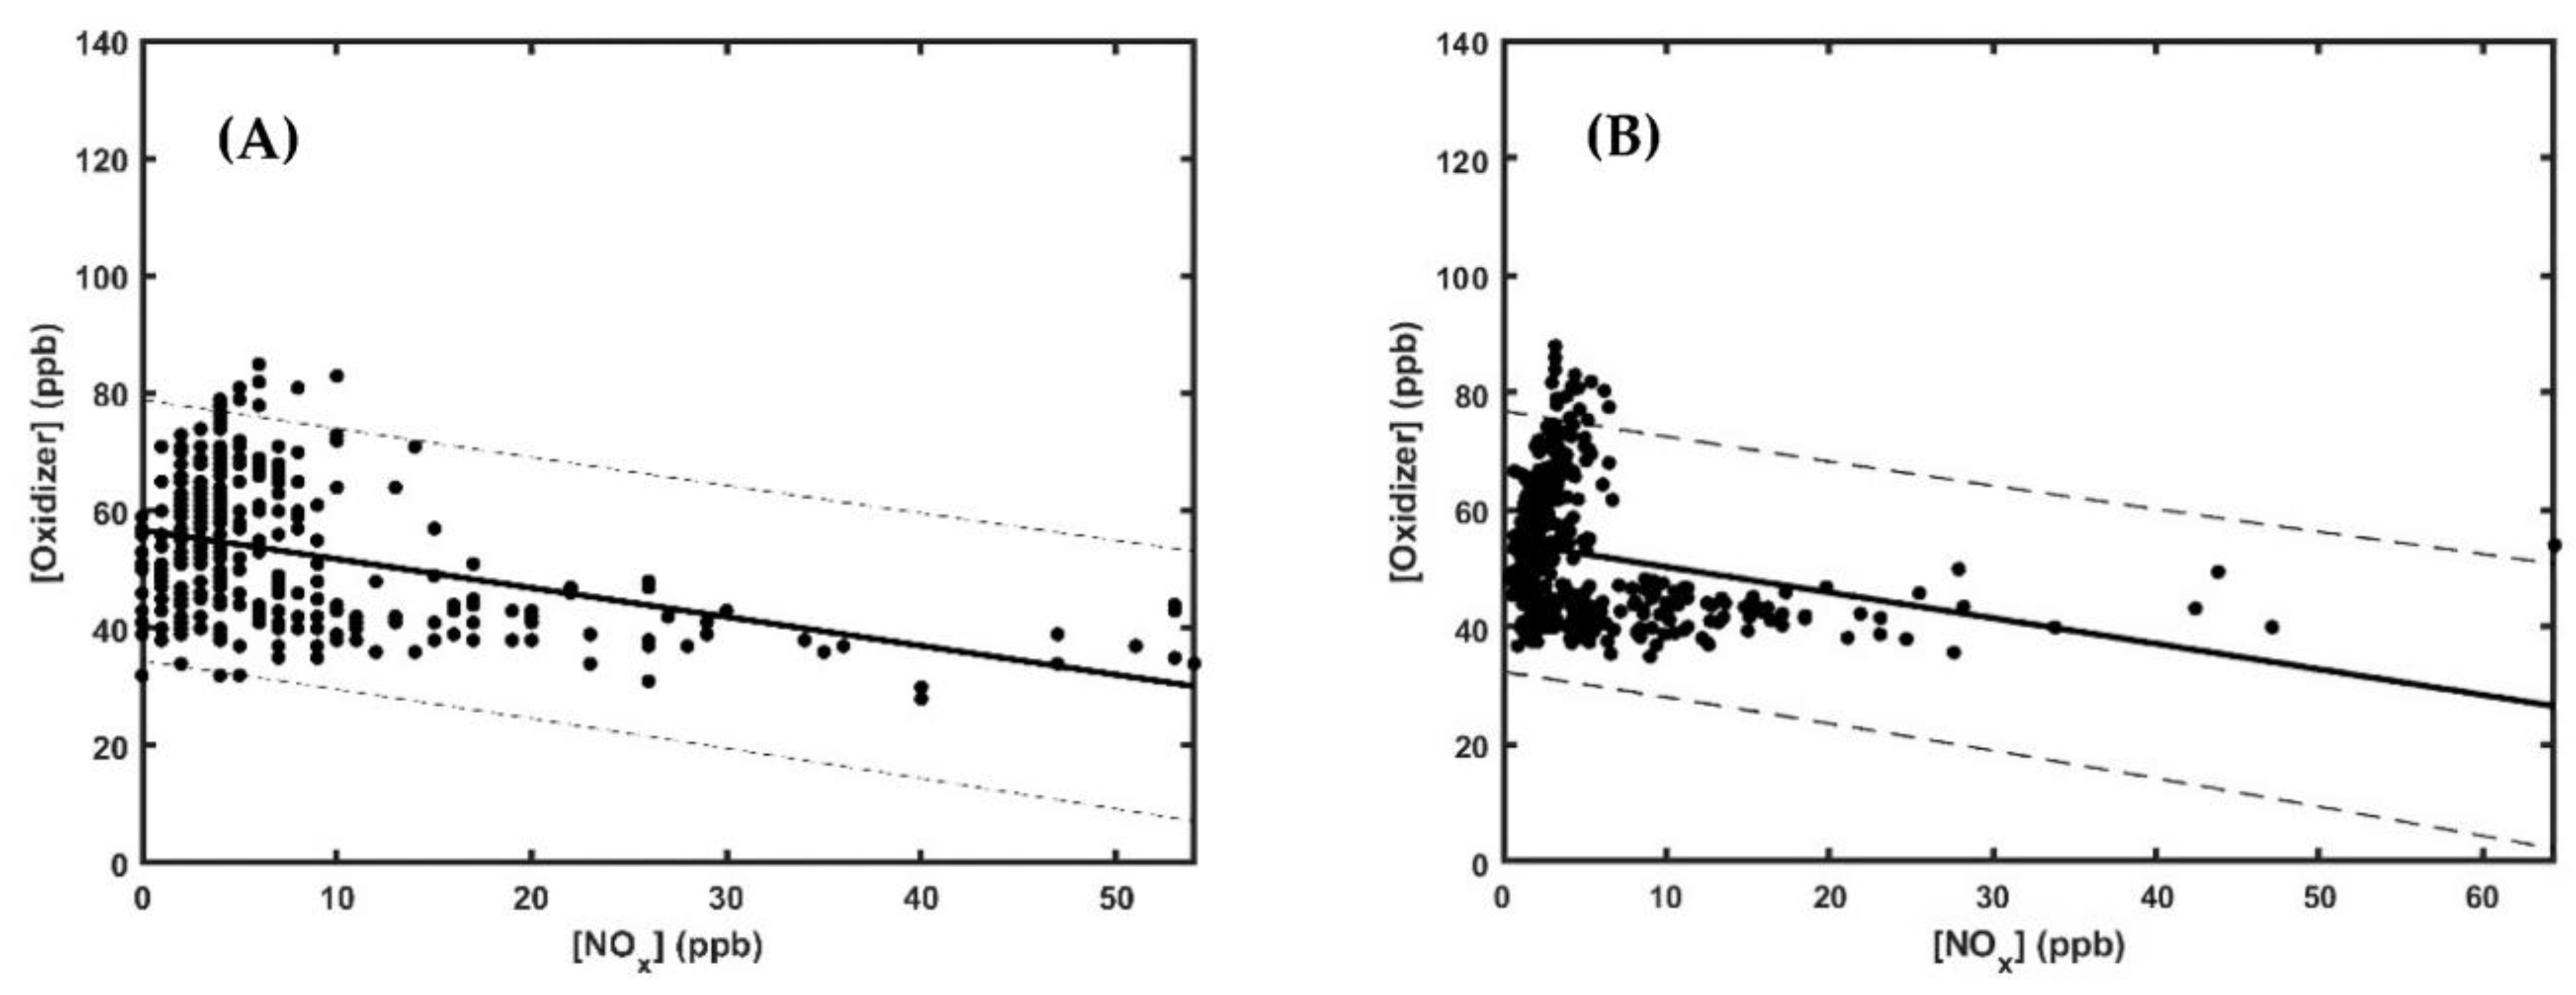
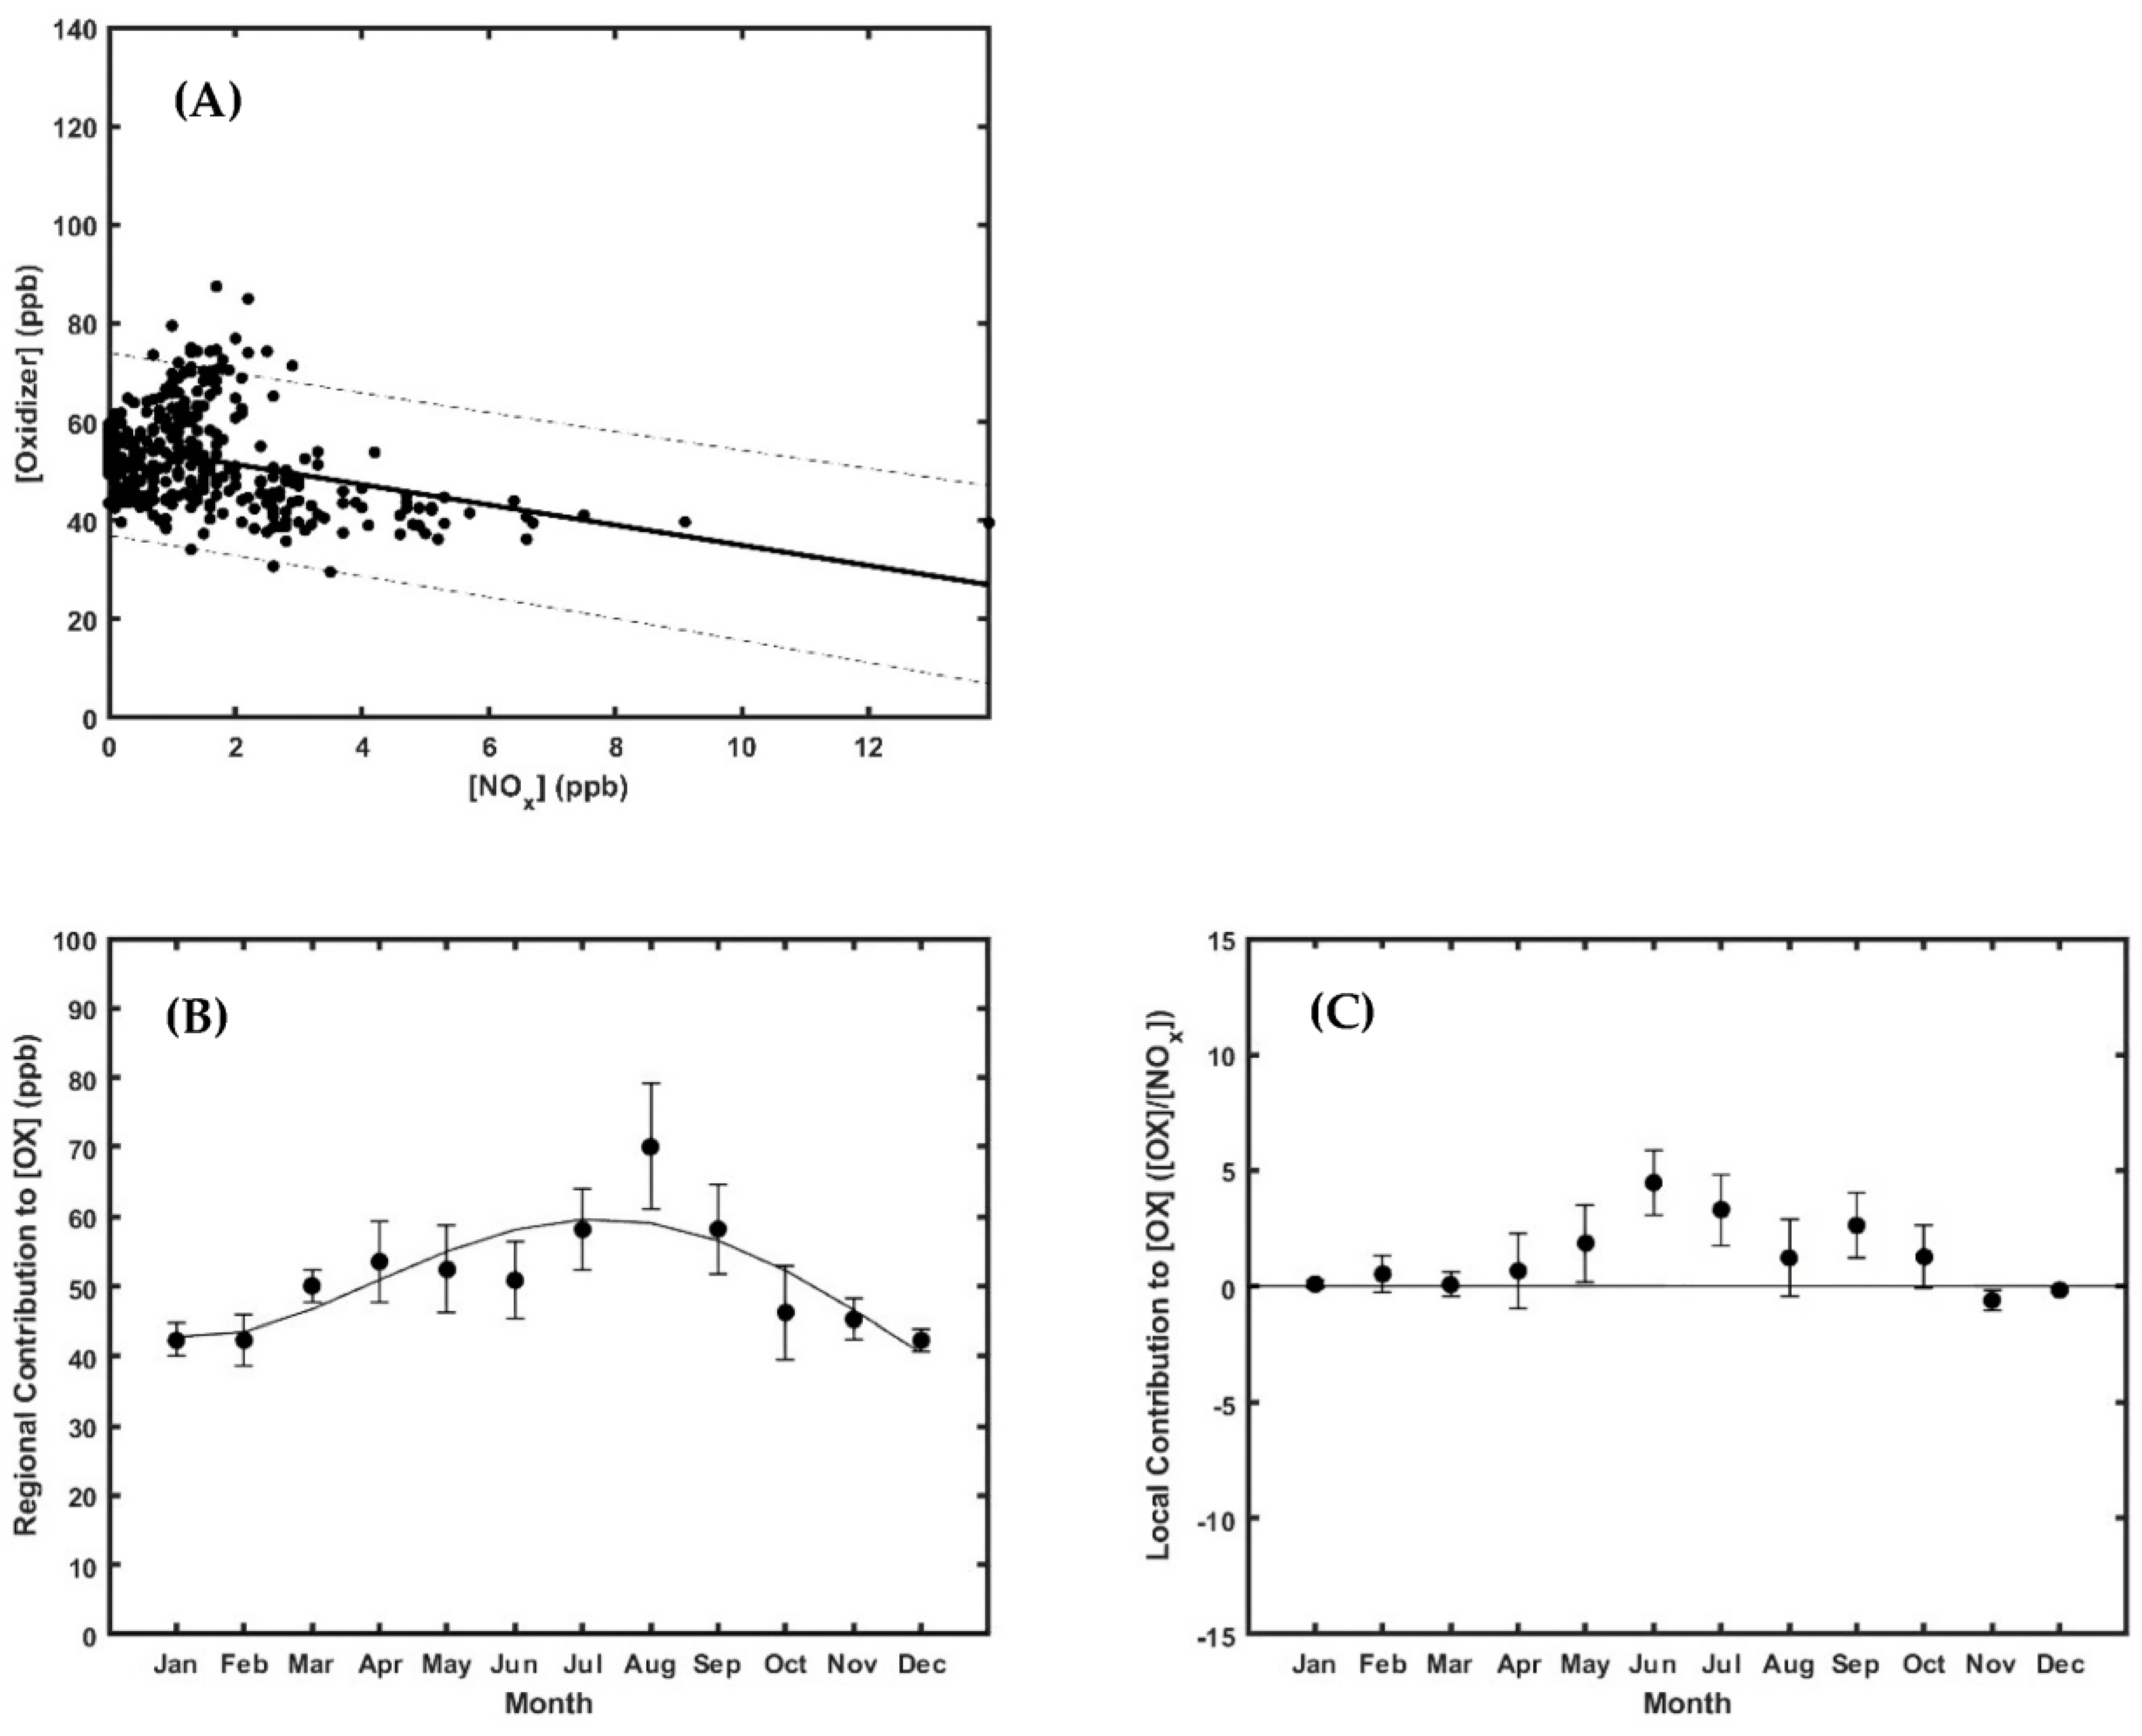
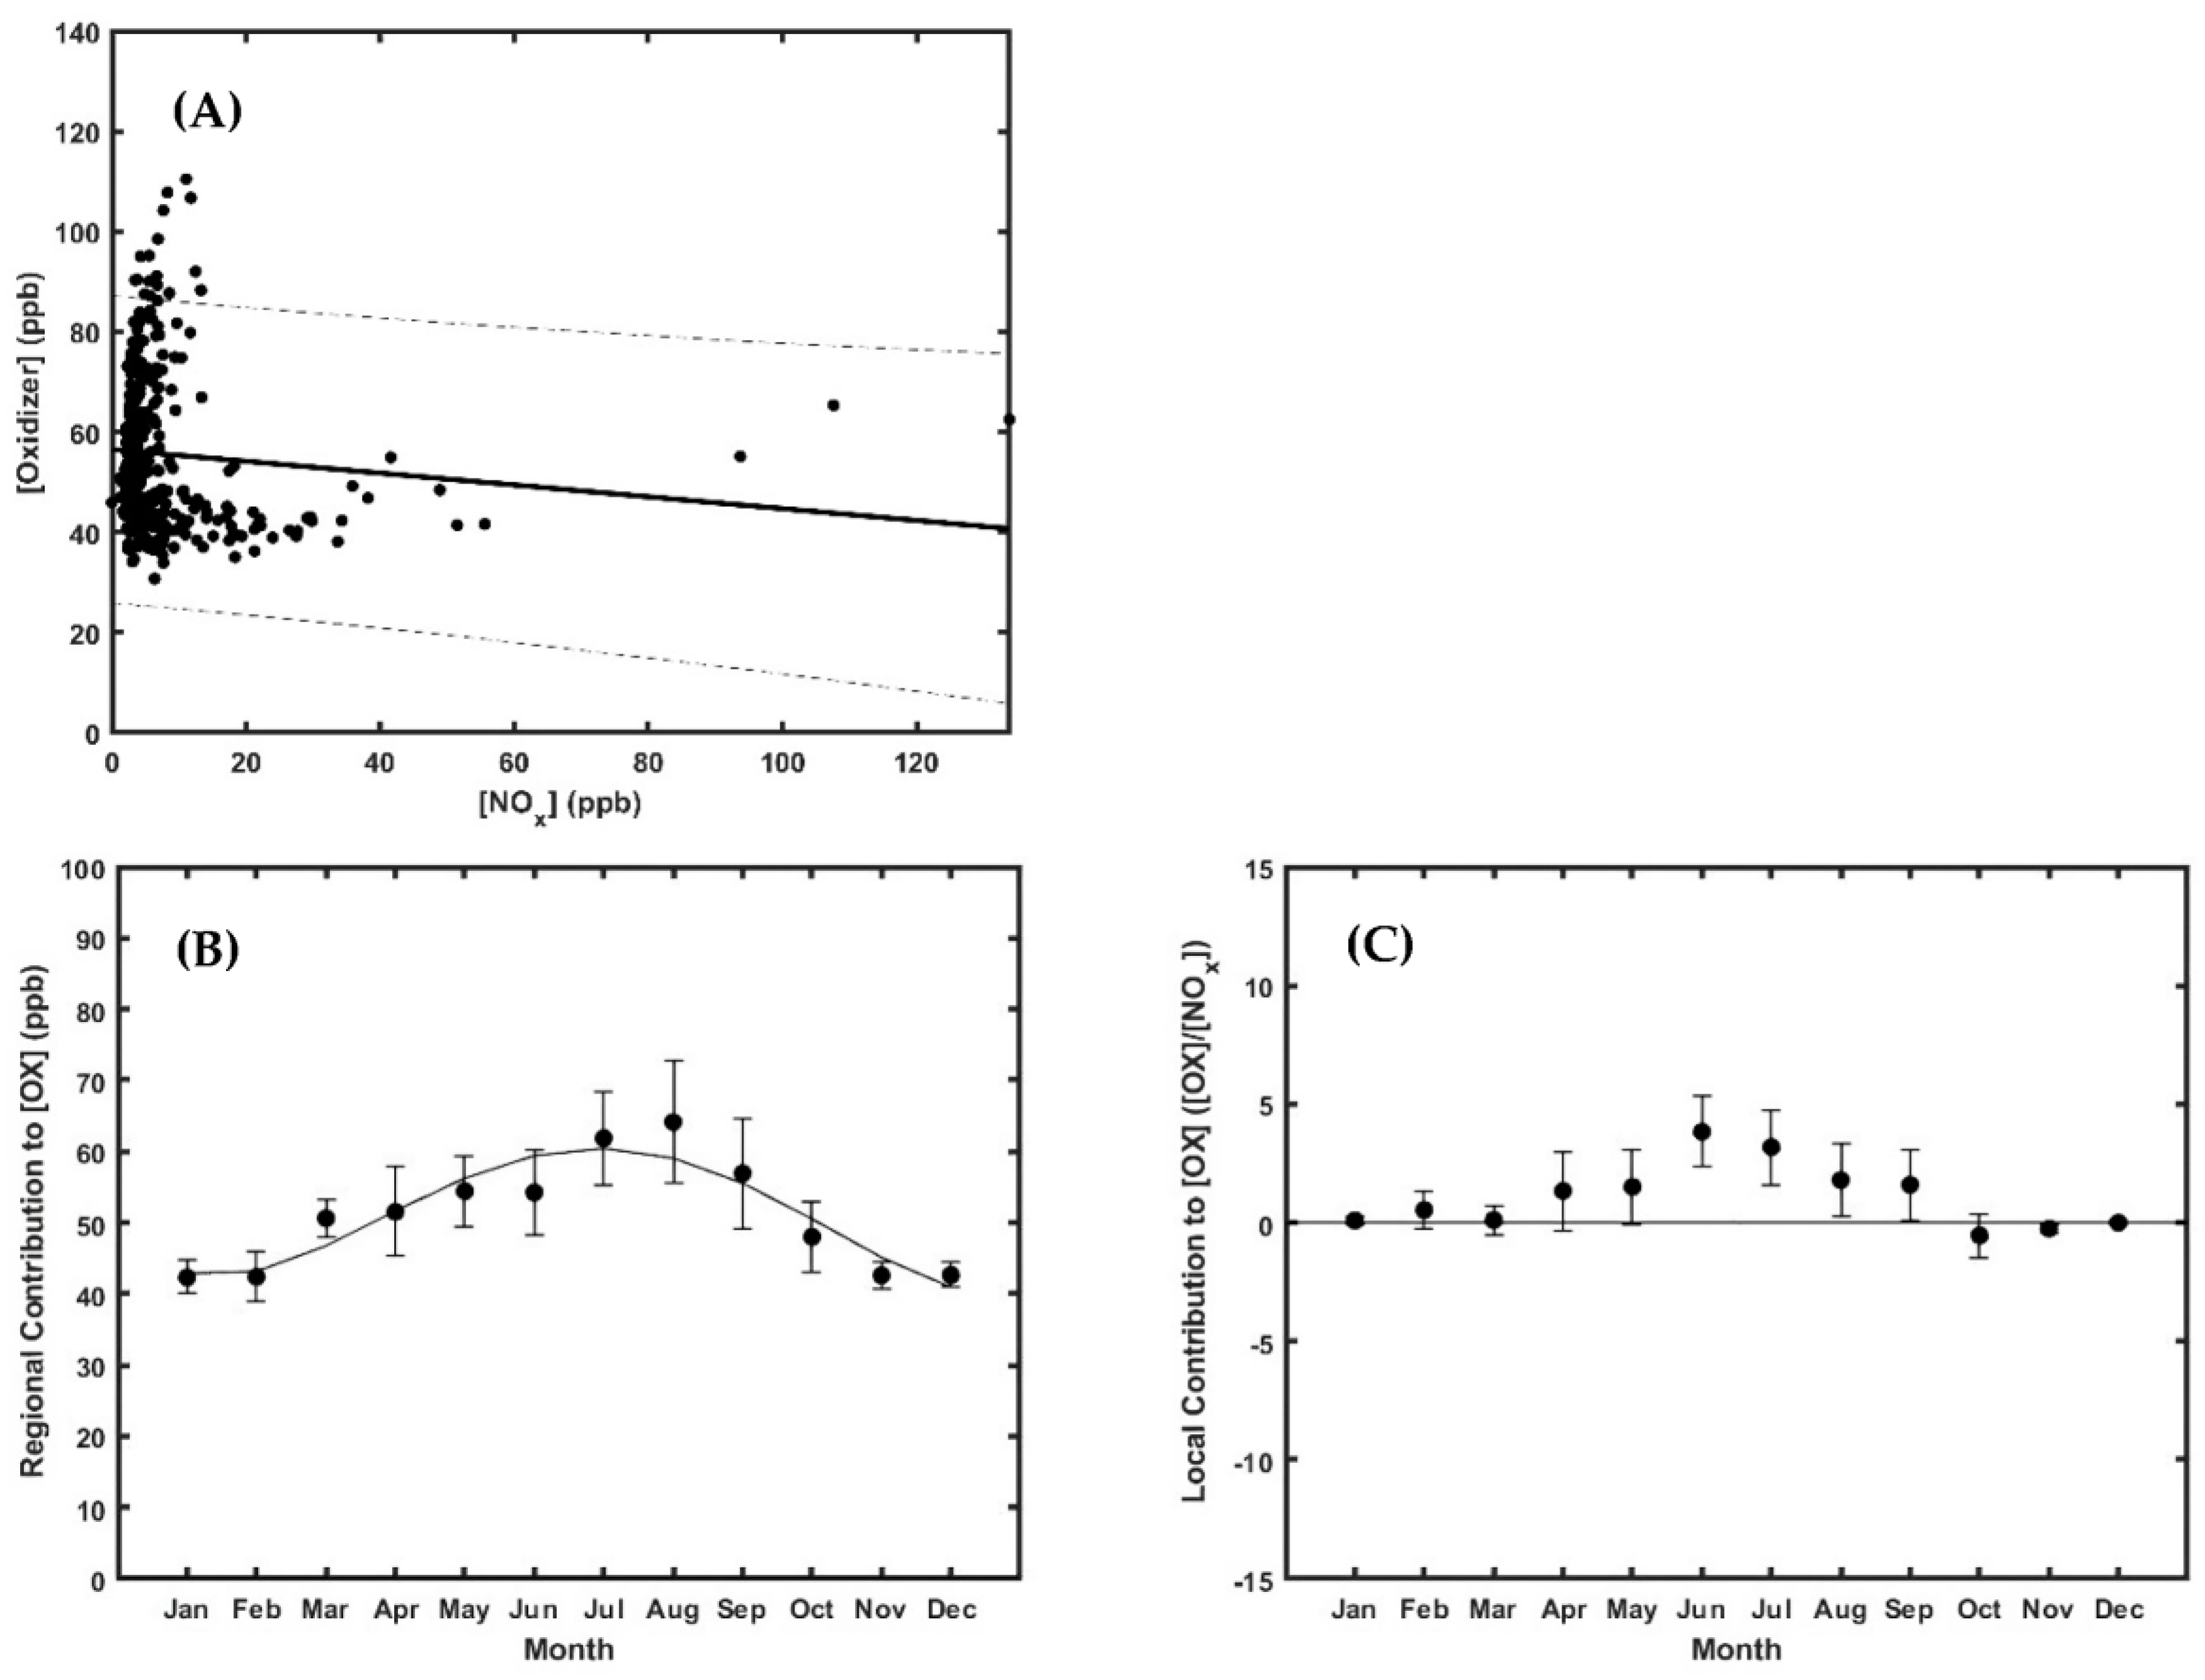
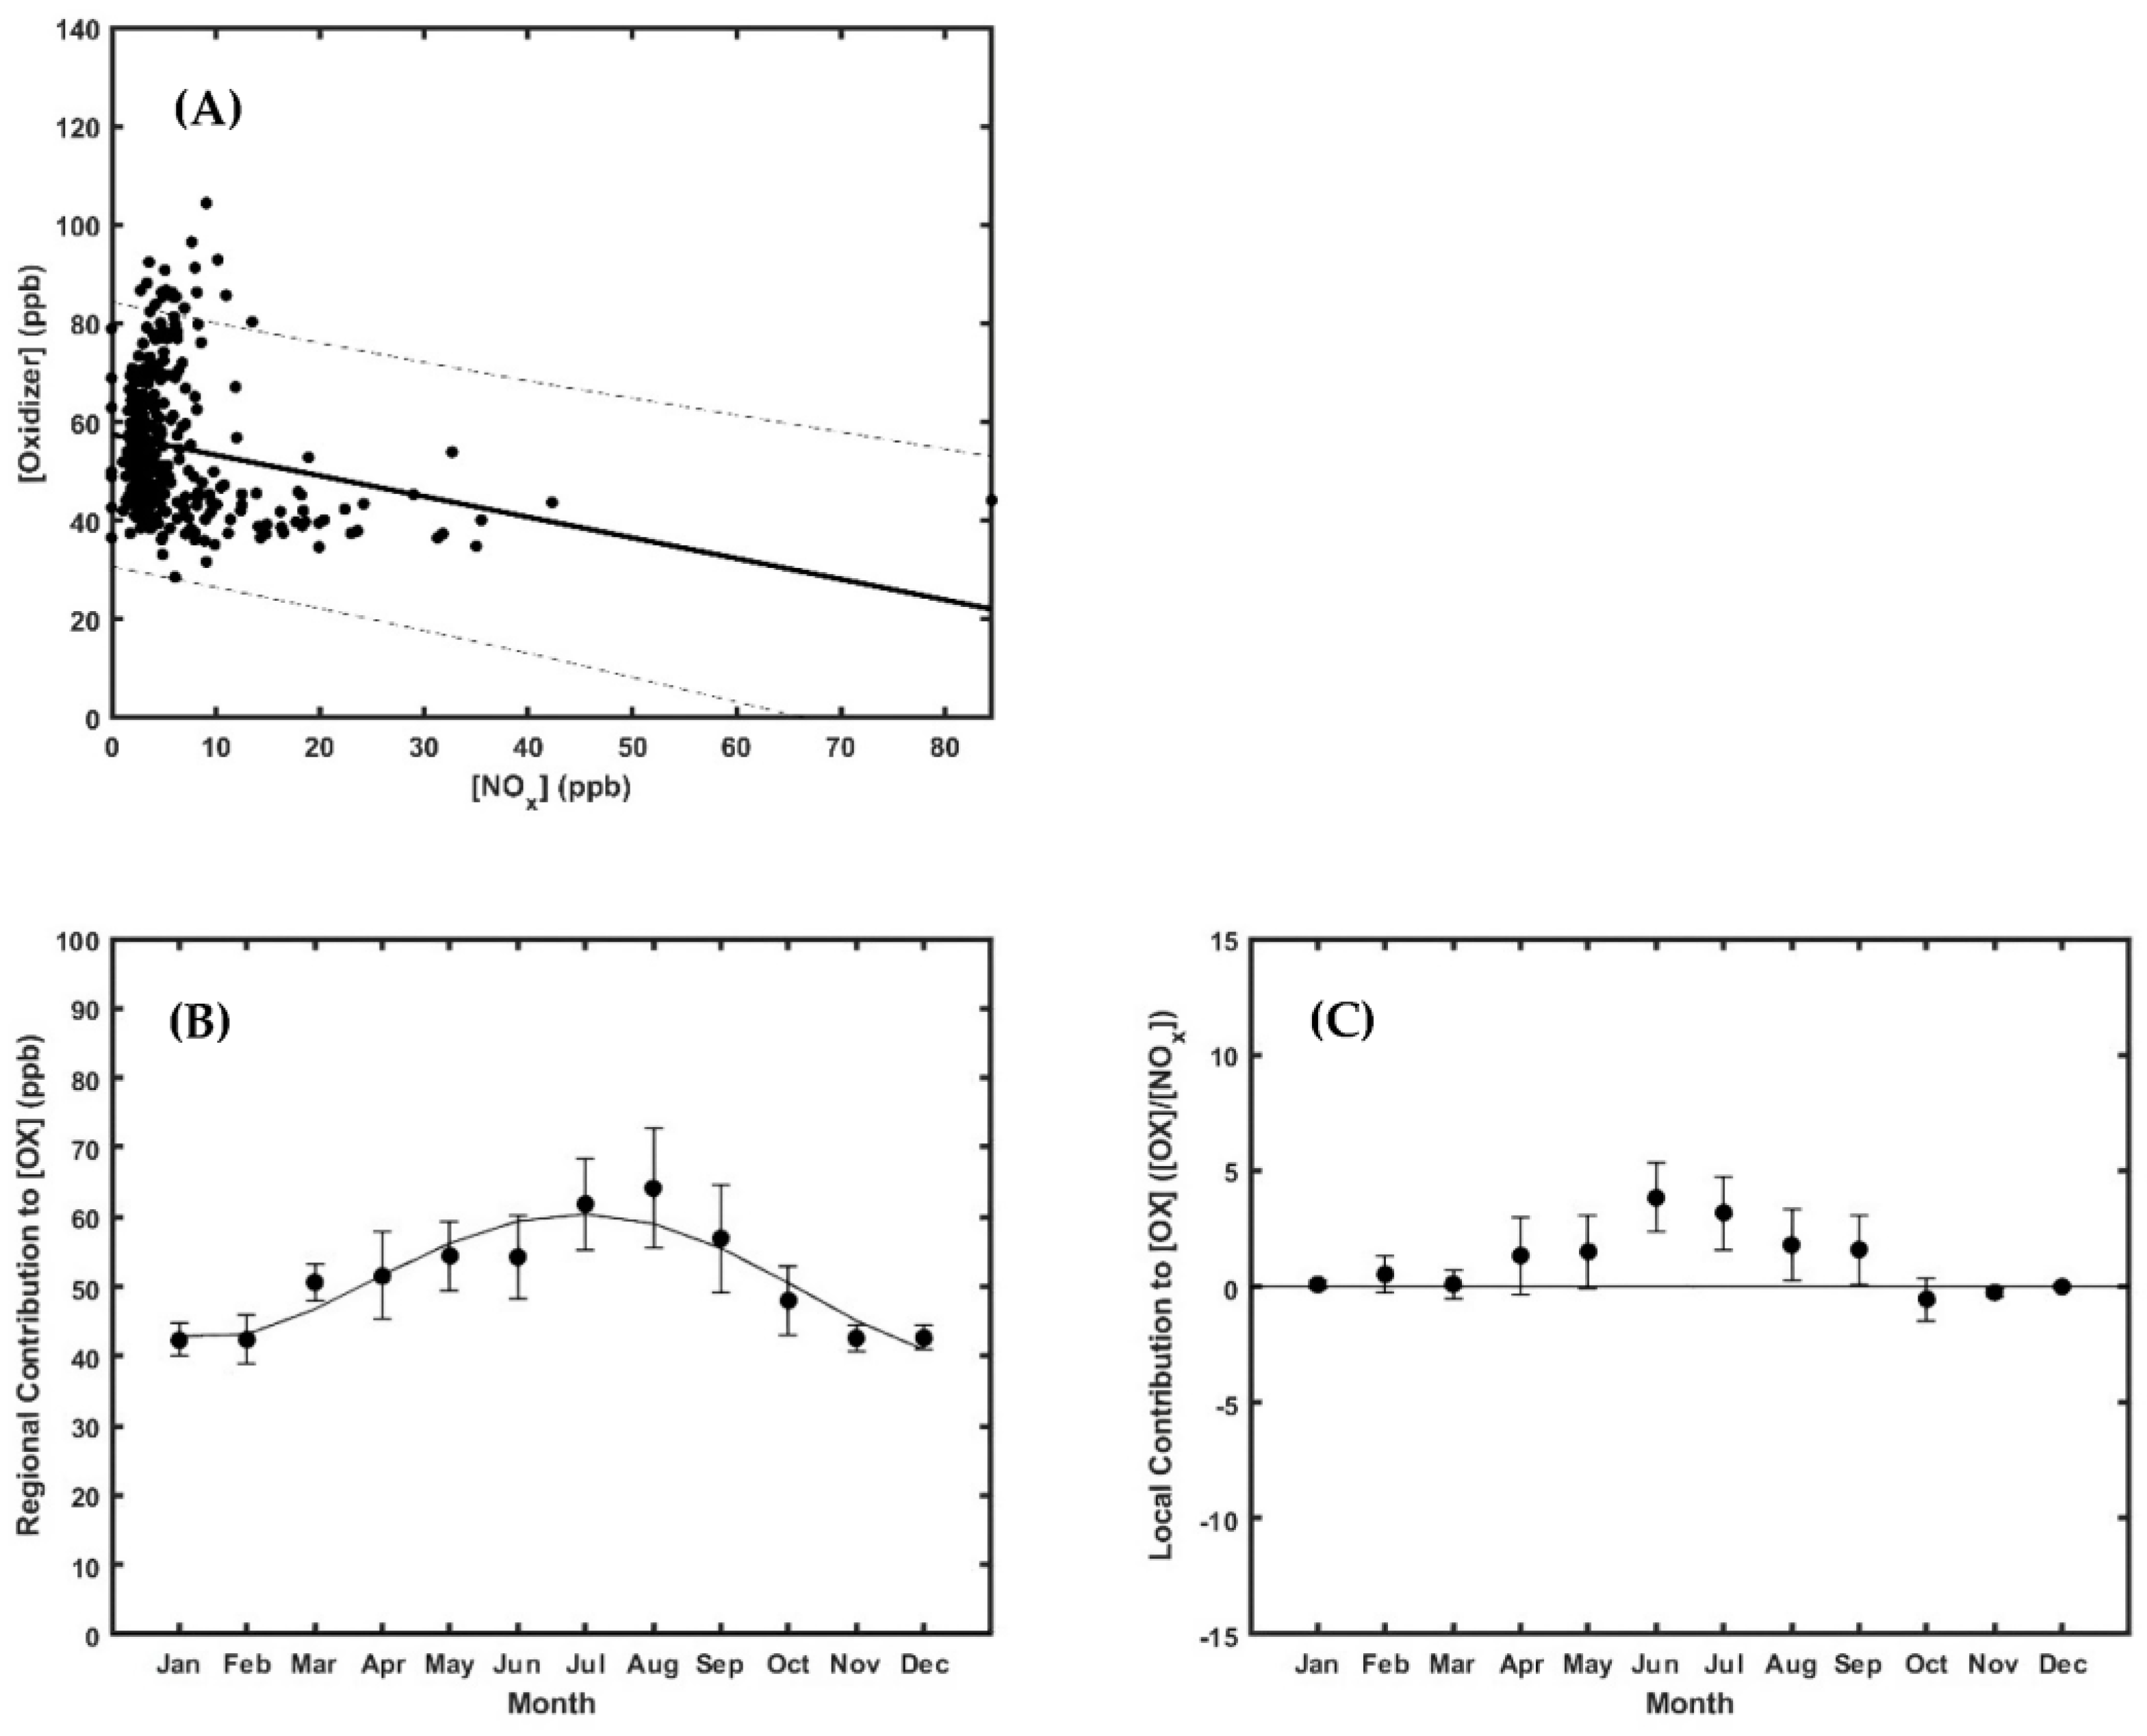
3.1.1. Annual Data for Each County
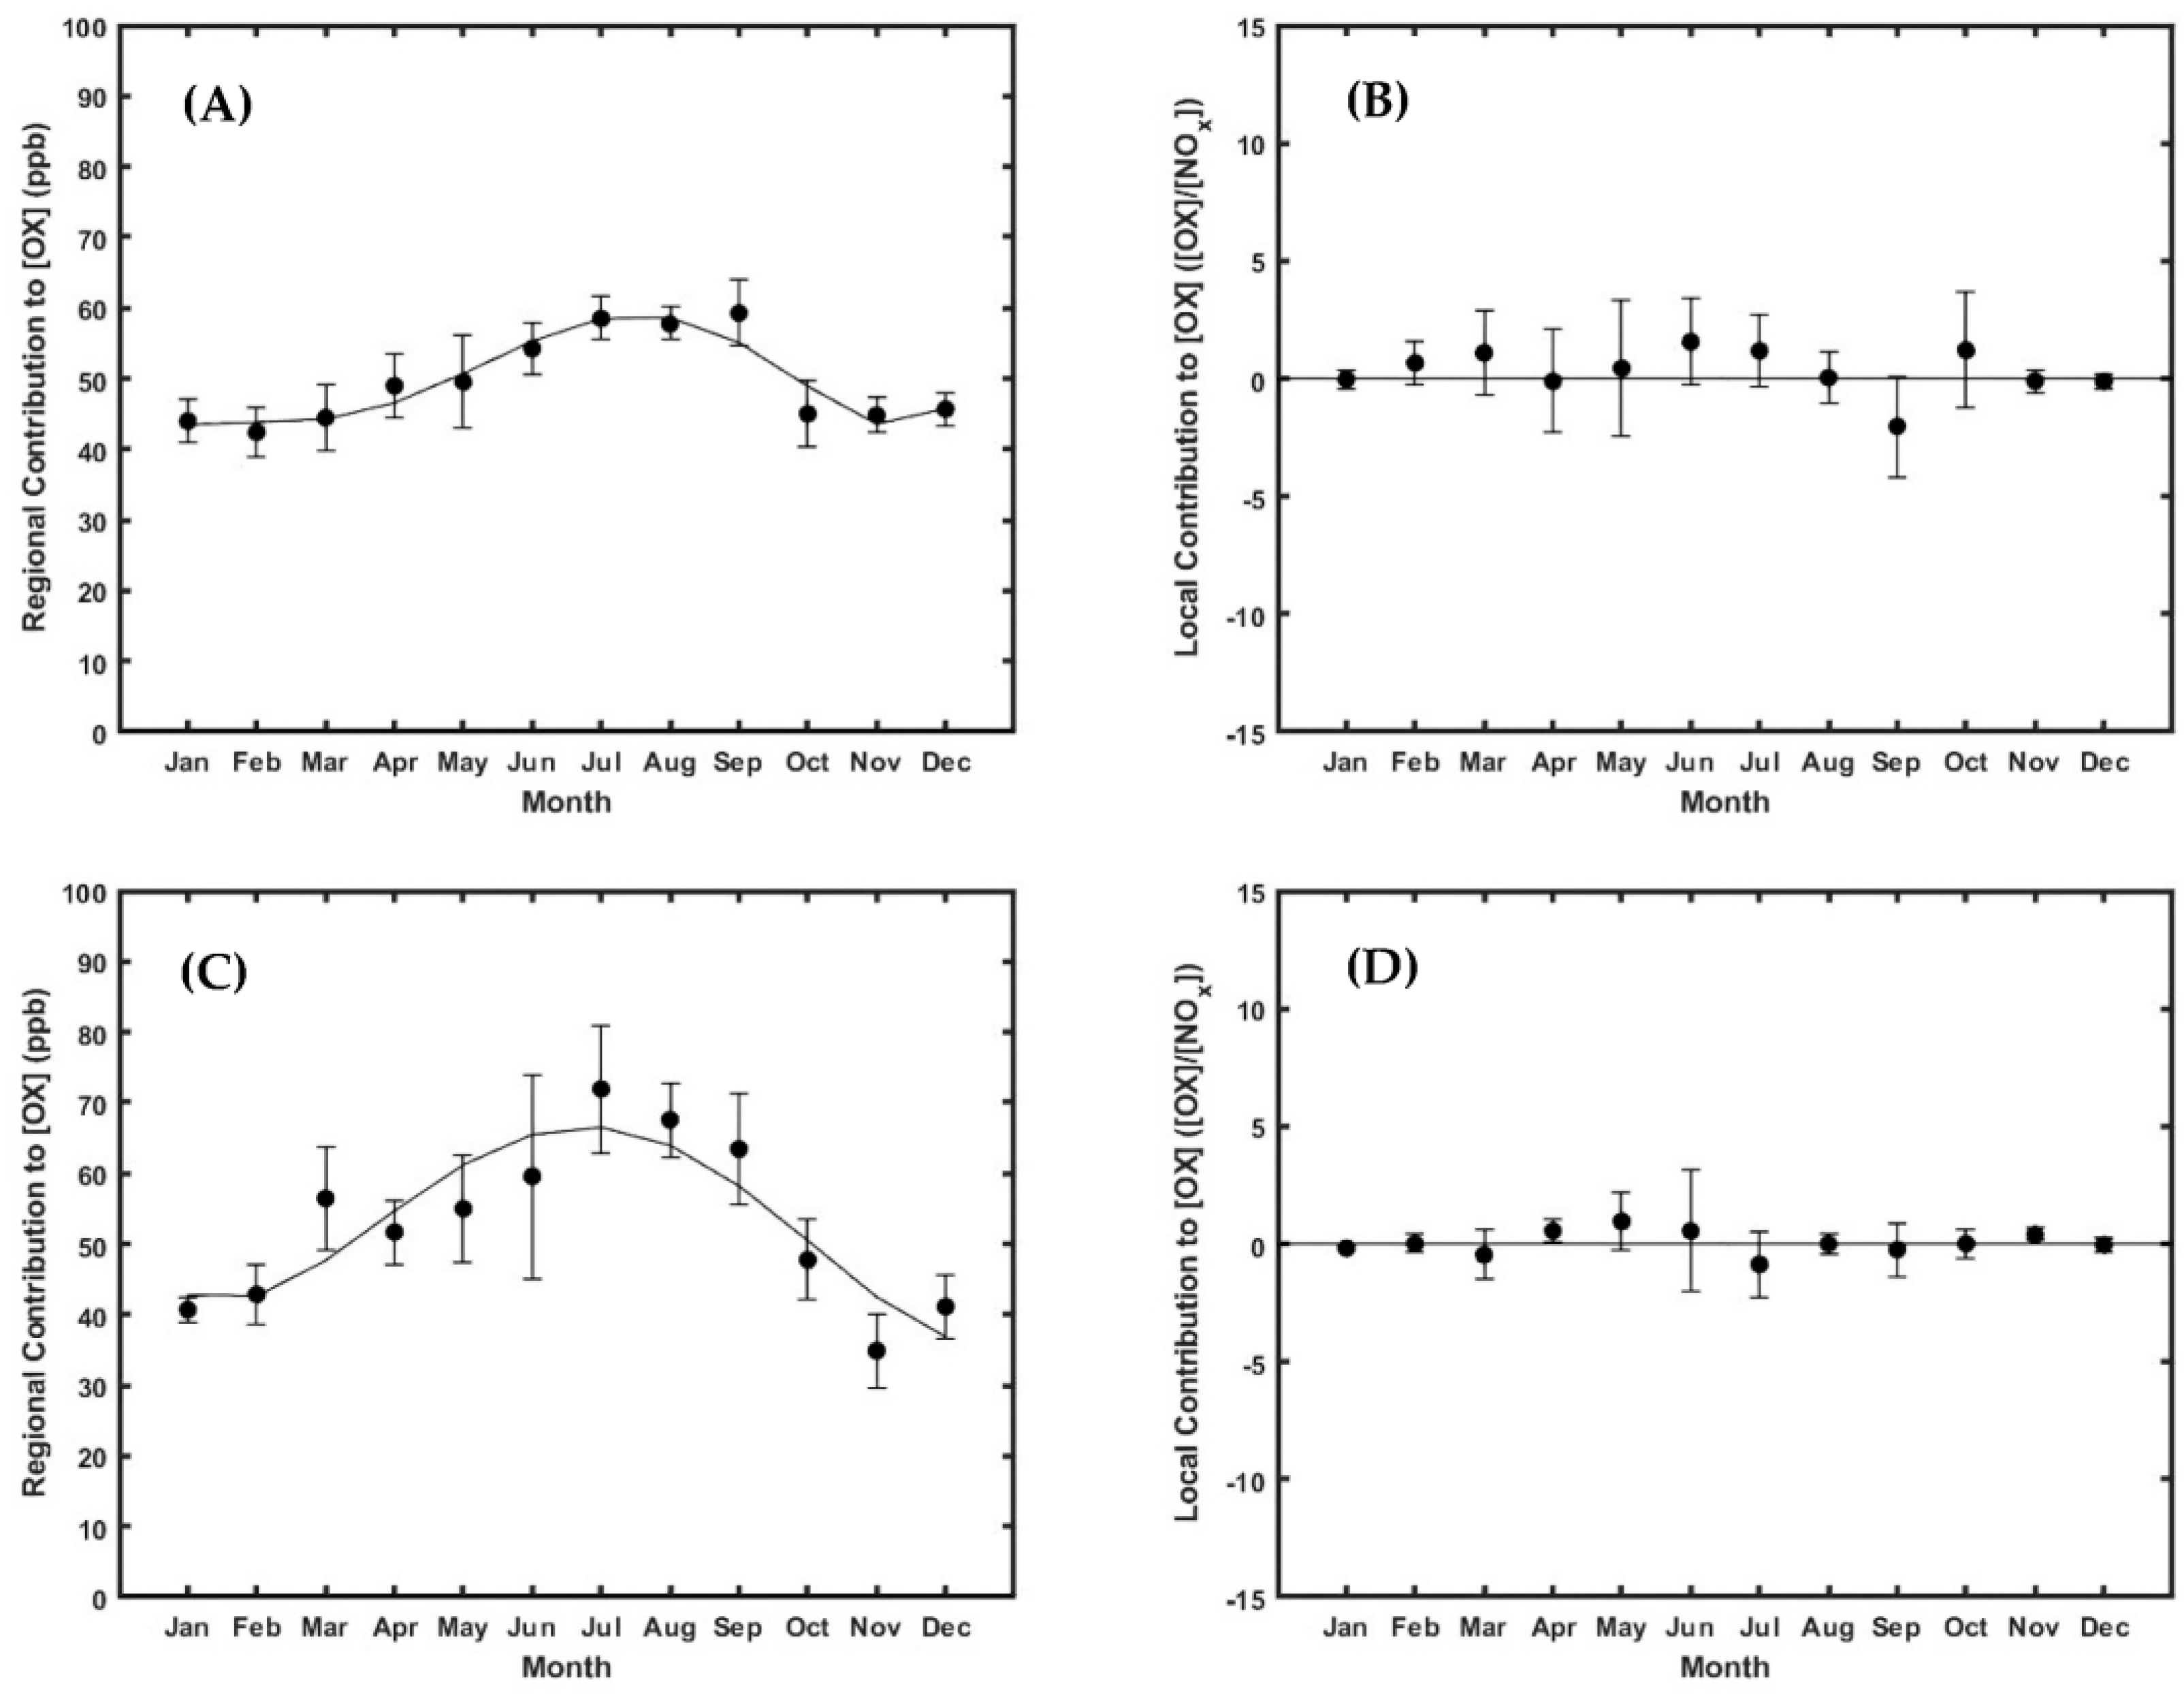
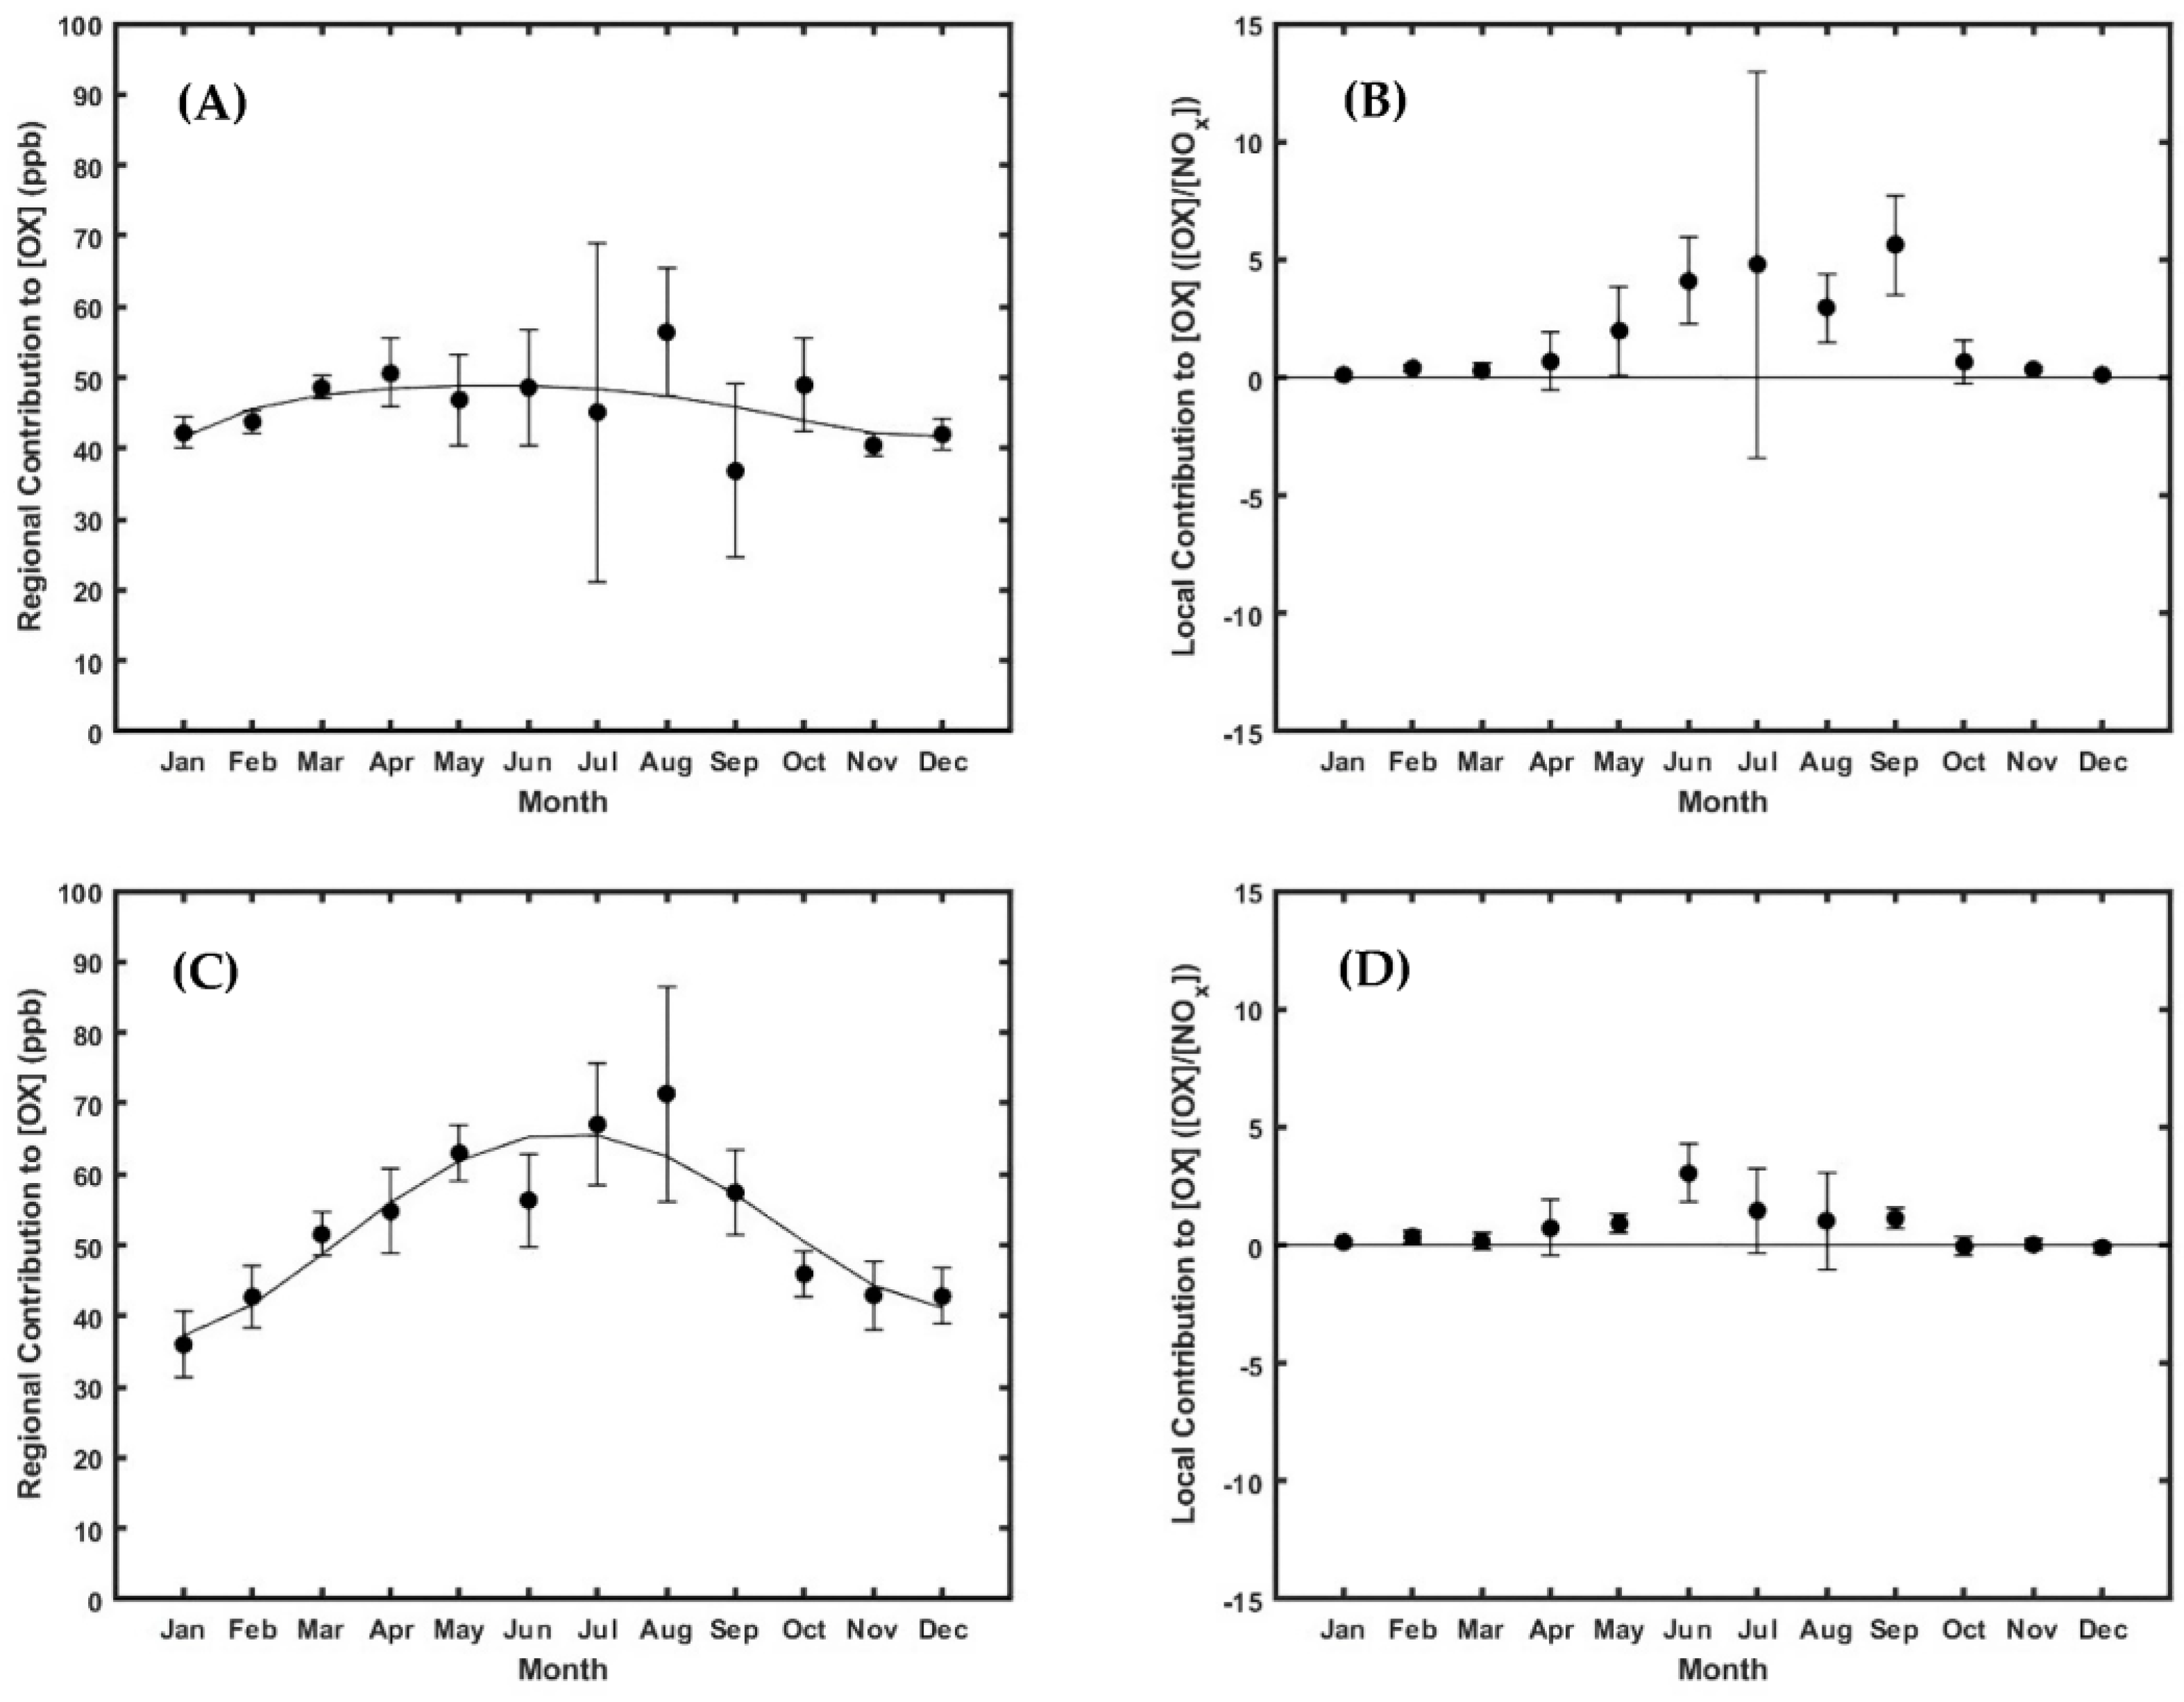
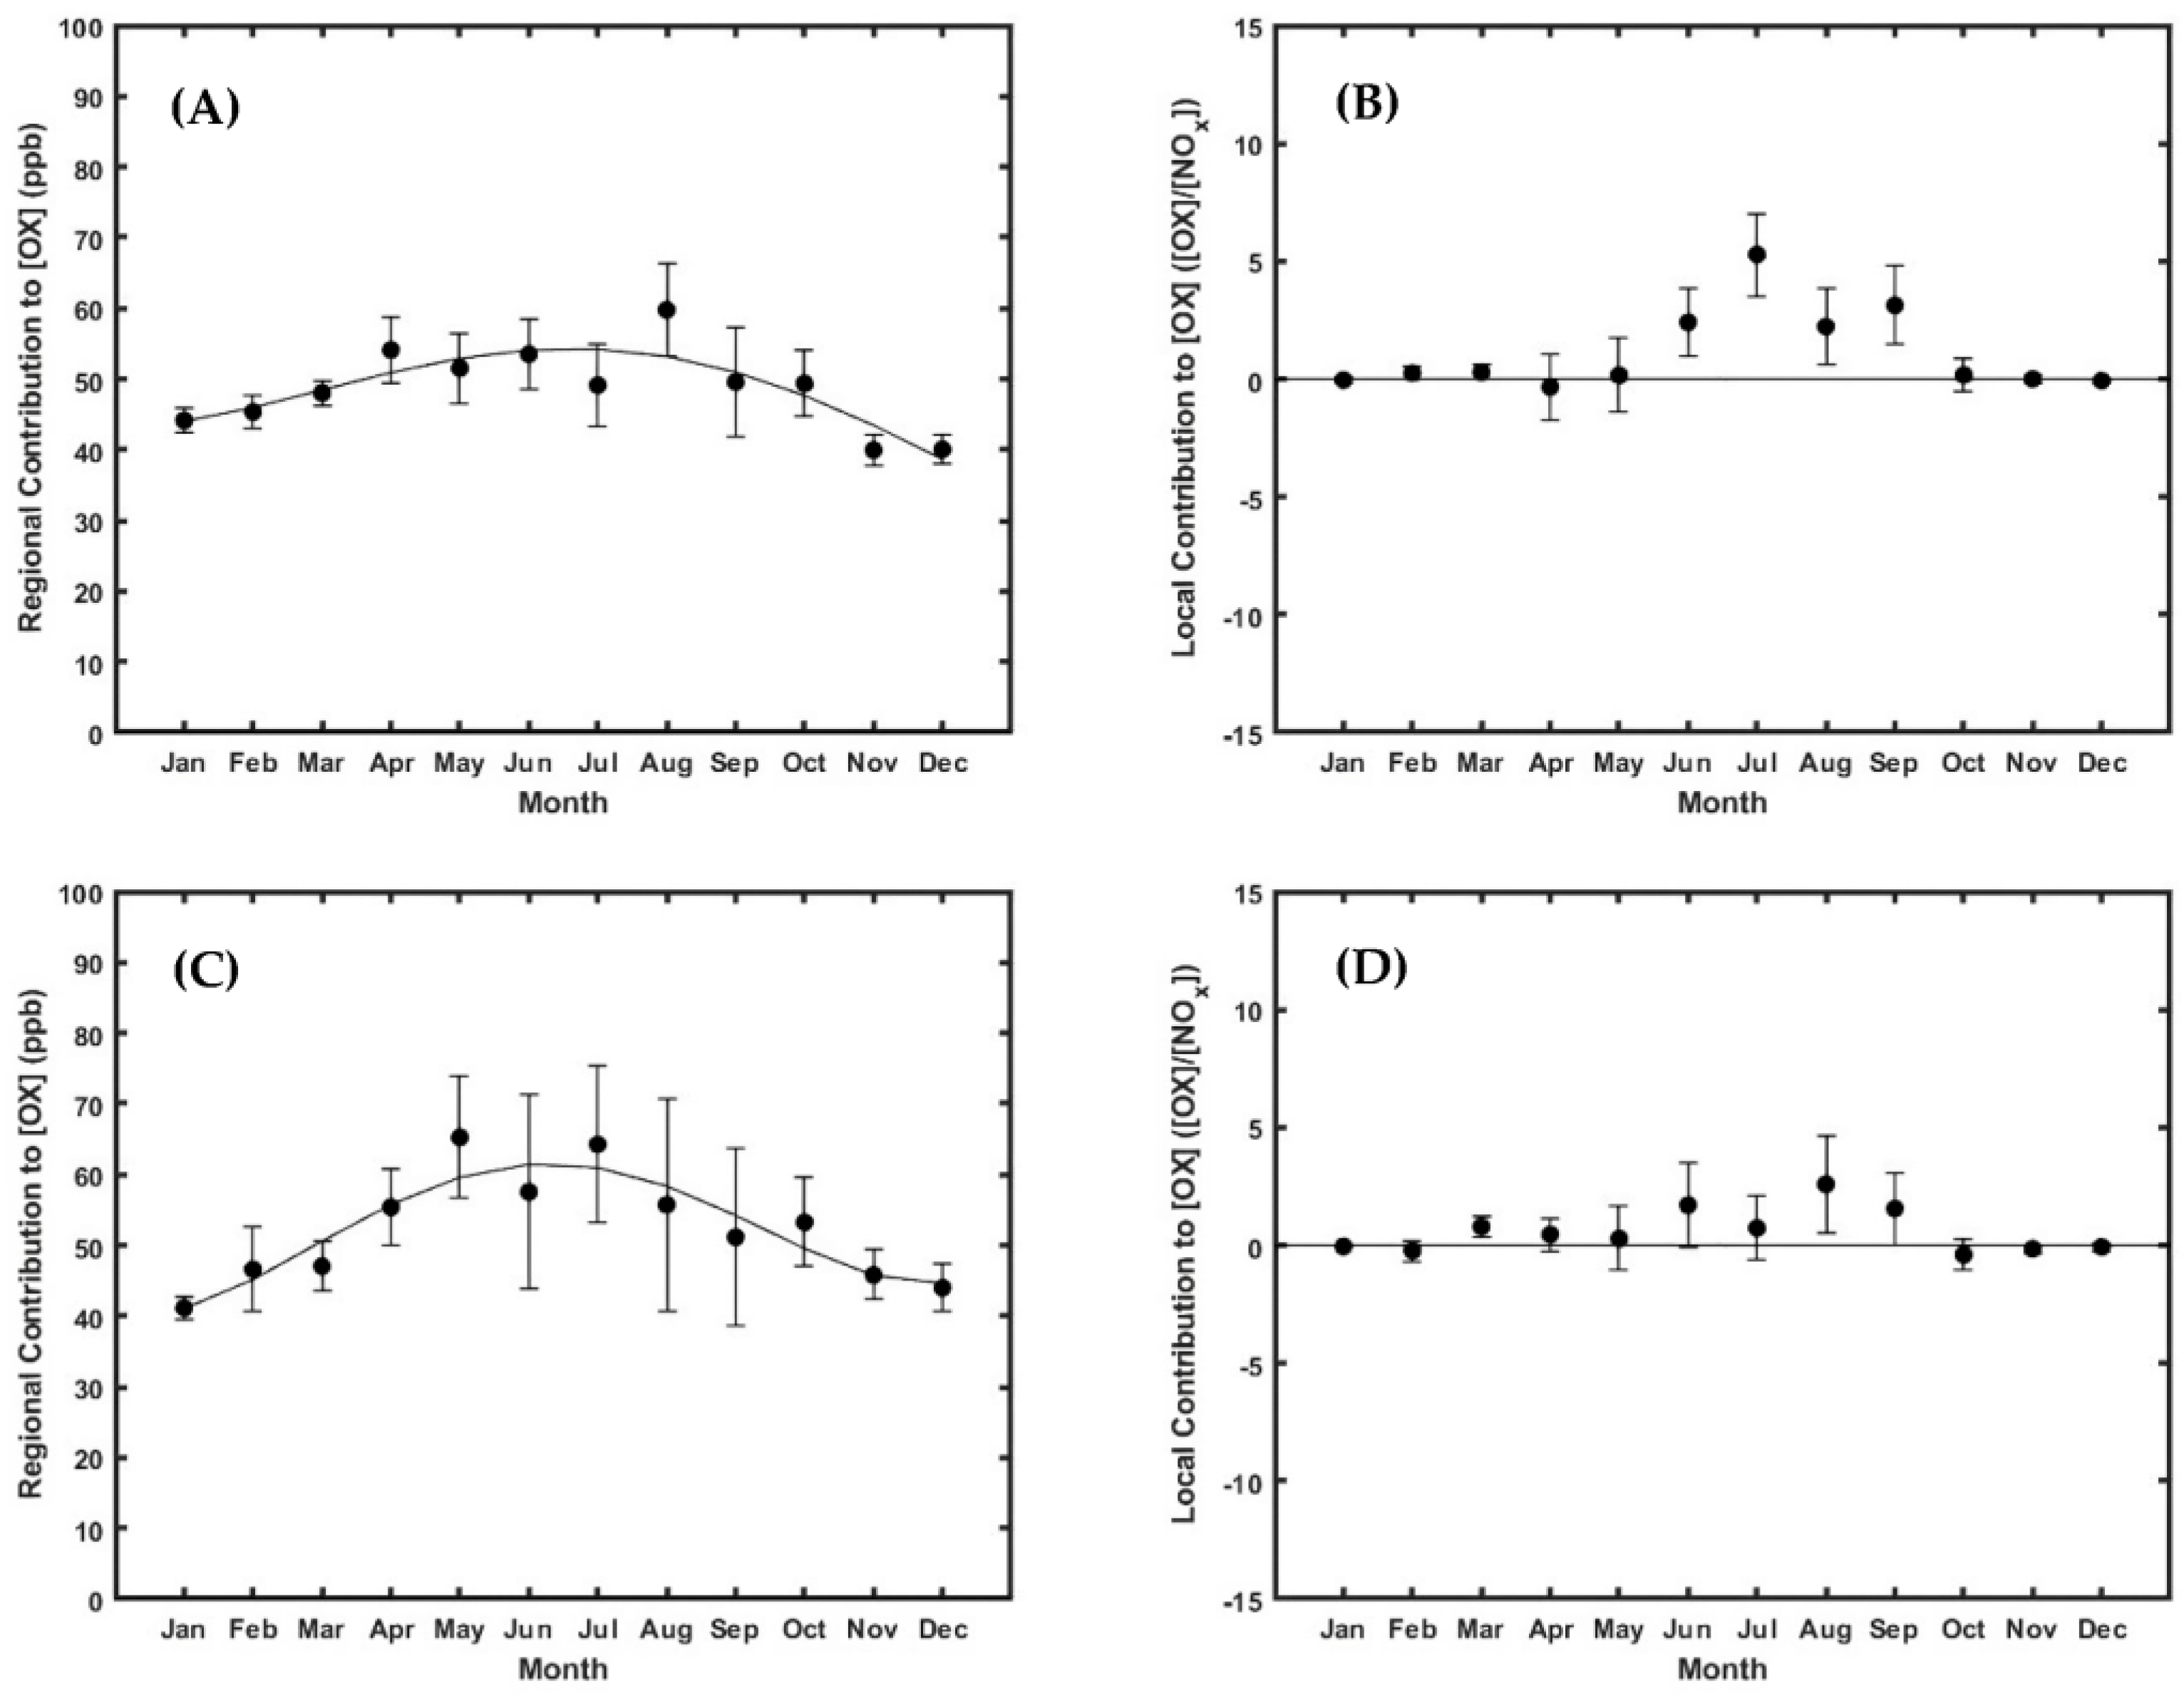
3.1.2. Monthly Data for Each County
3.1.3. Vehicle Miles Traveled
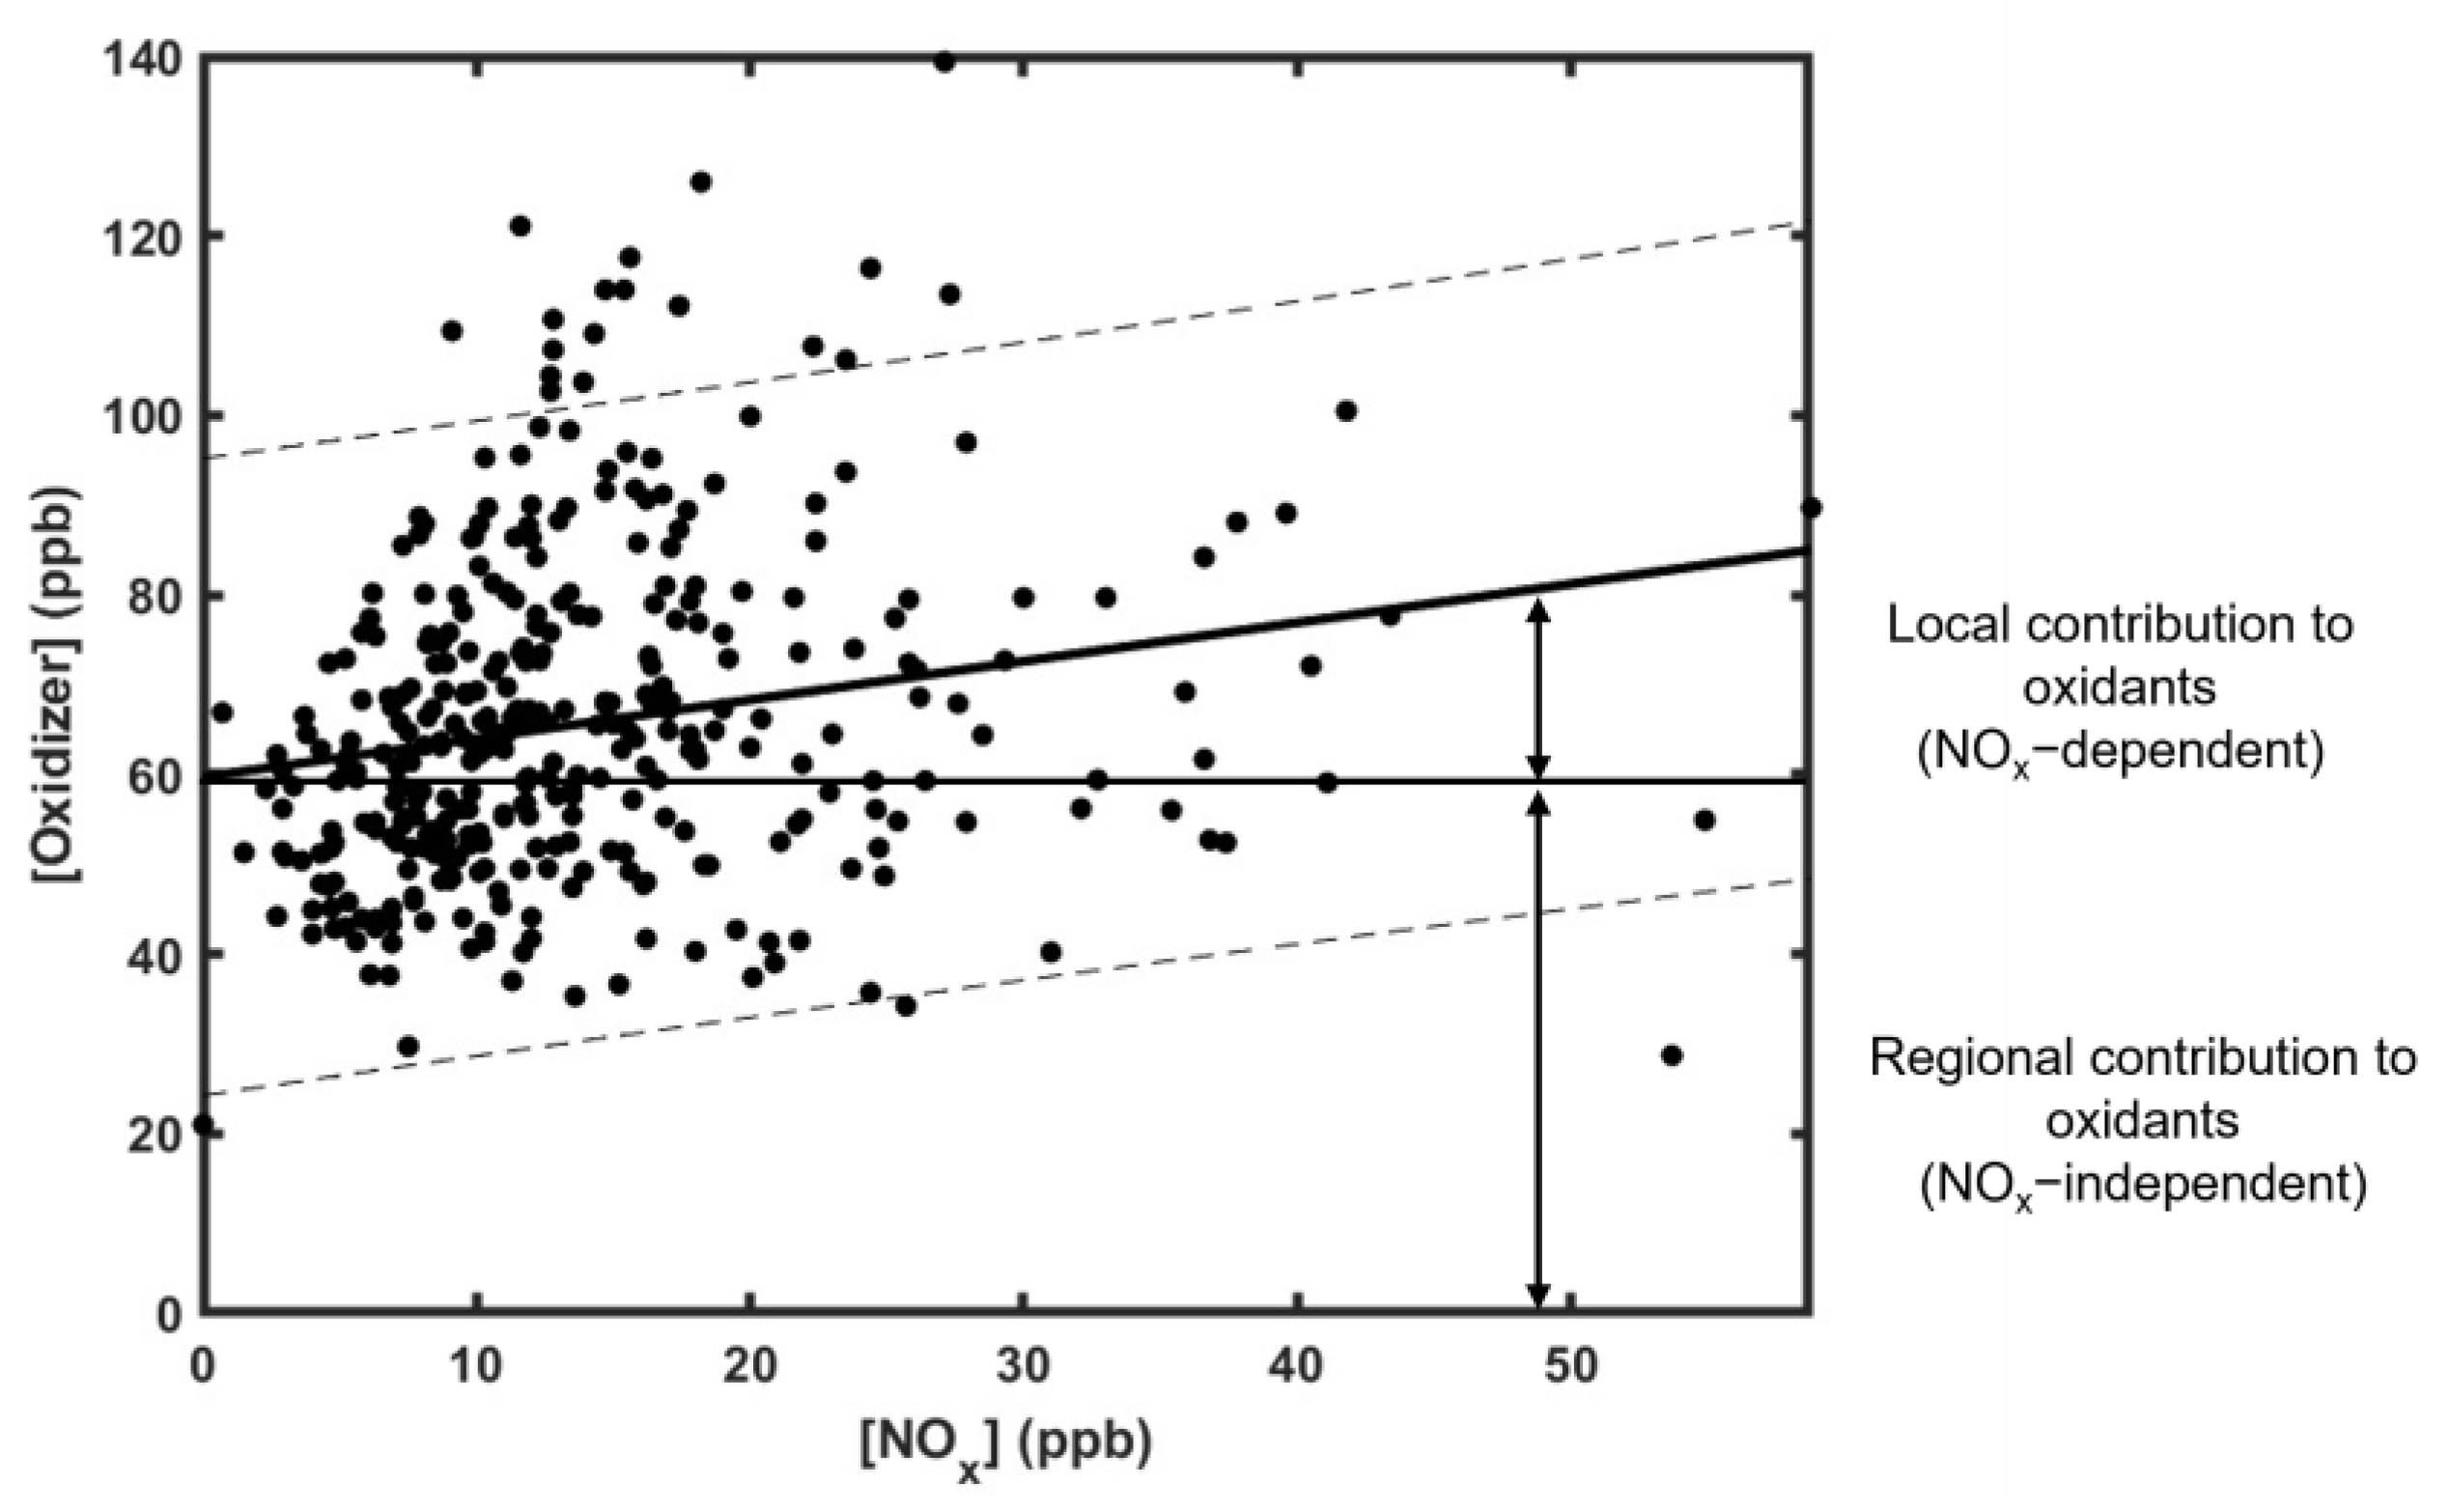
3.1.4. Local Compared to Regional Contributions to Oxidants
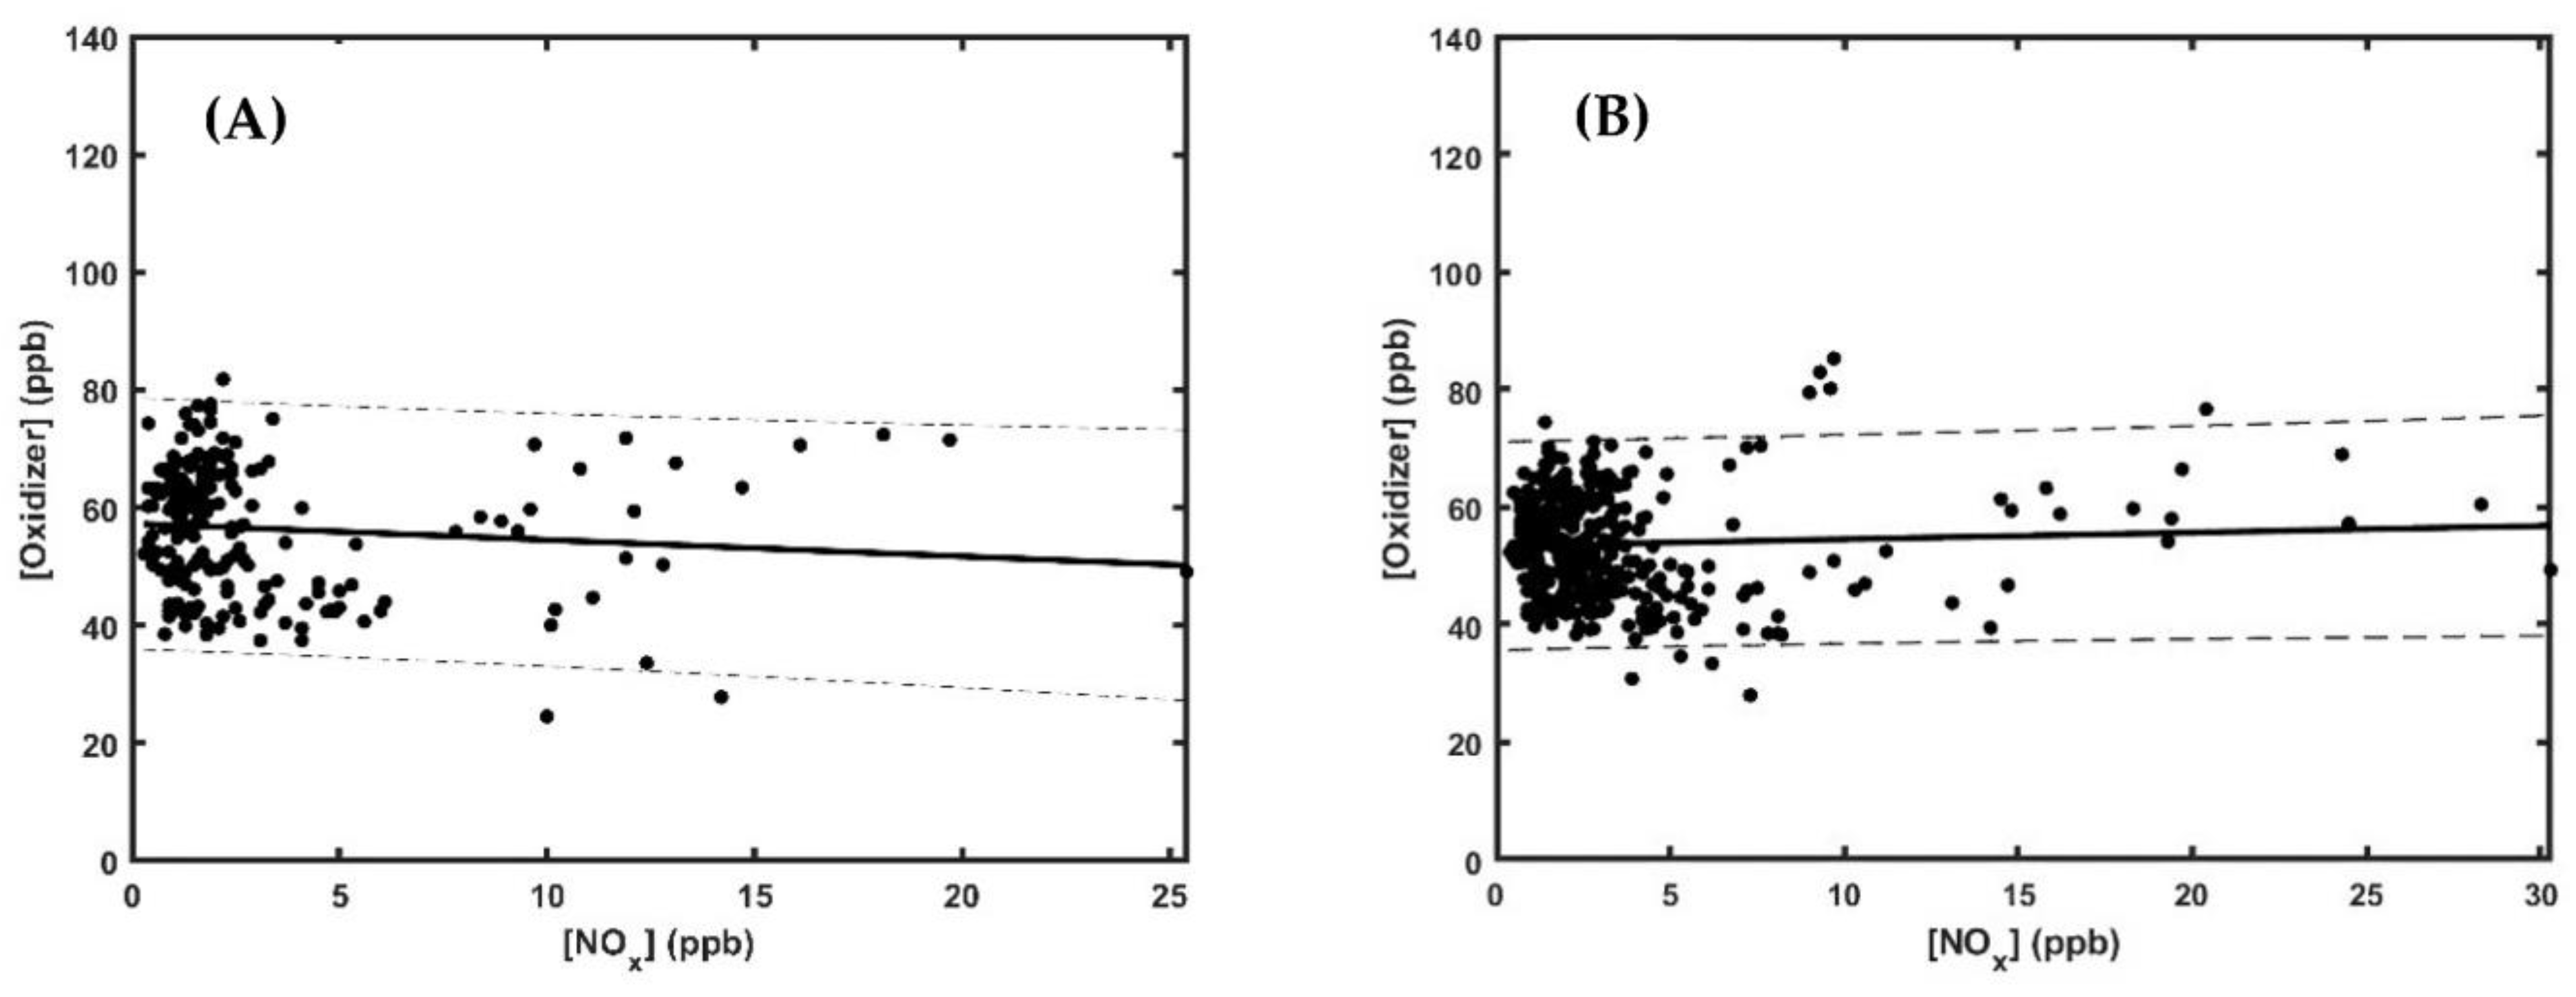
3.2. Fire Year (2021)
4. Conclusions
Supplementary Materials
Author Contributions
Funding
Data Availability Statement
Conflicts of Interest
References
- U.S. Environmental Protection Agency. Ground-Level Ozone Pollution. 2022. Available online: https://www.epa.gov/ground-level-ozone-pollution (accessed on 2 February 2023).
- U.S. Environmental Protection Agency. Criteria Air Pollutants. 2022. Available online: https://www.epa.gov/criteria-air-pollutants (accessed on 2 February 2023).
- Utah Division of Air Quality. What Is Ozone? 2021. Available online: https://deq.utah.gov/air-quality/what-is-ozone (accessed on 2 February 2023).
- Babar, Z.B.; Park, J.H.; Lim, H.J. Influence of NH3 on secondary organic aerosols from the ozonolysis and photooxidation of α-pinene in a flow reactor. Atmos. Environ. 2017, 164, 71–84. [Google Scholar] [CrossRef]
- Qi, X.; Zhu, S.; Zhu, C.; Hu, J.; Lou, S.; Xu, L.; Dong, J.; Cheng, P. Smog chamber study of the effects of NOx and NH3 on the formation of secondary organic aerosols and optical properties from photo-oxidation of toluene. Sci. Total Environ. 2020, 727, 138632. [Google Scholar] [CrossRef] [PubMed]
- Zhang, H.L.; Ying, Q. Contributions of local and regional sources of NOx to ozone concentrations in Southeast Texas. Atmos. Environ. 2011, 45, 2877–2887. [Google Scholar] [CrossRef]
- Notario, A.; Bravo, I.; Adame, J.A.; Diaz-de-Mera, Y.; Aranda, A.; Rodriguez, A.; Rodriguez, D. Behaviour and variability of local and regional oxidant levels (OX = O3 + NO2) measured in a polluted area in central-southern of Iberian Peninsula. Environ. Sci. Pollut. Res. 2013, 20, 188–200. [Google Scholar] [CrossRef]
- Jet Propulsion Laboratory, California Institute of Technology. Nature, Chinese Pollution Offset U.S. West Ozone Gains. 2015. Available online: https://www.jpl.nasa.gov/news/nature-chinese-pollution-offset-us-west-ozone-gains (accessed on 24 February 2023).
- Vrekoussis, M.; Pikridas, M.; Rousogenous, C.; Christodoulou, A.; Desservettaz, M.; Sciare, J.; Richter, A.; Bougoudis, I.; Savvides, C.; Papadopoulos, C. Local and regional air pollution characteristics in Cyprus: A long-term trace gases observations analysis. Sci. Total Environ. 2022, 845, 157315. [Google Scholar] [CrossRef] [PubMed]
- Milford, J.B. Out in Front? State and Federal Regulation of Air Pollution Emissions from Oil and Gas Production Activities in the Western United States. Nat. Resour. J. 2014, 55, 1–45. [Google Scholar]
- Musselman, R.C.; Korfmacher, J.L. Ozone in remote areas of the Southern Rocky Mountains. Atmos. Environ. 2014, 82, 383–390. [Google Scholar] [CrossRef]
- Ahmadov, R.S.; McKeen, M.; Trainer, R.; Banta, A.; Brewer, S.; Brown, P.M.; Edwards, J.A.; de Gouw, G.J.; Frost, J.; Gilman, D.; et al. Understanding high wintertime ozone pollution events in an oil- and natural gas-producing region of the western US. Atmos. Chem. Phys. 2015, 15, 411–429. [Google Scholar] [CrossRef]
- Neemann, E.M.; Crosman, E.T.; Horel, J.D.; Avey, L. Simulations of a cold-air pool associated with elevated wintertime ozone in the Uintah Basin, Utah. Atmos. Chem. Phys. 2015, 15, 135–151. [Google Scholar] [CrossRef]
- Teague, W.S.; Zick, C.D.; Smith, K.R. Soft Transport Policies and Ground-Level Ozone: An Evaluation of the Clear the Air Challenge in Salt Lake City. Policy Stud. J. 2015, 43, 399–415. [Google Scholar] [CrossRef]
- Horel, J.; Crosman, E.; Jacques, A.; Blaylock, B.; Arens, S.; Long, A.; Sohl, J.; Martin, R. Summer ozone concentrations in the vicinity of the Great Salt Lake. Atmos. Sci. Lett. 2016, 17, 480–486. [Google Scholar] [CrossRef]
- Oltmans, S.J.; Karion, A.; Schnell, R.C.; Petron, G.; Helmig, D.; Montzka, S.A.; Wolter, S.; Neff, D.; Miller, B.R.; Hueber, J.; et al. O3, CH4, CO2, CO, NO2 and NMHC aircraft measurements in the Uinta Basin oil and gas region under low and high ozone conditions in winter 2012 and 2013. Elem.-Sci. Anthr. 2016, 4, 132. [Google Scholar] [CrossRef]
- Schnell, R.C.; Johnson, B.J.; Oltmans, S.J.; Cullis, P.; Sterling, C.; Hall, E.; Jordan, A.; Helmig, D.; Petron, G.; Ahmadov, R.; et al. Quantifying wintertime boundary layer ozone production from frequent profile measurements in the Uinta Basin, UT, oil and gas region. J. Geophys. Res.-Atmos. 2016, 121, 11038–11054. [Google Scholar] [CrossRef]
- Wild, R.J.; Edwards, P.M.; Bates, T.S.; Cohen, R.C.; de Gouw, J.A.; Dube, W.P.; Gilman, J.B.; Holloway, J.; Kercher, J.; Koss, A.R.; et al. Reactive nitrogen partitioning and its relationship to winter ozone events in Utah. Atmos. Chem. Phys. 2016, 16, 573–583. [Google Scholar] [CrossRef]
- Mukerjee, S.; Smith, L.; Long, R.; Lonneman, W.; Kaushik, S.; Colon, M.; Oliver, K.; Whitaker, D. Particulate matter, nitrogen oxides, ozone, and select volatile organic compounds during a winter sampling period in Logan, Utah, USA. J. Air Waste Manag. Assoc. 2019, 69, 778–788. [Google Scholar] [CrossRef]
- Utah Division of Air Quality. Ozone in the Uinta Basin. 2023. Available online: https://deq.utah.gov/air-quality/ozone-in-the-uinta-basin (accessed on 2 February 2023).
- Utah Division of Air Quality. Ozone: EPA Designates Marginal Nonattainment Areas in Utah. 2023. Available online: https://deq.utah.gov/air-quality/ozone-marginal-nonattainment-areas-utah (accessed on 1 March 2023).
- U.S. Environmental Protection Agency. Utah Nonattainment/Maintenance Status for Each County by Year for All Criteria Pollutants. 2023. Available online: https://www3.epa.gov/airquality/greenbook/anayo_ut.html (accessed on 2 February 2023).
- Clapp, L.J.; Jenkin, M.E. Analysis of the relationship between ambient levels of O3, NO2 and NO as a function of NOx in the UK. Atmos. Environ. 2001, 35, 6391–6405. [Google Scholar] [CrossRef]
- Leighton, P.A. Photochemistry of Air Pollution; Academic Press: New York, NY, USA, 1961. [Google Scholar]
- University of Leeds. Master Chemical Mechanism, MCM v3.2. Available online: http://mcm.leeds.ac.uk/MCM (accessed on 1 March 2023).
- EPA. Community Multiscale Air Quality Modeling System (CMAQ) v5.4. 2022. Available online: https://www.epa.gov/cmaq (accessed on 1 March 2023).
- Ramboll. Comprehensive Air Quality Model with Extensions (CAMx) v7.20. 2023. Available online: https://www.camx.com/ (accessed on 1 March 2023).
- Eisele, F.L.; Mount, G.H.; Tanner, D.; Jefferson, A.; Shetter, R.; Harder, J.W.; Williams, E.J. Understanding the production and interconversion of the hydroxyl radical during the Tropospheric OH Photochemistry Experiment. J. Geophys. Res.-Atmos. 1997, 102, 6457–6465. [Google Scholar] [CrossRef]
- Finnlayson-Pitts, B.J.; Pitts, J.N. Chemistry of the Upper and Lower Atmosphere; Elsevier Inc.: Amsterdam, The Netherlands, 2000; pp. 265–266. [Google Scholar]
- Womackm, C.C.; McDuffie, E.E.; Edwards, P.M.; Bares, R.; de Gouw, J.A.; Docherty, K.S.; Dube, W.P.; Fibiger, D.L.; Franchin, A.; Gilman, J.B.; et al. An Odd Oxygen Framework for Wintertime Ammonium Nitrate Aerosol Pollution in Urban Areas: NOx and VOC Control as Mitigation Strategies. Geophys. Res. Lett. 2019, 46, 4971–4979. [Google Scholar] [CrossRef]
- Kem, C. Gardner Policy Institute, David Eccles School of Business, University of Utah. State and County-Level Estimates. 2023. Available online: https://gardner.utah.edu/demographics/state-and-county-level-population-estimates/ (accessed on 24 February 2023).
- Utah Regional Economic Analysis Project. Gross Domestic Product by County (Current Dollars). 2022. Available online: https://utah.reaproject.org/data-tables/gsp-a200n/ (accessed on 24 February 2023).
- Utah Department of Transportation. Traffic Statistics. 2023. Available online: https://udot.utah.gov/connect/business/traffic-data/traffic-statistics/ (accessed on 24 February 2023).
- Western Regional Climate Center. Prevailing Wind Direction. 2023. Available online: https://wrcc.dri.edu/Climate/comp_table_show.php?stype=wind_dir_avg (accessed on 27 February 2023).
- Stein, A.F.; Draxler, R.R.; Rolph, G.D.; Stunder, B.J.B.; Cohen, M.D.; Ngan, F. NOAA’s HYSPLIT atmospheric transport and dispersion modeling system. Bull. Amer. Meteor. Soc. 2015, 96, 2059–2077. [Google Scholar] [CrossRef]
- Utah State Geographic Information Database, Utah DAQ Air Emissions Inventory. 2023. Available online: https://opendata.gis.utah.gov/datasets/utah-daq-air-emissions-inventory/explore?location=39.052263%2C-109.134021%2C-1.00 (accessed on 1 March 2023).
- Langford, A.O.; Senff, C.J.; Alvarez, R.J.; Banta, R.M.; Hardesty, R.M. Long-range transport of ozone from the Los Angeles Basin: A case study. Geophys. Res. Lett. 2010, 37, L06807. [Google Scholar] [CrossRef]
- Asher, E.C.; Christensen, J.N.; Post, A.; Perry, K.; Cliff, S.S.; Zhao, Y.J.; Trousdell, J.; Faloona, I. The Transport of Asian Dust and Combustion Aerosols and Associated Ozone to North America as Observed from a Mountaintop Monitoring Site in the California Coast Range. J. Geophys. Res.-Atmos. 2018, 123, 5667–5680. [Google Scholar] [CrossRef]
- Utah Division of Air Quality. Utah’s Air: Double-Punch of Ozone and Wildfires this Summer. 2018. Available online: https://deq.utah.gov/air-quality/utahs-air-compare-summer (accessed on 28 February 2023).
- Utah Division of Air Quality. Clean Air Act 179B(b): Northern Wasatch Front Ozone Nonattainment Area. 2021. Available online: https://documents.deq.utah.gov/air-quality/planning/air-quality-policy/DAQ-2021-005764.pdf (accessed on 1 March 2023).
- Utah Division of Air Quality. Pollution in Utah: Not Always the Usual Suspects. 2023. Available online: https://deq.utah.gov/communication/news/pollution (accessed on 24 February 2023).
- Lin, M.; Horowitz, L.W.; Oltmans, S.J.; Fiore, A.M.; Fan, S. Tropospheric ozone trends at Manna Loa Observatory tied to decadal climate variability. Nat. Geosci. 2014, 7, 136–143. [Google Scholar] [CrossRef]
- Lin, M.; Fiore, A.M.; Horowitz, L.W.; Cooper, O.R.; Naik, V.; Holloway, J.; Johnson, B.J.; Middlebrook, A.M.; Oltmans, S.J.; Pollack, I.B.; et al. Transport of Asian ozone pollution into surface air over the western United States in spring. J. Geophys. Res.-Atmos. 2012, 117, D00V07. [Google Scholar] [CrossRef]
- Rickly, P.S.; Coggon, M.M.; Aikin, K.C.; Alvarez, R.J.; Baidar, S.; Gilman, J.B.; Gkatzelis, G.I.; Harkins, C.; He, J.; Lamplugh, A.; et al. Influence of Wildfire on Urban Ozone: An Observationally Constrained Box Modeling Study at a Site in the Colorado Front Range. Environ. Sci. Technol. 2023, 57, 1257–1267. [Google Scholar] [CrossRef]
- Ninneman, M.; Jaffe, D.A. The impact of wildfire smoke on ozone production in an urban area: Insights from field observations and photochemical box modeling. Atmos. Environ. 2021, 267, 118764. [Google Scholar] [CrossRef]
- Pollack, I.B.; Helmig, D.; O’Dell, K.; Fischer, E.V. Weekend-Weekday Implications and the Impact of Wildfire Smoke on Ozone and Its Precursors at Boulder Reservoir, Colorado between 2017 and 2019. J. Geophys. Res.-Atmos. 2021, 126, e2021JD035221. [Google Scholar] [CrossRef]
- Xu, L.; Crounse, J.D.; Vasquez, K.T.; Allen, H.; Wennberg, P.O.; Bourgeois, I.; Brown, S.S.; Campuzano-Jost, P.; Coggon, M.M.; Crawford, J.H.; et al. Ozone chemistry in western US wildfire plumes. Sci. Adv. 2021, 7, eabl3648. [Google Scholar] [CrossRef]



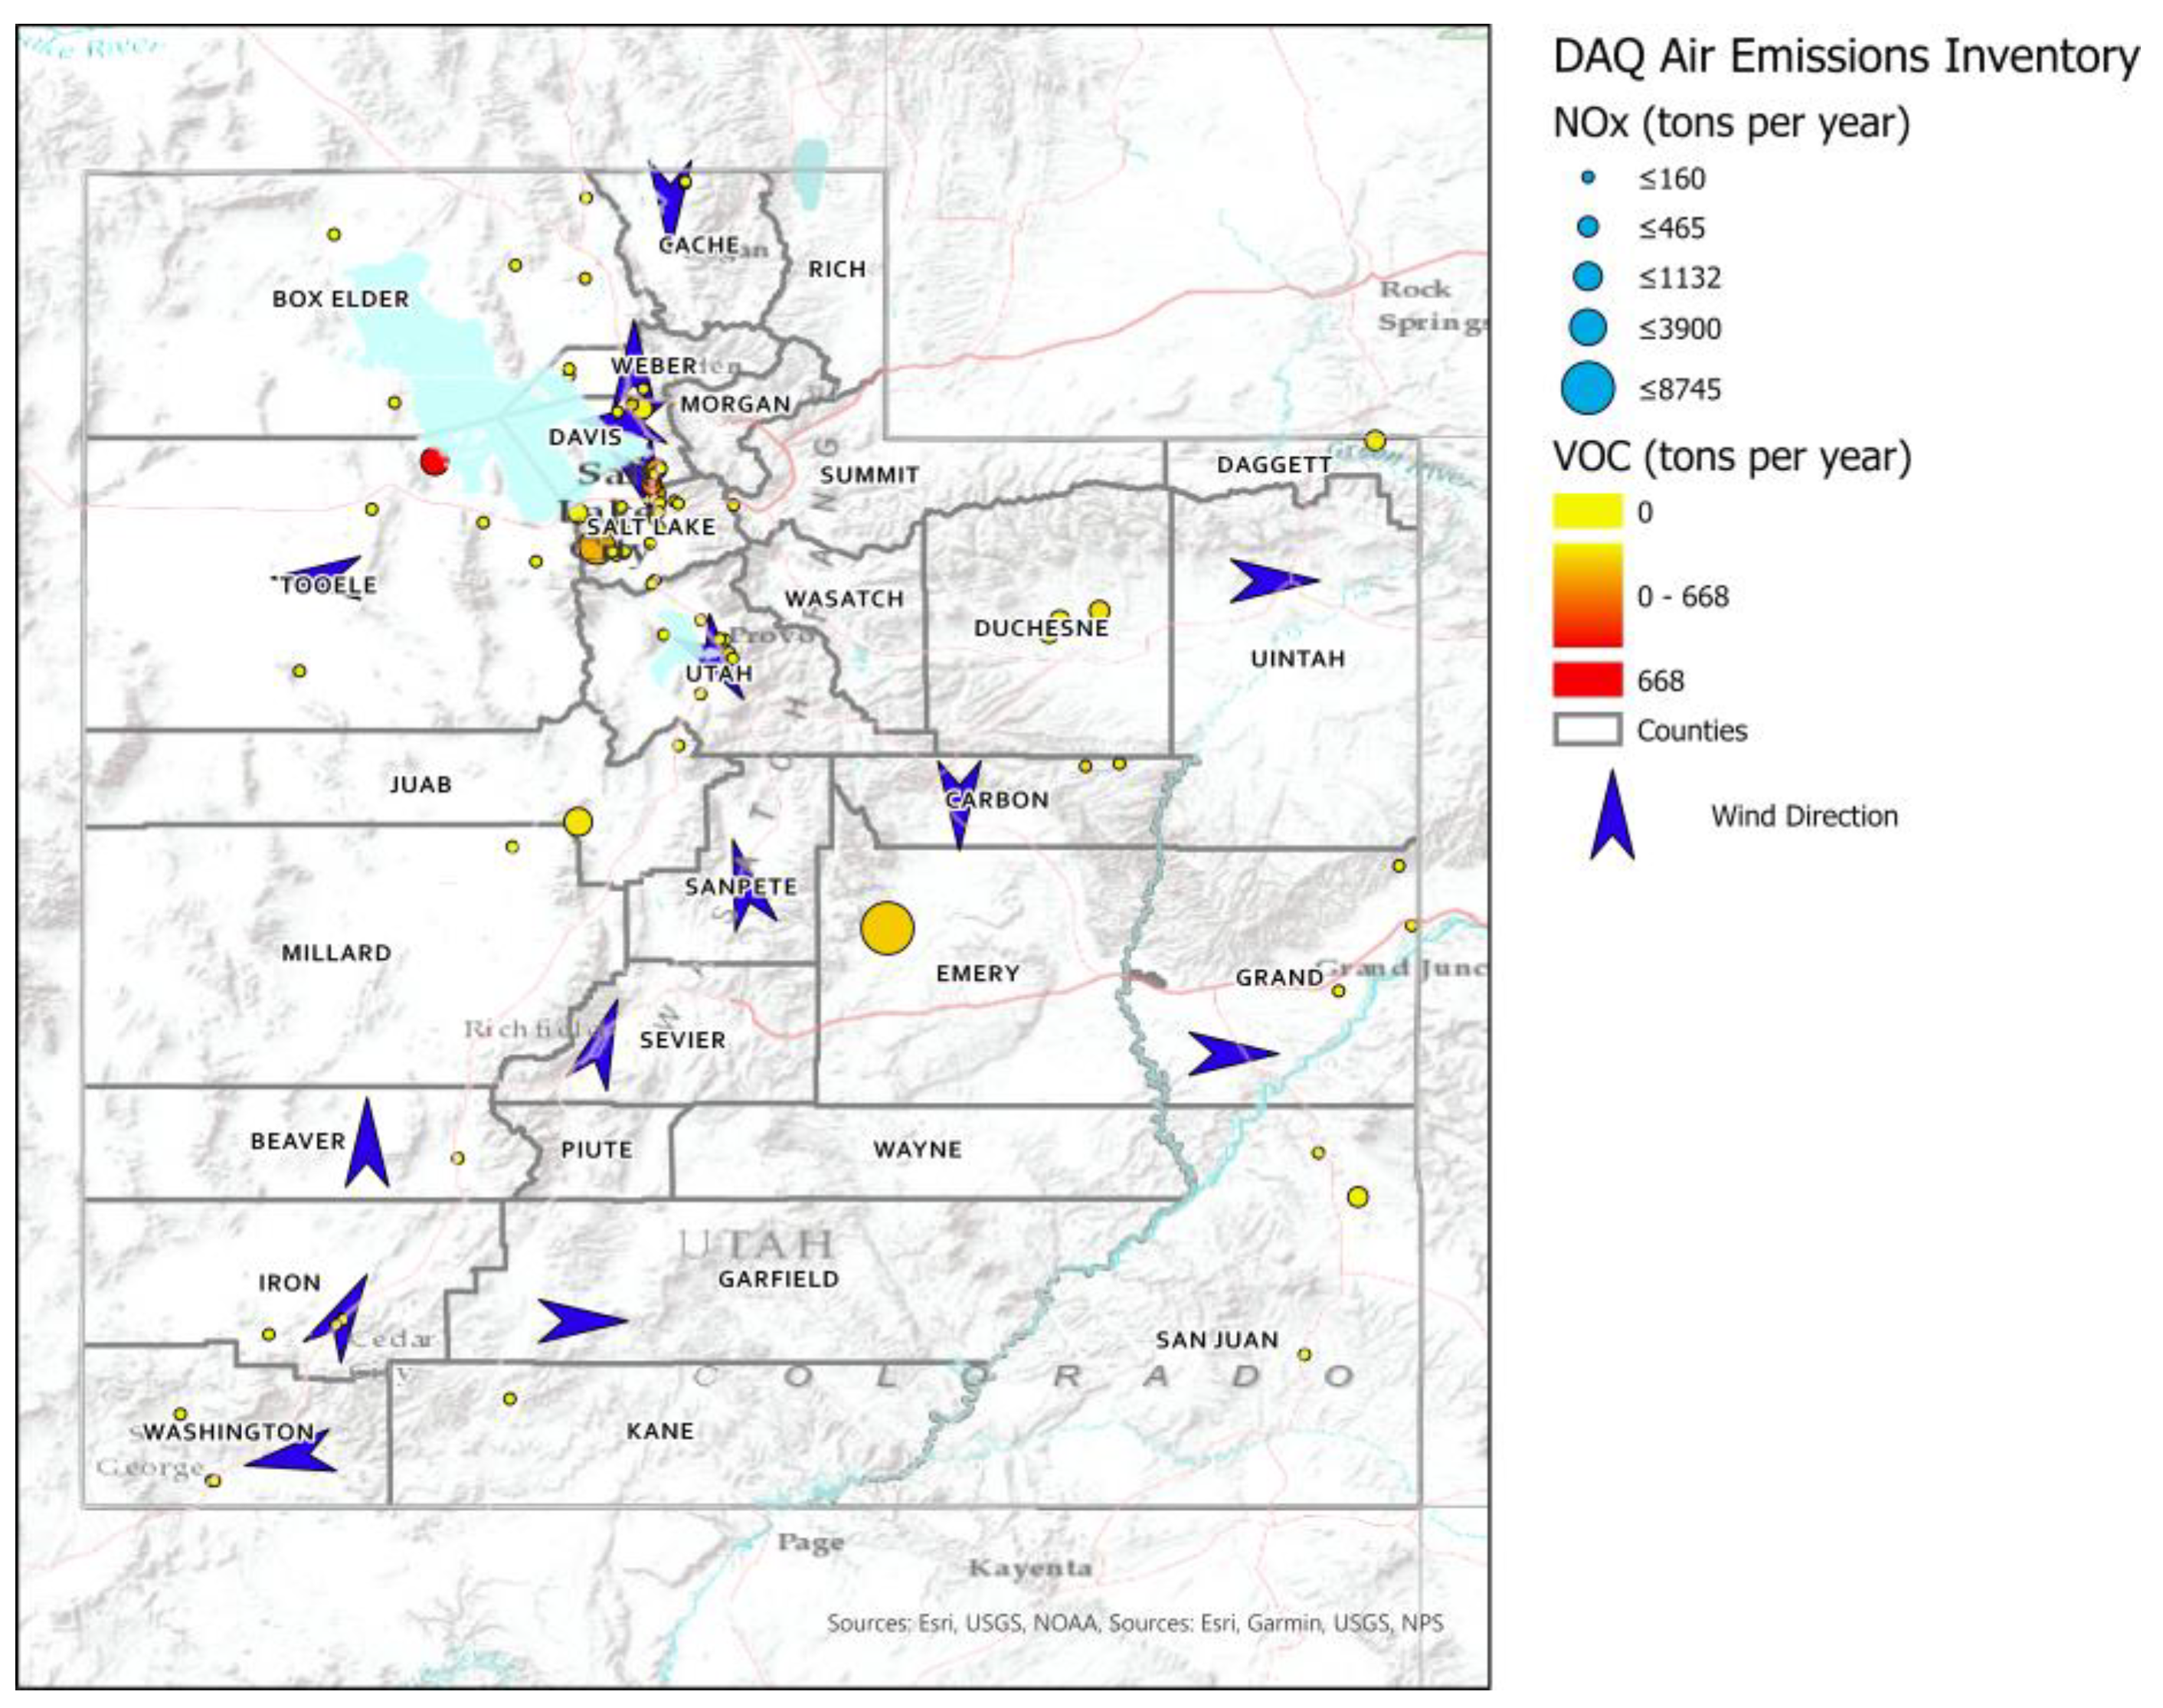


| County | 2022 Site ID | Latitude (°) | Longitude (°) | Altitude (m) | 2012 Site ID |
|---|---|---|---|---|---|
| Box Elder | 490037001 | 41.945874 | −112.233973 | 1372 | |
| Cache | 490050007 | 41.842649 | −111.852199 | 1379 | 490050004 |
| Carbon | 490071003 | 39.609960 | −110.800749 | 1740 | 490071003 |
| Davis | 490110004 | 40.902967 | −111.884467 | 1309 | 490110004 |
| Duchesne | 490130002 | 40.294178 | −110.009732 | 1587 | 490130002 |
| Iron | 490210005 | 37.747430 | −113.055525 | 1690 | |
| Salt Lake | 490353006 | 40.736389 | −111.872222 | 1306 | 490353006 |
| Sanpete | EPH 1 | 39.362074 | −111.580043 | 1695 | |
| Sevier | RCH 1 | 38.766727 | −112.096879 | 1641 | |
| Tooele | 490450004 | 40.600550 | −112.355780 | 1511 | |
| Uinta | 490462002 | 40.206291 | −109.353932 | 1668 | 490462002 |
| Utah | 490494001 | 40.341389 | −111.713611 | 1442 | 490490002 |
| Washington | 490530007 | 37.179125 | −113.305096 | 992 | 490530007 |
| Weber | 490571003 | 41.303614 | −111.987871 | 1317 | 490570002 |
| County | Slope Change between 2012 to 2022) | Slope Change (%) | Absolute Change in Regional Contribution | Change in Regional Contribution (%) | Population Changes from 2012 to 2022 (%) [31] | GDP Changes from 2012 to 2021 (%) [32] | Vehicle Miles Travelled Changes from 2012 to 2021 (%) [33] | Annual Average Direction of Prevailing Winds [34] |
|---|---|---|---|---|---|---|---|---|
| Box Elder | - | - | - | - | 18.5 | 58.6 | 34.8 | - |
| Cache | Remained VOC | 82.22 | −9.58 | −5.51 | 20.5 | 74.8 | 25.8 | N-S |
| Carbon | VOC to NOx | −125.81 | −13.73 | −7.86 | −2.8 | 18.8 | 37.2 | N-S |
| Davis | Remained VOC | −30.77 | 4.57 | 2.48 | 17.0 | 61.3 | 21.3 | E-W |
| Duchesne | VOC to NOx | −139.29 | −7.02 | −4.03 | 3.6 | −7.8 | 46.8 | - |
| Iron | - | - | - | - | 34.5 | 94.6 | 45.2 | SSW-NNE |
| Salt Lake | Remained VOC | 21.43 | −5.20 | −3.06 | 13.3 | 72.4 | 14.9 | SSE-NNW |
| Sanpete | - | - | - | - | 7.3 | 60.6 | 44.5 | NNW-SSE |
| Sevier | - | - | - | - | 5.1 | 62.5 | 33.8 | NNE-SSW |
| Tooele | - | - | - | - | 29.0 | 32.6 | 19.4 | E-W |
| Uinta | VOC to NOx | −236.36 | −7.39 | −4.02 | 5.0 | −21.7 | 13.9 | W-E |
| Utah | Remained VOC | −17.46 | −11.71 | −7.4 | 30.2 | 110.8 | 33.3 | NW-SE |
| Washington | NOx to VOC | −102.44 | 2.36 | 1.24 | 35.7 | 119.0 | 58.0 | ENE-WSW |
| Weber | Remained VOC | −10.20 | −2.12 | −2.12 | 12.7 | 69.3 | 16.4 | S-N |
| County | Jan | Feb | Mar | Apr | May | Jun | Jul | Aug | Sep | Oct | Nov | Dec | Annual |
|---|---|---|---|---|---|---|---|---|---|---|---|---|---|
| Box Elder | - | - | - | - | - | - | - | - | - | - | - | - | - |
| Cache | N | N | N | N | N | N | N | S | N | N | N | N | N |
| Carbon | N | N | N | N | N | N | N | N | N | N | N | N | N |
| Davis | E | E | E | E | E | E | E | E | E | E | E | E | E |
| Duchesne | - | - | - | - | - | - | - | - | - | - | - | - | - |
| Iron | SSW | SW | SSW | SSW | SSW | SSW | SW | SSW | SSW | SW | N | SSW | SSW |
| Salt Lake | S | S | SSE | SSE | SSE | S | SSE | SSE | SSE | SE | SE | S | SSE |
| Sanpete | SE | N | SE | SW | S | S | SE | S | SE | SE | SE | SE | SE |
| Sevier | SW | NE | NW | SW | W | SW | W | NW | NW | NW | SW | W | SW |
| Tooele | NW | NW | E | NW | E | E | E | E | E | E | E | E | E |
| Uinta | W | W | WNW | W | W | W | W | W | W | W | WNW | W | W |
| Utah | NW | NW | NW | NW | NW | NW | SE | SE | SE | SE | SSE | SSE | NW |
| Washington | E | ENE | ENE | W | W | W | W | ENE | ENE | ENE | E | E | ENE |
| Weber | SSE | S | SSE | S | S | S | S | S | S | S | S | S | S |
Disclaimer/Publisher’s Note: The statements, opinions and data contained in all publications are solely those of the individual author(s) and contributor(s) and not of MDPI and/or the editor(s). MDPI and/or the editor(s) disclaim responsibility for any injury to people or property resulting from any ideas, methods, instructions or products referred to in the content. |
© 2023 by the authors. Licensee MDPI, Basel, Switzerland. This article is an open access article distributed under the terms and conditions of the Creative Commons Attribution (CC BY) license (https://creativecommons.org/licenses/by/4.0/).
Share and Cite
Flowerday, C.E.; Thalman, R.; Hansen, J.C. Local and Regional Contributions to Tropospheric Ozone Concentrations. Atmosphere 2023, 14, 1262. https://doi.org/10.3390/atmos14081262
Flowerday CE, Thalman R, Hansen JC. Local and Regional Contributions to Tropospheric Ozone Concentrations. Atmosphere. 2023; 14(8):1262. https://doi.org/10.3390/atmos14081262
Chicago/Turabian StyleFlowerday, Callum E., Ryan Thalman, and Jaron C. Hansen. 2023. "Local and Regional Contributions to Tropospheric Ozone Concentrations" Atmosphere 14, no. 8: 1262. https://doi.org/10.3390/atmos14081262
APA StyleFlowerday, C. E., Thalman, R., & Hansen, J. C. (2023). Local and Regional Contributions to Tropospheric Ozone Concentrations. Atmosphere, 14(8), 1262. https://doi.org/10.3390/atmos14081262


