Article

Temporal Evolution of PM2.5 Levels and COVID-19 Mortality in Europe for the 2020–2022 Period

by
Jean-Baptiste Renard
1,*,
Jérémy Surcin
2,
Isabella Annesi-Maesano
3 and
Eric Poincelet
2
1
LPC2E-CNRS, 3A Avenue de la Recherche Scientifique, CEDEX 2, F-45071 Orléans, France
2
Pollutrack, 5 rue Lespagnol, F-75020 Paris, France
3
Institute Desbrest of Epidemiology and Public Health, University of Montpellier and INSERM, Allergic and Respiratory Diseases Department, Montpellier University Hospital, Montpellier, IDESP IURC, 641 Avenue du Doyen Gaston Giraud, F-34093 Montpellier, France
*
Author to whom correspondence should be addressed.
Atmosphere 2023, 14(8), 1222; https://doi.org/10.3390/atmos14081222
Submission received: 16 June 2023 / Revised: 19 July 2023 / Accepted: 25 July 2023 / Published: 29 July 2023
(This article belongs to the Section Air Quality and Human Health)

Abstract

:
Air pollution has a strong impact on human health, from respiratory and severe pulmonary diseases to heart attack and cancer. During the 3 years of the COVID-19 pandemic, several peaks of mortality occurred, which could be related to particulate matter (PM) pollution events. The possible effects of PM (PM10 and PM2.5, with diameters less than 10 and 2.5 µm, respectively) on COVID-19 mortality have now been established. To better understand this relationship at the European level for the period 2020–2022, data from 16 representative locations in Europe (81 million people) with PM2.5 levels (µg·m−3) ranging from low to high values were analyzed using statistical methods. The analysis confirms a temporal relation between the peaks of PM2.5 exposure and COVID-19 mortality. The best correlation was obtained considering the history of exposure to PM2.5 pollution during a 2-month integration time coupled with a one-week delay for the COVID-19 mortality. Although the trend of COVID-19 mortality vs. PM2.5 levels varies among locations, the global trend was similar, giving an estimated mean value of a 40 ± 20% mortality increase per µg·m−3 PM2.5 increase. The stronger the positive (negative) gradient of the PM peak, the stronger the positive (negative) gradient of the COVID-19 mortality. These results indicate that a succession of PM pollution peaks could be more dangerous than permanent exposure to moderate pollution levels. Finally, PM number concentrations should be used in the future rather than the PM2.5 mass concentrations (µg·m−3), with the consideration of PM composition to better evaluate the effect of submicron particles on human health, particularly for other respiratory diseases. These results must be considered in the management of future pandemics.

1. Introduction

Ambient air pollution has a large range of negative impacts on human health [1,2,3,4], mainly increasing the number and severity of respiratory and pulmonary diseases [5], including infections [6] and the risk of heart attacks and strokes [7,8]. Also, long-term exposure to polluted air can cause perturbations in the immune system [9]. Air pollution mainly concerns airborne particulate matter (PM) with particles smaller than 10 µm (PM10), and more precisely, smaller than 2.5 and 1 µm (PM2.5 and PM1).
The spread and transmission of the virus could be due to several parameters, such as weather conditions, population density, local sanitary conditions, and air pollution. During the 3 years of the COVID-19 pandemic, several peaks of mortality occurred during particulate matter (PM) pollution events. The PM concentration peaks are the final consequence of human activities combined with weather parameters, with the highest pollution peaks occurring during low winds due to stable anticyclonic conditions. Thus, the possible effects of PM10 and PM2.5 pollution on the new cases and mortality of COVID-19 (SARS-CoV-2) pandemic were intensively studied less than a year after the pandemic began, mainly based on the situation in the Lombardy region (Italy), where air pollution levels and mortality were among the highest in Europe. These studies presented a statistical relation between PM levels and COVID-19 morbidity and mortality during the first phase of the pandemic [10,11,12,13,14,15,16,17], and a significant mortality variability appears between polluted and unpolluted locations. These conditions first consisted of respiratory and cardiovascular distresses [18] and were indeed related to the immune system [19,20]. Nevertheless, only a few studies have investigated the link between PM and COVID-19 mortality at the European level [21].
Although a large number of papers support the existence of a relation between air pollution exposure and COVID-19, one can argue that this correlation could be an artifact due to, for example, weather parameters. The number of COVID-19 cases was found to be lower during periods of high-speed wind, which dissipates the PM pollution. The authors of [22,23] studied the correlation between COVID-19 and weather conditions during the first phase of the pandemic and concluded that, as far as local meteorology is concerned, temperature and humidity are negatively correlated with the number of cases. In winter conditions, PM pollution often increases when temperature decreases due to heating that produces fine particulates, thus making it difficult to decorrelate the various parameters. Nevertheless, the absence of a relationship between COVID-19 outbreaks and temperature and UV radiation [24] suggests that air pollution is indeed the main contributor to COVID-19 impact. In addition, during a long series of observations conducted in France, abatement from rain precipitation was observed for particles larger than 10 µm but not for particles 0.2–10 µm [25], thus supporting an intervention of fine PM independent of meteorological factors. The proper role of air pollution was further confirmed by studies in which air pollution and COVID-19 morbidity and mortality were statistically related after adjusting for meteorological variables [18].
All measurements from 32 cities and districts of 6 countries in Western Europe have been combined to show a statistical trend between PM2.5 levels and COVID-19 mortality for a period longer than all previous studies from early 2020 to early 2022 [26]. The authors found that an increase in COVID-19 mortality aligned with an increase in PM2.5 mass concentration, leading to a factor 5.5 ± 1.0% increase in mortality when the pollution increased from 5 to 45 µg·m−3. This corresponds to a mean increase of 10.5 ± 2.5% in mortality per PM2.5 1 µg·m−3. More precisely, the trend, similar for the 6 countries analyzed, depended on the analysis period and decreased with time from the first spread of the pandemic in early 2020 to the vaccinal race after mid-2021. This mean result is close to that of previous studies showing that a PM2.5 increase of 1 µg·m−3 can lead to at least an increase of 11% in COVID-19 mortality in the United States [27]. Similar values were found in England [28], the Netherlands [29], Northern Italy [30], Brazil [31], and in a meta-analysis of 35 observational studies [32]. All these studies suggest that the relative effect of PM pollution on COVID-19 mortality is not country-dependent.
A Spearman correlation coefficient of 0.44 was found when analyzing the data in the US up to mid-2021 [33]. The Spearman correlation was between 0.45 and 0.61 for the most affected part of Italy during the first semester of 2020 [14]. A low but positive correlation of 0.29 was also found in Poland in Spring 2020 [34]. Finally, it has been shown that for the 3 months of 2020 in Wuhan City (China), the Pearson correlation rose to 0.4 considering a lag time of about 20 days between PM2.5 spikes and COVID-19 mortality [35]. These positive correlation values support the hypothesis of a statistical link between PM2.5 pollution and COVID-19 mortality.
The various processes of virus transmission that can produce the background mortality levels are not considered here. The aim of this paper is to focus on how strong PM pollution events, regardless of their origin, may possibly accelerate the COVID-19 mortality rate. To better understand such a relation, 16 representative locations in Europe are considered with mean PM2.5 levels, ranging from low to high, for a total of 81 million people. This study is motivated by the interest to first better evaluate the time evolution of the relationship between PM2.5 and COVID-19 mortality at different locations in Europe, and second, to provide new results on the possible lag time between the pollution events and COVID-19 mortality and on the effect of the strength and duration of the events.

2. Materials and Methods

The main period of the pandemic is considered here to be from early 2020 till the end of 2022. As explained before [36], the comparison of the temporal evolution of PM2.5 spikes and COVID-19 mortality needs reliable data in order to minimize the statistical bias that irregularly sampled data may generate (such as missing mortality data for several days followed by sudden data adjustment).

2.1. PM2.5 and COVID-19 Data

PM2.5 mass concentration data were available from different sources. The initial sources were the national air quality monitoring networks; however, because of their operational cost, only a few reference stations were available per city or region. The other sources were non-official sources with a higher resolution. The Pollutrack networks in several cities of Europe are considered, where measurements are gathered using mobile light optical aerosol counters deployed on rooftops of hundreds of electric vehicles, providing a better spatial coverage of the cities than using just a few reference fixed stations [36]. Thus, all available PM2.5 daily measurements are averaged in a given location from the air quality networks, and, when available, from the Pollutrack data that provides a better integration of the hyperlocal PM2.5 variability. Such measurement heterogeneity can complicate the analysis when conducting a direct comparison of the PM2.5 pollution levels from different locations in Europe. Then, the relation between PM2.5 levels and COVID-19 mortality will be considered separately for the different locations. Also, working on the relative variations of PM2.5 levels, instead of absolute values, could minimize the effect of such heterogeneity.
For each location, COVID-19 mortality daily data are retrieved from the John Hopkins University website [37].
To go further than in previous works [26], the results from 16 locations (cities, regions, or countries) are considered for a total of almost 81 million people (Table 1), almost equally representing the most polluted regions in Europe (where reliable COVID-19 data are available) and the regions with medium and low pollution levels, to facilitate direct comparisons. The “low pollution level” is defined as when PM2.5 mean mass concentration during the considered period is below 10 µg·m−3 (twice the new annual mean value recommended by the World Health Organization as of September 2021), “medium pollution level” when the mean value is between 10 and 15 µg·m−3, and “high pollution level” when the mean value is higher than 15 µg·m−3 (three times the WHO-recommended annual average). Information on the locations analyzed is presented in Table 1.
The analysis stops at the end of 2022 because the mean COVID-19 mortality decreased in Europe due to vaccination, herd immunity, and the return of the classical seasonal flu and respiratory diseases. However, the date of the beginning of the analysis depends on the availability of COVID-19 data and on the spread of the pandemic. To be able to compare similar effects of the PM2.5 level on COVID-19 mortality for the various locations, the period when the pandemic was locally not well managed was sometimes excluded, as well as when the lockdowns had significantly affected the mortality trend for short time periods. The starting dates of the time period considered for the 16 locations are provided in Table 1.

2.2. Data Analysis Procedure

As previously proposed [26], mortality data were divided by the population of the location. Then, both mortality and air pollution data were integrated over one week to limit the scatter of daily pollution values and daily variations in the collection process of the mortality data. A sliding smoothing procedure was applied to three consecutive points to reduce the remaining short-term variations in the data. It was then necessary to adjust the time scale of the two curves by researching a better time resolution of the pollution trend when compared to the COVID-19 mortality trend. Tests and trial procedures showed that applying a sliding smoothing procedure to the pollution curve was not enough to increase the correlation between the two curves. Thus, a more complex procedure is proposed by using two freedom parameters. The first one assumes that the effect of pollution on COVID-19 mortality is not direct but requires an integration time; a given exposure time to pollution peaks could be needed to significantly irritate the pulmonary system, which will consequently become more sensitive to COVID-19. Mathematically speaking, each value of PM2.5 pollution was replaced by the mean of the previous PM2.5 values during a given time period, acting as an integration procedure (Equation (1)), while the COVID-19 mortality values remain unchanged.
M C n = 1 A   * i = n A n M C i
where MC is the weekly mean mass concentration and A is the number of weekly MC considered.
The second parameter is a possible positive lag time (i.e., a shift) between this new PM2.5 curve and the mortality curve, which could be related to the lethality of COVID-19 after invading the pulmonary system. These two parameters are adjusted to search for a higher correlation between the two curves.
All the results and the proposed conclusions in this paper result from different analyses. First, the Pearson correlation coefficient was used for the temporal evolution of COVID-19 mortality with PM2.5 pollution levels; lag times between the two sets of data were also considered as a possibility to increase the correlation. Then, we introduced the notion of gradients for the temporal evolution of PM2.5 and COVID-19 mortally by calculating at a given time the difference between each value and the value just before, and dividing the results by a temporal window (Equations (2) and (3)).
G M n =   M C n M C n 1 / t
G C n =   M O n M O n 1 / t
where GM is the gradient for the mass concentrations, GC is the gradient for the COVID-19 mortality, MC is the mass concentrations, MO is the COVID-19 mortality, and Δt is the time variation equal to 1 week. This calculation was used to establish a relationship between the slope of the time evolution of PM2.5 and COVID-19 mortality, considering relative variations rather than absolute values. Finally, for all locations, the relationship between these parameters was established by applying linear fits (the data were integrated over dedicated windows to reduce the scatter of the individual values). As the data could be scattered at a given location mainly because of the mortality-reporting uncertainties, in each location, air pollution data and their corresponding mortality data at the corresponding time were averaged with steps of about 0.5 µg·m−3; then, the linear fit was applied.

3. Results

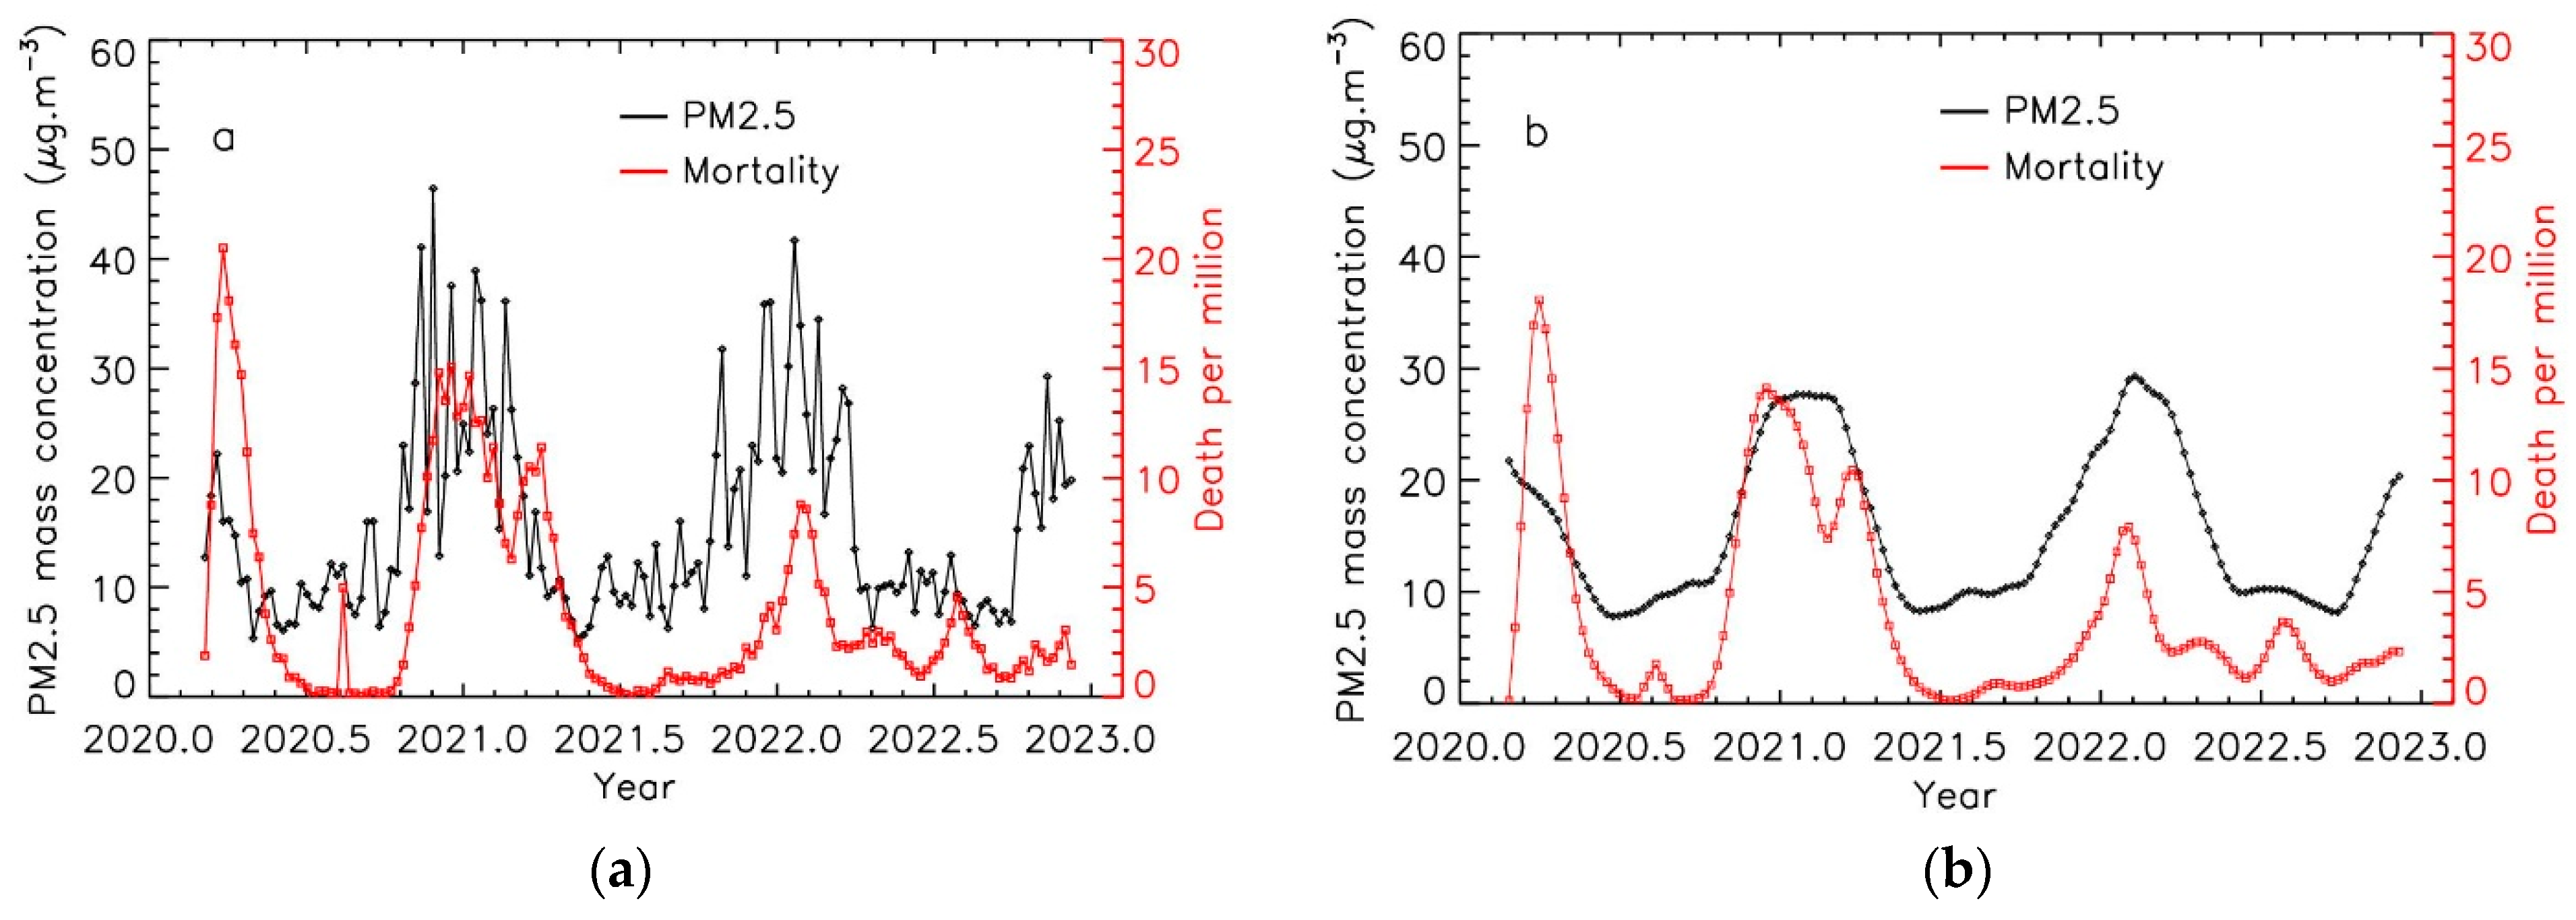
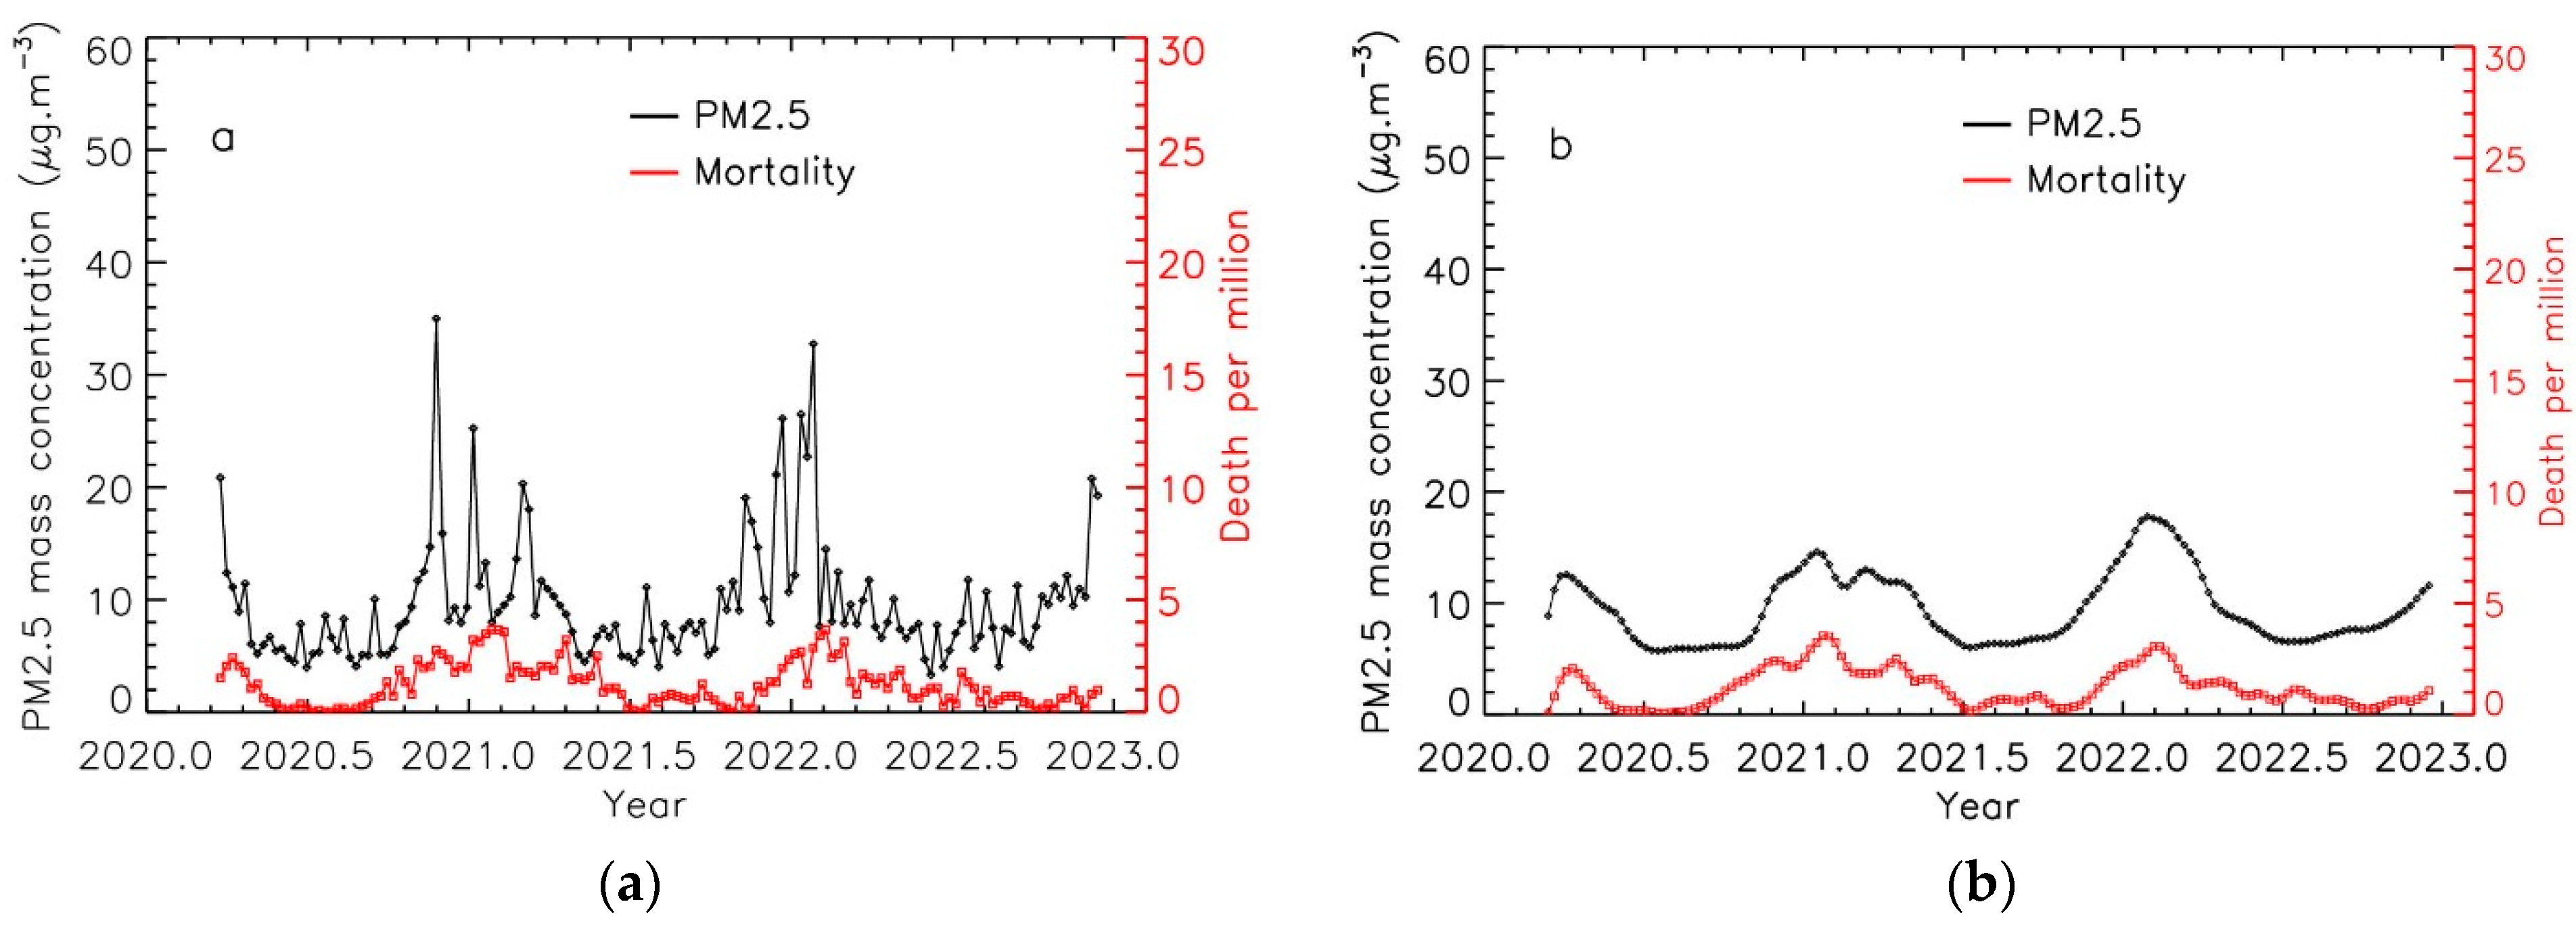
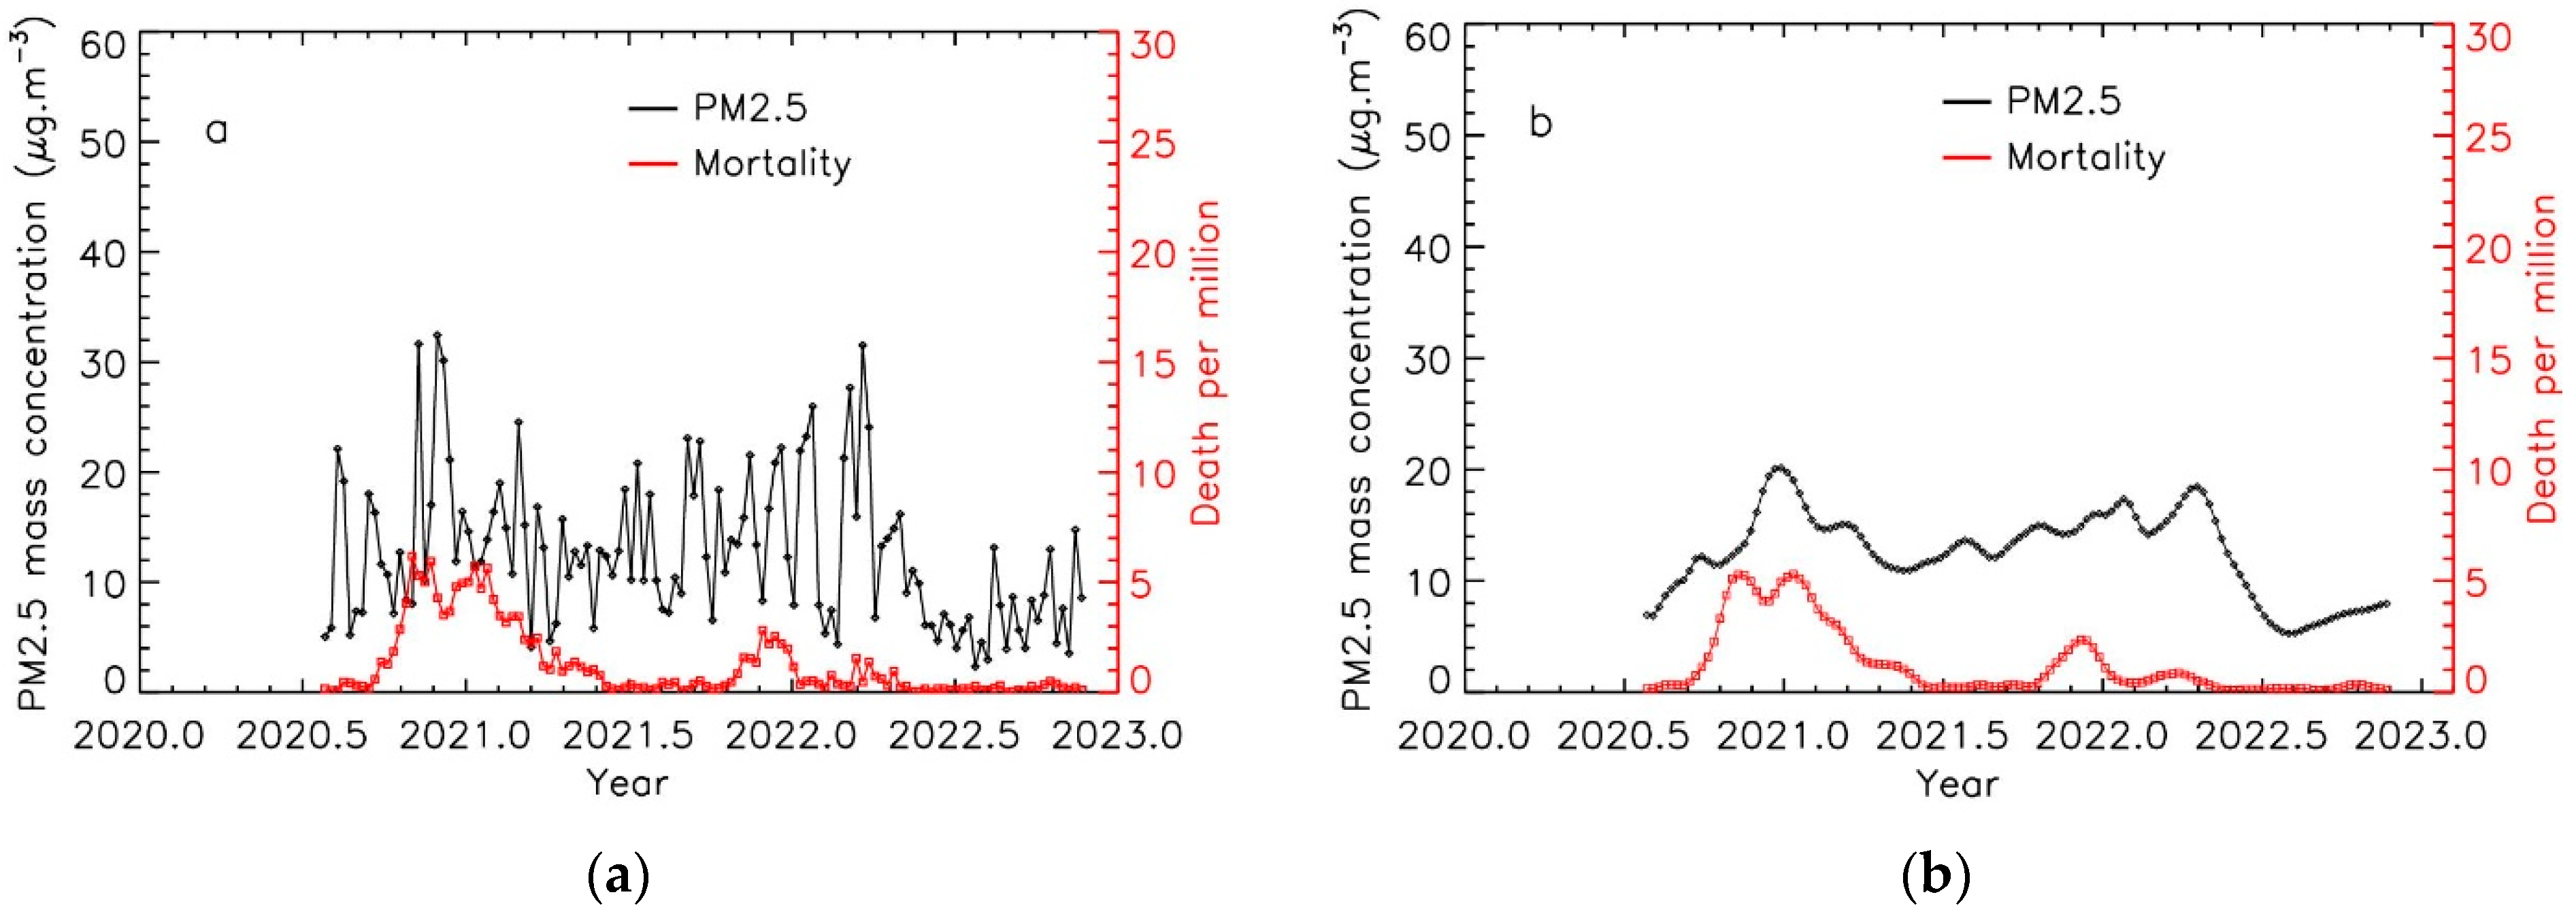
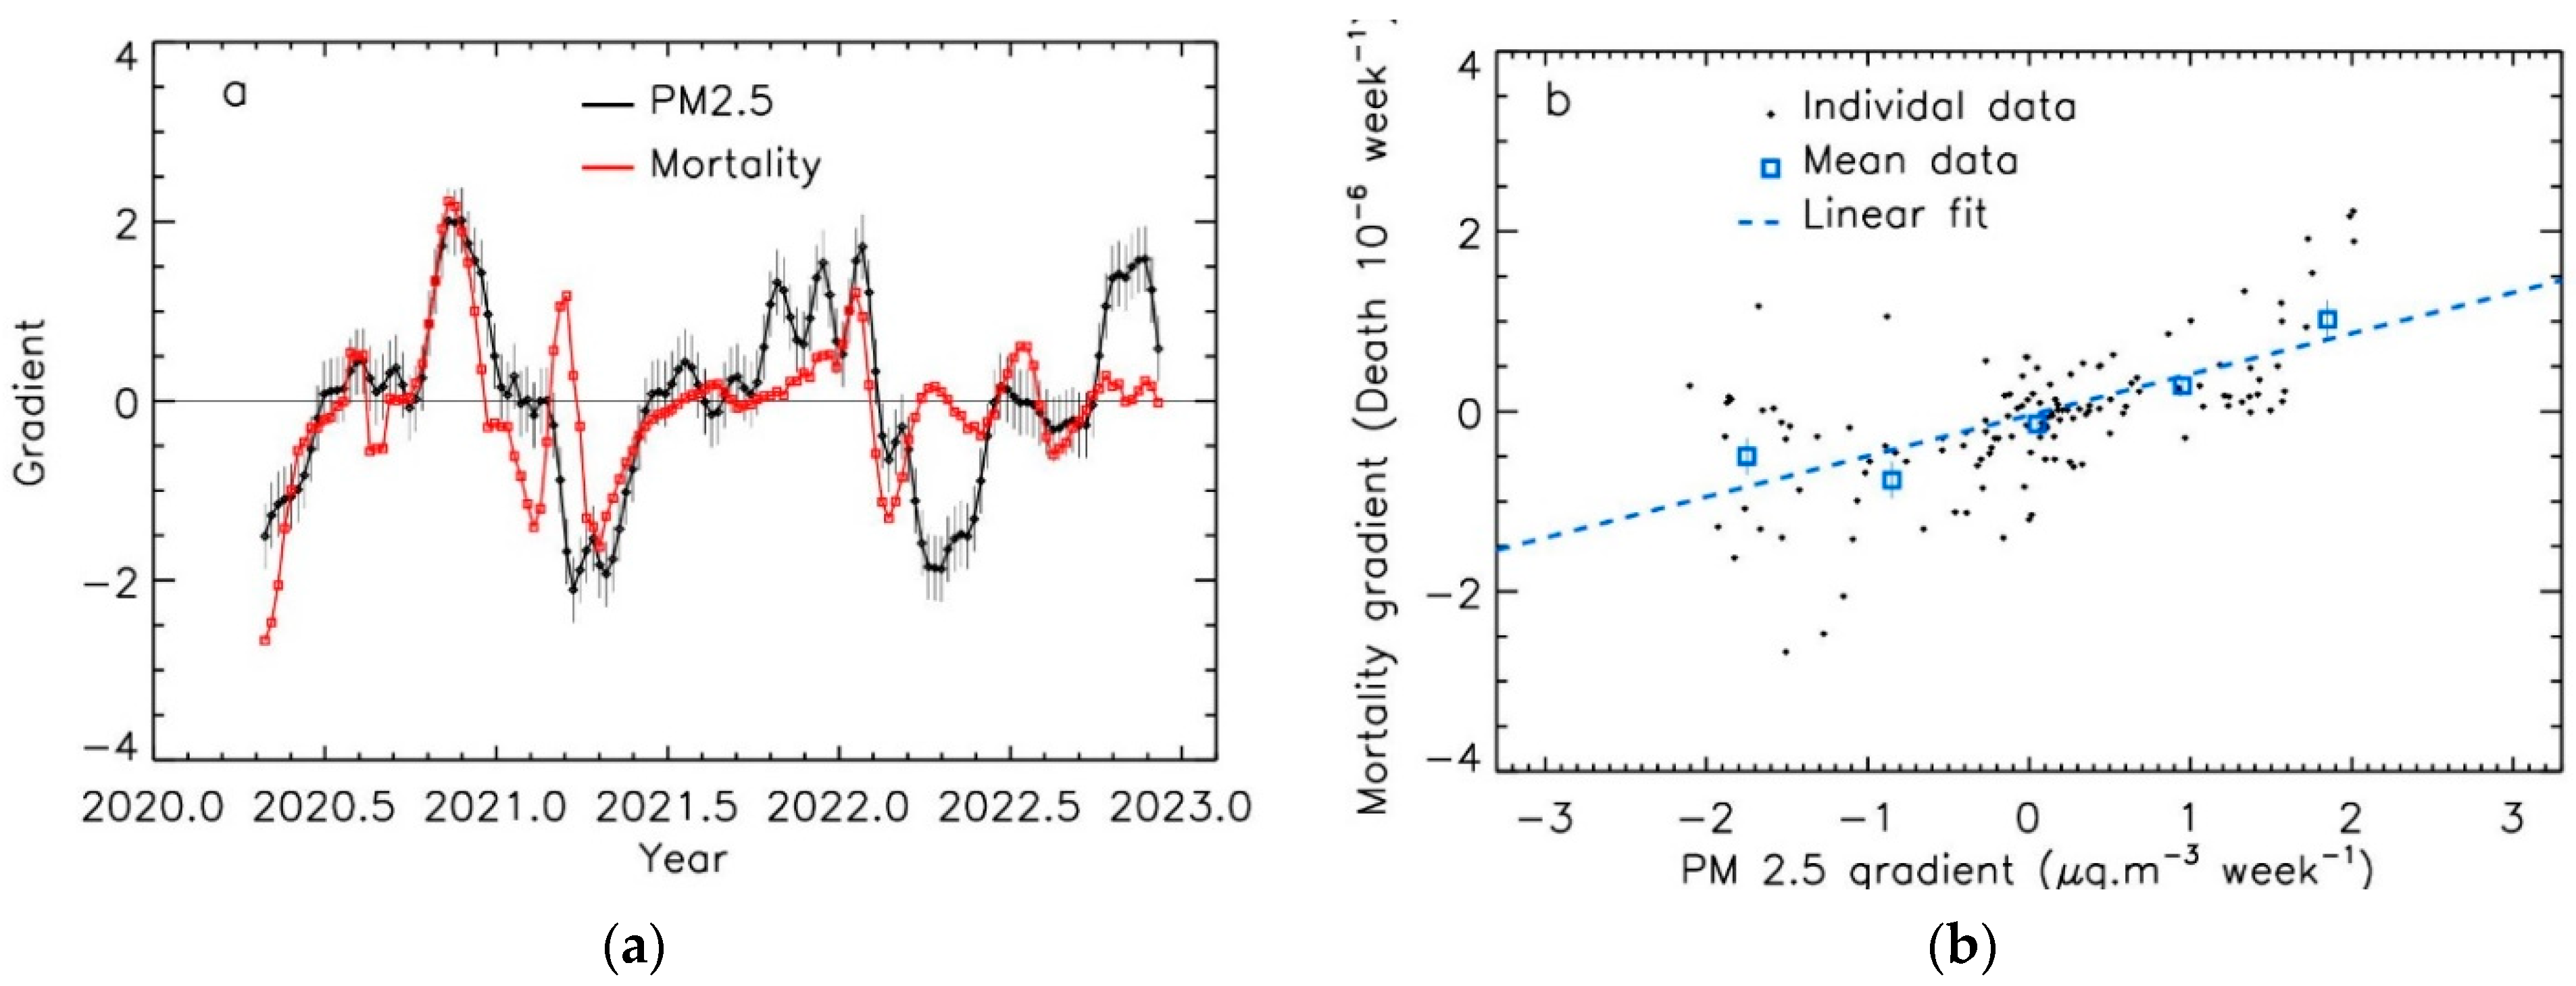
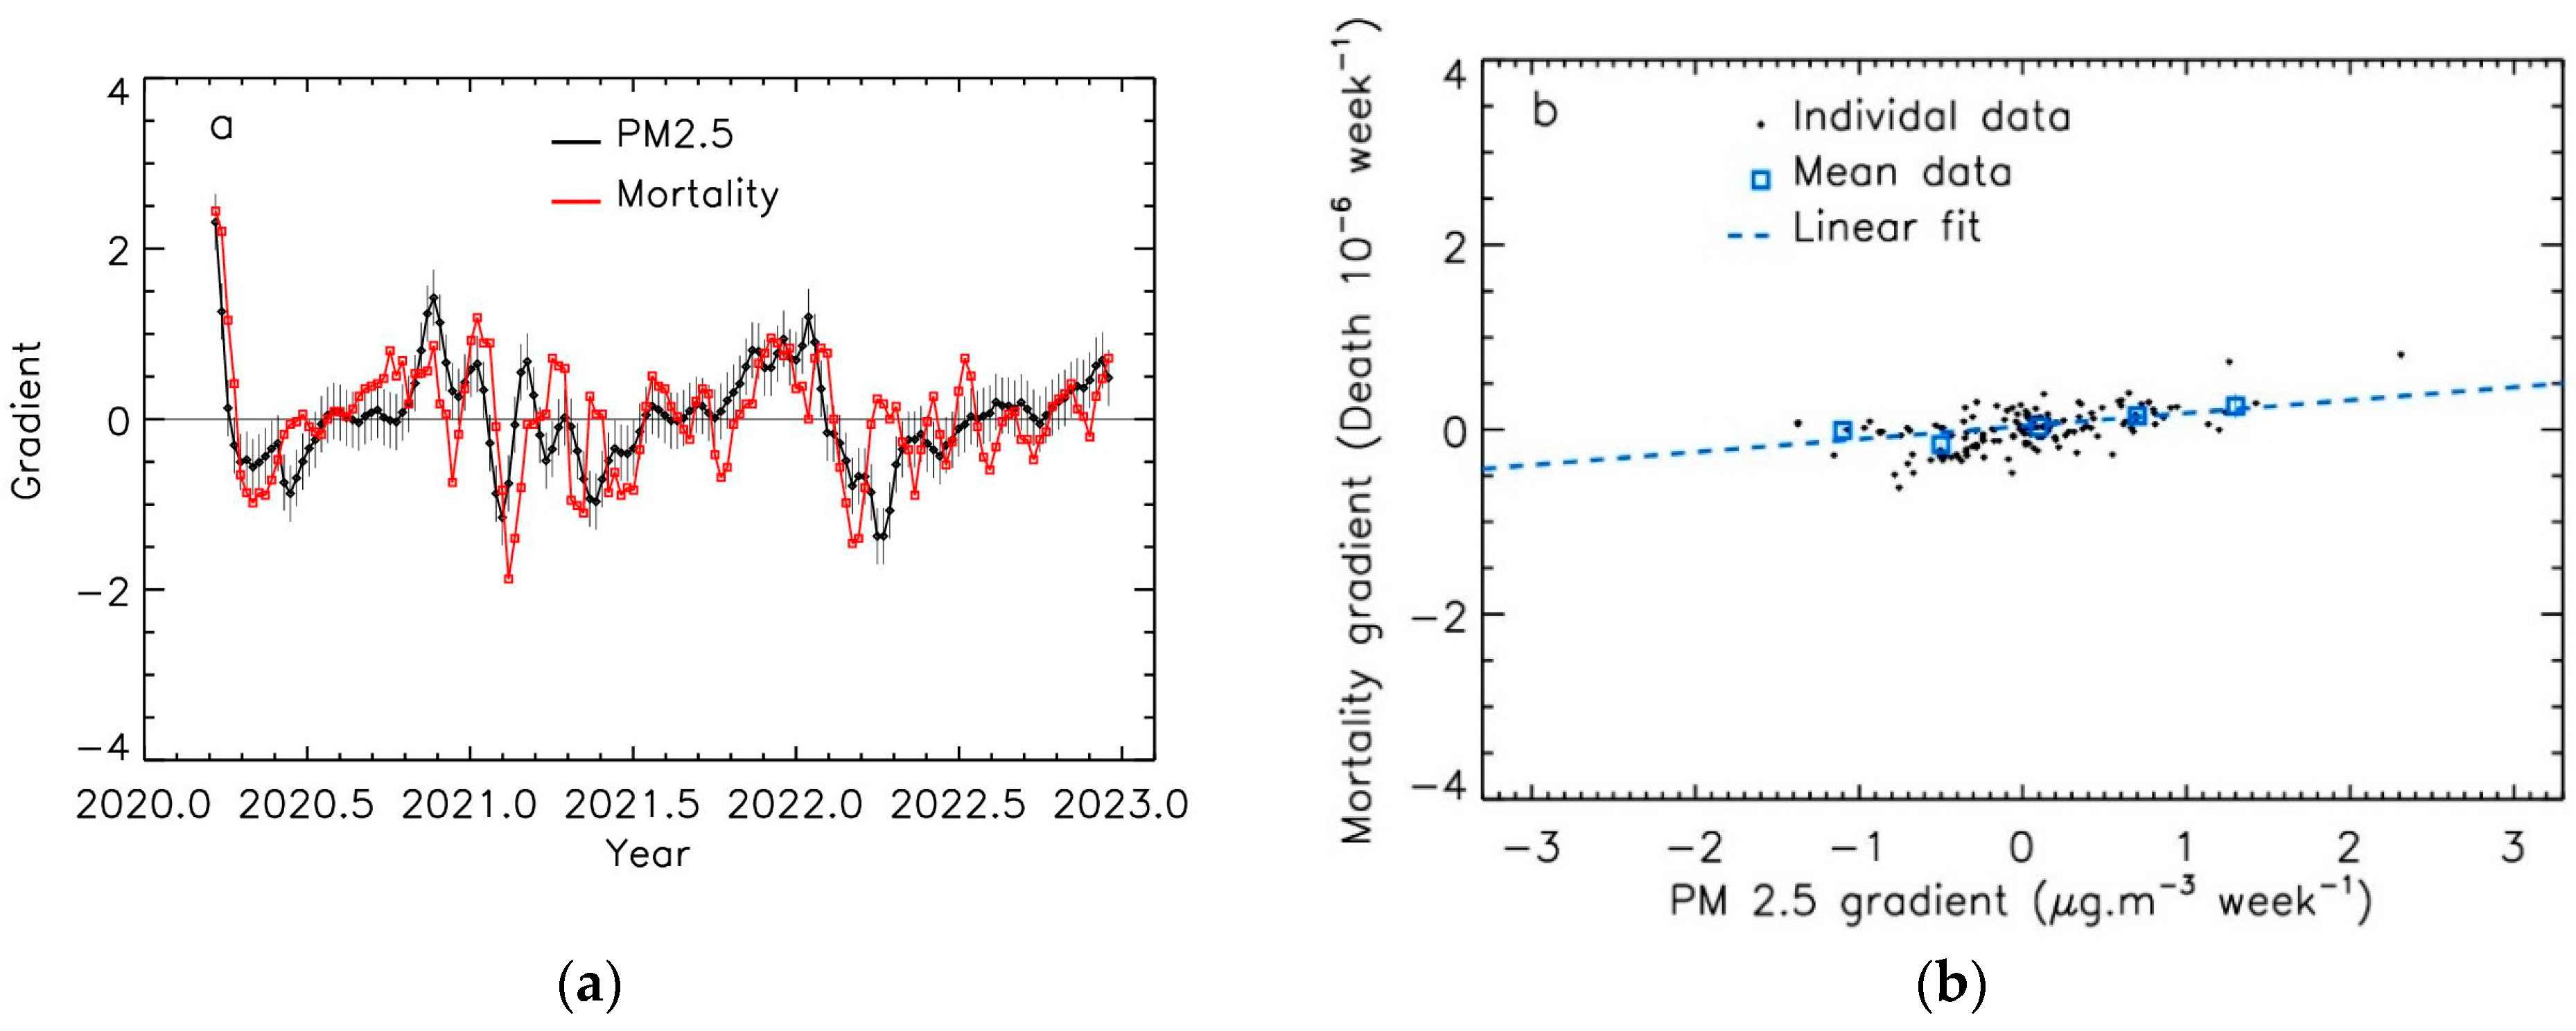
3.1. Time Evolution of PM2.5 Levels and COVID-19 Mortality

Figure 1a and Figure 2a present examples of PM2.5 pollution and COVID-19 mortality for one of the most polluted regions in Italia (Emilia-Romagna) and for a low-pollution region in France (Gironde). The curves do not present the same behavior; the air pollution curve oscillates more than the mortality curve. It can be suggested that the mortality evolution is a slower phenomenon than the air pollution evolution, which is strongly linked to the short time-scale variations in the meteorological parameters (mainly wind speed).
Figure 1b shows the time evolution of PM2.5 levels and COVID-19 mortality for the Emilia-Romagna region, exposed to high levels of pollution, using weekly integrated data after applying the integration procedure for PM2.5 data. This procedure was applied to increase the correlation between the curves, even for regions with low pollution levels like the Gironde region, as shown in Figure 2b and for regions with medium pollution levels like Zuid-Holland (Figure 3).
Pearson correlation coefficients are calculated for the raw measurements and PM2.5 measurements after applying the first sliding smoothing and the two-parameter adjustments, as given in Table 2. The mean value for the integration is 8.8 ± 2.5 weeks, and the mean value for the shift (lag-time) is 0.7 ± 0.8 weeks. These results could indicate that an exposure of about 2 months to significant pollution peaks is needed to sufficiently irritate the pulmonary system before impacting COVID-19 mortality. These deleterious effects are reversible and are similar to the negative trends (decrease in mortality with pollution dispersion). On the other hand, about a one-week shift may indicate the swiftness of virus lethality.
The proposed procedure strongly improved the Pearson correlations for most cases, reaching correlations of up to 0.8. Considering the strength of the PM2.5 spikes and COVID-19 mortality rates that differ from one county to another, the convergence to similar values seems to indicate that these correlations are real and that the proposed procedure can reveal the time effect of pollution on COVID-19 mortality.

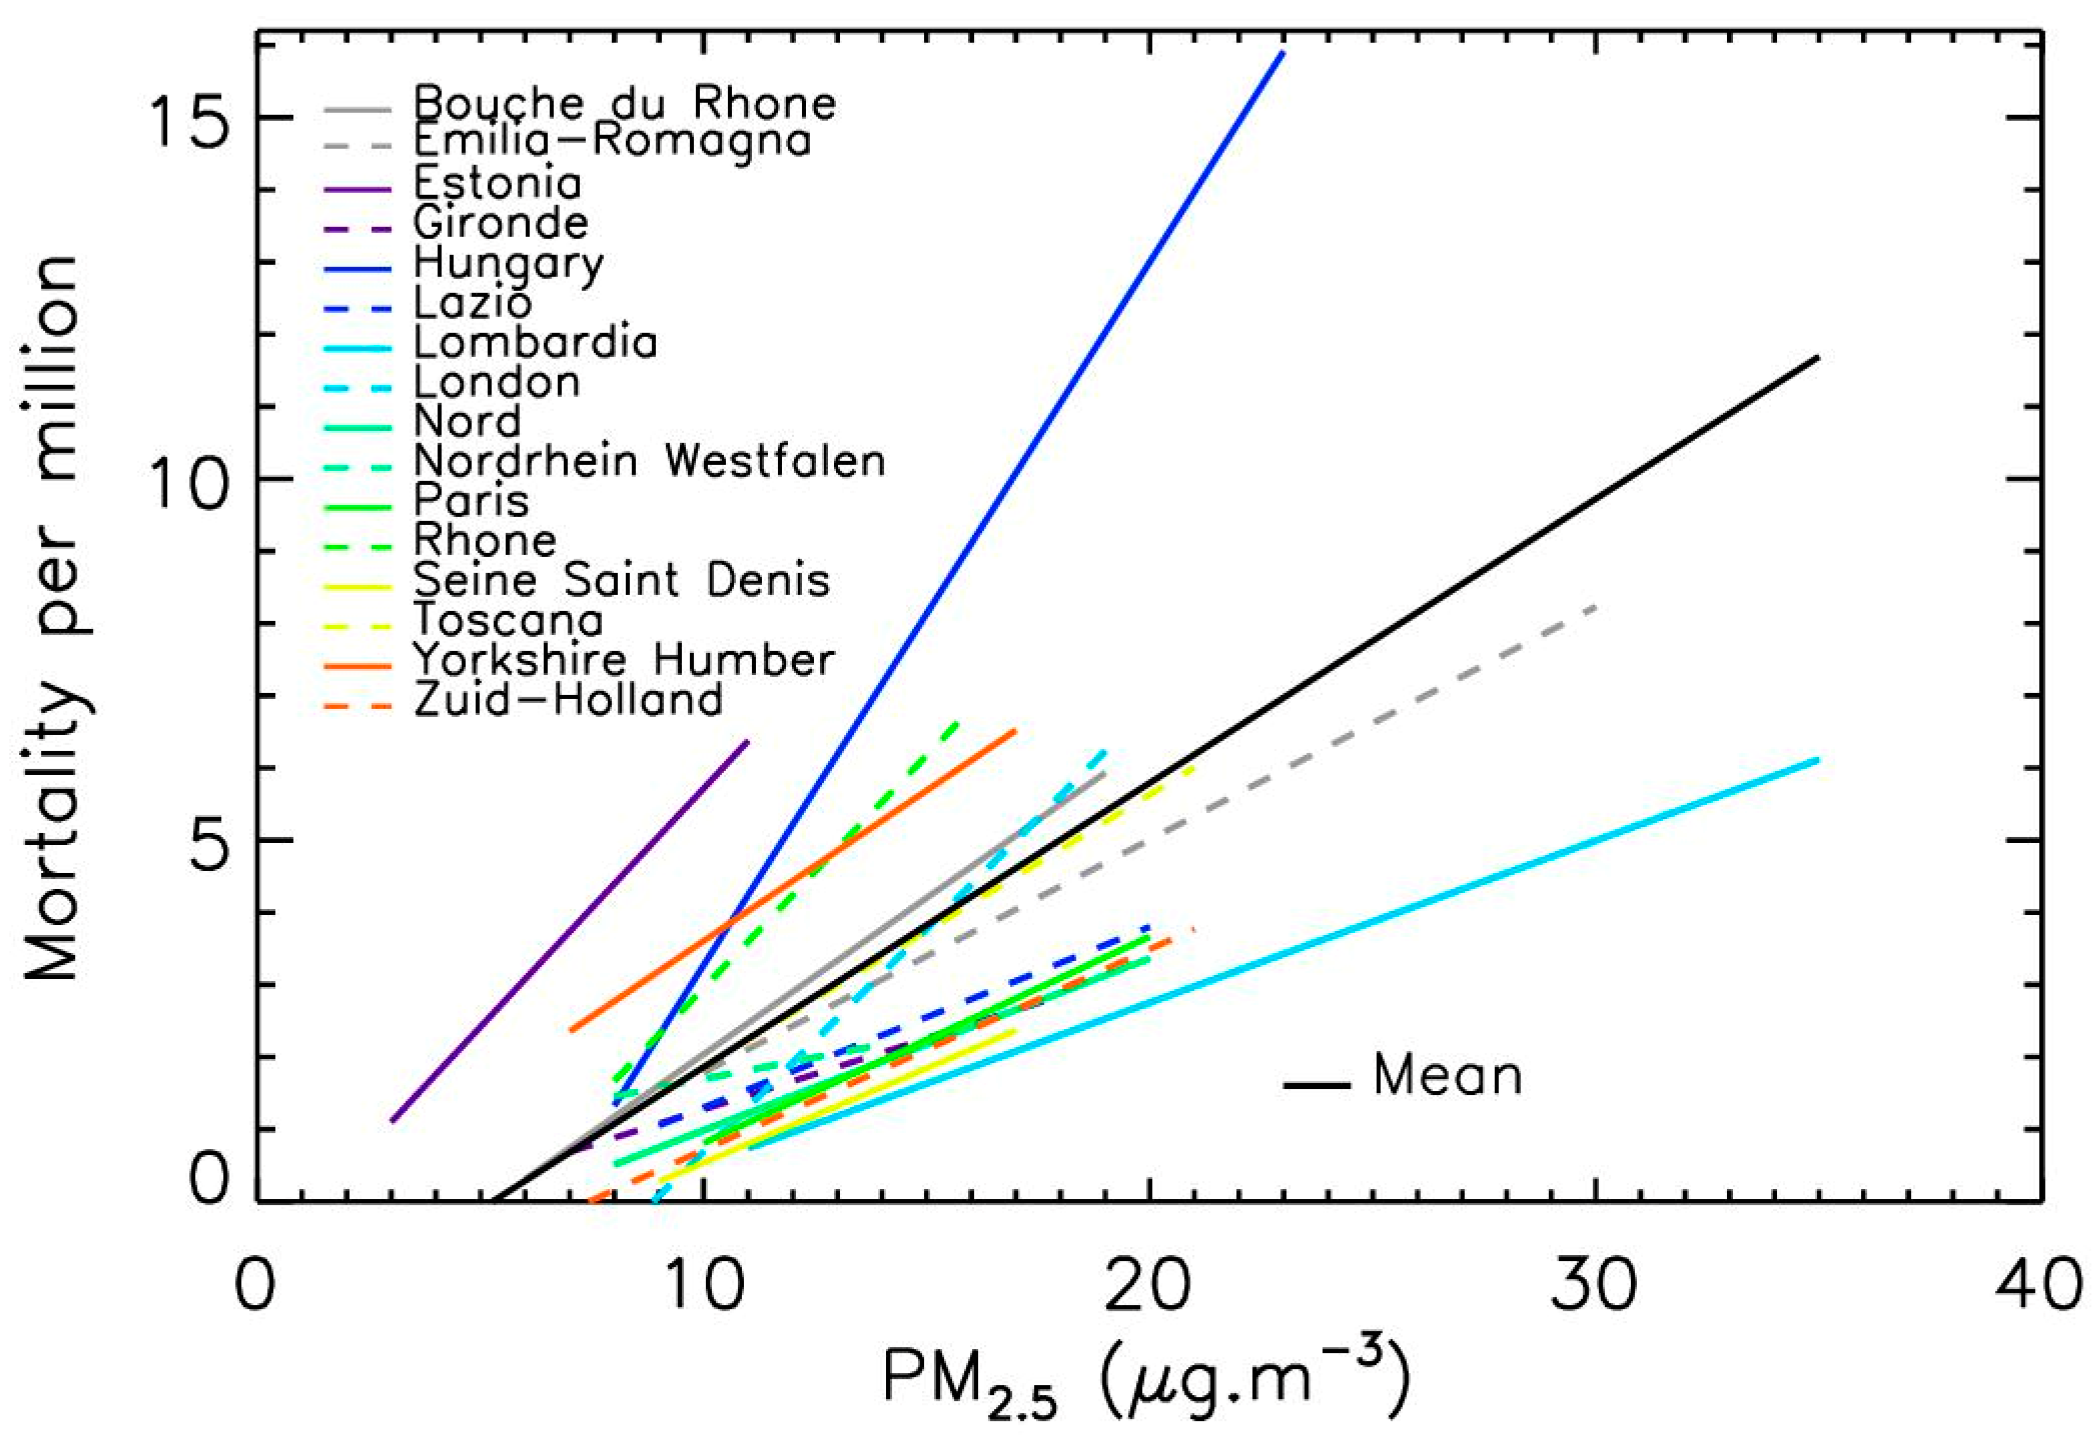
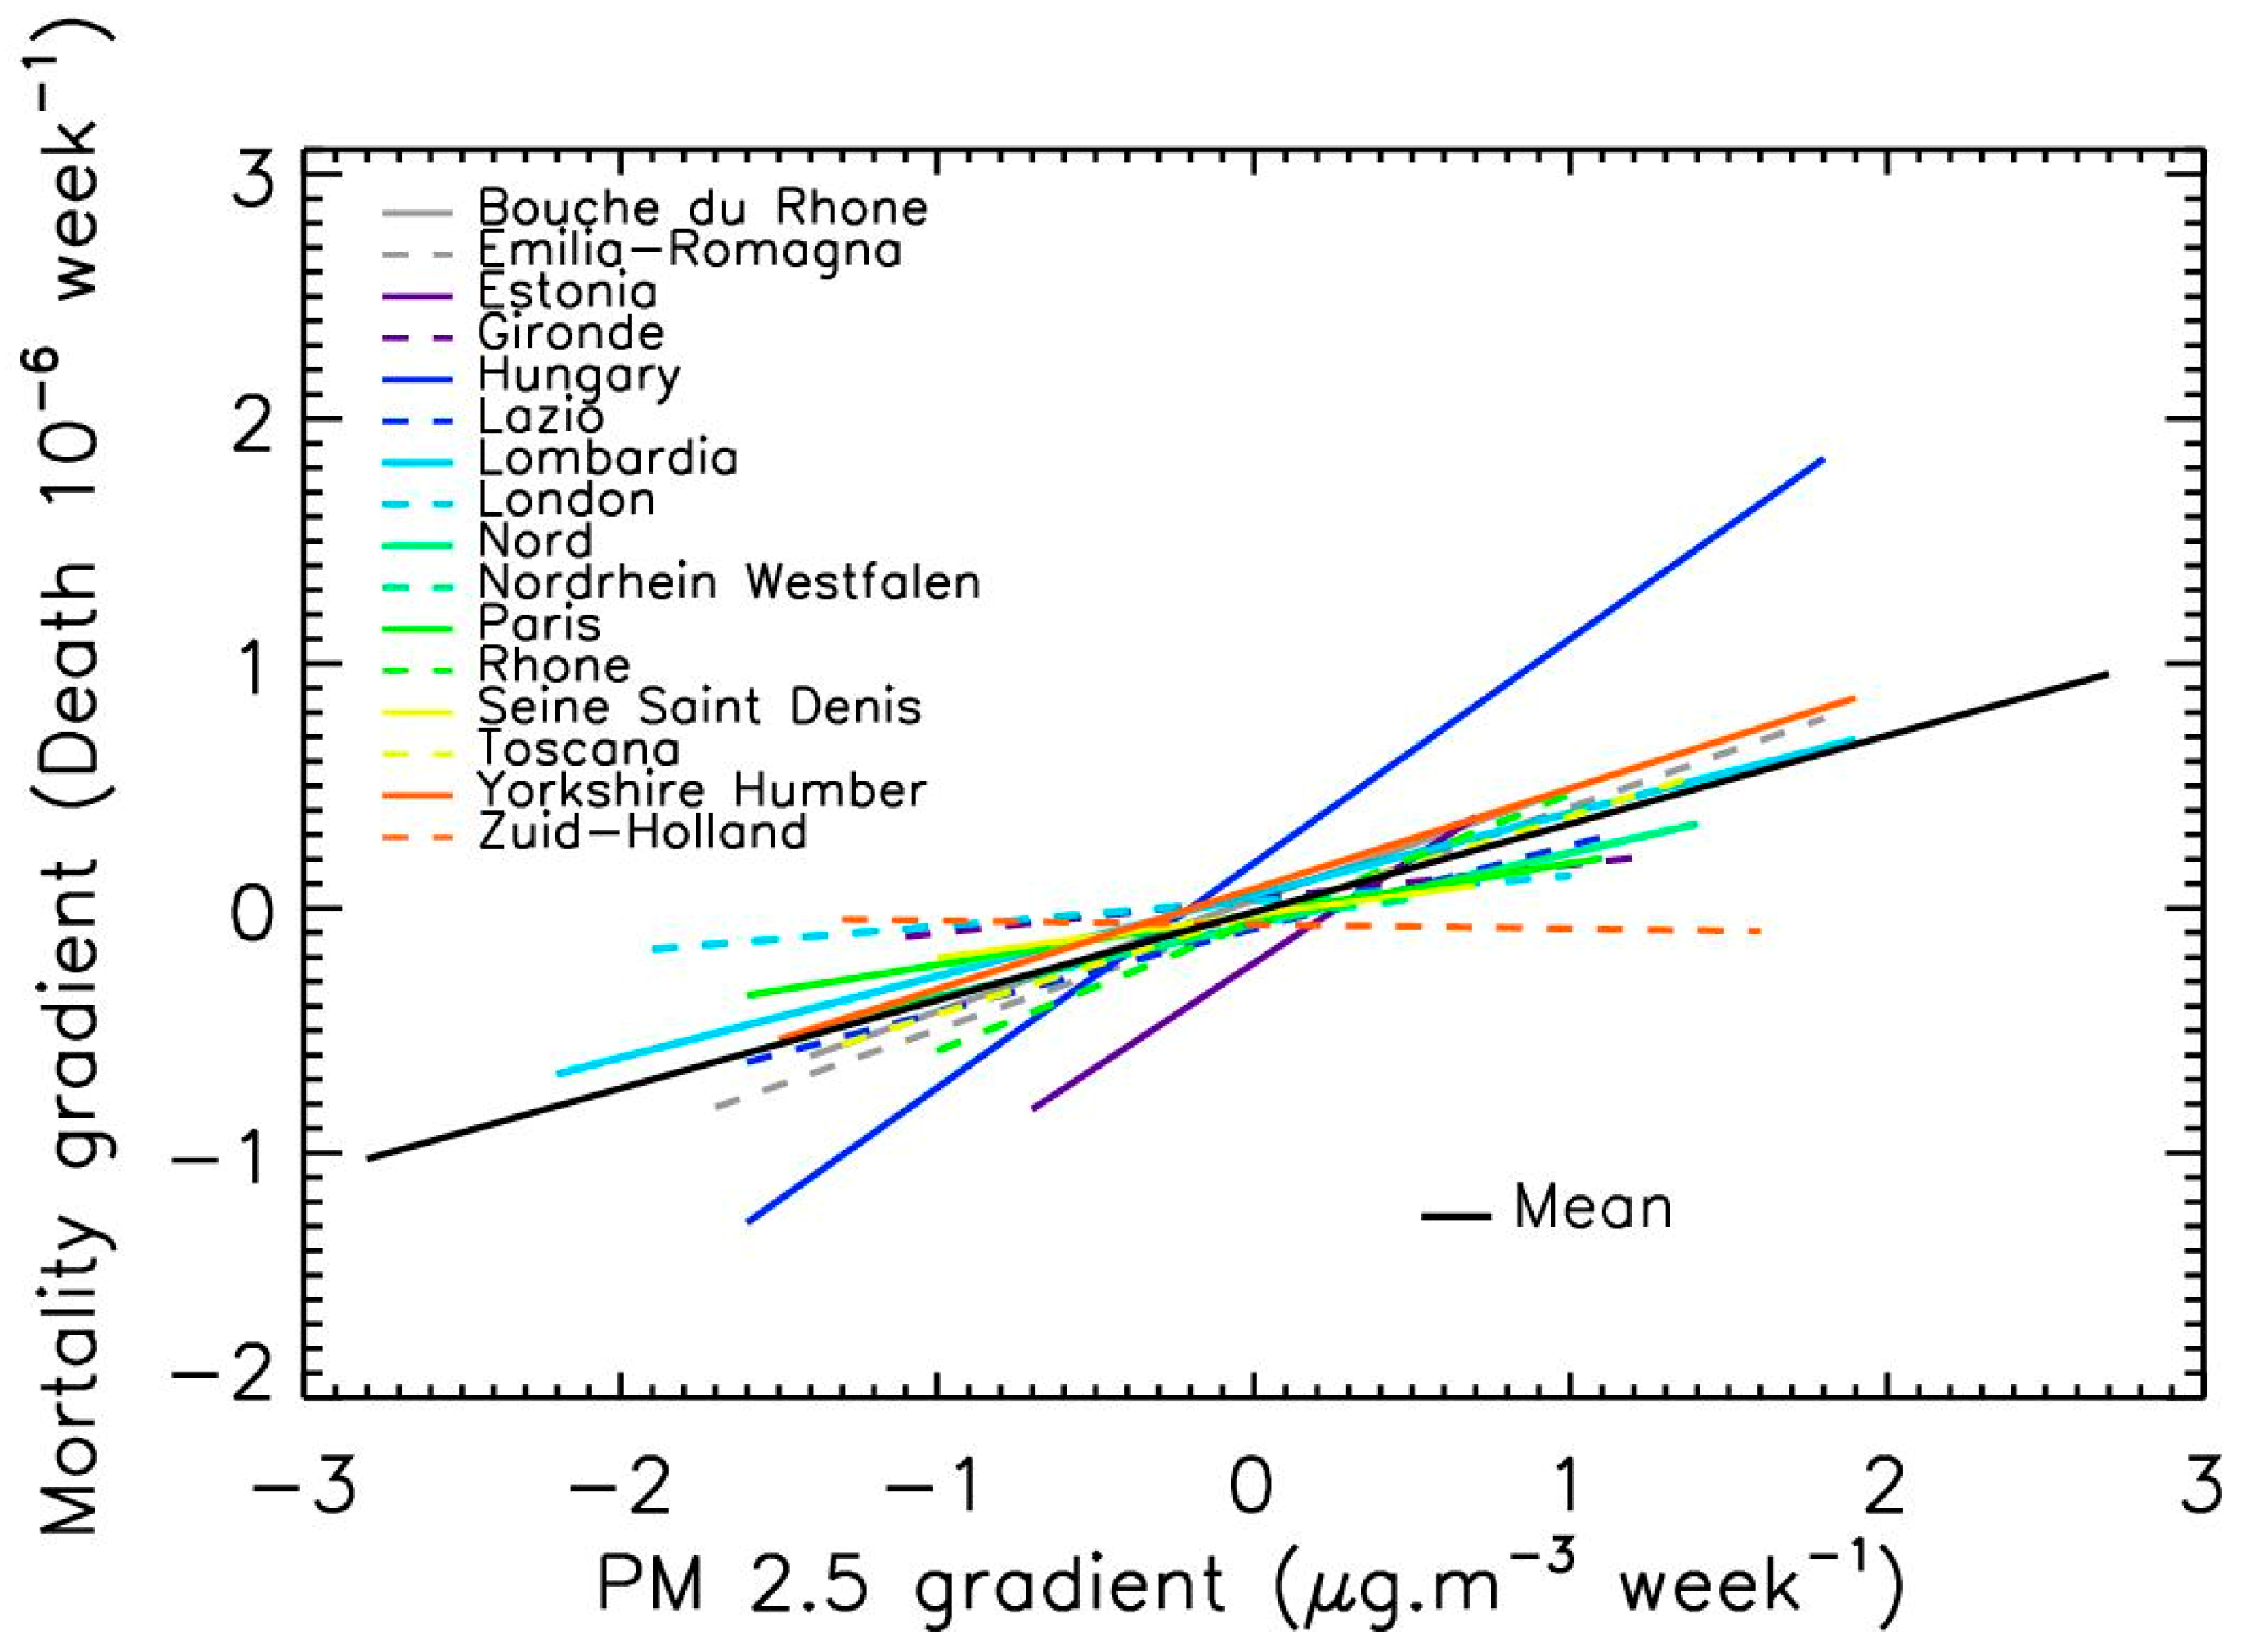
3.2. Linear Relation between PM2.5 Levels and COVID-19 Mortality

The relationship between COVID-19 mortality and PM2.5 exposure seems to follow a linear relationship, although individual measurements were scattered from one location to another. This could be due to the possible heterogeneity of the population density (for example variations between large towns and rural zones), to the health status of the populations that can influence mortality, and to the local management of the pandemic [26]. Then, at each location, COVID-19 mortality per million inhabitants is averaged to produce 5 or 6 integrated values for PM2.5 mass concentration intervals of 5 to 10 µg·m−3. The error bars are calculated by considering the standard error of the mean. Since the evolution of the mortality values per µg·m−3 follows a linear trend at each location, at least in the first order, a linear fit is applied to these data.
Figure 4 presents the linear fit for the 16 locations (mean correlation of 0.9 per fit), obtained using between 100 and 150 points per location. The same trend is systematically observed with an increase in mortality with increasing PM2.5 levels, even for locations with low air pollution levels. The difference in the slope and the value at origin (PM2.5 value for zero mortality) slightly differed from one location to another because of the population heterogeneity and pandemic management variations. The mean value of the slope is 0.39 ± 0.22, meaning a mortality increase of about 40 ± 20% per 1 µg·m−3 PM2.5 increase.
The shape of the curves for the time evolution of PM2.5 levels and COVID-19 mortality suggests that a relationship exists between the slope of the curves. The gradient values had similar magnitudes for COVID-19 mortality and PM2.5 spikes. Figure 5 and Figure 6 present examples of the Emilia Romagna and the Gironde regions, respectively. The mean features are well correlated between the two curves; nevertheless, the agreement between the two curves seems lower after 2022, which could be due to the effect of the vaccine that decreases the amplitude of mortality, and the progress of herd immunity.
The synthesis of the linear fits for the gradients at the 16 locations is presented in Figure 7 (mean correlation of 0.9 per fit). Globally, COVID-19 mortality gradients also linearly increased with increasing PM2.5 gradients, and the mean slope was 0.36 ± 0.25. These results indicate that the strength of the PM2.5 peak is also an increasing factor contributing to COVID-19 mortality.
In fact, three groups can be itemized: the locations presenting a strong slope (Hungary and Estonia), the locations with a close-to-zero slope while having a medium mean level of pollution (Zuid-Holland, London, UK), and the other cities. The difference between the first and the third group could once again be due to the varying management of the pandemic and population densities. Although only two cases have been identified, the second group could indicate that cities with almost constant pollution levels, or without successive relatively short-lasting peaks of PM2.5 and low values in between, could limit pulmonary inflammation. Thus, steep variations in PM2.5 exposure rather than permanent exposure to medium pollution levels could be an aggravating factor of COVID-19 mortality.

4. Discussion

This study conducted a more in-depth investigation of the time relation between PM2.5 levels and COVID-19 mortality using data from 16 representative European locations. The results are summarized in Table 3.
The COVID-19 mortality increase of about 40 ± 20% per each 1 µg·m−3 PM2.5 increase is strongly higher than the 10% value previously reported [26,28,29,30,31,32] and can be explained by two different reasons. The first reason is that the mean value is dominated by the locations with high values, as for Hungary, although most of the locations remain in the 10–40% increase range. The second reason is that the proposed method of data analysis reduces the scatter of the data and increases the correlation between PM2.5 levels and COVID-19 mortality time evolution, thus increasing the trend.
Furthermore, exposure to several PM peaks during a 2-month period constituted the main factor for mortality increase, rather than permanent exposure to (medium) pollution levels. The stronger the positive gradient of the pollution peak, the stronger the positive gradient of COVID-19 mortality; this effect is reversible, with a faster decrease in COVID-19 mortality observed during a faster decrease in PM2.5 peaks. Thus, the lag time combined with the strength and the duration of the pollution peaks should be considered by health policies for the management of new and seasonal pandemics.
To explain the observed relation between PM2.5 levels and COVID-19 mortality, it has been proposed [18] that fine PM and overall ultra-fine particles (UFP) increase airway permeability by reducing tight junction proteins, which facilitates virus penetration, as well as the fact that PM boosts the action of the angiotensin-converting enzyme 2 (ACE2). This explanation was confirmed in a review of the process of lung inflammation resulting from PM exposure, and thus the impact on COVID-19 mortality following a cytokinic storm [38]. In particular, the authors studied the role of the angiotensin-converting enzyme 2 (ACE2), a receptor that is involved in the entry of the virus into pulmonary cells. Indeed, ACE-2 is a receptor for coronaviruses, including severe acute respiratory syndrome coronavirus 1 and 2 (SARS-CoV), and ACE-2 is overexpressed under chronic exposure to air pollution such as NO2 and PM2.5. ACE-2 is overexpressed in the case of medical comorbidities that contribute to the development of severe COVID-19.
Different natures of PM are present in ambient air [20]. Apart from dust episodes in Europe mainly coming from Sahara [39], the main PM peaks are due to anthropogenic activities. The peaks occur during periods of anticyclonic conditions when pollutants accumulate and cannot be dispersed by winds [36,40]. The primary and secondary PM originate from vehicular traffic throughout the year (mainly carbonaceous particles), industrial activities (all kinds of particles), heating in winter (mainly carbonaceous particles), and agricultural activities in autumn and spring (mainly ammonium). Other kinds of particles can also be present, like plastic, mineral, and metal particles, originating from tyres, cars, and train brakes. In fact, no seasonal effect was linked to the origin, and thus the main nature of the particles was scrutinized during our analysis. The PM composition is complex; thus, it is difficult to estimate the kind of particles to which the population is exposed. Consequently, it cannot be concluded if COVID-19 mortality is due to all kinds of particles or specific ones.
Another parameter to be considered is the size distribution of particles. The mass concentration of PM2.5 corresponds to all particles smaller than 2.5 µm, although the largest ones mainly contribute to the values. Obviously, the smaller the particles, the deeper they penetrate into the human body. It has been reported [4] that PM0.1 (particles smaller than 100 nm) cause more pulmonary inflammation. Thus, it is better to consider the PM size distribution rather than the integrated mass concentrations since the size distribution depends on the origin of the pollution events [38]. The lower limit of scientific optical aerosol counters is about 200nm (and 300nm for Pollutrack sensors used in this study); thus, they cannot detect such ultrafine particles. Expensive instruments could be used, such as the scanning mobility particle sizer systems [41], but they are not routinely operated by air monitoring networks; they are mainly used during dedicated field campaigns. Thus, one solution for future studies should be to use the smallest size classes of Pollutrack sensors in cities where they are already deployed (33 European capitals and major cities to date) to tentatively improve COVID-19 mortality analysis (or other respiratory illnesses) as a function of the number concentrations of particles of a few hundred nm in size.

5. Conclusions

To better understand the relation between the time evolution curves of PM2.5 spikes and COVID-19 mortality, it is proposed to consider the historic population exposure to pollution peaks rather than instantaneous measurements in 16 representative European cities. This was conducted by applying an integration procedure of ~2 months on the PM2.5 data and a ~1-week positive shift of the COVID-19 mortality data to better correlate the peaks and their gradients. The related increase in COVID-19 mortality and PM2.5 levels was linear for both increasing and decreasing periods. Probably due to vaccination campaigns and the collective immunity progression, the correlation decreased at the end of 2022 in Europe. As an example, in France, flu and bronchiolitis mortalities increased at the end of 2022 to the detriment of COVID-19 (although still present), occurring a few weeks after a strong PM2.5 pollution peak, that led to a significant excess mortality by year end.
The proposed two-month exposure period to PM2.5 is probably just a first step and should be adjusted through a more complex equation, for example, by considering a decreasing memory effect on PM exposure over time. The first analysis presented in this study has shown an interest in considering PM2.5 peaks for COVID-19 mortality rather than permanent exposure to a mean level. It will be of interest to see if this approach is specific to this coronavirus or could also be applied to other respiratory diseases like the flu. Finally, data other than PM2.5 mass concentrations must be considered, and in particular, the number concentration and size distribution of particles smaller than 1 µm obtained with counters used during research campaigns and/or operated by private networks searching way beyond WHO recommendations.
Such results on the effect of PM on respiratory pandemic mortality should be considered by political authorities, especially in regions where high pollution peaks occur frequently due to specific weather conditions and geographical constraints [42]. To better manage future pandemics, the authorities should reduce all polluting industrial, transportation, and agricultural activities during the most critical days of (winter) anticyclonic conditions to limit the population’s exposure to fine particulate matter.

Author Contributions

Conceptualization, J.-B.R. and E.P.; methodology, J.-B.R.; software, J.S.; validation, E.P. and I.A.-M. formal analysis, J.-B.R., E.P., I.A.-M. and J.S.; investigation, J.-B.R.; resources, E.P. and J.S.; data curation, E.P.; writing—original draft preparation, J.-B.R.; writing—review and editing, E.P., I.A.-M. and J.S.; visualization, J.-B.R.; supervision, J.-B.R.; project administration, E.P.; funding acquisition, E.P. All authors have read and agreed to the published version of the manuscript.

Funding

This research received no external funding.

Institutional Review Board Statement

Not applicable.

Informed Consent Statement

Not applicable.

Data Availability Statement

The pollutrack data are available on request.

Acknowledgments

The authors thank the Pollutrack team for the deployment of hundreds of mobile PM sensors in Paris and across Europe, the ENEDIS and DPD groups for offering their fleets of electric vehicles and financing the sensors, and Scott Stonham for his most efficient proofreading.

Conflicts of Interest

The authors declare no conflict of interest.

References

  1. Seaton, A.; Godden, D.; MacNee, W.; Donaldson, K. Particulate air pollution and acute health effects. Lancet 1995, 345, 176–178. [Google Scholar]
  2. Beelen, R.; Raaschou-Nielsen, O.; Stafoggia, M.; Andersen, Z.J.; Weinmayr, G.; Hoffmann, B.; Wolf, K.; Samoli, E.; Fischer, P.; Nieuwenhuijsen, M.; et al. Effects of long-term exposure to air pollution on natural-cause mortality: An analysis of 22 European cohorts within the multicentre ESCAPE project. Lancet 2014, 383, 785–795. [Google Scholar] [PubMed]
  3. WHO (World Health Organization). Ambient Air Pollution: A Global Assessment of Exposure and Burden of Disease; Report 2016; WHO Library Cataloguing-in-Publication Data; World Health Organization: Geneva, Switzerland, 2016. [Google Scholar]
  4. Schraufnagel, D.E.; Balmes, J.R.; Cowl, C.T.; De Matteis, S.; Jung, S.-H.; Mortimer, K.; Perez-Padilla, R.; Rice, R.; Riojas-Rodriguez, M.D.; Sood, H.; et al. Air Pollution and Noncommunicable Diseases A Review by the Forum of International Respiratory Societies’ Environmental Committee, Part 1: The Damaging Effects of Air Pollution. CHEST 2019, 155, 409–416. [Google Scholar]
  5. Thurston, G.D.; Kipen, H.; Annesi-Maesano, I.; Balmes, J.; Brook, R.D.; Cromar, K.; De Matteis, S.; Forastiere, F.; Forsberg, B.; Frampton, M.W.; et al. A joint ERS/ATS policy statement: What constitutes an adverse health effect of air pollution? An analytical framework. Eur. Respir. J. 2017, 49, 1600419. [Google Scholar] [PubMed] [Green Version]
  6. Horne, B.D.; Joy, E.A.; Hofmann, M.G.; Gesteland, P.H.; Cannon, J.B.; Lefler, J.S.; Blagev, D.P.; Korgenski, E.K.; Torosyan, N.; Hansen, G.I.; et al. Short-Term Elevation of Fine Particulate Matter Air Pollution and Acute Lower Respiratory Infection. Amer. J. Respir. Crit. Care Med. 2018, 198, 759–766. [Google Scholar]
  7. Robertson, S.; Miller, M.R. Ambient air pollution and thrombosis. Part. Fib. Toxicol. 2018, 15, 1. [Google Scholar]
  8. Miller, M.R. Oxidative stress and the cardiovascular effects of air pollution. Free Rad. Bio. Med. 2020, 151, 69–87. [Google Scholar]
  9. Glencross, D.A.; Ho, T.-R.; Camiña, N.; Hawrylowicz, C.M.; Pfeffer, P.E. Air pollution and its effects on the immune system. Free Rad. Biol. Med. 2020, 151, 56–68. [Google Scholar]
  10. Coccia, M. Factors determining the diffusion of COVID-19 and suggested strategy to prevent future accelerated viral infectivity similar to COVID. Sci. Total. Environ. 2020, 729, 138474. [Google Scholar]
  11. Conticini, E.; Frediani, B.; Caro, D. Can atmospheric pollution be considered a co-factor in extremely high level of SARS-CoV-2 lethality in Northern Italy? Environ. Pol. 2020, 261, 114465. [Google Scholar]
  12. Frontera, A.; Cianfanelli, L.; Vlachos, K.; Landoni, G.; Cremona, G. Severe air pollution links to higher mortality in COVID-19 patients: The “double-hit” hypothesis. J. Infect. 2020, 81, 255–259. [Google Scholar]
  13. Fronza, R.; Lusic, M.; Schmidt, M.; Lucic, B. Spatial–Temporal Variations in Atmospheric Factors Contribute to SARS-CoV-2 Outbreak. Viruses 2020, 12, 588. [Google Scholar]
  14. Accarino, G.; Lorenzetti, S.; Aloisio, G. Assessing correlations between short-term exposure to atmospheric pollutants and Covid-19 spread in all Italian territorial areas. Environ. Pollut. 2021, 268, 115714. [Google Scholar] [CrossRef] [PubMed]
  15. Rohrer, M.; Flahault, A.; Stoffel, M. Peaks of fine particulate matter may modulate the spreading and virulence of COVID-19. Earth Syst. Environ. 2020, 4, 789–796. [Google Scholar] [CrossRef] [PubMed]
  16. Gupta, A.; Bherwani, H.; Gautam, S.; Anjum, S.; Musugu, K.; Kumar, N.; Anshul, A.; Kumar, R. Air pollution aggravating COVID-19 lethality? Exploration in Asian cities using statistical models. Environ. Develop. Sustain. 2021, 23, 6408–6417. [Google Scholar] [CrossRef]
  17. Sidell, M.A.; Chen, Z.; Huang, B.Z.; Chow, T.; Eckel, S.P.; Martinez, M.P.; Lurmann, F.; Thomas, D.C.; Gilliland, F.D.; Xiang, A.H. Ambient air pollution and COVID-19 incidence during four 2020–2021 case surges. Environ. Res. 2022, 208, 112758. [Google Scholar]
  18. Bourdrel, T.; Annesi-Maesano, I.; Alahmad, B.; Maesano, C.N.; Bind, M.-D. The impact of outdoor air pollution on COVID-19: A review of evidence from in vitro, animal, and human studies. Eur. Resp. Rev. 2021, 30, 200242. [Google Scholar]
  19. Mehmood, K.; Saifullah, I.M.; Abzar, M.M. Can exposure to PM2.5 particles increase the incidence of coronavirus disease 2019? Sc. Total Environ. 2020, 741, 140441. [Google Scholar] [CrossRef] [PubMed]
  20. Zoran, M.A.; Savastru, R.S.; Savastru, D.M.; Tautan, M.N. Assessing the relationship between surface levels of PM2.5 and PM10 particulate matter impact on Covid-19 in Milan, Italy. Sci. Total Environ. 2020, 738, 139825. [Google Scholar] [CrossRef]
  21. Annesi-Maesano, I.; Maesano, C.N.; Dessimond, B.; Prud’homme, J.; Colette, A.; Banerjee, S. Has the Spring 2020 lockdown modified the relationship between air pollution and Covid-19 mortality in Europe? Allergy 2020, 77, 1620–1622. [Google Scholar] [CrossRef]
  22. Coccia, M. How (un)sustainable Environments are Related to the Diffusion of COVID-19: The Relation between Coronavirus Disease 2019, Air Pollution, Wind Resource and Energy. Sustainability 2020, 12, 9709. [Google Scholar]
  23. Srivastava, A. COVID-19 and air pollution and meteorology-an intricate relationship: A review. Chemosphere 2021, 263, 128297. [Google Scholar]
  24. Yao, Y.; Pan, J.; Liu, Z.; Meng, X.; Wang, W.; Kan, H.; Wang, W. No association of Covid-19 transmission with temperature or UV radiation in Chinese cities. Eur. Respir. J. 2020, 55, 2000517. [Google Scholar] [CrossRef] [Green Version]
  25. McMullen, N.; Annesi-Maesano, I.; Renard, J.-B. Impact of rain precipitation on urban atmospheric particle matter measured at three locations in France between 2013 and 2019. Atmosphere 2021, 12, 769. [Google Scholar]
  26. Renard, J.-B.; Surcin, J.; Annesi-Maesano, I.; Delaunay, G.; Poincelet, E.; Dixsaut, G. Relation between PM2.5 pollution and COVID-19 mortality in Western Europe for the 2020–2022 period. Sci. Total Environ. 2022, 848, 157579. [Google Scholar]
  27. Wu, X.; Nethery, R.C.; Sabath, B.M.; Braun, D.; Dominici, F. Exposure to Air Pollution and COVID-19 Mortality in the United States. Sci. Adv. 2020, 6, eabd4049. [Google Scholar] [CrossRef] [PubMed]
  28. Travaglio, M.; Yu, Y.; Popovic, R.; Selley, L.; Leal, N.S.; Martins, L.M. Links between air pollution and COVID-19 in England. Environ. Pollut. 2021, 268, 115859. [Google Scholar] [CrossRef] [PubMed]
  29. Cole, M.; Ozgen, C.; Strobl, E. Air pollution exposure and COVID-19 in Dutch municipalities. Environ. Res. Econo. 2020, 76, 581–610. [Google Scholar] [CrossRef]
  30. Coker, E.S.; Cavalli, L.; Fabrizi, E.; Guastella, G.; Lippo, E.; Parisi, M.L.; Pontarollo, N.; Rizzati, M.; Varacca, A.; Vergalli, S. The Effects of Air Pollution on COVID-19 Related Mortality in Northern Italy. Environ. Resour. Econ. 2020, 76, 611–634. [Google Scholar] [CrossRef] [PubMed]
  31. Damasceno, R.M.; Cicerelli, R.E.; de Almeida, T.; Requia, W.J. Air pollution and COVID-19 mortality in Brazil. Atmosphere 2022, 14, 5. [Google Scholar] [CrossRef]
  32. Zang, S.T.; Luan, J.; Li, L.; Yu, H.X.; Wu, Q.J.; Chang, Q.; Zhao, Y.H. Ambient air pollution and COVID-19 risk: Evidence from 35 observational studies. Environ. Res. 2022, 204 Pt B, 112065. [Google Scholar]
  33. Bossak, B.H.; Andritsch, S. COVID-19 and Air Pollution: A spatial analysis of particulate matter concentration and pandemic-associated mortality in the US. Int. J. Environ. Res. Public Health 2022, 19, 729. [Google Scholar]
  34. Semczuk-Kaczmarek, K.; Rys-Czaporowska, A.; Sierdzinski, J.; Kaczmarek, L.D.; Szymanski, F.M.; Platek, A.E. Association between air pollution and COVID-19 mortality and morbidity. Intern. Emerg. Med. 2022, 17, 467–473. [Google Scholar] [PubMed]
  35. Shao, L.; Cao, Y.; Jones, T.; Santosh, M.; Silva, L.F.O.; Ge, S.; da Boit, K.; Feng, X.; Zhang, M.; BéruBé, K. COVID-19 mortality and exposure to airborne PM2.5: A lag time correlation, Science of The Total Environment. Sci. Total Environ. 2022, 806, 151286. [Google Scholar]
  36. Renard, J.-B.; Marchand, C. High Resolution Mapping of PM2.5 Concentrations in Paris (France) Using Mobile Pollutrack Sensors Network in 2020. Atmosphere 2021, 12, 529. [Google Scholar] [CrossRef]
  37. Johns Hopkins University & Medicine, Coronavirus Resource Center. Available online: https://coronavirus.jhu.edu/ (accessed on 22 January 2023).
  38. Comunian, S.; Dongo, D.; Milani, C.; Palestini, P. Air Pollution and Covid-19: The Role of particulate matter in the spread and increase of COVID-19’s morbidity and mortality. Int. J. Environ. Res. Pub. Health 2020, 17, 4487. [Google Scholar]
  39. Renard, J.-B.; Dulac, F.; Durand, P.; Bourgeois, Q.; Denjean, C.; Vignelles, D.; Couté, B.; Jeannot, M.; Verdier, N.; Mallet, M. In situ measurements of desert dust particles above the western Mediterranean Sea with the balloon-borne Light Optical Aerosol Counter/sizer (LOAC) during the ChArMEx campaign of summer 2013. Atmos. Chem. Phys. 2018, 18, 3677–3699. [Google Scholar]
  40. Renard, J.-B.; Michoud, V.; Giacomoni, J. Vertical Profiles of Pollution Particle Concentrations in the Boundary Layer above Paris (France) from the Optical Aerosol Counter LOAC Onboard a Touristic Balloon. Sensors 2020, 20, 1111. [Google Scholar] [PubMed] [Green Version]
  41. Stolzenburg, M.R.; McMurry, P.H. Method to assess performance of scanning mobility particle sizer (SMPS) instruments and software. Aeros. Sci. Technol. 2018, 52, 609–613. [Google Scholar] [CrossRef]
  42. Coccia, M. Sources, diffusion and prediction in COVID-19 pandemic: Lessons learned to face next health emergency. AIMS Public Health 2023, 10, 145–168. [Google Scholar] [CrossRef]
Figure 1. Time evolution of PM2.5 levels and COVID-19 mortality for the Emilia-Romagna region exposed to high levels of pollution; (a) weekly integrated data; (b) weekly integrated data after applying the smoothing, integration, and shift procedure.
Atmosphere 14 01222 g001
Figure 2. Time evolution of PM2.5 levels and COVID-19 mortality for the Gironde region exposed to low levels of pollution; (a) weekly integrated data; (b) weekly integrated data after applying the smoothing, integration, and shift procedure.
Atmosphere 14 01222 g002
Figure 3. Time evolution of PM2.5 levels and COVID-19 mortality for the Zuid-Holland region exposed to low levels of pollution; (a) weekly integrated data; (b) weekly integrated data after applying the smoothing, integration, and shift procedure.
Atmosphere 14 01222 g003
Figure 4. Trend evolution of COVID-19 mortality per million inhabitants vs. PM2.5 for the 16 locations. The lines represent the linear fits in the domain range where PM2.5 and mortality values are available.
Atmosphere 14 01222 g004
Figure 5. Gradient evolution of PM2.5 levels and COVID-19 mortality per million inhabitants for the Emilia-Romagna region; (a) time evolution; (b) data and linear fit.
Atmosphere 14 01222 g005
Figure 6. Gradient evolution of PM2.5 levels and COVID-19 mortality per million inhabitants for the Gironde region; (a) time evolution; (b) data and linear fit.
Atmosphere 14 01222 g006
Figure 7. Trend evolution of the gradients of COVID-19 mortality per million inhabitants vs. PM2.5 levels for the 16 locations. The lines represent the linear fits in the domain range where PM2.5 gradients and mortality gradients are available.
Atmosphere 14 01222 g007
Table 1. Regions, departments, or studied cities, population, source of PM2.5 pollution data, and level of pollution peaks, considering the time period.
Location Name Population (106 Inhabitants)Source of PM2.5 DataMean PM2.5 LevelStarting Date
Bouche du Rhone (France)2.0PollutrackMediumMid-December 2020
Emilia-Romagna (Italia)4.5Air quality networkHighMid-April 2020
Estonia 1.3Air quality networkLowMid-December 2020
Gironde (France)1.6Air quality networkLowMid-March 2020
Hungary 9.7Air quality networkMediumMid-April 2020
Lazio (Italia)5.9Air quality networkMediumMid-December 2020
Lombardy (Italia)10.1Air quality networkHighMid-December 2020
London (Great Britain)9.0PollutrackMediumEnd May 2020
Nord (France)2.6PollutrackMediumEarly January 2021
Nordrhein-Westfalen (Germany)17.9Air quality networkLowMid-April 2020
Paris (France)2.2PollutrackHighMid-December 2020
Rhone (France)1.9Air quality networkMediumMid-December 2020
Seine Saint-Denis (France)1.7Air quality networkMediumMid-December 2020
Toscana (Italia)3.7Air quality networkMediumMid-December 2020
Yorkshire and the Humber (Great Britain)5.5Air quality networkLowEarly July 2020
Zuid-Holland (The Netherlands)3.7PollutrackMediumEnd July 2020
Table 2. Regions, departments, or cities studied: population, length of the integration (in weeks) for PM2.5 level data, and the shift (in weeks) of the COVID-19 mortality curve; Pearson correlation coefficient without and with the sliding smoothing.
Location Name (Country)Integration Width (Weeks)Shift (Weeks)Correlation without Applying the AdjustmentsCorrelation When Applying the Adjustments
Bouche du Rhone (FR)720.560.82
Emilia-Romagna (IT)900.520.76
Estonia (EE)1400.280.60
Gironde (FR)1100.360.81
Hungary (HU)710.560.83
Lazio (IT)920.370.79
Lombardia (IT)900.470.78
London (GB)800.250.45
Nord (FR)1410.410.78
Nordrhein-Westfalen (DE)700.170.42
Paris (FR)810.330.62
Rhone (FR)710.400.73
Seine Saint-Denis (FR)1000.410.64
Toscana (IT)830.530.80
Yorkshire (GB)500.250.41
Zuid-Holland (NL)800.290.51
Table 3. Synthesis of the results.
Integration Time for PM2.5 Mean Level (Week)Shift between COVID-19 Mortality and PM2.5 Peaks (Week)Rate of Mortality Increase per µg·m−3 of PM2.5 Increase
8.8 ± 2.50.7 ± 0.840 ± 20%
Disclaimer/Publisher’s Note: The statements, opinions and data contained in all publications are solely those of the individual author(s) and contributor(s) and not of MDPI and/or the editor(s). MDPI and/or the editor(s) disclaim responsibility for any injury to people or property resulting from any ideas, methods, instructions or products referred to in the content.

