


Identification and Spatiotemporal Migration Analysis of Groundwater Drought Events in the North China Plain
Abstract
1. Introduction
2. Materials and Methods
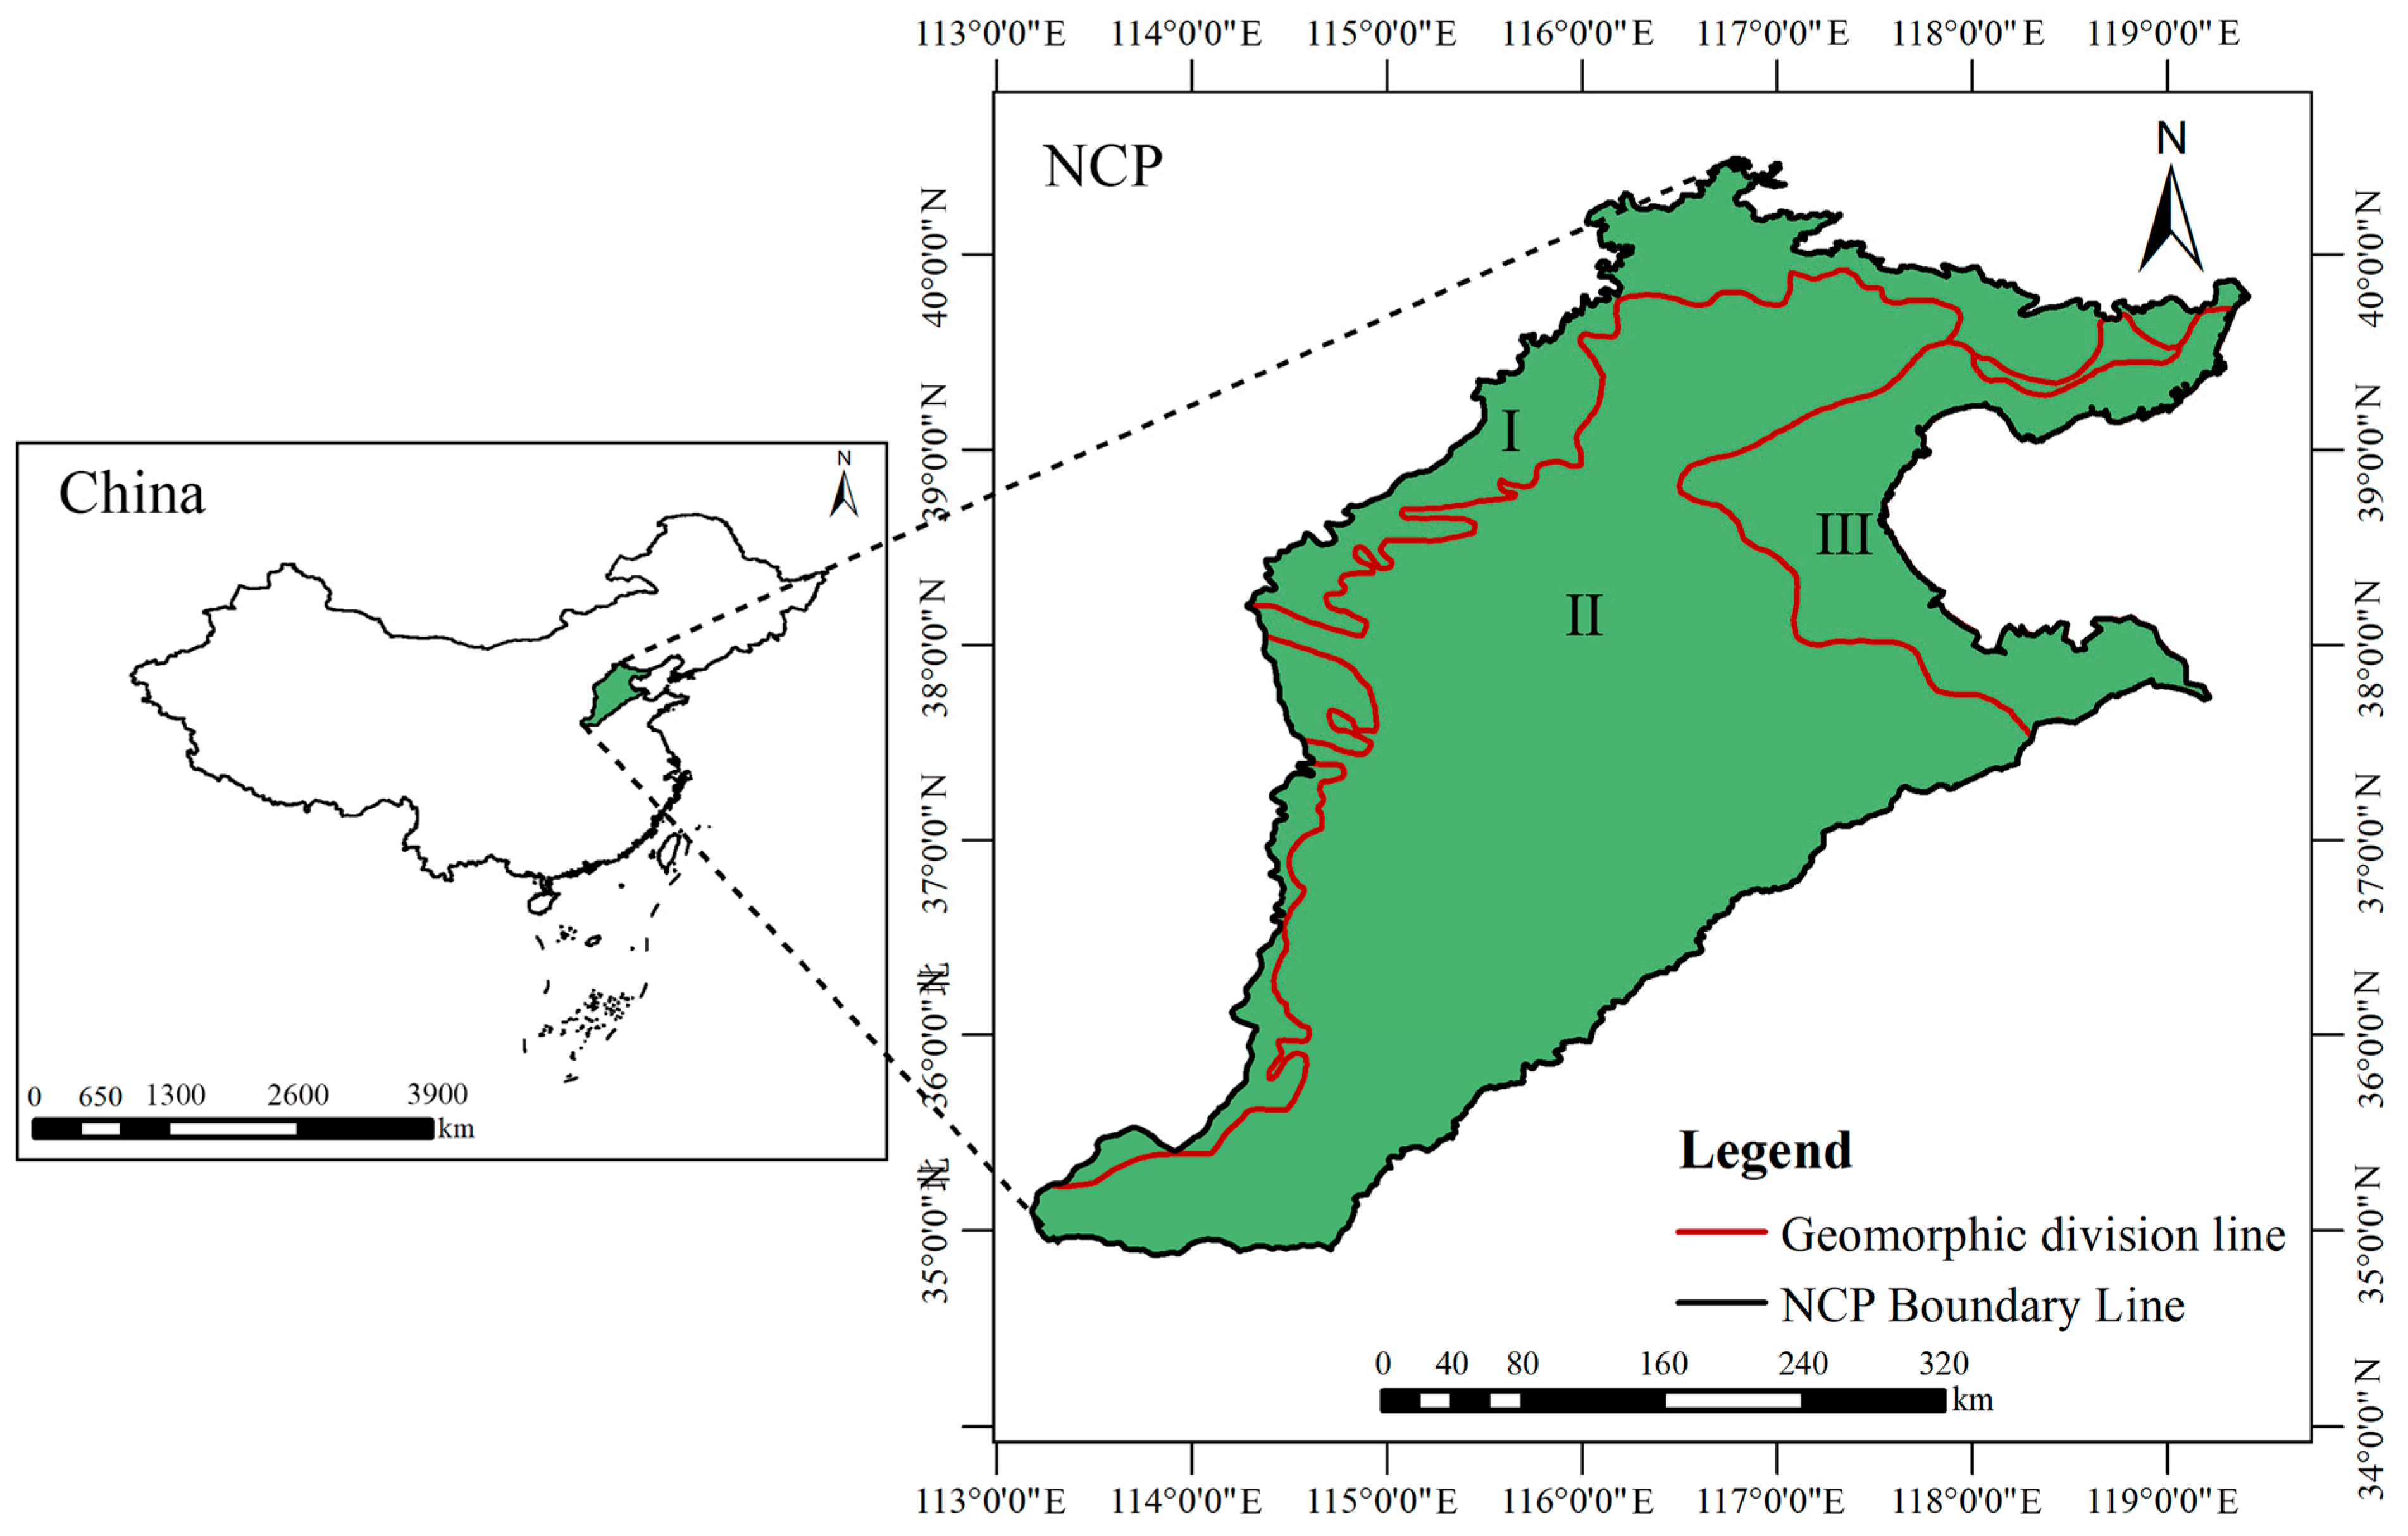
2.1. Study Area
2.2. Data Collection
2.2.1. Gravity Recovery and Climate Experiment (GRACE)
2.2.2. Global Land Data Assimilation System (GLDAS)
2.3. Methods
2.3.1. GGDI
2.3.2. Groundwater Drought Event Identification
- (1)
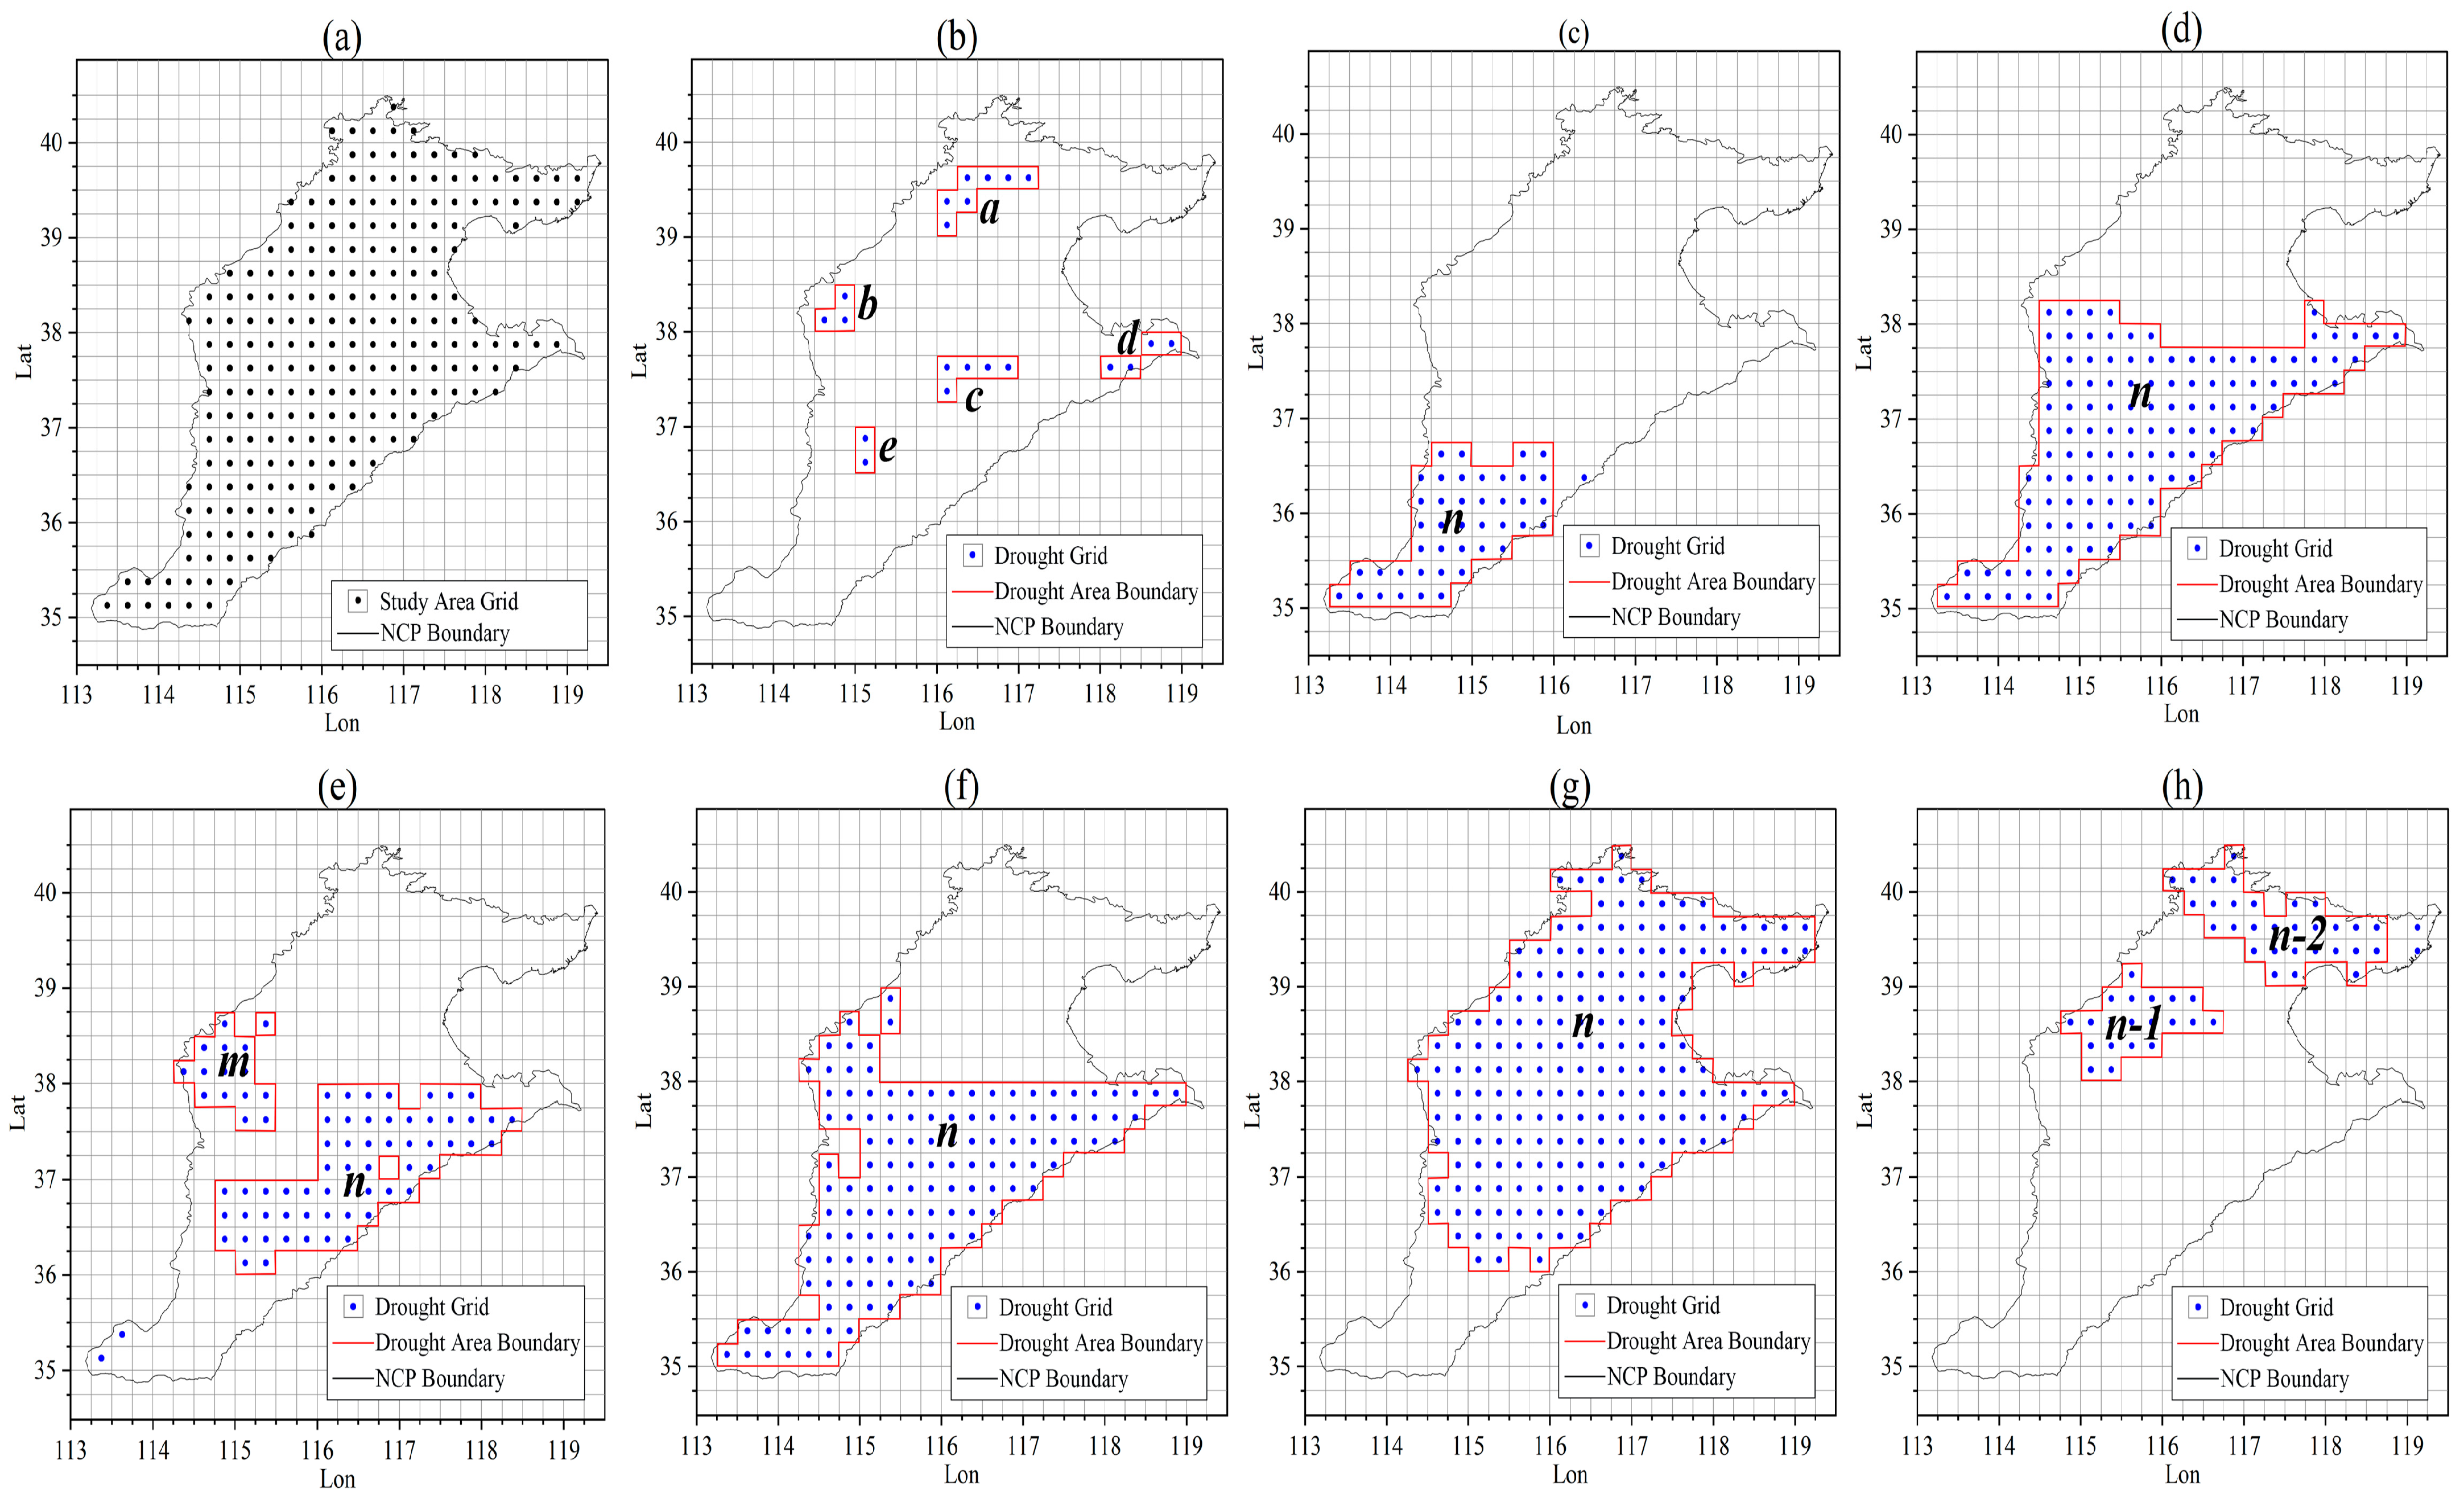
- Drought grid identification
- (2)
- Identification of the spatial continuity of drought events
- (3)
- Identification of the temporal continuity of drought events
- (4)
- Identification of the spatiotemporal continuity of drought events
2.3.3. Construction of the Drought Migration Model (DMM)
- (1)
- Determination of groundwater drought events
- (2)
- Determination of the locations of groundwater drought centroids
- (3)
- Connecting the groundwater drought centroids
- (4)
- Calculation of the groundwater drought intensities
3. Results
3.1. GRACE Data Validation
3.2. Quantitative Assessment of Groundwater Drought Events
3.3. Groundwater Drought Event Identification
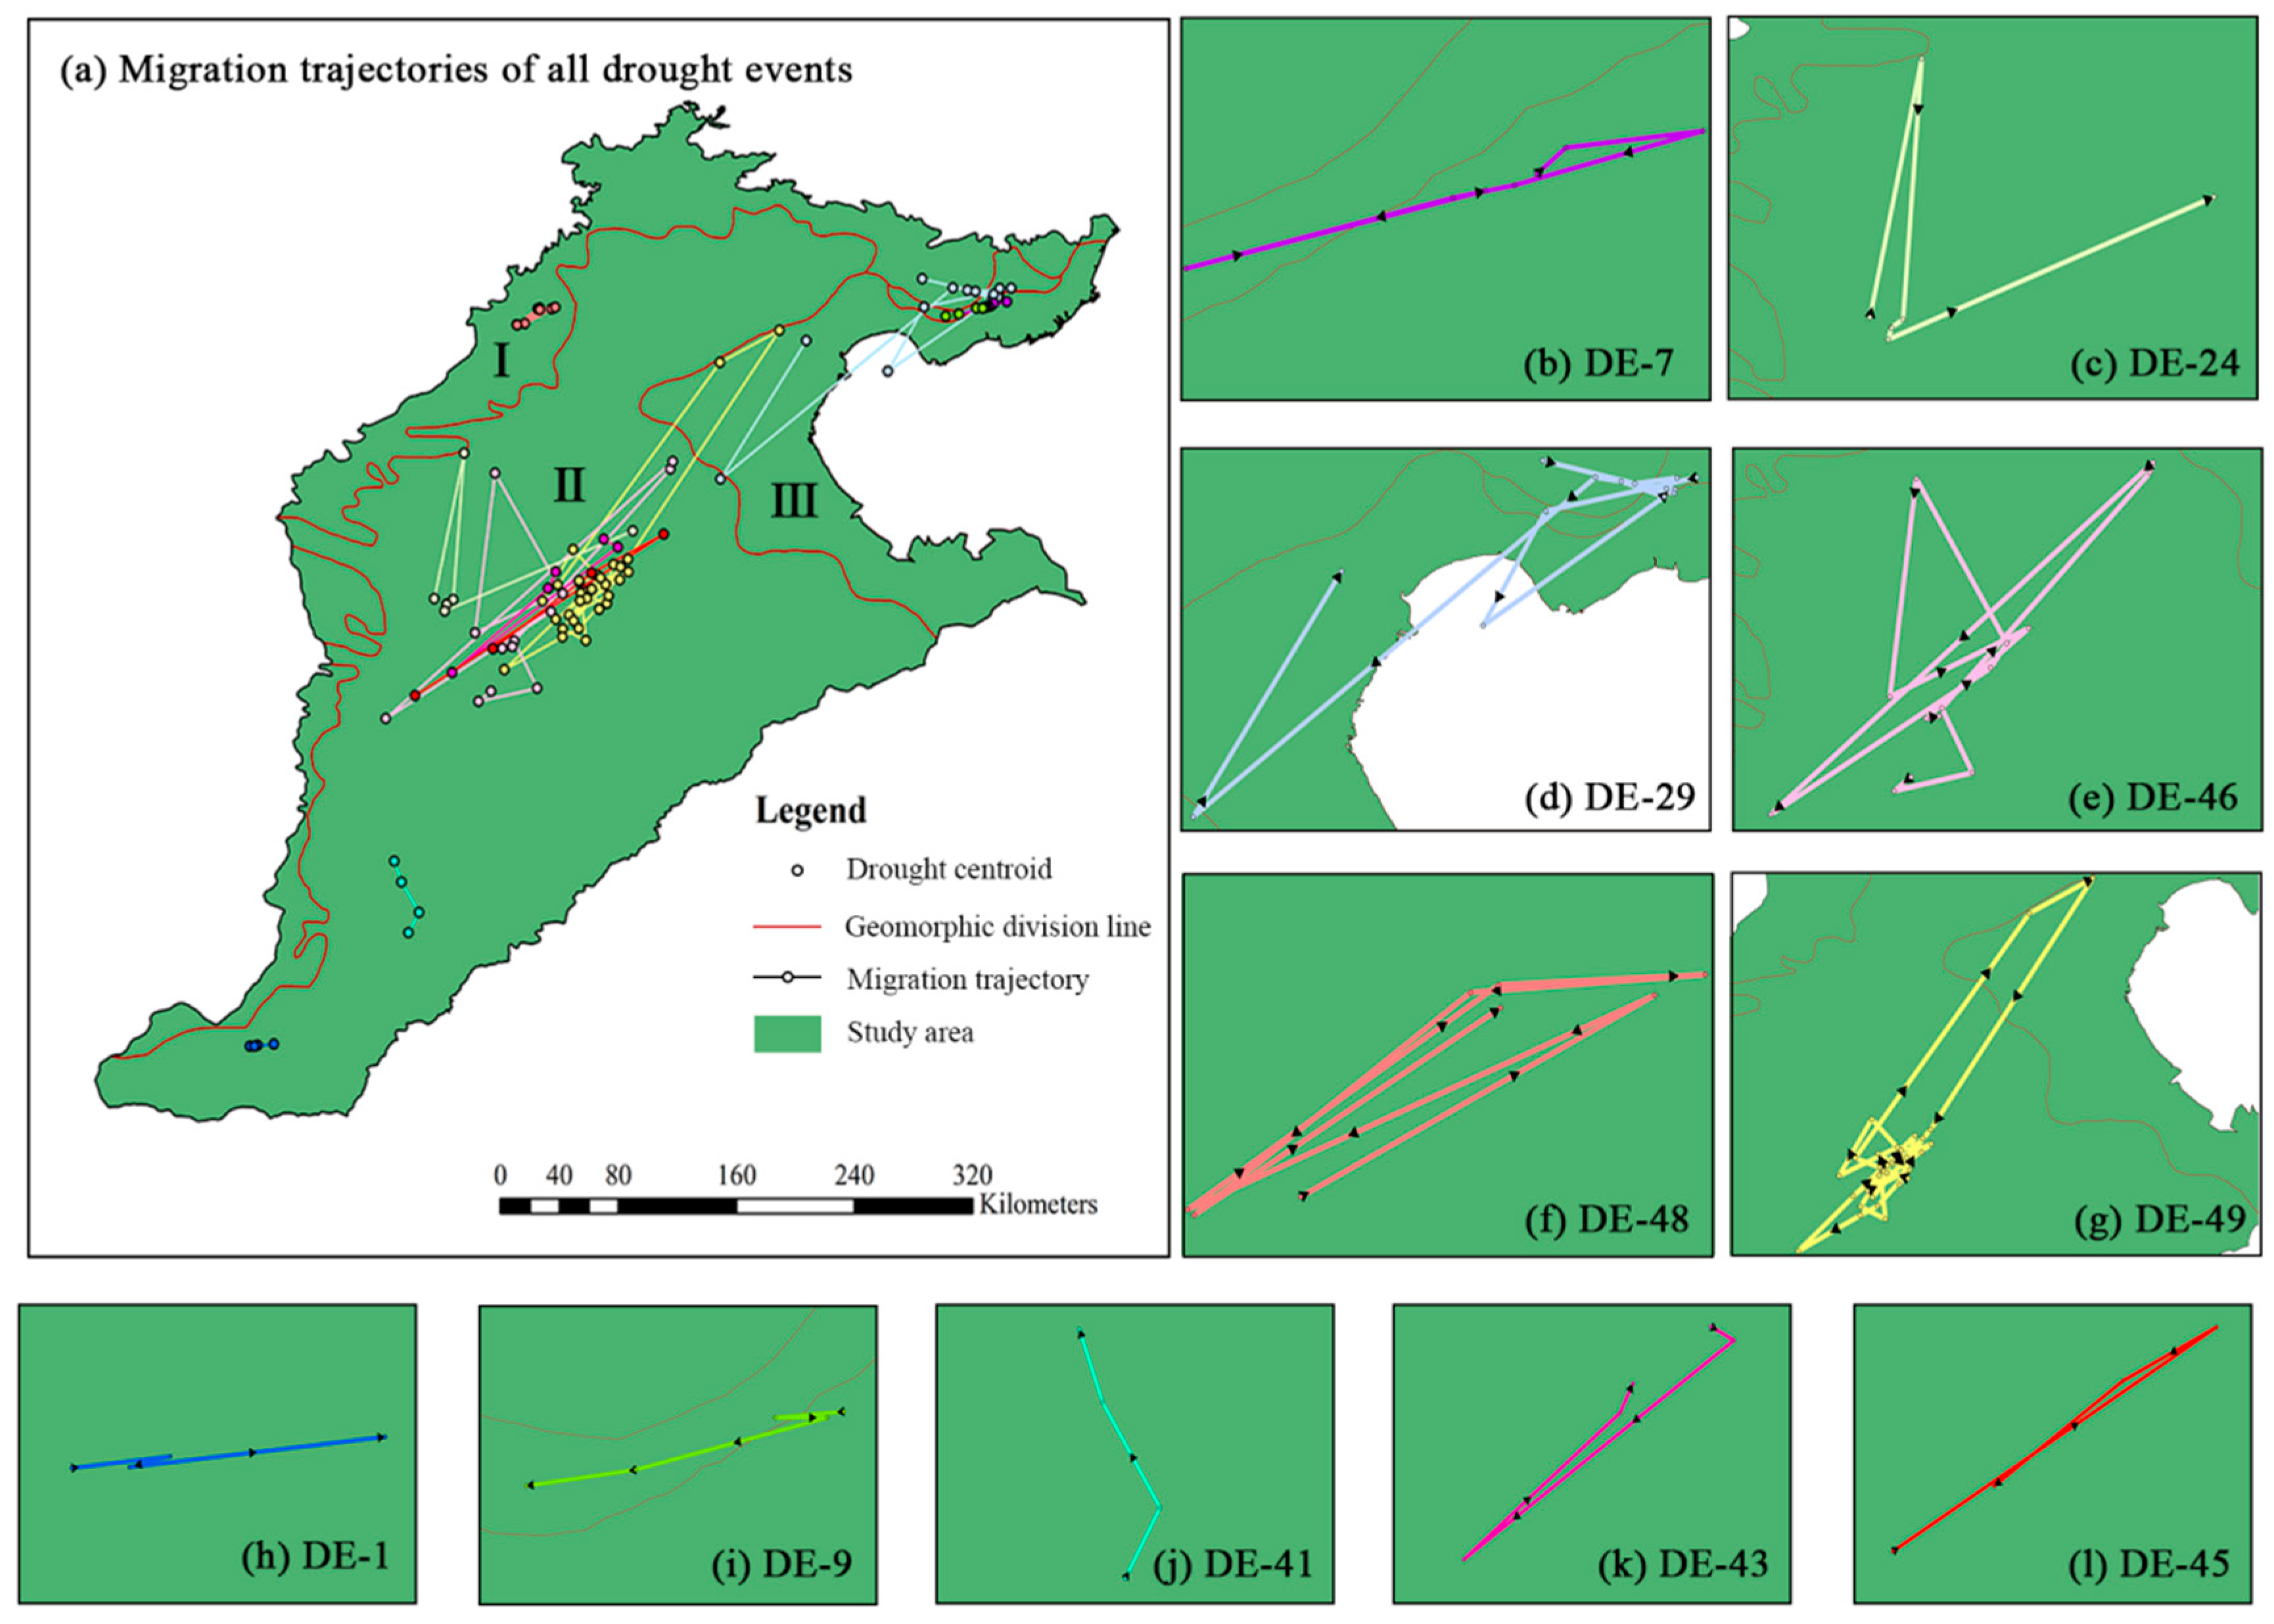
3.4. Characteristics of the Groundwater Drought Centroid Migration
- (1)
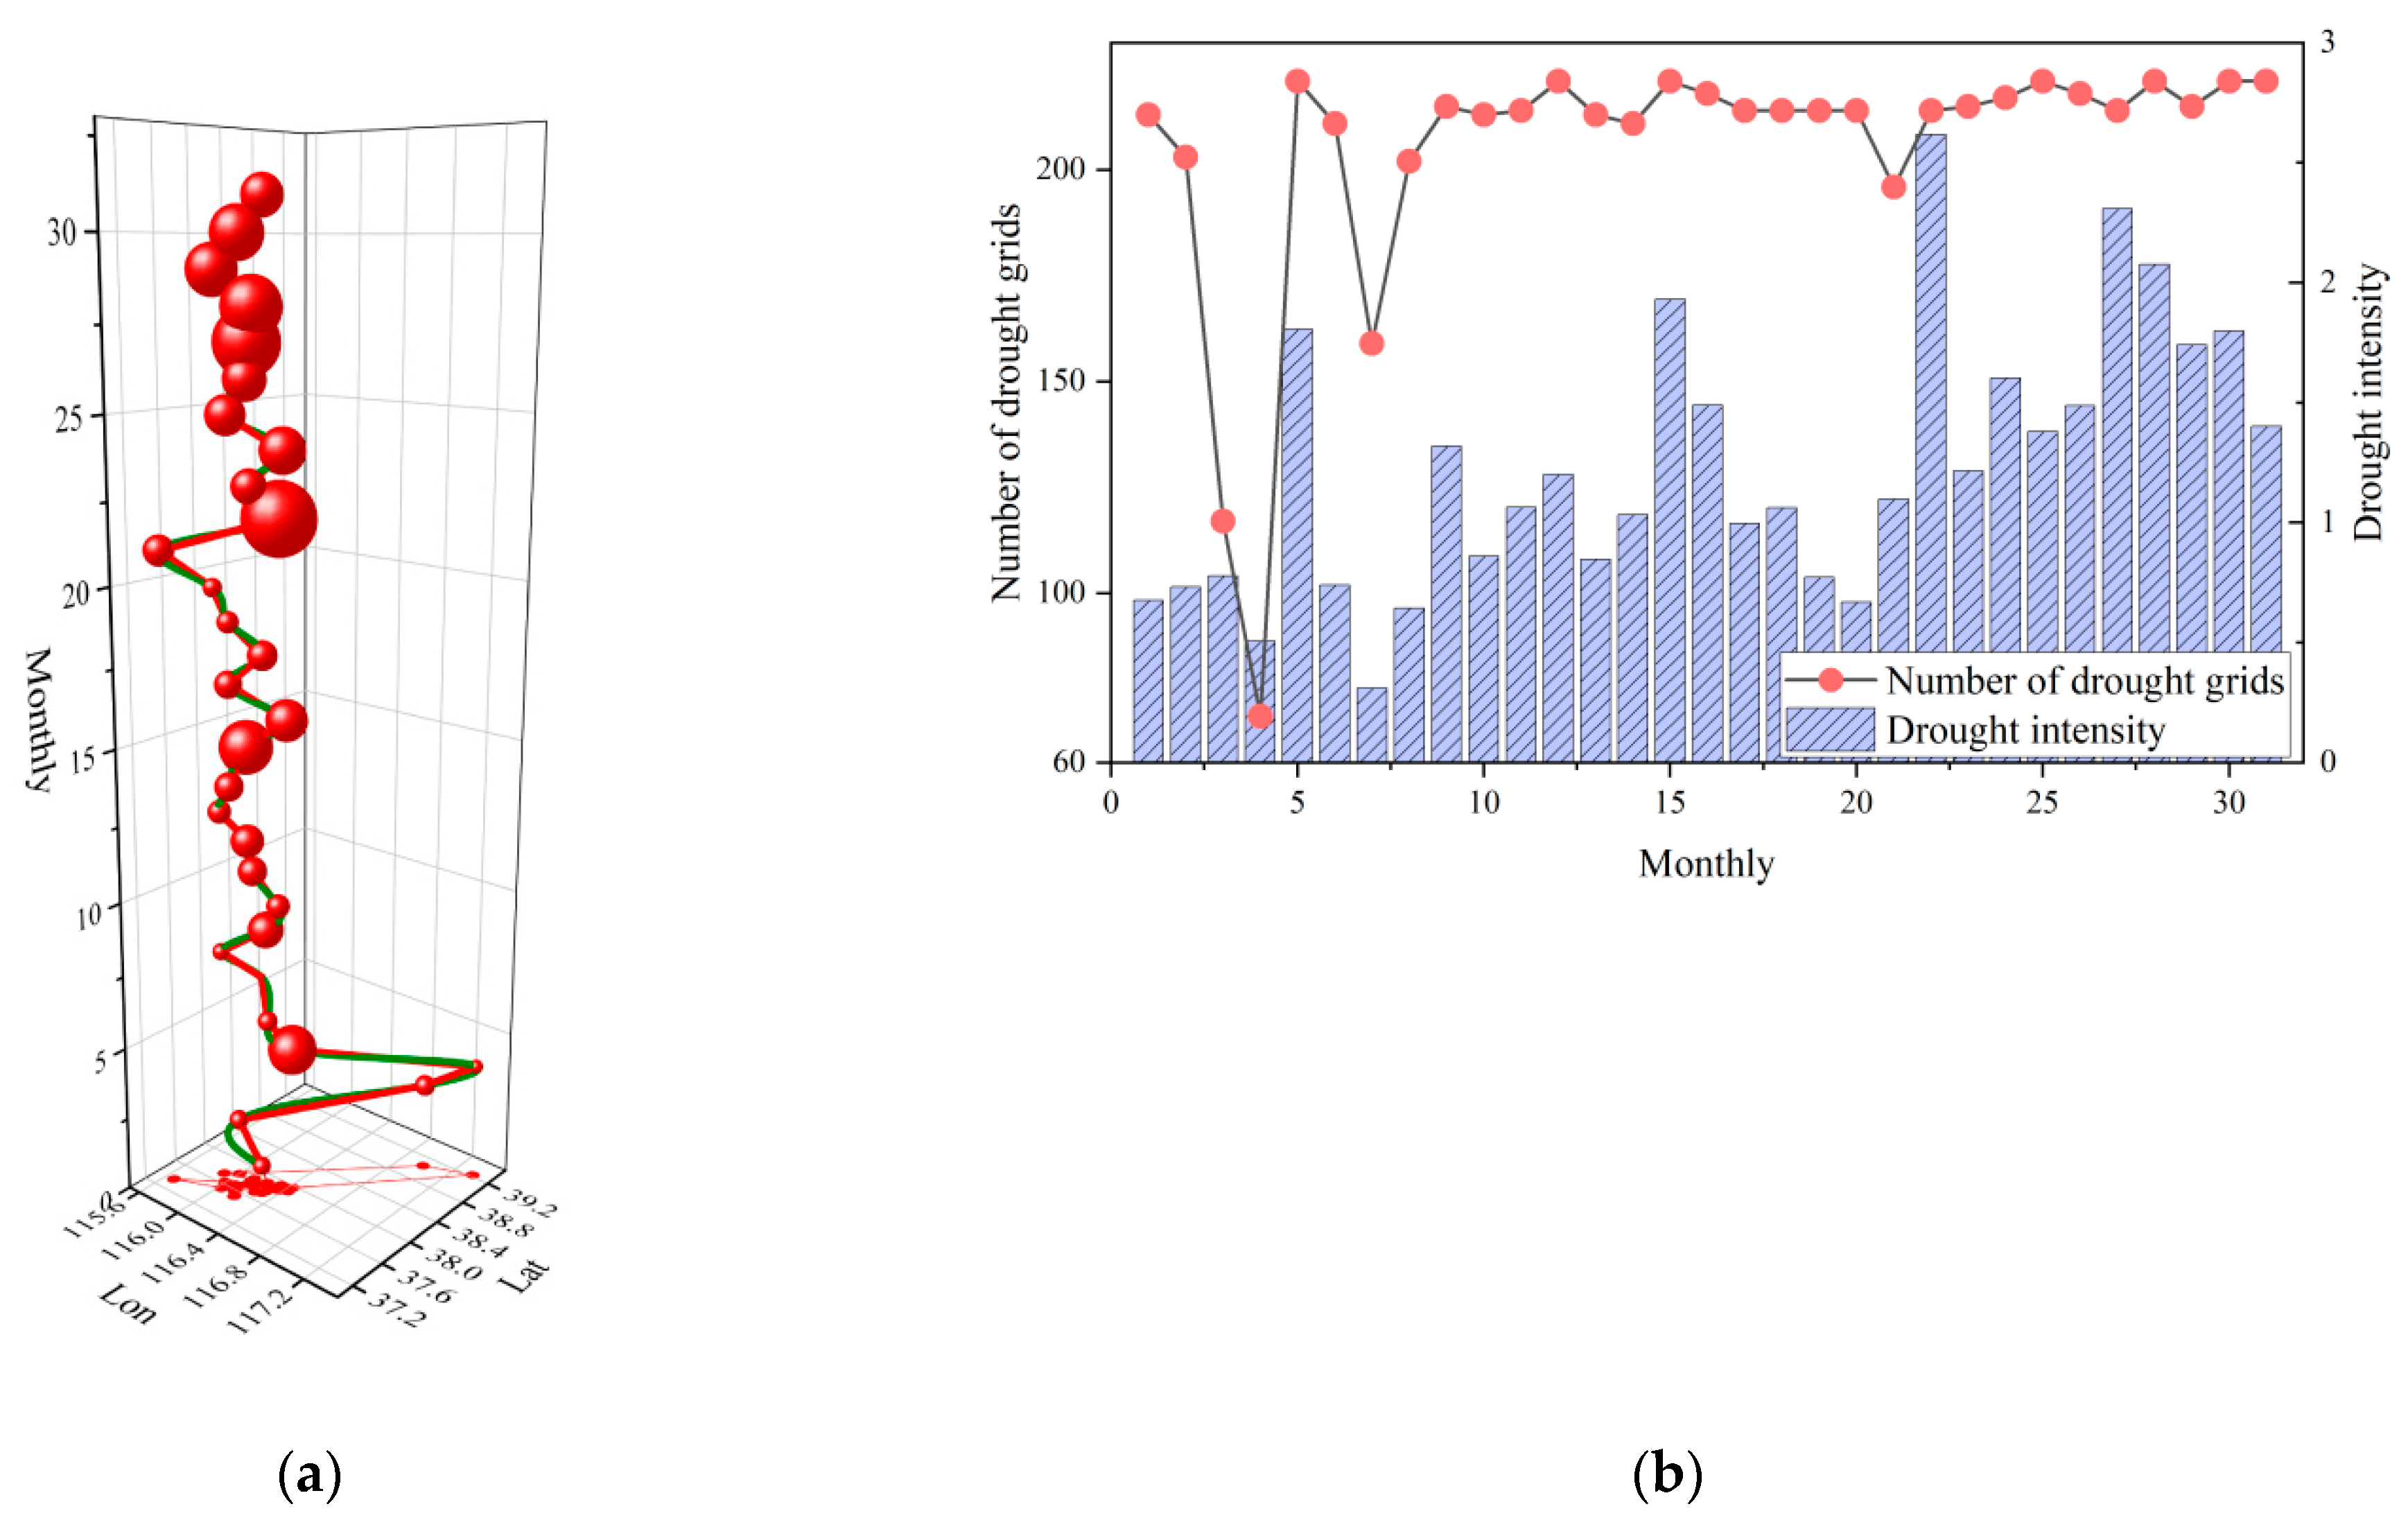
- DE.49
- (2)
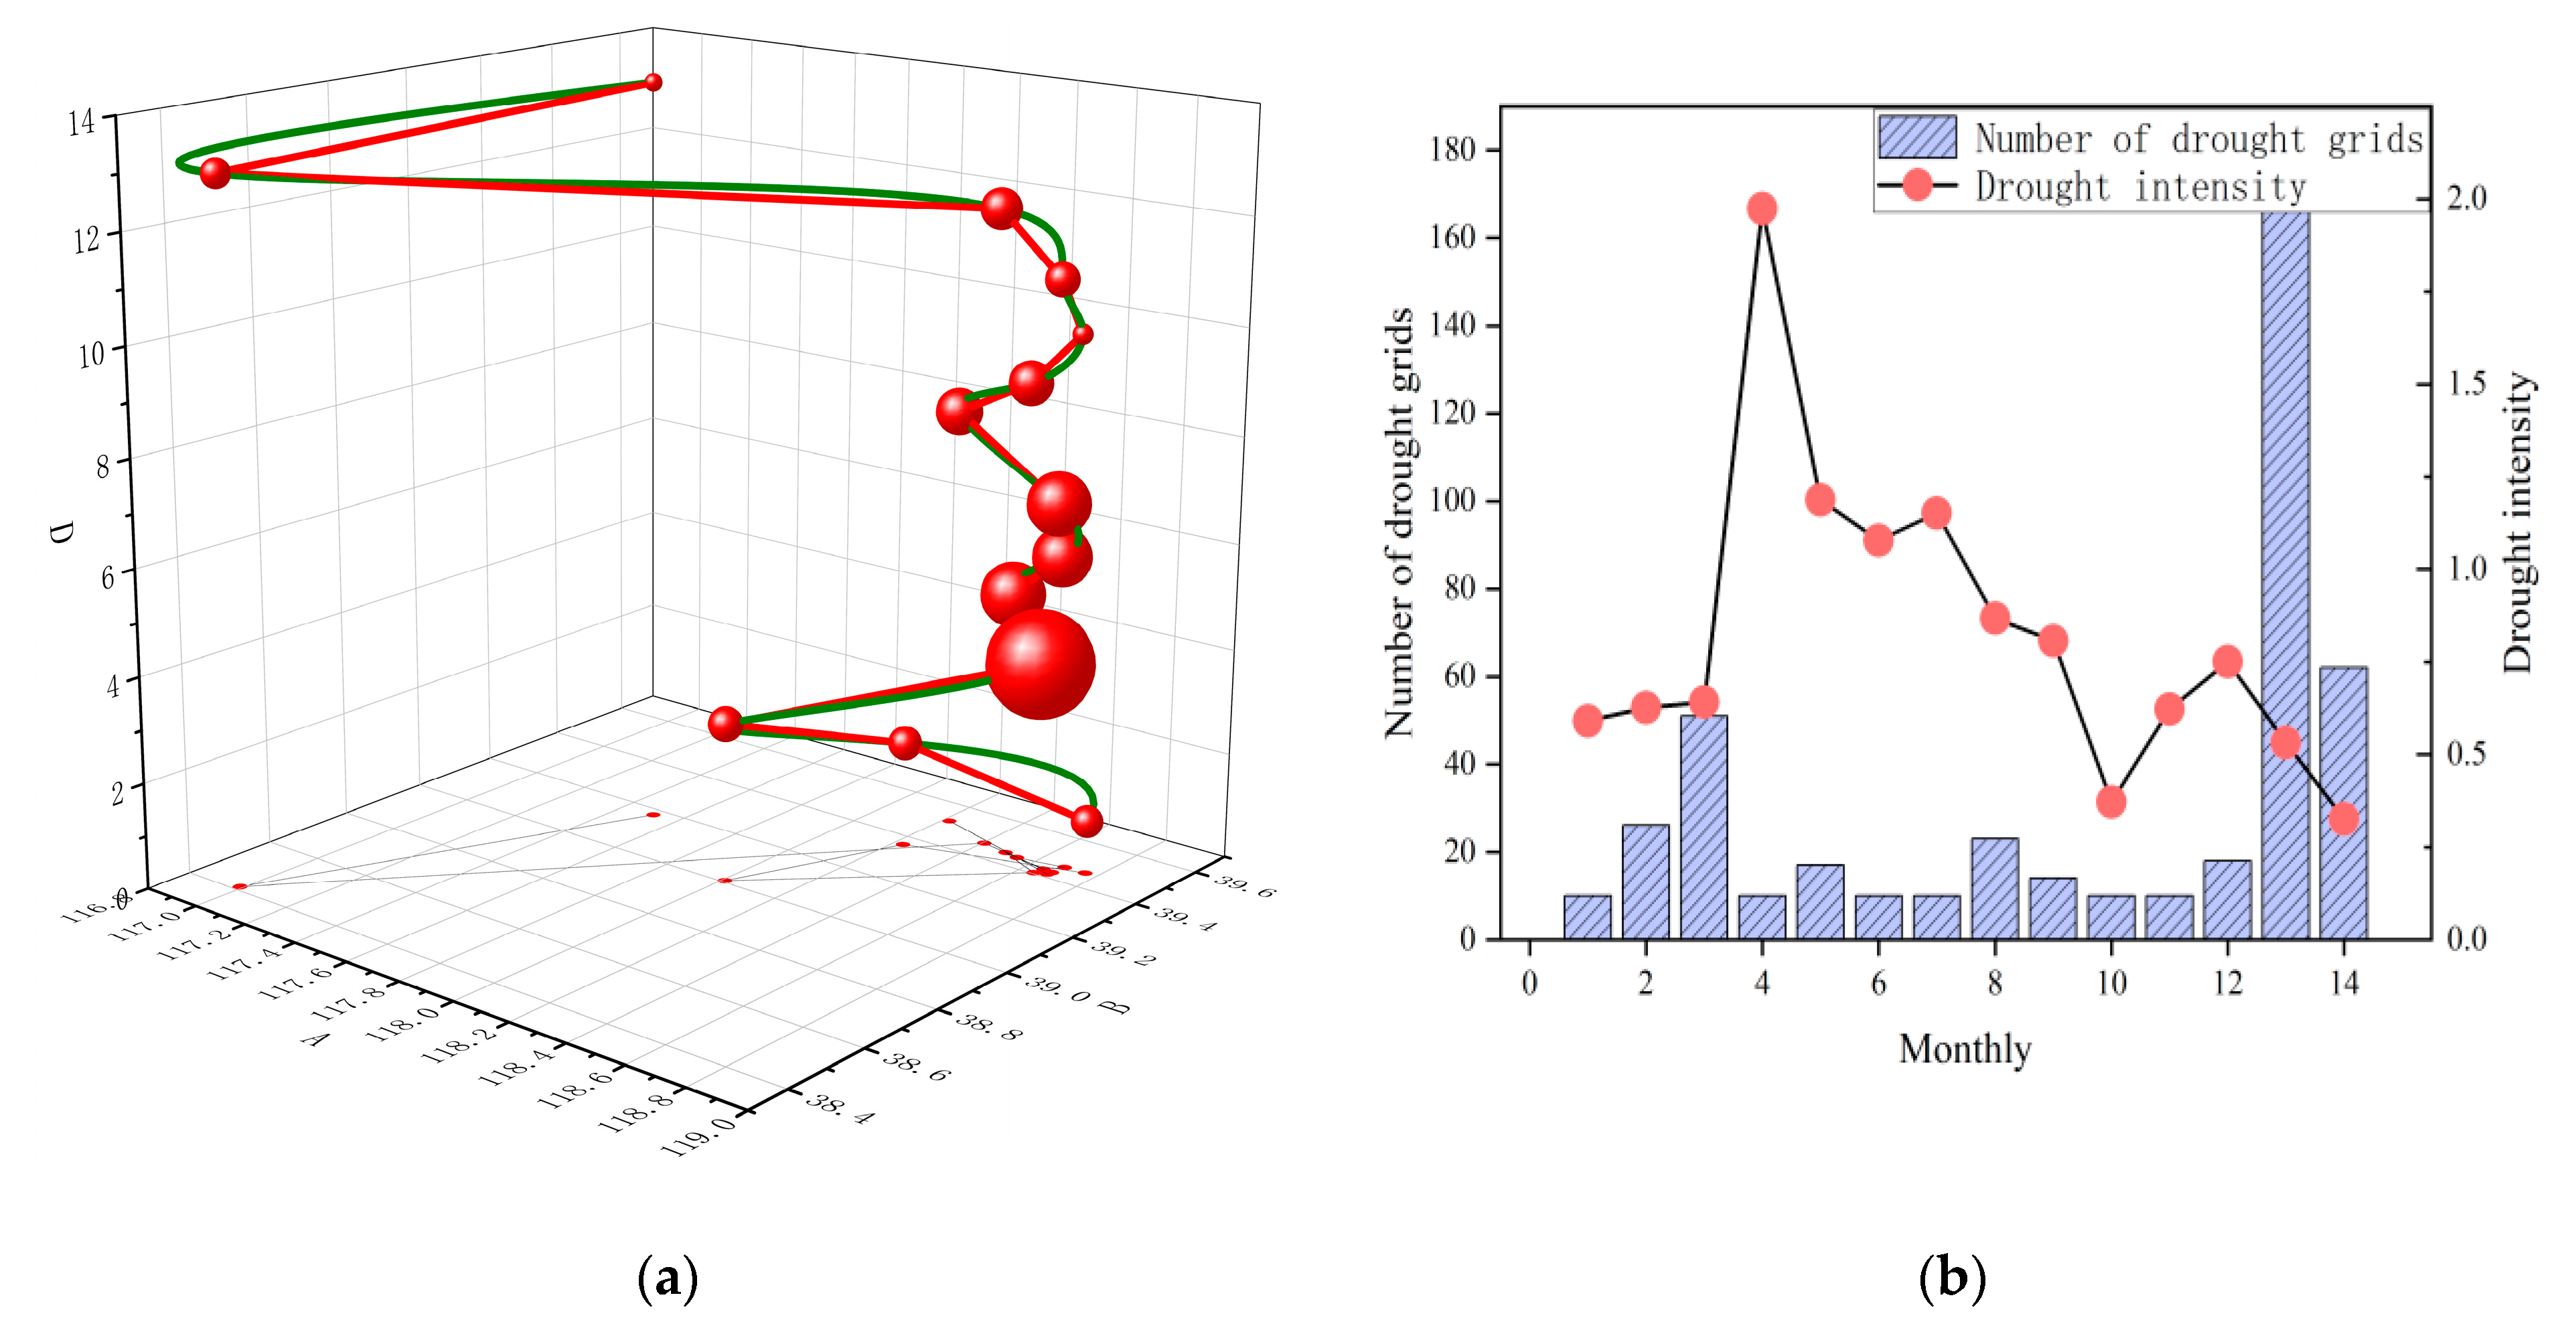
- DE.29
- (3)
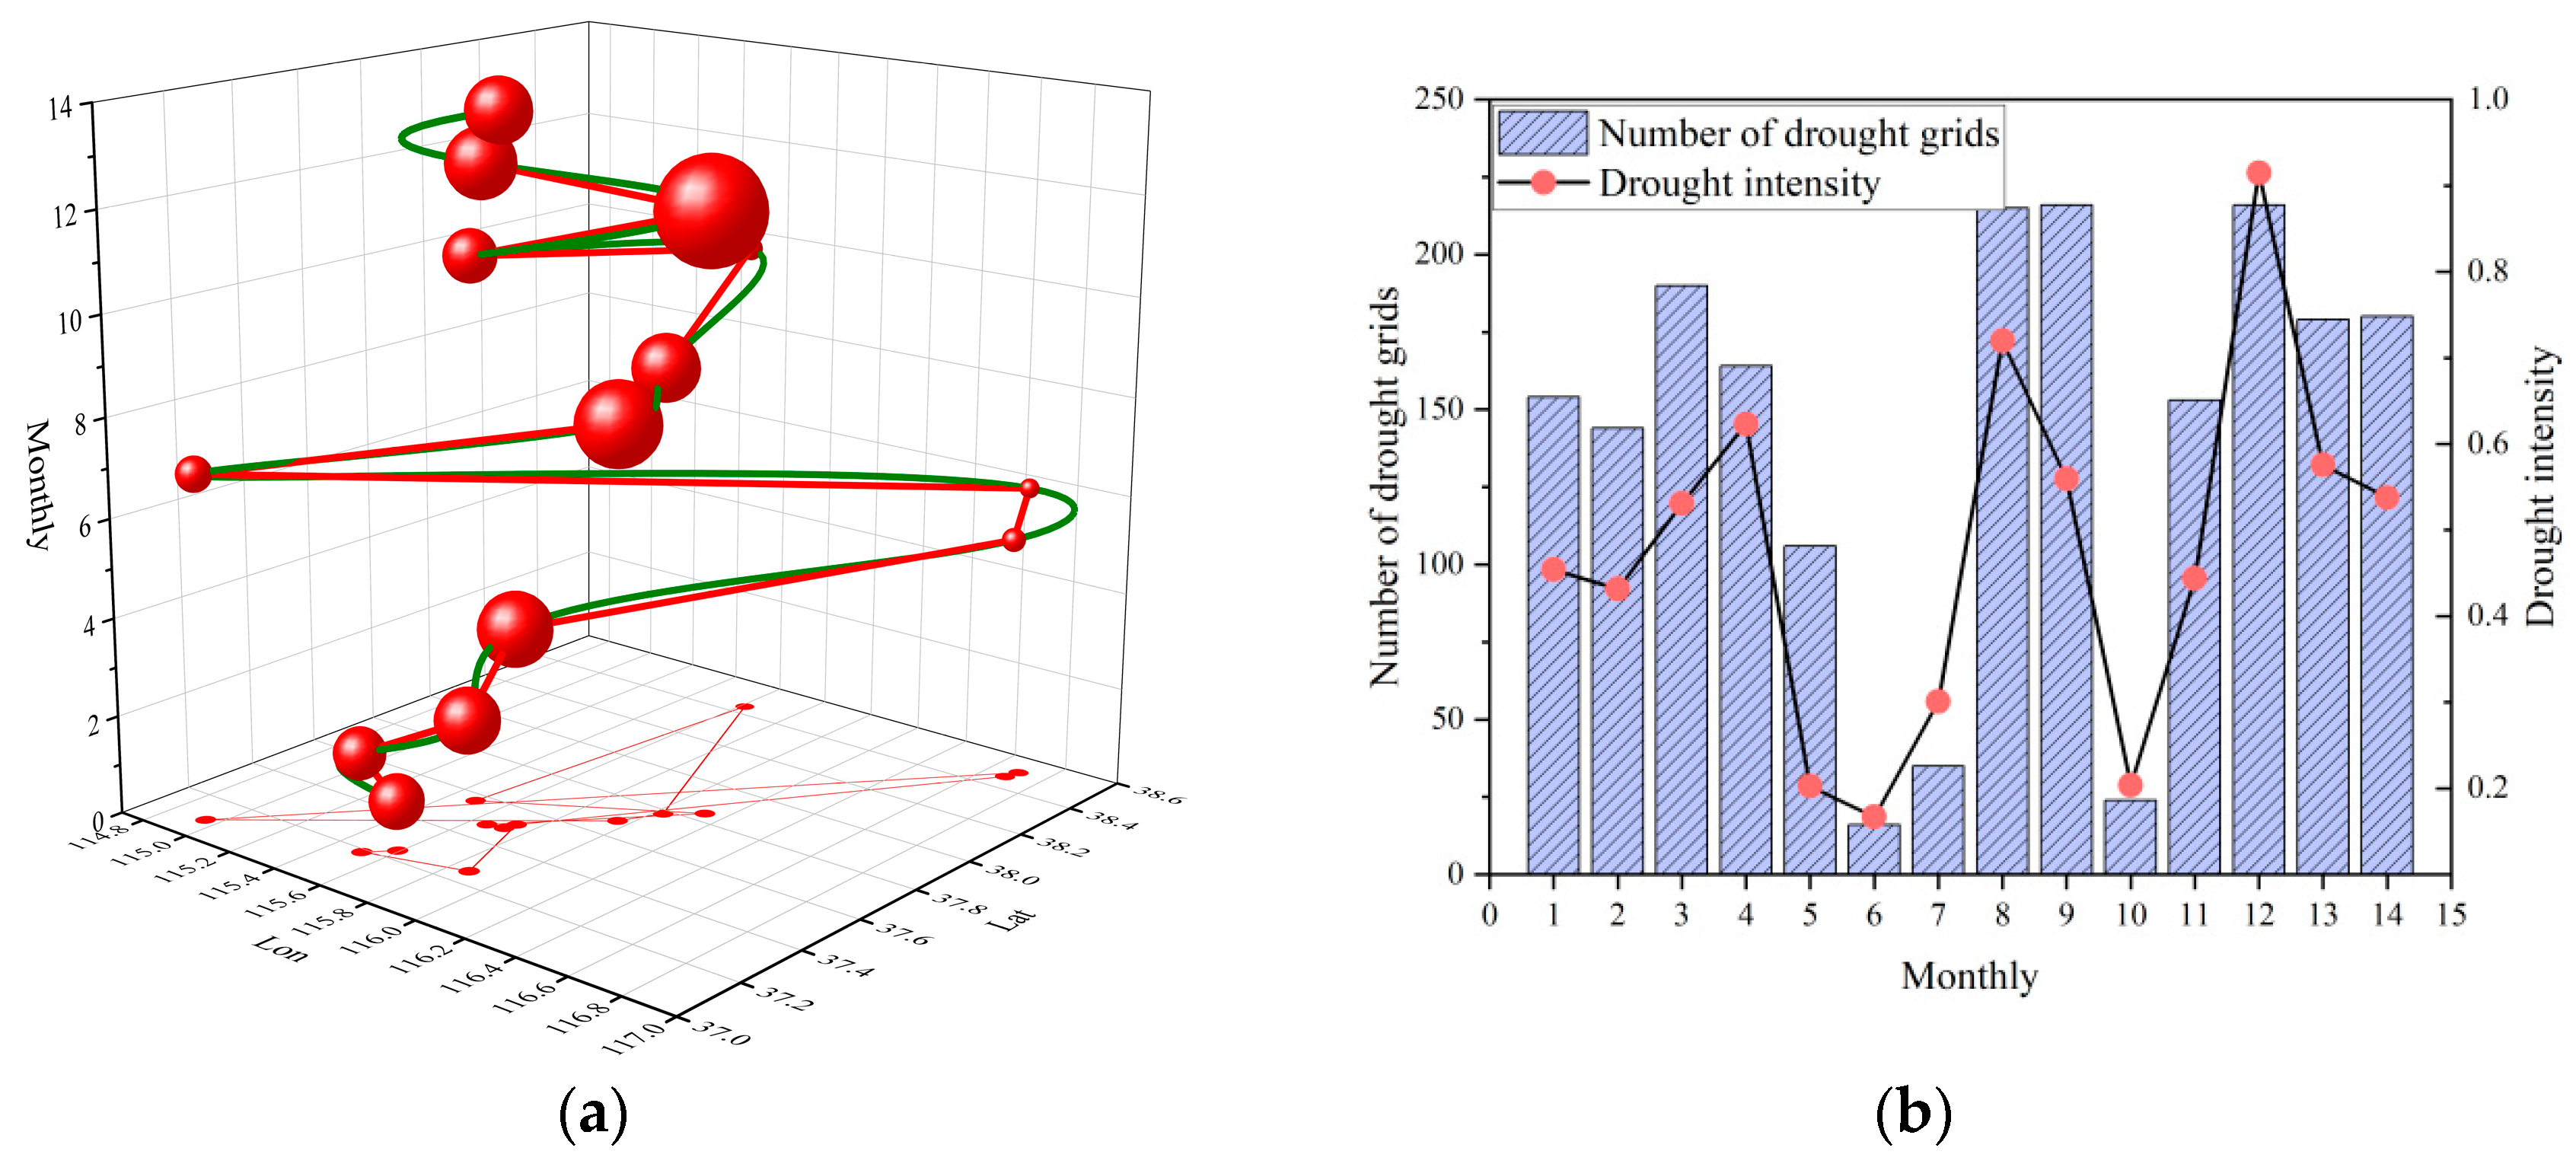
- DE.46
4. Discussion
5. Conclusions
- (1)
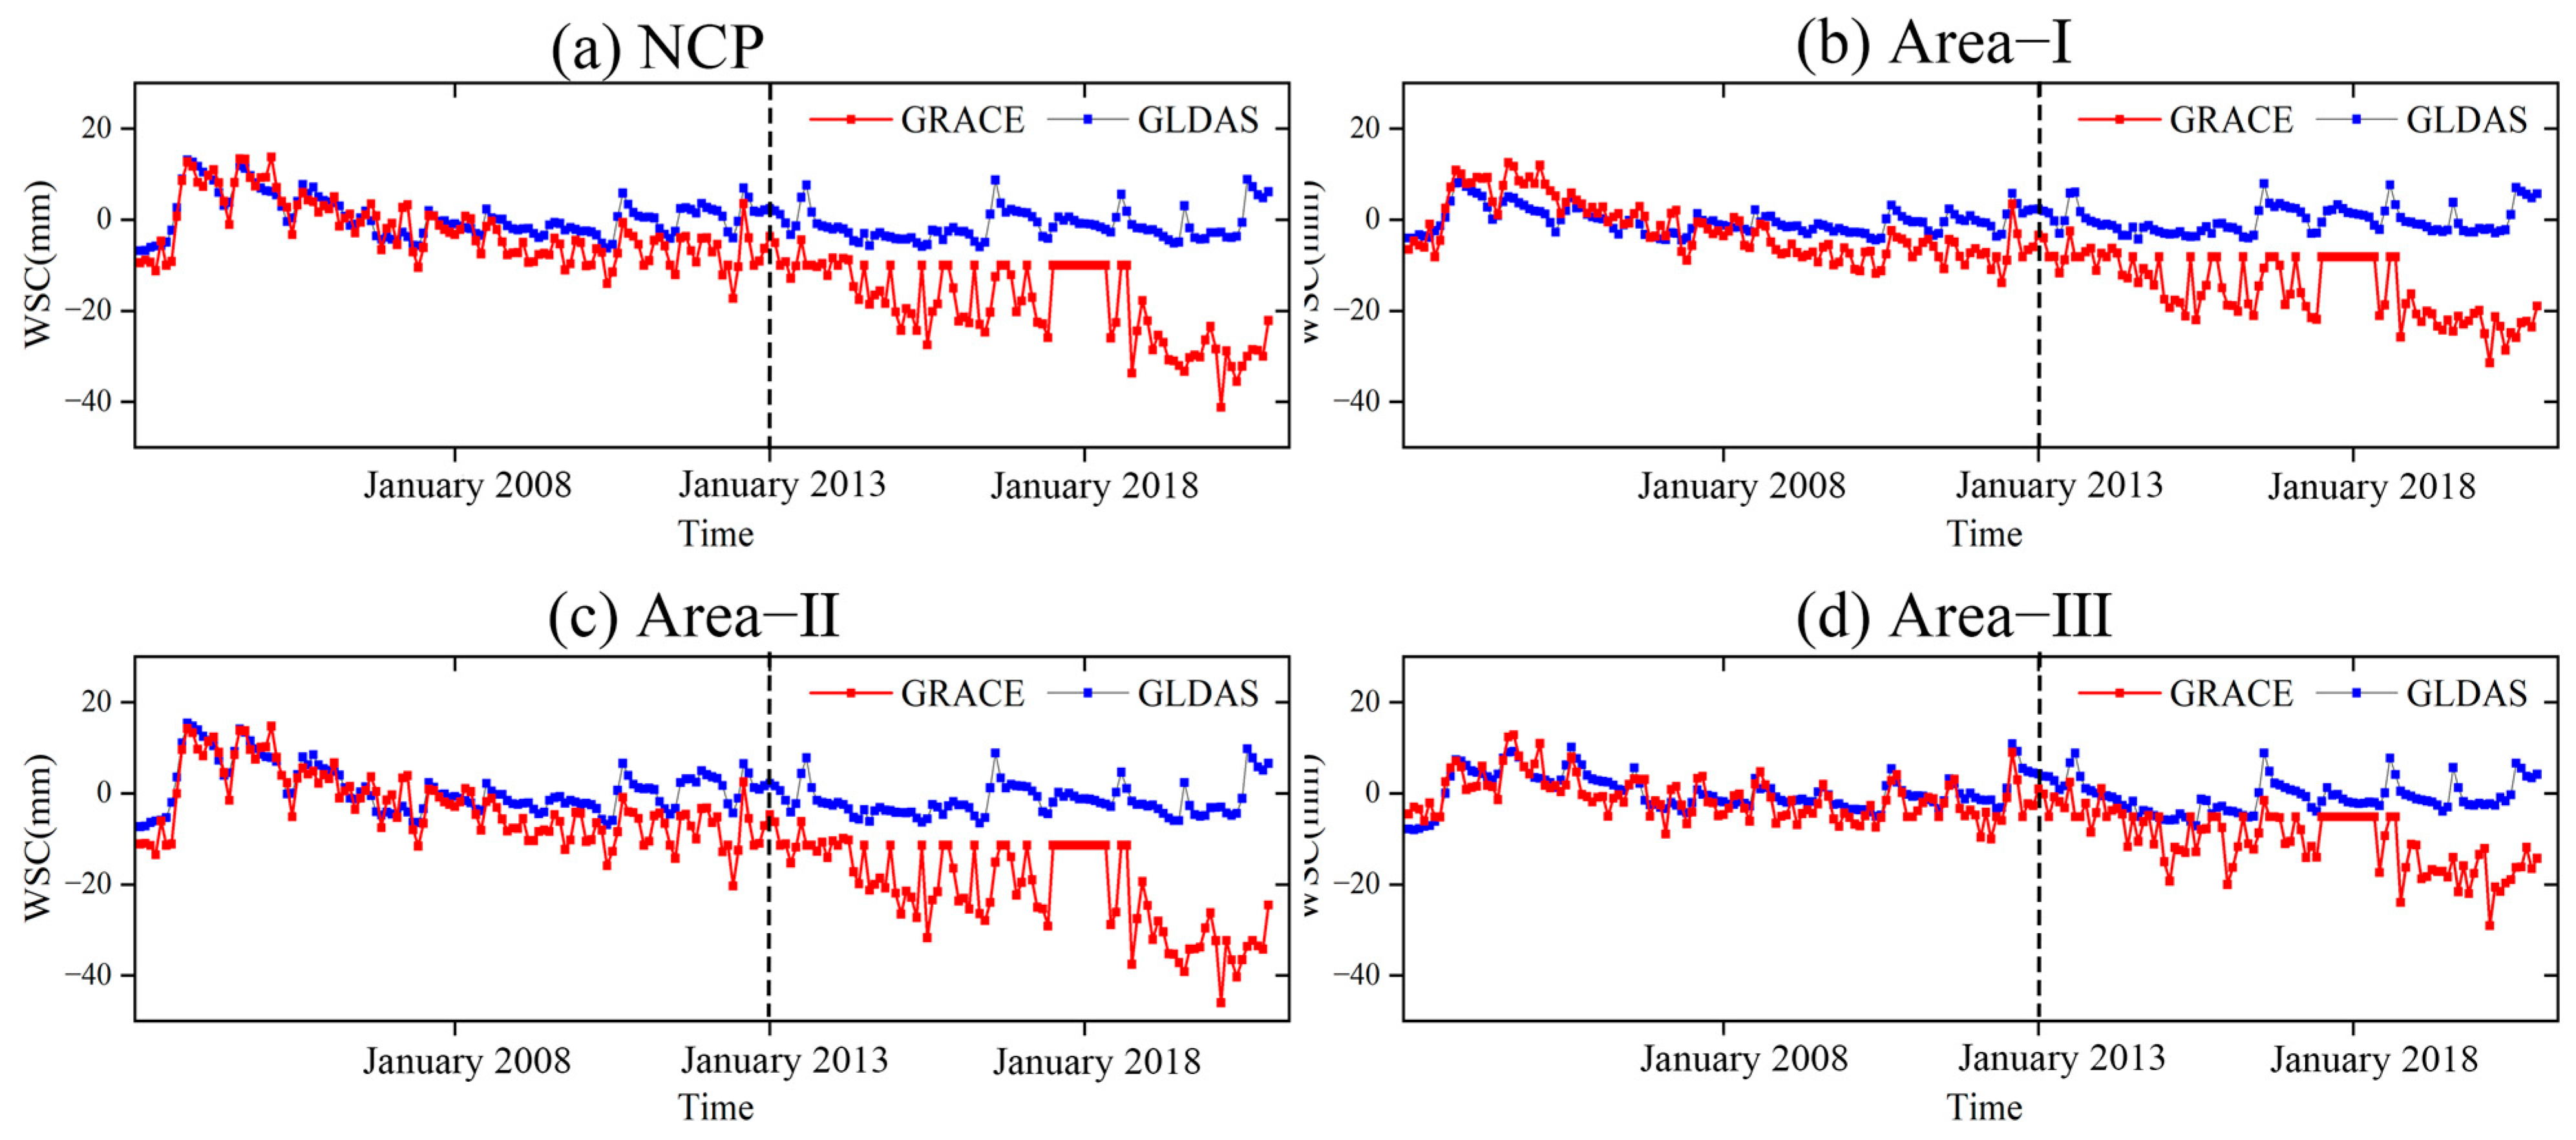
- The validation results of the GRACE data showed significant Pearson correlation coefficients (p < 0.01) between the changes in the GRACE- and GLDAS-based water storage in the NCP and its geomorphological areas, ranging from 0.322 to 0.552. Therefore, the GRACE-based results were reliable and could be used to effectively investigate groundwater drought events in the NCP.
- (2)
- The groundwater drought frequencies in the NCP, Area I, Area II, and Area III over the 2003–2020 period were 24.54, 26.39, 24.54, and 23.61%, respectively. Although Area I showed a higher groundwater drought frequency than the other sub-areas, mild and moderate groundwater drought events were the most prevalent. In addition, Area II showed a high frequency of moderate groundwater drought events, but its severe and extreme groundwater drought frequencies were relatively higher than those in the other sub-areas.
- (3)
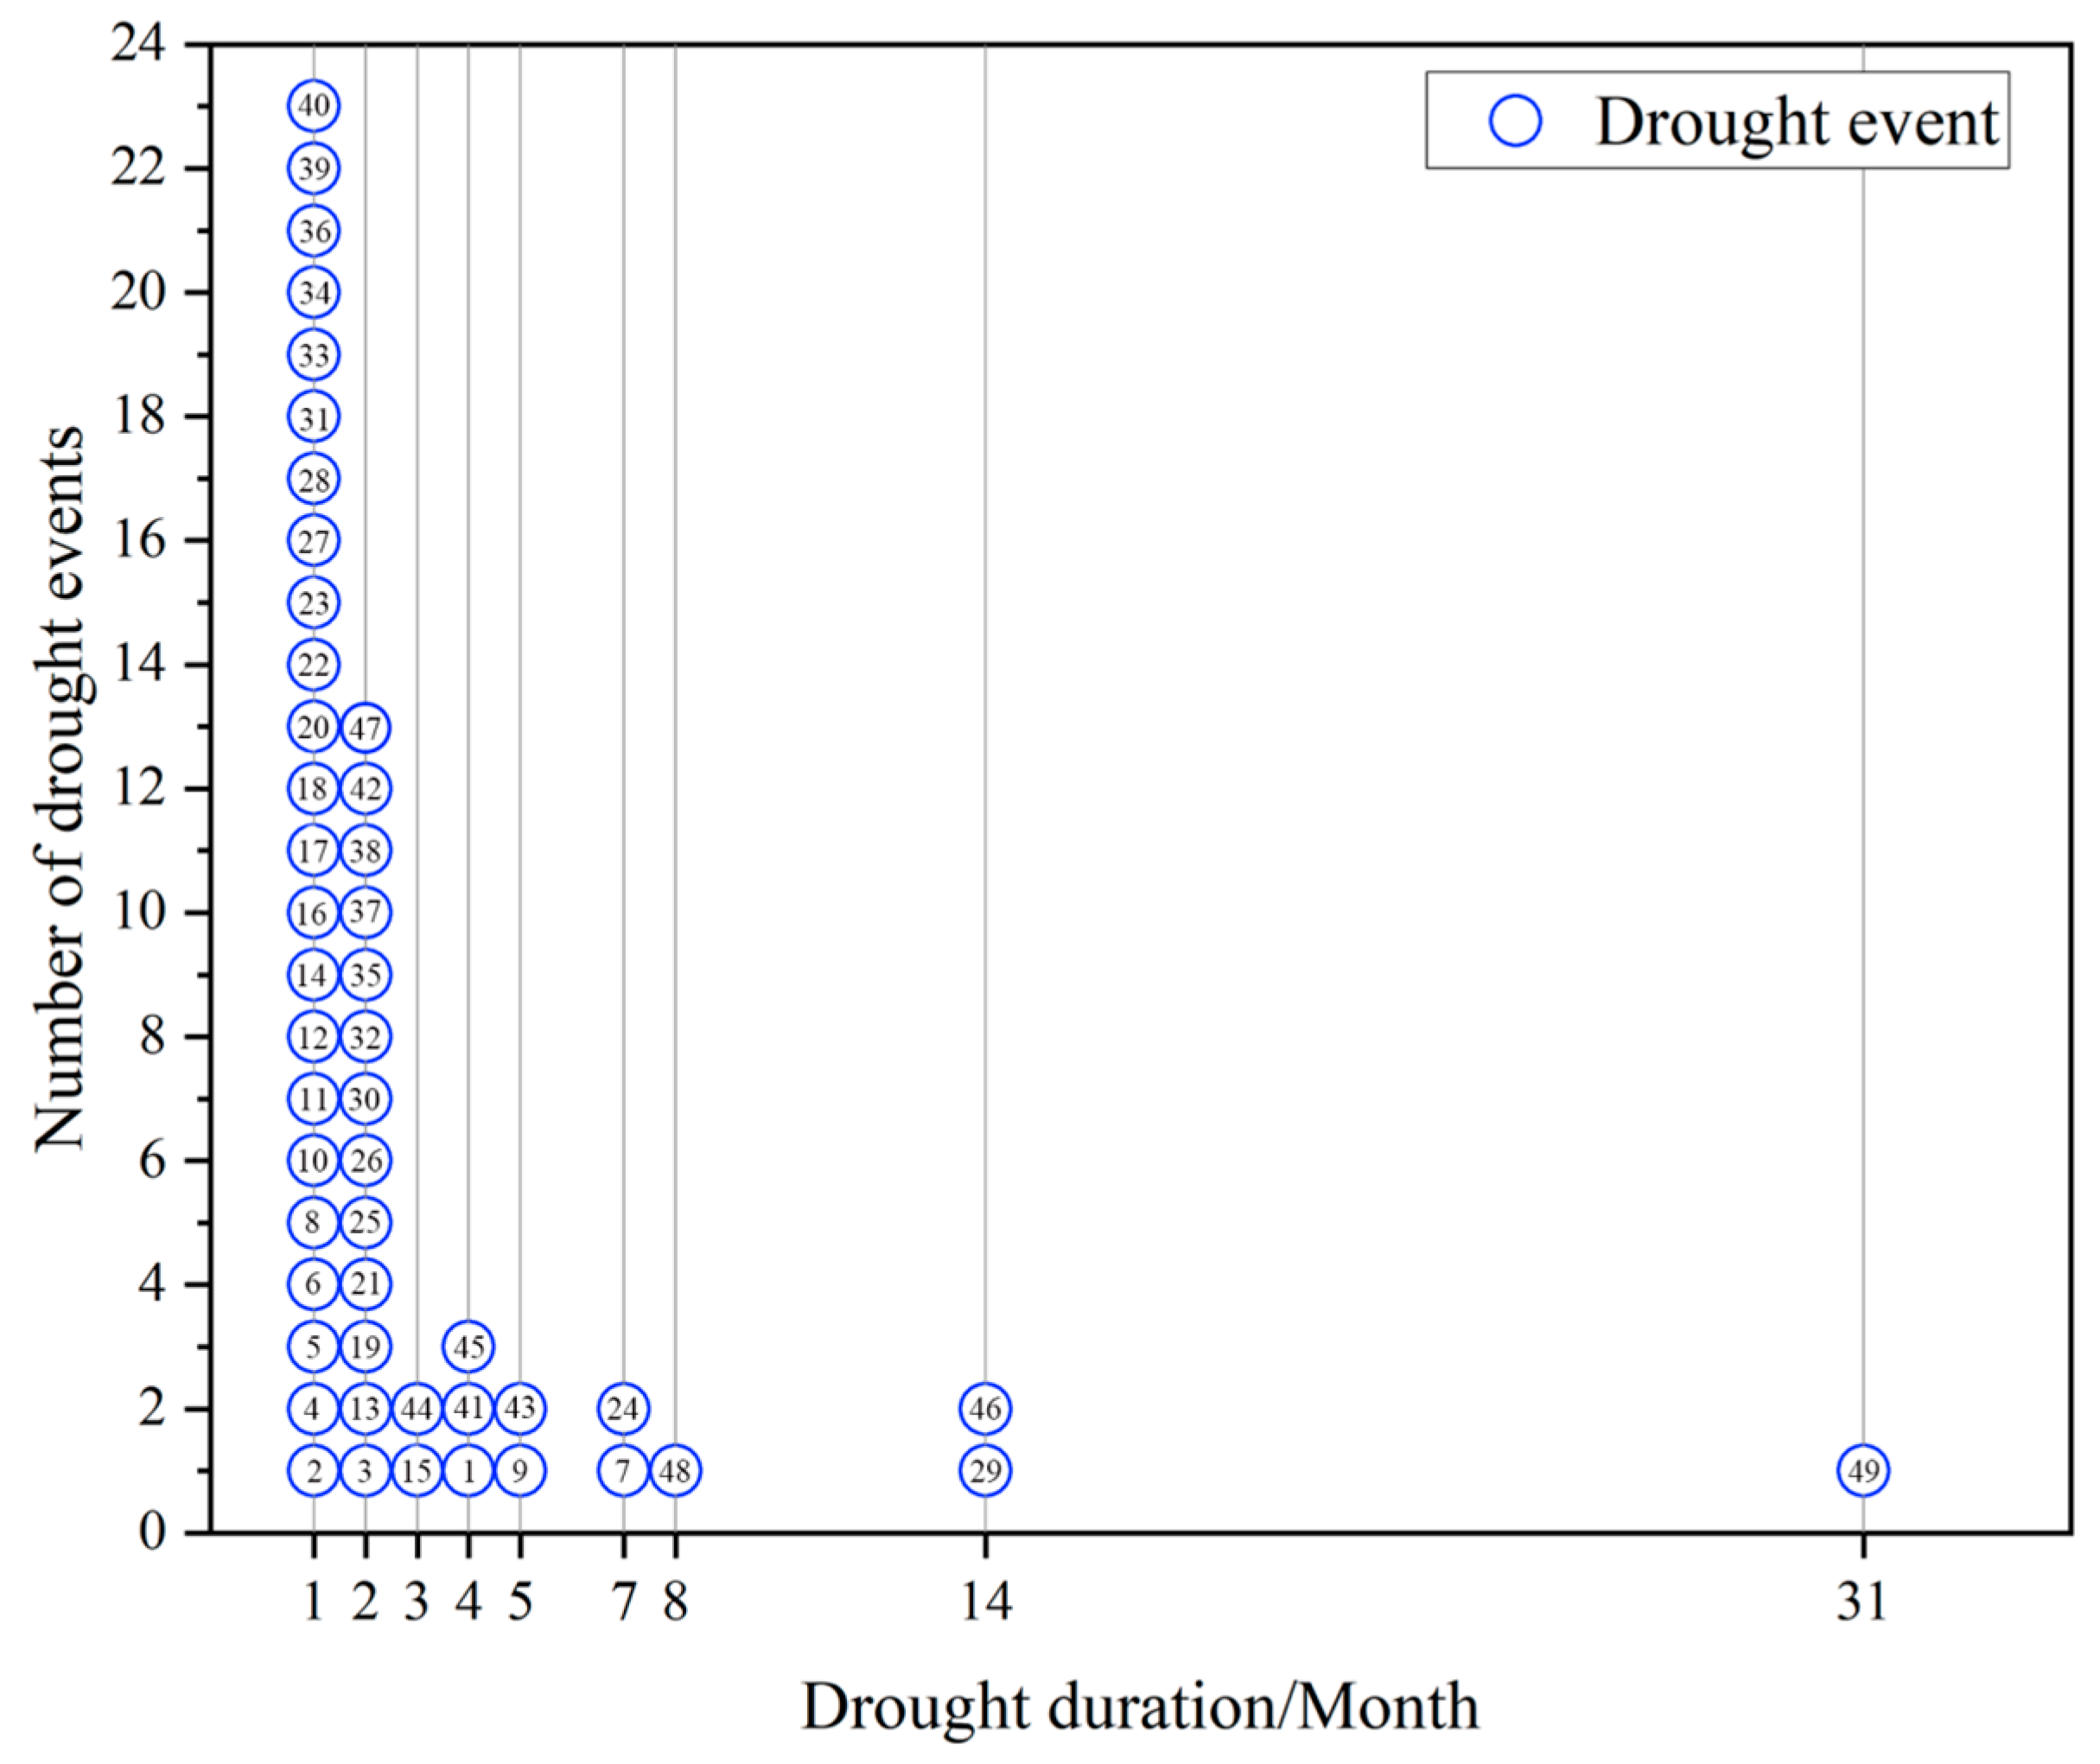
- According to the new identification principle for groundwater drought events, 49 groundwater drought events were identified in the NCP over the 2003–2020 period. The maximum duration of drought was 31 months and the minimum was 1 month. Drought events with a drought duration of 1 month were the most frequent, accounting for 46.94% of the total number of drought events, followed by those with a drought duration of 2 months, accounting for 26.53% of the total. Drought events with a drought duration of 8 or 31 months were the least frequent, both accounting for 2.04% of the total. The obtained results indicated that DE.49 was the most severe groundwater drought event, with a drought intensity, duration, and grid number of 38.17, 31 months, and 221, respectively. Meanwhile, DE.29 was the second most intense groundwater drought event, with a drought intensity, duration, and grid number of 11.53, 14 months, and 167, respectively.
- (4)
- A total of 11 groundwater drought events were selected from the 49 drought events to construct a drought migration model. The migration direction of 10 of the groundwater drought events was southwest–northeast, which was in line with the slope of the NCP. However, only DE.41 exhibited a southeast–northwest migration direction. The centroids of the groundwater drought events were mostly concentrated in Area II. The three groundwater drought events with the highest drought intensities were DE.49, DE.29, and DE.46. According to the obtained results, the highest drought intensities of DE.49 were observed mainly in the March 2020–December 2020 period, in which the drought center of gravity was concentrated in Area II, whereas the highest groundwater intensities of DE.29 were concentrated over the 4th–9th month period, in which the drought center of gravity was concentrated in the northeastern coastal area of the NCP. The lowest drought intensities of DE.46 were in the September 2016-November 2016 period, showing a drought center of gravity in Area II. On the other hand, the results indicated a lack of correlation between the drought intensities and drought grid numbers of DE.49, DE.29, and DE.46.
Author Contributions
Funding
Institutional Review Board Statement
Informed Consent Statement
Data Availability Statement
Conflicts of Interest
References
- Sanginabadi, H.; Saghafian, B.; Delavar, M. Coupled Groundwater Drought and Water Scarcity Index for Intensively Over-drafted Aquifers. J. Hydrol. Eng. 2019, 11, 04019003. [Google Scholar] [CrossRef]
- Mohamed, A.; Al Deep, M.; Othman, A.; Taha, A.I.; Alshehri, F.; Abdelrady, A. Integrated Geophysical Assessment of Groundwater Potential in Southwestern Saudi Arabia. Front. Earth Sci. 2022, 10, 937402. [Google Scholar] [CrossRef]
- Othman, A.; Abdelrady, A.; Mohamed, A. Monitoring Mass Variations in Iraq Using Time-Variable Gravity Data. Remote Sens. 2022, 14, 3346. [Google Scholar] [CrossRef]
- Famiglietti, J.S.; Ferguson, G. The hidden crisis beneath our feet. Science 2021, 372, 344–345. [Google Scholar] [CrossRef]
- United Nations Educational, Scientific and Cultural Organization (UNESCO). UN World Water Development Report; UNESCO: Dakar, Senegal, 2022. [Google Scholar]
- Han, Z.M.; Huang, S.Z.; Huang, Q.; Leng, G.Y.; Wang, H.; Bai, Q.J.; Zhao, J.; Ma, L.; Wang, L.; Du, M. Propagation dynamics from meteorological to groundwater drought and their possible influence factors. J. Hydrol. 2019, 578, 124102. [Google Scholar] [CrossRef]
- Huang, J.P.; Yu, H.P.; Guan, X.D.; Wang, G.Y.; Guo, R. Accelerated dryland expansion under climate change. Nat. Clim. Chang. 2015, 6, 166–171. [Google Scholar] [CrossRef]
- Ren, Y.; Liu, J.; Shalamzari, M.J.; Arshad, A.; Liu, S.; Liu, T.; Tao, H. Monitoring Recent Changes in Drought and Wetness in the Source Region of the Yellow River Basin, China. Water 2022, 14, 861. [Google Scholar] [CrossRef]
- Mohamed, A.; Faye, C.; Othman, A.; Abdelrady, A. Hydro-Geophysical Evaluation of the Regional Variability of Senegal’s Terrestrial Water Storage Using Time-Variable Gravity Data. Remote Sens. 2022, 14, 4059. [Google Scholar] [CrossRef]
- Ren, Y.; Liu, J.; Zhang, T.; Shalamzari, M.J.; Arshad, A.; Liu, T.; Willems, P.; Gao, H.; Tao, H.; Wang, T. Identification and Analysis of Heatwave Events Considering Temporal Continuity and Spatial Dynamics. Remote Sens. 2023, 15, 1369. [Google Scholar] [CrossRef]
- Kinouchi, T.; Sayama, T. A comprehensive assessment of water storage dynamics and hydroclimatic extremes in the Chao Phraya River Basin during 2002–2020. J. Hydrol. 2021, 603, 126868. [Google Scholar] [CrossRef]
- Rutulis, M. Groundwater drought sensitivity of Southern Manitoba. Can. Water Resour. J. 1989, 14, 18–33. [Google Scholar] [CrossRef]
- Van Lanen, H.A.J.; Peters, E. Definition, effects and assessment of groundwater droughts. In Drought and Drought Mitigation in Europe; Springer: New York, NY, USA, 2000; pp. 49–61. [Google Scholar]
- Marchant, B.; Bloomfield, J. Spatio-temporal modelling of the status of groundwater droughts. J. Hydrol. 2018, 564, 397–413. [Google Scholar] [CrossRef]
- Brauns, B.; Cuba, D.; Bloomfield, J.P.; Hannah, D.M.; Jackson, C.; Marchant, B.P.; Heudorfer, B.; Van Loon, A.F.; Bessière, H.; Thunholm, B.; et al. The Groundwater Drought Initiative (GDI): Analysing and understanding groundwater drought across Europe. Proc. Int. Assoc. Hydrol. Sci. 2020, 383, 297–305. [Google Scholar] [CrossRef]
- Bloomfield, J.P.; Marchant, B.P.; McKenzie, A.A. Changes in groundwater drought associated with anthropogenic warming. Hydrol. Earth Syst. Sci. 2019, 23, 1393–1408. [Google Scholar] [CrossRef]
- Fiorillo, F.; Guadagno, F.M. Long karst spring discharge time series and droughts occurrence in Southern Italy. Environ. Earth Sci. 2011, 65, 2273–2283. [Google Scholar] [CrossRef]
- Bloomfield, J.P.; Marchant, B.P. Analysis of groundwater drought building on the standardised precipitation index approach. Hydrol. Earth Syst. Sci. 2013, 17, 4769–4787. [Google Scholar] [CrossRef]
- Saghafian, B.; Sanginabadi, H. Multivariate groundwater drought analysis using copulas. Hydrol. Res. 2020, 51, 666–685. [Google Scholar] [CrossRef]
- Bhuiyan, C. Various drought indices for monitoring drought condition in Aravalli terrain of India. In Proceedings of the 20th ISPRS Conference, Istanbul, Turkey, 12–23 July 2004. [Google Scholar]
- Thomas, B.F.; Famiglietti, J.S.; Landerer, F.W.; Wiese, D.N.; Molotch, N.P.; Argus, D.F. GRACE Groundwater Drought Index: Evaluation of California Central Valley groundwater drought. Remote Sens. Environ. 2017, 198, 384–392. [Google Scholar] [CrossRef]
- Kumar, K.S.; AnandRaj, P.; Sreelatha, K.; Bisht, D.S.; Sridhar, V. Monthly and Seasonal Drought Characterization Using GRACE-Based Groundwater Drought Index and Its Link to Teleconnections across South Indian River Basins. Climate 2021, 9, 56. [Google Scholar] [CrossRef]
- Li, B.; Rodell, M. Evaluation of a model-based groundwater drought indicator in the conterminous U.S. J. Hydrol. 2015, 526, 78–88. [Google Scholar] [CrossRef]
- Mendicino, G.; Senatore, A.; Versace, P. A Groundwater Resource Index (GRI) for drought monitoring and forecasting in a mediterranean climate. J. Hydrol. 2008, 357, 282–302. [Google Scholar] [CrossRef]
- Goodarzi, M.; Abedi-Koupai, J.; Heidarpour, M.; Safavi, H.R. Development of a New Drought Index for Groundwater and Its Application in Sustainable Groundwater Extraction. J. Water Resour. Plan. Manag. 2016, 142, 04016032. [Google Scholar] [CrossRef]
- Zhu, Q.; Zhang, H. Groundwater drought characteristics and its influencing factors with corresponding quantitative contri-bution over the two largest catchments in China. J. Hydrol. 2022, 609, 127759. [Google Scholar] [CrossRef]
- Wang, F.; Lai, H.; Li, Y.; Feng, K.; Zhang, Z.; Tian, Q.; Zhu, X.; Yang, H. Identifying the status of groundwater drought from a GRACE mascon model perspective across China during 2003–2018. Agric. Water Manag. 2021, 260, 107251. [Google Scholar] [CrossRef]
- Wen, X.; Tu, Y.H.; Tan, Q.F.; Li, W.Y.; Fang, G.H.; Ding, Z.Y.; Wang, Z.N. Construction of 3D drought structures of meteorological drought events and their spa-tio-temporal evolution characteristics. J. Hydrol. 2020, 590, 125539. [Google Scholar] [CrossRef]
- Zhou, H.; Liu, Y.B.; Liu, Y.W. An approach to tracking meteorological drought migration. Water Resour. Res 2019, 55, 3266–3284. [Google Scholar] [CrossRef]
- Guo, H.; Bao, A.M.; Ndayisaba, F.; Liu, T.; Jiapaer, G.; El-Tantawi, A.M.; De Maeyer, P. Space-time characterization of drought events and their impacts on vegetation in Central Asia. J. Hydrol. 2018, 564, 1165–1178. [Google Scholar] [CrossRef]
- Herrera-Estrada, J.E.; Satoh, Y.; Sheffield, J. Spatiotemporal dynamics of global drought. Geophys. Res. Lett. 2017, 44, 2254–2263. [Google Scholar] [CrossRef]
- Han, Z.M.; Huang, Q.; Huang, S.Z.; Leng, G.Y.; Bai, Q.J.; Liang, H.; Wang, L.; Zhao, J.; Fang, W. Spatial-temporal dynamics of agricultural drought in the Loess Plateau under a changing environment: Characteristics and potential influencing factors. Agric. Water Manag. 2020, 244, 106540. [Google Scholar] [CrossRef]
- Bloomfield, J.P.; Marchant, B.P.; Bricker, S.H.; Morgan, R.B. Regional analysis of groundwater droughts using hydrograph classification. Hydrol. Earth Syst. Sci. 2015, 19, 4327–4344. [Google Scholar] [CrossRef]
- Wang, F.; Wang, Z.; Yang, H.b.; Di, D.Y.; Zhao, Y.; Liang, Q.H. Utilizing GRACE-based groundwater drought index for drought characterization and teleconnection factors analysis in the North China Plain. J. Hydrol. 2020, 585, 124849. [Google Scholar] [CrossRef]
- Shi, J.; Zhang, Y. North China Plain: Strengthening the rational development of groundwater is the key. China Nat. Resour. News 2020, 3, 7. [Google Scholar]
- Zhang, C.; Duan, Q.; Yeh, P.J.; Pan, Y.; Gong, H.; Gong, W.; Di, Z.; Lei, X.; Liao, W.; Huang, Z.; et al. The Effectiveness of the South-to-North Water Diversion Middle Route Project on Water Delivery and Groundwater Recovery in North China Plain. Water Resour. Res. 2020, 56, e2019WR026759. [Google Scholar] [CrossRef]
- Yang, H.F.; Cao, W.G.; Zhi, C.S.; Li, Z.Y.; Bao, X.L.; Ren, Y.; Liu, F.T.; Fan, C.L.; Wang, S.F.; Wang, Y.B. Evolution of groundwater level in the North China Plain in the past 40 years and suggestions on its overexploitation treatment. Geol. China 2021, 48, 1142–1155. [Google Scholar]
- Zhang, H.; Ding, J.; Zhu, Q.; Wang, G.Q. Analysis on spatial-temporal characteristic of groundwater drought based on GRACE in North China Plain. Yangtze River 2021, 52, 107–114. [Google Scholar]
- Wenpeng, L.; Longfeng, W.; Huifeng, Y.; Yuejun, Z.; Wengeng, C.; Ke, L. The groundwater overexploitation status and countermeasure suggestions of the North China Plain. China Water Resour. 2020, 13, 26–30. [Google Scholar]
- Zhang, G.L.; Liu, H.Y.; Guo, H.M.; Sun, Z.X.; Wang, Z.; Wu, T.H. Occurrences and health risks of high nitrate groundwater in the typical piedmont areas of the North China Plain. Earth Sci. Front. 2023, 1–21. [Google Scholar] [CrossRef]
- Dou, T.T.; Cheng, H.H.; Zhou, Y.Z.; Shi, Y.L. The influence of groundwater mining on regional seismicity in the North China Plain. Chin. J. Geophys. 2022, 65, 2931–2944. (In Chinese) [Google Scholar]
- Zhang, D. Study of the Allowable Groundwater Withdrawal in the North China Plain Based on Environmental Limited Groundwater Level; University of Geosciences: Beijing, China, 2017. [Google Scholar]
- Lin, M.; Biswas, A.; Bennett, E.M. Spatio-temporal dynamics of groundwater storage changes in the Yellow River Basin. J. Environ. Manag. 2019, 235, 84–95. [Google Scholar] [CrossRef]
- Rodell, M.; House, P.R.; Jambor, U.; Gottschalck, J.; Mitchell, K.; Meng, C.J.; Arsenault, K.; Cosgrove, B.; Radakovich, J.; Bosilo-vich, M.; et al. The Global Land Data Assimilation System. Bull. Am. Meteorol. Soc. 2004, 85, 381–394. [Google Scholar] [CrossRef]
- Sheffield, J.; Andreadis, K.M.; Wood, E.F.; Lettenmaier, D.P. Global and Continental Drought in the Second Half of the Twentieth Century: Severity–Area–Duration Analysis and Temporal Variability of Large-Scale Events. J. Clim. 2009, 22, 1962–1981. [Google Scholar] [CrossRef]
- Wang, A.; Lettenmaier, D.P.; Sheffield, J. Soil Moisture Drought in China, 1950–2006. J. Clim. 2011, 24, 3257–3271. [Google Scholar] [CrossRef]
- Han, Z.; Huang, S.; Huang, Q.; Bai, Q.; Leng, G.; Wang, H.; Zhao, J.; Wei, X.; Zheng, X. Effects of vegetation restoration on groundwater drought in the Loess Plateau, China. J. Hydrol. 2020, 591, 125566. [Google Scholar] [CrossRef]
- Ganapuram, S.; Nagarajan, R.; Sekhar, G.C. Identification of groundwater drought prone zones in Pedda vagu and Ookachetti vagu watersheds, tributaries of the Krishna River, India. Geocarto Int. 2015, 31, 385–407. [Google Scholar] [CrossRef]
- Mustafa, S.M.T.; Abdollahi, K.; Verbeiren, B.; Huysmans, M. Identification of the influencing factors on groundwater drought and depletion in north-western Bangladesh. Hydrogeol. J. 2017, 25, 1357–1375. [Google Scholar] [CrossRef]
- Landerer, F.W.; Swenson, S.C. Accuracy of scaled GRACE terrestrial water storage estimates. Water Resour. Res. 2012, 48, 1–11. [Google Scholar] [CrossRef]
- Yao, Y.Y.; Zheng, C.M.; Andrews, C.; He, X.; Zhang, A.J.; Liu, J. Integration of groundwater into China’s south-north water transfer strategy. Sci. Total. Environ. 2018, 658, 550–557. [Google Scholar] [CrossRef]


| Area | Pearson Correlation Coefficient |
|---|---|
| Area Ⅰ | 0.322 ** |
| Area Ⅱ | 0.552 ** |
| Area Ⅲ | 0.487 ** |
| NCP | 0.527 ** |
| Area | Uncertainty (mm/month) |
|---|---|
| Area Ⅰ | 11.51 |
| Area Ⅱ | 15.11 |
| Area Ⅲ | 7.96 |
| NCP | 13.44 |
| Area | Decline Rate (mm/Month) |
|---|---|
| Area Ⅰ | 0.0578 |
| Area Ⅱ | 0.0620 |
| Area Ⅲ | 0.0452 |
| NCP | 0.0590 |
| Drought Event | Occurrence Time | Drought Duration (Months) | Monthly Average Minimum GGDI | Monthly Maximum Drought Grid Number | Drought Intensity |
|---|---|---|---|---|---|
| 1 | 2003.01–2003.04 | 4 | −1.14 | 14 | 1.84 |
| 7 | 2005.06–2005.12 | 7 | −1.57 | 8 | 4.41 |
| 9 | 2006.02–2006.06 | 5 | −1.55 | 8 | 3.08 |
| 24 | 2011.10–2012.04 | 7 | −0.87 | 155 | 0.88 |
| 29 | 2012.08–2013.09 | 14 | −2.47 | 167 | 11.53 |
| 41 | 2014.08–2014.11 | 4 | −1.03 | 67 | 1.24 |
| 43 | 2015.01–2015.05 | 5 | −1.25 | 203 | 2.50 |
| 45 | 2015.12–2016.03 | 4 | −1.29 | 213 | 2.17 |
| 46 | 2016.05–2017.06 | 14 | −1.42 | 216 | 6.67 |
| 48 | 2017.09–2018.04 | 8 | −0.96 | 9 | 2.36 |
| 49 | 2018.06–2020.12 | 31 | −3.12 | 221 | 38.17 |
Disclaimer/Publisher’s Note: The statements, opinions and data contained in all publications are solely those of the individual author(s) and contributor(s) and not of MDPI and/or the editor(s). MDPI and/or the editor(s) disclaim responsibility for any injury to people or property resulting from any ideas, methods, instructions or products referred to in the content. |
© 2023 by the authors. Licensee MDPI, Basel, Switzerland. This article is an open access article distributed under the terms and conditions of the Creative Commons Attribution (CC BY) license (https://creativecommons.org/licenses/by/4.0/).
Share and Cite
Huang, J.; Cao, L.; Wang, L.; Liu, L.; Yu, B.; Han, L. Identification and Spatiotemporal Migration Analysis of Groundwater Drought Events in the North China Plain. Atmosphere 2023, 14, 961. https://doi.org/10.3390/atmos14060961
Huang J, Cao L, Wang L, Liu L, Yu B, Han L. Identification and Spatiotemporal Migration Analysis of Groundwater Drought Events in the North China Plain. Atmosphere. 2023; 14(6):961. https://doi.org/10.3390/atmos14060961
Chicago/Turabian StyleHuang, Jia, Lianhai Cao, Lei Wang, Liwei Liu, Baobao Yu, and Long Han. 2023. "Identification and Spatiotemporal Migration Analysis of Groundwater Drought Events in the North China Plain" Atmosphere 14, no. 6: 961. https://doi.org/10.3390/atmos14060961
APA StyleHuang, J., Cao, L., Wang, L., Liu, L., Yu, B., & Han, L. (2023). Identification and Spatiotemporal Migration Analysis of Groundwater Drought Events in the North China Plain. Atmosphere, 14(6), 961. https://doi.org/10.3390/atmos14060961