Abstract
Hydrological conditions are strongly regulated by monsoon systems in the Mekong River Basin (MRB), while relevant studies investigating the intensity of the rainy season are still insufficient. This study employed the Mann-Kendall (M-K) test, Sen’s slope estimator, and innovation trend analysis to detect the variation of summer discharge in the MRB. Wavelet analysis is used to investigate the correlation between discharge and two South Asian summer monsoon subsystems (SAMI1 and SAMI2). Results show that the summer discharge in the MRB generally shows significant downward trends during 1970–2016 with a Z value range of −3.59–−1.63, while the high discharge at Vientiane, Mukdahan, and Pakse increases after 1970. The mutation years of the summer discharge series are around 2010 for Chiang Sean and Vientiane, and in 2015 for Luang Prabang, which resulted from the newly built large dams, Xiaowan and Nuozhadu. The wavelet analysis shows that the SAMI1 can be used to predict the summer discharge at Chiang Sean at a ~8-year timescale, while the SAMI2 correlates with the summer discharge well at a 1–8-year scale, especially at Mukdahan and Kratie during 1980–2016.
1. Introduction
Changes in the flow discharge of large river systems have become a widespread concern globally due to their potential far-reaching impacts on both human and natural systems. It can affect the availability of water resources for agriculture, hydroelectric power generation, fisheries, and local ecosystems, causing problems such as reduced water availability, increased frequency of extreme events, and changed riverine ecosystems. As an essential component of the water circulation system, the spatial–temporal distribution of river discharge is inevitably influenced by both climatic factors and human activities, e.g., dam construction, irrigation, and land-use changes. In some basins, dam operation is the dominant factor that alters flow regimes [1,2,3]. Climate factors such as monsoons have also been strongly linked to a range of hydrological disasters, including droughts and floods [4,5,6], especially in the long term [7]. Therefore, understanding the spatiotemporal variations of river discharge and investigating the climatic factors that affect flow is crucial for preventing natural disasters and supporting sustainable water management decision-making [8,9].
Mekong River Basin (MRB) is a flood-prone area with several active monsoons [10]. Within the context of climate change and human activities, the risk of flood increases, and the flow regime of runoff affects ecological processes in this basin [11,12,13]. Therefore, addressing changes in discharge is imperative for achieving sustainable development and ecosystem conservation of large rivers. Previous studies have mainly focused on the variations of mean annual discharge and annual maximum/minimum discharge in the MRB, with little attention given to the average flow discharge during the wet season [11,14]. However, research has shown that the monsoon months (usually, from May to October) contribute to 80–90% of the discharge in the lower Mekong [14]. Therefore, the mean summer discharge is a better representative than the annual mean discharge and should be given equal attention as the annual maximum discharge. It provides a more accurate description of the intensity of the rainy season.
Previous studies have demonstrated that hydrological conditions are strongly regulated by climate factors in the MRB [6,15,16]. In recent years, several studies have explored the spatial–temporal variations of floods and their response to different monsoons in the MRB. Delgado et al. [14] discovered a strong correlation between the Western North Pacific monsoon (WNPM) and the interannual flood regime in the lower MRB, while the relationship between the Indian monsoon and floods was found to be weaker. Wang et al. [13] found that the Indian summer monsoon (ISM) tended to cause severe floods in northern Thailand. Similar results have been found in the monsoon-rainy season perception link, indicating ISM has a good relationship with rainy season precipitation in the west MRB [17]. The combined effect of the ISM and WNPM has also been studied, revealing a correlation with severe floods in southeast MRB [13]. Although a lot of research has focused on typical monsoons (e.g., ISM and WNPM), other summer monsoon indexes, such as the South Asian summer monsoon (SASM), which overlaps with the MRB and may also affect discharge variations through its impacts on rainfall, remain poorly understood [18]. Different regions use different monsoon indices to determine the intensity of monsoons, and the intensity of SASM, as reflected by relevant indices, has been found to vary greatly [18]. Two independent components of SASM, i.e., Southwest Asian summer monsoon (SASMI1) and Southeast Asian summer monsoon (SASMI2), are considered in this study for they have received less attention than other monsoons despite their influence in South Asia. By identifying more possible driving monsoons, it is helpful to better understand their correlation mechanisms and improve discharge forecasts [19].
There are several traditional approaches for hydrological trend analyses, such as Mann-Kendall (M-K) test [20,21] and Sen’s slope estimator [22,23]. The non-parametric M-K test is suitable for non-normally distributed data and robust in detecting monotonic trends in data [24]. Sen’s slope estimator is relatively robust to outliers and can provide an estimate of the trend slope. Recently, innovation trend analysis (ITA) is also widely used [23,25,26], which can capture non-linear trends and provide more information on the structure of the data, such as identifying the trend for all value ranges [27]. By combining these methods, hidden information of the data can be uncovered, and a comprehensive analysis of its trends can be conducted from different perspectives. Moreover, recent studies have suggested new methods for detecting discharge trends, such as the combination of discrete wavelet transform with the M-K test or machine learning algorithms [28,29,30]. However, these methods often need preprocessing steps and require more complex computations. Wavelet analysis has also been widely used to analyze the relationships and correlations between climate factors and meteorological/hydrological factors [19,31,32,33]. The results of cross wavelet transform (XWT) and wavelet coherence (WTC) analysis are all shown in the time–frequency domain, providing more accurate and intuitive information compared with other correlation analysis methods, such as Pearson’s correlation coefficient.
The study aims to analyze the spatial–temporal variations of summer discharge in the Mekong River and investigate whether the two South Asian summer monsoons (SAMI1 and SAMI2) have an impact on summer discharge. Based on the dataset from at least 1960–2016 at six stations in the Mekong River, the summer discharge was analyzed using the M-K test with Sen’s slope estimator and ITA. The periods of summer discharge in the Mekong River and the two monsoons were shown by CWT. Additionally, the relationships and correlations between SAMI1/SAMI2 and summer discharge were examined using XWT and WTC, respectively. Understanding the relationship between the monsoons and average summer discharge is essential for managing water resources in the MRB.
2. Study Area and Data
2.1. Study Region
The Mekong River originates in the Tibetan Plateau in Yunnan, China, and flows through five countries (Myanmar, Laos, Thailand, Cambodia, and Vietnam) before reaching the South China Sea. It is the most critical transnational water system and the longest river in Asia, with a total length of 4909 km. The river basin is roughly located between 5°36′–32°51′ N and 93°12′–108°32′ E, spanning an area of 795,000 km2. The north of the MRB is mostly alpine mountains and glaciers, whereas the middle and lower regions are large hills, alluvial plains, and estuarine deltas. In this study, we mainly focused on the downstream sections of the Mekong River in China and Myanmar.
We selected six hydrological stations (Chiang Sean, Luang Prabang, Vientiane, Mukdahan, Pakse, and Kratie) to investigate summer discharge variability in the MRB and their correlations with monsoon subsystems (Figure 1). Chiang Sean (20°16′ N, 100°5′ E), the northernmost and westernmost station, and Kratie (12°29′ N, 106°1′ E), the southernmost and easternmost station, located at the most upstream and downstream points among the six stations, respectively.
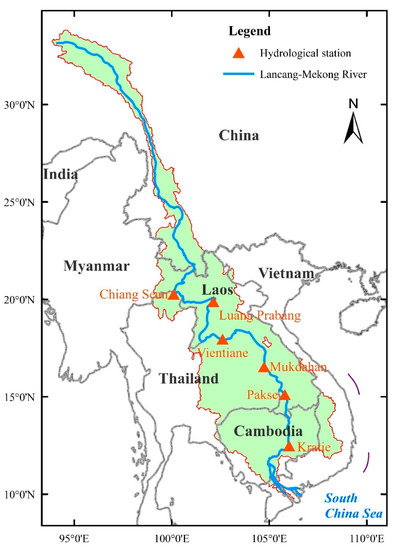
Figure 1.
Map of MRB with six hydrological stations.
2.2. Data
The data used in this study include the discharge measurements from six stations and two monsoon indexes (Table 1).

Table 1.
The data used in this study.
The daily discharge data obtained from these hydrological stations of the Mekong River have different lengths of time, which range from 57 to 104 years (Table 1). The mean discharge values were calculated for the months of June, July, August, and September (JJAS), representing the flow conditions of the Mekong River during the annual rainy season. The discharge data for the selected hydrological stations are accessible on the Mekong River Commission website (https://portal.mrcmekong.org/time-series/discharge, accessed on 4 March 2022).
In this study, we utilized two independent components of the South Asian summer monsoon (SASM): SASMI1 and SASMI2. These two monsoons are area-averaged dynamical normalized seasonality (DNS) in JJAS at 850 hPa, within Southwest Asia (2.5−20° N, 35−70° E) and Southeast Asia (2.5–20° N, 70–110° E) monsoon domains, respectively (http://lijianping.cn/dct/page/1, accessed on 12 April 2023). DNS is a unified dynamical index of monsoon presented by Li and Zeng [18], which is suitable for all known monsoon regions. The domain of SASMI2 contains the six hydrological stations in Figure 1, whereas that of SASMI1 lies to the west of the study region. The duration of the two monsoon datasets ranges from 1948 to 2020 (Table 1).
3. Methodology
3.1. Mann-Kendall (M-K) Test
In this study, the M-K test [20,21] is adopted to identify the trend and mutation of the summer discharge time series in the MRB. The M-K trend test is a non-parametric method that uses ranks to analyze the difference in signs between adjacent data points, using the standard normal variant (Z) [34]. At a significance level of 0.05 (0.01), Z > 1.96 (2.58) and Z < −1.96 (−2.58) indicate significant increasing and decreasing trends, respectively [35]. The M-K mutation detection is excellent for testing abrupt changes in a time series and has been widely applied in the analysis of hydrological and meteorological data [36,37]. As a nonparametric method, the starting time of the mutation can be identified without requiring the samples to follow a certain distribution [38,39]. More details on this method can refer to Li and Song [38].
3.2. Sen’s Slope Estimator
Sen [22] proposed the nonparametric Sen’s slope statistics for estimating the slope of trend, which has been used in meteorological time series [26,40]. The Sen slope calculation is based on a proposal by Theil [41], and Theil–Sen’s slope is calculated as follows:
where and are the data values at time and (i > j), respectively. If , the time series has an increasing trend, and vice versa.
In this study, Sen’s slope was used to calculate the rate of summer discharge change in the MRB.
3.3. Innovative Trend Analysis (ITA)
The ITA method was introduced by Sen [25] to detect trends in hydrometeorology time series [26,27,42]. This involves splitting the data into two equal parts and arranging them in ascending order. The resulting sub-series, and , are plotted on a Cartesian coordinate system, with one on the x-axis and the other on the y-axis. Figure 2 clearly shows that the points falling on the 1:1 line represent no trend. A monotonically increasing or decreasing trend is indicated by points lying above or below the 45˚ line, respectively. Otherwise, the trend may not be monotonic. The x-axis is divided into three categories: “low” (<10th percentile), “medium” (=10–90th percentile), and “high” (>90th percentile). The slope of the ITA is calculated as below [43]:
where and represents the summer discharge series within two halves of the time series, respectively, and the value of n represents the number of data.
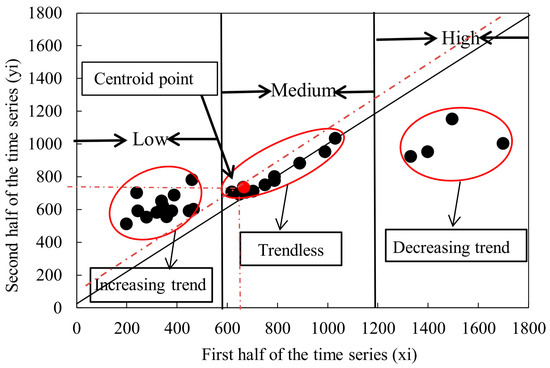
Figure 2.
Illustration of the innovative trend analysis (ITA) method showing low, medium, and high values. Reproduced from Meng’s research [42].
3.4. Wavelet Analysis
The wavelet analysis includes CWT, XWT, and WTC. A specific definition and calculation process of wavelet analysis can be found in Li and He [44].
CWT is used to find localized intermittent oscillations in time series and has been widely used in the fields such as climate change and hydrological cycles [45]. It comes from the Fourier transform, utilizing wavelet functions to expand the time series into time–frequency space [46,47]. In this study, CWT is used to investigate the periodic variations of summer discharge in the MRB and monsoon subsystems.
XWT is adopted to explore the relationships between summer discharge and monsoon subsystems across multi-timescales in the time–frequency domain. The complex XWT angle denotes the local relative phase relationship between two time series.
WTC reveals the degree of local correlation between two time series in the time–frequency domain, which can be significant in the high- and low-energy regions of the cross-wavelet power spectrum. Two CWTs are used to calculate WTC, and the Monte Carlo method was used to test the significance of the coherent wavelet spectrum [45,47].
4. Results and Discussion
4.1. Spatial–Temporal Variations of Summer Discharge in MRB
The interannual variations of summer discharge at six gauges in MRB are shown in Figure 3. To standardize the data length and facilitate comparison of trend analysis across different stations, we have set the time series for Chiang Sean and Luang Prabang as 1960–2016, while that for Vientiane, Mukdahan, Pakse, and Kratie is 1924–2016. The summer discharge increases from upstream to downstream in the study area. Kratie consistently exhibits the highest discharge, ranging from 10,000 to 40,000 m3/s, while Chiang Sean exhibits the lowest discharge, with a range of 2000–8000 m3/s.
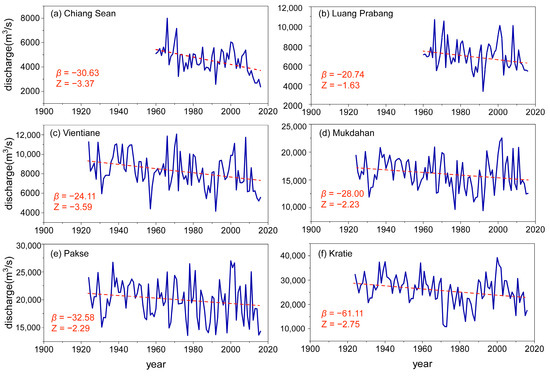
Figure 3.
Interannual variation of summer discharge for (a) Chiang Sean, (b) Luang Prabang, (c) Vientiane, (d) Mukdahan, (e) Pakse, and (f) Kratie. Red dashed lines are the linear fitting curves of the summer discharge time series.
According to the M-K test and Sen’s approach, the summer discharge series of the six gauges in the MRB have shown negative values of β and Z in the ranges of −61.11–−20.74 m3/s·year and −3.59–−1.63, respectively. This suggests a general decrease in interannual summer discharge over the study periods. The summer discharge of Chiang Sean, Vientiane, Pakse, and Kratie have all experienced significant decreases at a 1% significance level (Figure 3a,c,e,f), while Mukdahan has seen a significant decrease at a 5% significance level (Figure 3d). Although there is no significant decreasing trend in summer discharge at Luang Prabang during 1950–2016 (Z = −1.63, which is larger than −1.96), it experiences a rapid decline between 1970–1990 and 2000–2016 (Figure 3b).
During the study period of each gauge, the discharge at Chiang Sean, Luang Prabang, and Vientiane peaked close to 1967 (Figure 3a–c), while Mukdahan, Pakse, and Kratie, peaked in 2000 (Figure 3d–f). This may suggest that in recent flood years, the increment of average summer discharge between upstream and downstream stations becomes greater. This could be related to factors such as deforestation and urbanization, which may cause reduced evapotranspiration and increased discharge [48]. A significant decrease in summer discharge is observed at all stations during 2000–2016, especially at Chiang Sean (decreased by 60.7%), while ranging between 36.2% and 55.2% at the other five stations. The construction of upstream dams is believed to be a major factor responsible for this trend. According to Lu and Chua [49], the dams have significantly reduced the amount of water during the wet season, resulting in a 35% reduction observed at the Chiang Saen station compared to pre-dam records. This effect seems to decrease from the upstream region to the downstream region, as Li et al. [11] also reported in their findings. It is likely that both human activities (predominantly hydropower dams) and climate change are working simultaneously to decrease summer discharge in the MRB [50].
Figure 4 illustrates the results of the M-K mutation test for summer discharge at six hydrological stations in the MRB. The maximum amount of available data is used here and in subsequent studies. The M-K mutation test reveals that the mutation years for the summer discharge series are in the 1980s and around 2010 for Chiang Sean and Vientiane (Figure 4a,c). In contrast, the mutation points at Mukdahan are in the late 1950s and around 2000, which is the same for Pakse and Kratie (Figure 4d–f). It is worth noting that the mutation point for Luang Prabang did not appear until 2015 (Figure 4b). The intersection points mostly fall within the critical boundary (Z value between ±1.96), except for the mutations in the 1980s at Chiang Sean (Figure 4a). Therefore, the mutation results of Chiang Sean and Luang Prabang are also quite similar. Prior to the 1990s, mutations of the summer discharge in the Mekong River were mainly induced by climate changes and other human activities such as irrigation and deforestation [50]. However, mega-dams have been operational in the Mekong since the 1990s, with Xiaowan and Nuozhadu being the two largest dams in the upstream Mekong and starting operation in 2010 and 2014, respectively [11]. This coincides with mutation years around 2010 at Chiang Sean and Vientiane and in 2015 at Luang Prabang, suggesting that stations closer to the dams may experience more drastic declines in summer discharge compared to farther stations. Moreover, at Chiang Sean and Vientiane, the declining trend after 2010 is found to be the only significant decline in the study period (beyond the lower boundaries of 0.05 significant level), indicating that dam construction largely contributes to the decrease in streamflow. Li et al. [11] also found that human activities contribute to approximately 62% of the total streamflow decrease from 2010 to 2015.
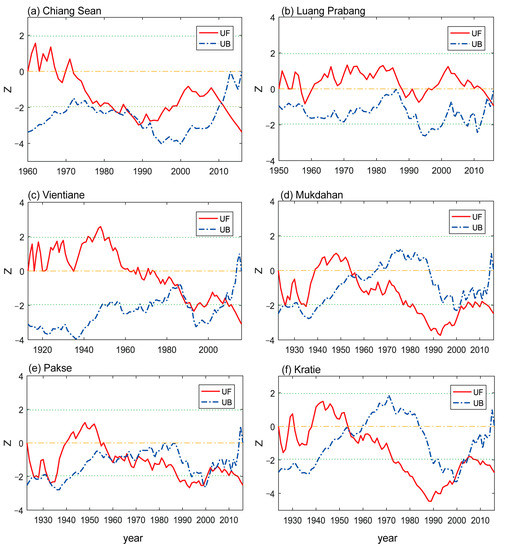
Figure 4.
Mann-Kendall (M-K) mutation test of summer discharge at (a) Chiang Sean, (b) Luang Prabang, (c) Vientiane, (d) Mukdahan, (e) Pakse, and (f) Kratie. The green dotted lines (±1.96) and the yellow dash-dotted lines mark significance levels of 0.05 and Z = 0, respectively.
The ITA method was also applied to analyze interannual summer discharge trends in the MRB during the study periods (Figure 5). There are generally decreasing trends of interannual summer discharge at six stations in the MRB, with the highest decreasing rate in Kratie at −104.3 m3/s·year and the lowest decreasing rate in Luang Prabang at −17.8 m3/s·year. The remaining gauges also show a significant decreasing trend: Chiang Sean (−25.3 m3/s·year); Vientiane (−14.4 m3/s·year); Mukdahan (−28.6 m3/s·year); Pakse (−27 m3/s·year).
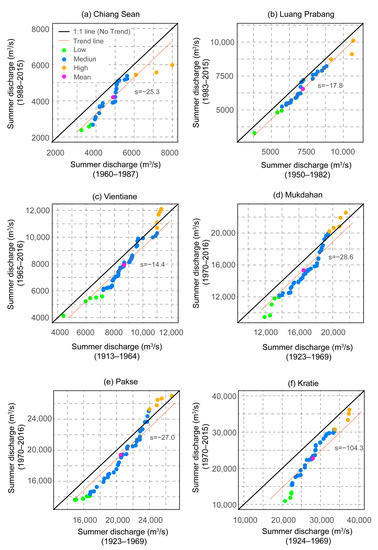
Figure 5.
Results of the ITA on summer discharge for (a) Chiang Sean, (b) Luang Prabang, (c) Vientiane, (d) Mukdahan, (e) Pakse, and (f) Kratie.
Furthermore, as shown in Figure 5, the low and medium clusters at six stations always indicate decreasing trends and occupy the majority of the duration of summer discharge, whereas the high clusters (>90th percentile) demonstrate varying trends at different stations. Vientiane, Mukdahan, and Pakse have increasing high values after 1970 compared to before 1970, indicating a higher flood risk in these areas during 1970–2016. However, Chiang Sean (or Luang Prabang) has a shorter study period, and high discharge shows a significant decreasing trend in 1988–2015 (or 1983–2015) compared to 1960–1987 (or 1950–1982), implying an overall decline in discharge at various scales in recent years. Lower high flows can help reduce the occurrence of floods and protect the ecological environment.
Overall, the trend analysis methods used in this study provide more accurate information on the summer discharge trends in the MRB from different perspectives [26,27]. The M-K test detects significant decreasing trends across all stations except for Luang Prabang (which is not significant), and Sen’s slope provides a slope range of −61.11–−20.74 m3/s·year (Figure 3). These two methods are typically used to detect monotonic trends. The results of the M-K mutation test provide data trends during specific times throughout the study period, such as the declining trend after 2010 at Chiang Sean and Vientiane (Figure 4a, c). The ITA method, however, detects trends for low, medium, and high values. Through this method, Vientiane, Mukdahan, and Pakse are found to be at a higher flood risk during 1970–2016.
4.2. Oscillations of Summer Discharge and SAMI1/SAMI2
Figure 6 illustrates the continuous wavelet transformation spectrum of summer discharge at six hydrological stations in the MRB and two monsoons (SAMI1 and SAMI2). The results reveal that there is only one interannual oscillation at 1–6 years around the 1970s at Chiang Sean. Interannual oscillations of summer discharge were observed at Luang Prabang and Vientiane for periods of 1–6 years around 1970, the 1990s, and the 2000s. Mukdahan, Pakse, and Kratie exhibit similar CWT spectra with several interannual oscillations at 1–8 years during 1970–2016 (Figure 6d–f). Additionally, a ~30-year oscillation period of summer discharge is observed at Chiang Sean and Vientiane during the periods of 1950–2016 with a confidence level of 95%, but outside the cone of influence.
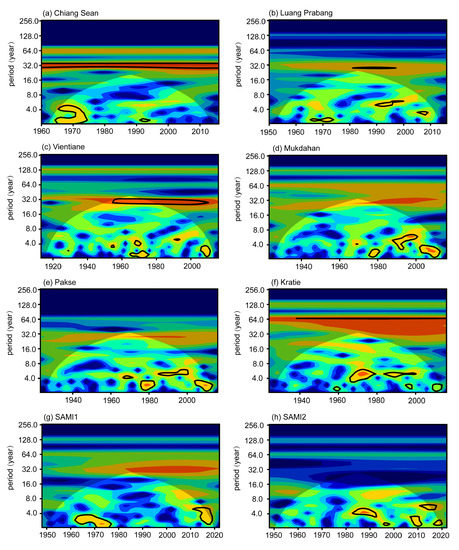
Figure 6.
Continuous wavelet transform (CWT) of summer discharge at Chiang Sean (a), Luang Prabang (b), Vientiane (c), Mukdahan (d), Pakse (e), and Kratie (f), and two monsoons include SAMI1 (g) and SAMI2 (h). Warmer colors indicate greater wavelet coefficients and colder colors to smaller wavelet coefficients. Black contour lines enclose areas where the statistical significance is greater than 95%.
The oscillations of the summer monsoon subsystems are also generally high-frequency and discontinuous. For SAMI1, there are two 1–4-year oscillations around 1970 and 2010s, while a period of ~30 years falls outside the confidence interval (Figure 6g). SAMI2 exhibits several 1–6-year periods, sparsely distributed during 1980–2020 (Figure 6h).
There are common features in the wavelet power of SAMI1/SAMI2 and summer discharge in the MRB, particularly at Mukdahan, Pakse, and Kratie stations. Although both summer discharge and monsoon series display high power in the 1–6-year band from 1960–2016, it is hard to ensure whether there is a similar periodic variation between the two series. As a result, XWT was utilized for further exploration.
4.3. Time–Frequency Analysis of summer Discharge and SAMI1/SAMI2
The XWT analysis of summer discharge in the MRB and the SAMI1 (Figure 7) shows common power areas in the interannual oscillations at the scale of 1–4 years around 1970 and 2010. The direction of the arrows varies in different periods: pointing up in the 1960s (SAMI1 leads ahead of summer discharge by about 1/4 periods), turning right in the 1970s (SAMI1 synchronized with summer discharge), and turning down around 2010 (SAMI1 leads ahead of summer discharge by about 3/4 periods). These findings are statistically significant at the 95% confidence level. The direction of these arrows is consistent at the six stations, with larger common areas during 1960–1980 and smaller around the 2010s upstream compared to downstream stations. Vientiane and Pakse also reveal common cross wavelet power during 1990–2016, although out of the confidence interval.
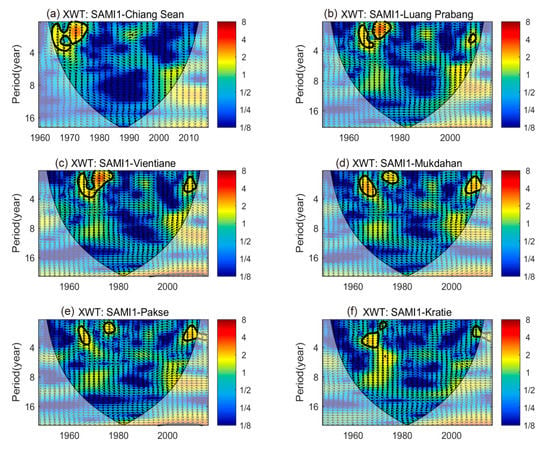
Figure 7.
Cross wavelet spectrum (XWT) between SAMI1 and summer discharge at Chiang Sean (a), Luang Prabang (b), Vientiane (c), Mukdahan (d), Pakse (e), and Kratie (f) stations. The red/blue region in the XWT pattern denotes the common high-/low-energy zones of two signals with strong/weak similarities at different timescales. The time–frequency domain arrow directions denote phase relationships between two signals.
The XWT for summer discharge in the MRB and the SAMI2 (Figure 8) reveals two apparent oscillations during 1980–2016 for most studied stations. Interannual oscillations at the ~4-year scale exist at all stations around 1990, with arrows pointing right (in phase). For downstream stations after Chiang Sean, another period at the ~2–4-year scale around 2010 has arrows pointing up (Figure 8b–f), indicating that SAMI2 occurs about 0.5–1 year earlier than summer discharge. The XWT common area shows a weaker relationship between SAMI2 and summer discharge in Chiang Sean compared to other downstream stations.
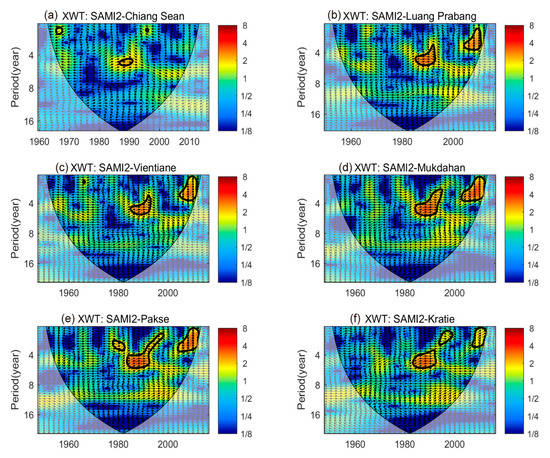
Figure 8.
XWT between SAMI2 and summer discharge at Chiang Sean (a), Luang Prabang (b), Vientiane (c), Mukdahan (d), Pakse (e), and Kratie (f) stations.
4.4. Correlation between Summer Discharge and SAMI1/SAMI2
The WTC of SAMI1 and summer discharge in the MRB is shown in Figure 9. High coherences can be found at different timescales in the MRB during the 1970s, 1985–1995, and 2000s, with confidence levels at 95%. However, the phase relations vary in different periods. The WTC of summer discharge and SAMI1 has significant regions with arrows pointing right at the timescales of 2–6 years during 1985–1995, indicating a positive correlation. The arrows also point right at a 0–2-year timescale during the 1970s, and point down at a 0–4-year timescale during the 2000s.
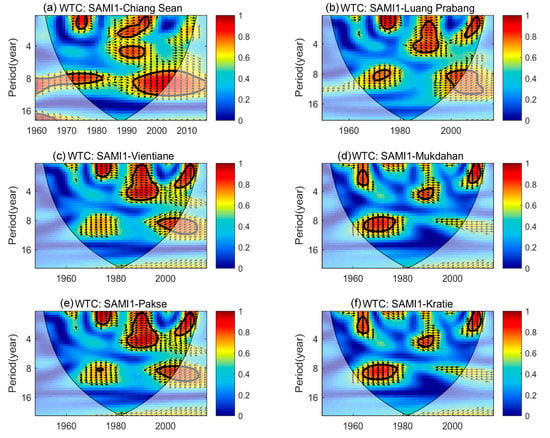
Figure 9.
Wavelet coherence spectrum (WTC) between SAMI1 and discharge at Chiang Sean (a), Luang Prabang (b), Vientiane (c), Mukdahan (d), Pakse (e), and Kratie (f) stations. The red/blue region in the WTC pattern indicates high/low coherence between the two signals.
Figure 9 shows that there is a stronger correlation between SAMI1 and summer discharge at Chiang Sean compared to other stations, as there is a larger area of significant coherence. SAMI1 leads the summer discharge at Chiang Sean by ~3/4 periods at an ~8-year scale throughout the study period except for the 1980s (Figure 9a). This suggests that SAMI1 may predict the summer discharge at Chiang Sean up to 6 years in advance. Although the SAMI1 domain is far from the study region, it can still influence the MRB and the summer discharge at Chiang Sean. This finding is similar to previous studies that have shown a correlation between monsoon systems, such as ISM and precipitation in northern Thailand (where Chiang Sean is located), but a weak correlation with floods in the lower MRB [13,14,17]. The overlapping sphere of influence of both ISM and SAMI1 may explain the similarity of results.
Figure 10 shows that the WTC of SAMI2 and summer discharge shows similar patterns and strong coherence at five stations downstream of Chiang Sean. The high-frequency coherence occurs discontinuously during 1950–2016 at timescales of 2–6 years with a confidence level of 95%, but the arrow directions vary in different periods. During 1950–1970, the WTC spectrum shows anti-phase arrows at Luang Prabang, Vientiane, and Pakse, suggesting that variations in SAMI2 occurred 1/2 period (about 1–3 years) before the summer discharge oscillation (Figure 10b,c,e). During 1980–2000, the in-phase arrows at Mukdahan and Kratie indicate positive relations between SAMI2 and summer discharge (Figure 10d,f). In the 2000s, the WTC presents a π/2 phase at 2–4-year scales at all five downstream stations, indicating that the summer discharge lags 0.5–1 year behind variations in SAMI2 (Figure 10b–f).
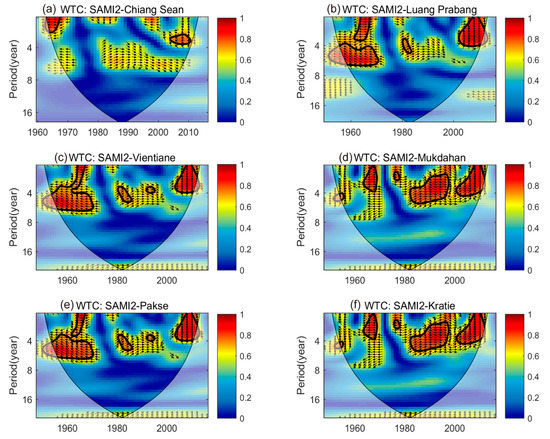
Figure 10.
WTC between SAMI2 and summer discharge at Chiang Sean (a), Luang Prabang (b), Vientiane (c), Mukdahan (d), Pakse (e), and Kratie (f) stations.
The WTC pattern reveals that SAMI2 has different degrees of influence on summer discharge in the MRB at different times. During 1950–1970, the significant coherent area of SAMI2 and summer discharge at Luang Prabang, Vientiane, and Pakse is larger than that at Mukdahan and Kratie, but it becomes smaller during 1980–2000. In the 2000s, all five stations show roughly the same significant coherent area. Over the past 40 years, SAMI2 appears to have had a greater impact on the summer discharge at Mukdahan and Kratie stations. In addition to SAMI2, there is a close connection between WNPM/East Asia Summer Monsoon (EASM) and floods/precipitation at Kratie and other stations in the southern MRB [14,17]. The intensity of PDO also has a relationship with WNPM in the subdecadal variance, leading to flood hazards at Kratie [14]. Just like the similarity of WTC results between SAMI1-summer discharge and ISM-floods, the influence of SAMI2 on the summer discharge in the MRB is also similar to that of WNPM/EASM. Although SAMI2 is less predictable for lower Mekong discharge than WNPM, which has a significant coherence at an 8–12-year scale during 1950–2000, it shows better coherence at high-frequency regions at 1–8-year scale especially at Mukdahan and Kratie during 1980–2016 [14]. Therefore, combining WTCs results of WNPM-discharge and SAMI2-discharge can better predict future flow conditions in the lower Mekong.
Based on the above results, SAMI1 and SAMI2 have significant coherence with summer discharge in the MRB mainly at high-frequency regions (at timescales of 2–6 or ~8 years) throughout the study periods. SAMI1 is significantly correlated with summer discharge at Chiang Sean, especially in the ~8-year periods, while its correlation with summer discharge in other stations is weaker. In comparison, SAMI2 has little coherence with summer discharge at Chiang Sean but is significantly correlated with summer discharge at the other five stations, particularly at Mukdahan and Kratie in recent decades. Thus, SAMI1 can be viewed as a climate predictor (~6 years earlier) for analyzing summer discharge at Chiang Sean, whereas SAMI2 has nearly no effect on Chiang Sean but is correlated with summer discharge at 1–8-year scale at other five stations, especially at Mukdahan and Kratie during 1980–2016. These findings imply a geospatial division between Chiang Sean and Luang Prabang, suggesting that summer discharge in the MRB can be well correlated with SAMI1/SAMI2 at 1–8-year timescales in different regions.
The supplied correlations we have discovered are insufficient to build a regression model for average summer discharge in the MRB. Dam construction since the 1990s has had a significant impact on downstream streamflow conditions, as discussed in Section 4.1. It may not only alter summer discharge in upstream stations such as Chiang Sean but also affect flood regimes in downstream stations such as Kratie [14,51]. As more mega-dams are built in the future, accurately predicting summer discharge in this region will require further research into the effects of these drivers on the Mekong flow regime.
Moreover, we selected the MRB as our study region because the Mekong River is the largest in Southeast Asia and is situated within the sphere of several crucial monsoons, including EASM, ISM, and SASM. Flood-related issues are particularly significant in this region. The trend and correlation analysis methods used in our study could potentially be applied in other regions with suitable modifications to account for specific regional conditions. However, it should be noted that the chosen driving factors can significantly impact the results of the correlation analysis.
5. Conclusions
Based on the dataset of at least 1960–2016, this study analyzed the variations of the summer discharge at six hydrological stations in the MRB and their correlations with SAMI1/SAMI2. The conclusions are as follows:
- Both the results from the M-K test, Sen’s slope estimator, and ITA method confirmed a negative trend of summer discharge at the six stations during the study periods. Specifically, Vientiane, Mukdahan, and Pakse experienced a higher risk of flooding due to increased levels of discharge after 1970.
- The M-K mutation test identified mutation years in the 1980s and around 2010 for Chiang Sean and Vientiane, while Mukdahan, Pakse, and Kratie had mutation points in the late 1950s and around 2000. Notably, Luang Prabang’s mutation point did not appear until 2015. The mutation years in the 2010s at Chiang Sean, Luang Prabang, and Vientiane resulted from the large dams, Xiaowan and Nuozhadu, which were built in 2010 and 2014, respectively.
- The CWT analysis reveals several intermittent oscillations at the 1–6-year timescale in summer discharge at the six stations, SAMI1 and SAMI2 during 1970–2016. Through the XWT analysis, significant relationships between SAMI1/SAMI2 and summer discharge are found to exist primarily in the high-frequency region. The XWT of SAMI1-summer discharge exhibits two distinct oscillations at a timescale of 1–4 years during 1960–1980 and around the 2010s, while the XWT of SAMI2-summer discharge shows two distinct oscillations at the timescales of ~4 years around 1990 and 2–4 years around 2010.
- The significant coherence between the summer discharge in the MRB and SAMI1/SAMI2 mainly occurs at high-frequency regions with timescales of 2–6 or ~8 years exhibiting various phases. SAMI1 can be used to predict summer discharge at Chiang Sean with a lag time of ~6 years. In contrast, SAMI2 has a better correlation with the summer discharge at a 1–8-year scale, especially at Mukdahan and Kratie during 1980–2016.
These findings provide a deeper insight into the trend analysis of summer discharge using different methods and expand our knowledge of the connections between monsoons and discharge in the Mekong. The results can aid managers in predicting the risks associated with summer discharge. Further research is to take recent dam constructions into consideration and investigate the effects of the drivers on the Mekong flow regime, thus establishing a regression model for average summer discharge. Similar research can be applied to other regions too.
The study suffers from some limitations. For instance, except for the two monsoons we selected, this study did not consider other factors contributing to the variations in summer discharge such as climate change, reservoir operation, and water/soil conservation. Additionally, limited data availability and different data length of the six stations pose challenges in comparing results and exploring the linkages between monsoons and variability in summer discharge. These limitations can be addressed as more hydrological station data are collected in the future.
Author Contributions
A.G.: Conceptualization, Investigation, Validation, Visualization, Writing—original draft, Writing—review and editing. L.H.: Supervision, Funding acquisition, Writing—review and editing. All authors have read and agreed to the published version of the manuscript.
Funding
This research was funded by the National Natural Science Foundation of China (Grant No. 51979264).
Institutional Review Board Statement
Not applicable.
Informed Consent Statement
Not applicable.
Data Availability Statement
The data presented in this study are openly available at https://portal.mrcmekong.org/time-series/discharge, accessed on 12 April 2023 and http://lijianping.cn/dct/page/1, accessed on 12 April 2023.
Acknowledgments
The authors would like to express their gratitude to the editors and anonymous reviewers for their excellent suggestions, which strengthened this work.
Conflicts of Interest
The authors declare no conflict of interest.
References
- Fan, H.; He, D.; Wang, H. Environmental consequences of damming the mainstream Lancang-Mekong River: A review. Earth-Sci. Rev. 2015, 146, 77–91. [Google Scholar] [CrossRef]
- Guo, L.; Su, N.; Zhu, C.; He, Q. How have the river discharges and sediment loads changed in the Changjiang River basin downstream of the Three Gorges Dam? J. Hydrol. 2018, 560, 259–274. [Google Scholar] [CrossRef]
- Poff, N.L.; Allan, J.D.; Bain, M.B.; Karr, J.R.; Prestegaard, K.L.; Richter, B.D.; Stromberg, J.C. The natural flow regime. Bioscience 1997, 47, 769–784. [Google Scholar] [CrossRef]
- Hirsch, R.M.; Archfield, S.A. Not higher but more often. Nat. Clim. Change 2015, 5, 198–199. [Google Scholar] [CrossRef]
- Hirabayashi, Y.; Mahendran, R.; Koirala, S.; Konoshima, L.; Yamazaki, D.; Watanabe, S.; Kim, H.; Kanae, S. Global flood risk under climate change. Nat. Clim. Change 2013, 3, 816–821. [Google Scholar] [CrossRef]
- Hoang, L.P.; Lauri, H.; Kummu, M.; Koponen, J.; van Vliet, M.T.H.; Supit, I.; Leemans, R.; Kabat, P.; Ludwig, F. Mekong River flow and hydrological extremes under climate change. Hydrol. Earth Syst. Sci. 2016, 20, 3027–3041. [Google Scholar] [CrossRef]
- Rasanen, T.A.; Someth, P.; Lauri, H.; Koponen, J.; Sarkkula, J.; Kummu, M. Observed river discharge changes due to hydropower operations in the Upper Mekong Basin. J. Hydrol. 2017, 545, 28–41. [Google Scholar] [CrossRef]
- Cai, J.; Varis, O.; Yin, H. China’s water resources vulnerability: A spatio-temporal analysis during 2003–2013. J. Clean. Prod. 2017, 142, 2901–2910. [Google Scholar] [CrossRef]
- Li, R.; Huang, H.; Yu, G.; Yu, H.; Bridhikitti, A.; Su, T. Trends of Runoff Variation and Effects of Main Causal Factors in Mun River, Thailand During 1980–2018. Water 2020, 12, 831. [Google Scholar] [CrossRef]
- Hu, P.; Zhang, Q.; Shi, P.; Chen, B.; Fang, J. Flood-induced mortality across the globe: Spatiotemporal pattern and influencing factors. Sci. Total Environ. 2018, 643, 171–182. [Google Scholar] [CrossRef]
- Li, D.; Long, D.; Zhao, J.; Lu, H.; Hong, Y. Observed changes in flow regimes in the Mekong River basin. J. Hydrol. 2017, 551, 217–232. [Google Scholar] [CrossRef]
- Wang, W.; Lu, H.; Ruby Leung, L.; Li, H.-Y.; Zhao, J.; Tian, F.; Yang, K.; Sothea, K. Dam Construction in Lancang-Mekong River Basin Could Mitigate Future Flood Risk From Warming-Induced Intensified Rainfall. Geophys. Res. Lett. 2017, 44, 10–378. [Google Scholar] [CrossRef]
- Wang, J.; Tang, Q.; Chen, A.; Tang, Y.; Xu, X.; Yun, X.; Mu, M.; Wright, N.; Chen, D. Impacts of Summer Monsoons on flood characteristics in the Lancang-Mekong River Basin. J. Hydrol. 2022, 604, 127256. [Google Scholar] [CrossRef]
- Delgado, J.M.; Merz, B.; Apel, H. A climate-flood link for the lower Mekong River. Hydrol. Earth Syst. Sci. 2012, 16, 1533–1541. [Google Scholar] [CrossRef]
- Kingston, D.G.; Thompson, J.R.; Kite, G. Uncertainty in climate change projections of discharge for the Mekong River Basin, Hydrol. Earth Syst. Sci. 2011, 15, 1459–1471. [Google Scholar] [CrossRef]
- Van Vliet, M.T.H.; Franssen, W.H.P.; Yearsley, J.R.; Ludwig, F.; Haddeland, I.; Lettenmaier, D.P.; Kabat, P. Global river discharge and water temperature under climate change. Global Environ. Chang. 2013, 23, 450–464. [Google Scholar] [CrossRef]
- Yang, R.; Zhang, W.-K.; Gui, S.; Tao, Y.; Cao, J. Rainy season precipitation variation in the Mekong River basin and its relationship to the Indian and East Asian summer monsoons. Clim. Dyn. 2018, 52, 5691–5708. [Google Scholar] [CrossRef]
- Li, J.P.; Zeng, Q.C. A unified monsoon index. Geophys. Res. Lett. 2002, 29, 1274. [Google Scholar] [CrossRef]
- Li, F.X.; Zhang, S.Y.; Chen, D.; He, L.; Gu, L.L. Inter-Decadal Variability of the East Asian Summer Monsoon and Its Impact on Hydrologic Variables in the Haihe River Basin, China. J. Resour. Ecol. 2017, 8, 174–184. [Google Scholar] [CrossRef]
- Mann, H.B. Nonparametric tests against trend. Econom. J. Econom. Soc. 1945, 13, 245–259. [Google Scholar] [CrossRef]
- Kendall, M.G. Rank Correlation Methods; Griffin: London, UK, 1948. [Google Scholar]
- Sen, P.K. Estimates of the Regression Coefficient Based on Kendall’s Tau. J. Am. Stat. Assoc. 1968, 63, 1379–1389. [Google Scholar] [CrossRef]
- Çeliker, M.; Yükseler, U.; Dursun, Ö.F. Trend analyses for discharge-recharge of Tacin karstic spring (Kayseri, Turkey). J. Afr. Earth. Sci. 2021, 184, 104344. [Google Scholar] [CrossRef]
- Tayyab, M.; Zhou, J.; Zeng, X.; Ahmed, I.; Adnan, R. Application of Statistical nonparametric tests in Dongting Lake, China: 1961–2012. In Proceedings of the 2016 IEEE International Conference on Knowledge Engineering and Applications (ICKEA), Singapore, 28–30 September 2016; pp. 197–201. [Google Scholar]
- Şen, Z. Innovative Trend Analysis Methodology. J. Hydrol. Eng. 2012, 17, 1042–1046. [Google Scholar] [CrossRef]
- Nguyen, H.M.; Ouillon, S.; Vu, V.D. Sea Level Variation and Trend Analysis by Comparing Mann-Kendall Test and Innovative Trend Analysis in Front of the Red River Delta, Vietnam (1961–2020). Water 2022, 14, 1709. [Google Scholar] [CrossRef]
- Agbo, E.P.; Nkajoe, U.; Edet, C.O. Comparison of Mann-Kendall and Şen’s innovative trend method for climatic parameters over Nigeria’s climatic zones. Clim. Dyn. 2022. [Google Scholar] [CrossRef]
- Abebe, S.A.; Qin, T.; Zhang, X.; Yan, D. Wavelet transform-based trend analysis of streamflow and precipitation in Upper Blue Nile River basin. J. Hydrol. Reg. Stud. 2022, 44, 101251. [Google Scholar] [CrossRef]
- Tayyab, M.; Zhou, J.; Adnan, R.; Zeng, X. Application of Artificial Intelligence Method Coupled with Discrete Wavelet Transform Method. Procedia Comput. Sci. 2017, 107, 212–217. [Google Scholar] [CrossRef]
- Ikram, R.M.A.; Hazarika, B.B.; Gupta, D.; Heddam, S.; Kisi, O. Streamflow prediction in mountainous region using new machine learning and data preprocessing methods: A case study. Neural Comput. Appl. 2022, 35, 9053–9070. [Google Scholar] [CrossRef]
- Su, L.; Miao, C.; Duan, Q.; Lei, X.; Li, H. Multiple-Wavelet Coherence of World’s Large Rivers with Meteorological Factors and Ocean Signals. J. Geophys. Res. Atmos. 2019, 124, 4932–4954. [Google Scholar] [CrossRef]
- Tamaddun, K.A.; Kalra, A.; Ahmad, S. Wavelet analyses of western US streamflow with ENSO and PDO. J. Water Clim. Chang. 2017, 8, 26–39. [Google Scholar] [CrossRef]
- Labat, D. Wavelet analysis of the annual discharge records of the world’s largest rivers. Adv. Water Resour. 2008, 31, 109–117. [Google Scholar] [CrossRef]
- Al-Ghorani, N.G.; Hassan, M.A.; Langendoen, E.J. Spatiotemporal Patterns of Fractional Suspended Sediment Dynamics in Small Watersheds. Water Resour. Res. 2021, 57, e2021WR030851. [Google Scholar] [CrossRef]
- Tian, Q.; Xu, K.H.; Dong, C.M.; Yang, S.L.; He, Y.J.; Shi, B.W. Declining Sediment Discharge in the Yangtze River From 1956 to 2017: Spatial and Temporal Changes and Their Causes. Water Resour. Res. 2021, 57, e2020WR028645. [Google Scholar] [CrossRef]
- Guo, C.; Jin, Z.; Guo, L.; Lu, J.; Ren, S.; Zhou, Y. On the cumulative dam impact in the upper Changjiang River: Streamflow and sediment load changes. Catena 2020, 184, 104250. [Google Scholar] [CrossRef]
- Zhao, Y.; Zou, X.; Liu, Q.; Yao, Y.; Li, Y.; Wu, X.; Wang, C.; Yu, W.; Wang, T. Assessing natural and anthropogenic influences on water discharge and sediment load in the Yangtze River, China. Sci. Total Environ. 2017, 607–608, 920–932. [Google Scholar] [CrossRef] [PubMed]
- Li, H.; Song, W. Characteristics of Climate Change in the Lancang-Mekong Sub-Region. Climate 2020, 8, 115. [Google Scholar] [CrossRef]
- Hao, X.; Chen, Y.; Li, W. Impact of anthropogenic activities on the hydrologic characters of the mainstream of the Tarim River in Xinjiang during the past 50 years. Environ. Geol. 2009, 57, 435–445. [Google Scholar] [CrossRef]
- Deng, H.; Tang, Q.; Yun, X.; Tang, Y.; Liu, X.; Xu, X.; Sun, S.; Zhao, G.; Zhang, Y.; Zhang, Y. Wetting trend in Northwest China reversed by warmer temperature and drier air. J. Hydrol. 2022, 613, 128435. [Google Scholar] [CrossRef]
- Theil, H. A rank-invariant method of linear and polynomial regression analysis. In Henri Theil’s Contributions to Economics and Econometrics: Econometric Theory and Methodology; Raj, B., Koerts, J., Eds.; Springer: Berlin/Heidelberg, Germany, 1992; pp. 345–381. [Google Scholar]
- Meng, Q.; Bai, H.; Sarukkalige, R.; Fu, G.; Jia, W.; Zhang, C. Annual and seasonal precipitation trends and their attributions in the Qinling Mountains, a climate transitional zone in China. Theor. Appl. Climatol. 2021, 144, 401–413. [Google Scholar] [CrossRef]
- Şen, Z. Innovative trend significance test and applications. Theor. Appl. Climatol. 2017, 127, 939–947. [Google Scholar] [CrossRef]
- Li, F.X.; He, L. The Effects of Dominant Driving Forces on Summer Precipitation during Different Periods in Beijing. Atmosphere 2017, 8, 44. [Google Scholar] [CrossRef]
- Grinsted, A.; Moore, J.C.; Jevrejeva, S. Application of the cross wavelet transform and wavelet coherence to geophysical time series. Nonlinear Process. Geophys. 2004, 11, 561–566. [Google Scholar] [CrossRef]
- Torrence, C.; Webster, P.J. Interdecadal Changes in the ENSO–Monsoon System. J. Clim. 1999, 12, 2679–2690. [Google Scholar] [CrossRef]
- Torrence, C.; Compo, G.P. A practical guide to wavelet analysis. Bull. Am. Meteorol. Soc. 1998, 79, 61–78. [Google Scholar] [CrossRef]
- Ty, T.V.; Sunada, K.; Ichikawa, Y.; Oishi, S. Scenario-based Impact Assessment of Land Use/Cover and Climate Changes on Water Resources and Demand: A Case Study in the Srepok River Basin, Vietnam—Cambodia. Water Resour. Manag. 2012, 26, 1387–1407. [Google Scholar] [CrossRef]
- Lu, X.X.; Chua, S.D.X. River Discharge and Water Level Changes in the Mekong River: Droughts in an Era of Mega-Dams. Hydrol. Process. 2021, 35, e14265. [Google Scholar] [CrossRef]
- Adamson, P.T.; Rutherfurd, I.D.; Peel, M.C.; Conlan, I.A. Chapter 4—The Hydrology of the Mekong River. In The Mekong; Campbell, I.C., Ed.; Academic Press: Cambridge, MA, USA, 2009; pp. 53–76. [Google Scholar]
- Lu, X.X.; Siew, R.Y. Water discharge and sediment flux changes over the past decades in the Lower Mekong River: Possible impacts of the Chinese dams. Hydrol. Earth Syst. Sci. 2006, 10, 181–195. [Google Scholar] [CrossRef]
Disclaimer/Publisher’s Note: The statements, opinions and data contained in all publications are solely those of the individual author(s) and contributor(s) and not of MDPI and/or the editor(s). MDPI and/or the editor(s) disclaim responsibility for any injury to people or property resulting from any ideas, methods, instructions or products referred to in the content. |
© 2023 by the authors. Licensee MDPI, Basel, Switzerland. This article is an open access article distributed under the terms and conditions of the Creative Commons Attribution (CC BY) license (https://creativecommons.org/licenses/by/4.0/).