Article

ERA5 Reanalysis of Environments Conducive to Lightning-Ignited Wildfires in Catalonia

by
Nicolau Pineda
1,2,* and
Oriol Rodríguez
3
1
Meteorological Service of Catalonia, Carrer Berlín 38-46, 08029 Barcelona, Spain
2
Lightning Research Group, Technical University of Catalonia, TR1, Carrer Colom 1, 08222 Terrassa, Spain
3
Department of Applied Physics—Meteorology, University of Barcelona, Martí i Franquès, 1, 08028 Barcelona, Spain
*
Author to whom correspondence should be addressed.
Atmosphere 2023, 14(6), 936; https://doi.org/10.3390/atmos14060936
Submission received: 2 April 2023 / Revised: 15 May 2023 / Accepted: 23 May 2023 / Published: 26 May 2023
(This article belongs to the Special Issue Atmospheric Electricity and Fire in a Changing Climate)

Abstract

:
In the climate change context, wildfires are an increasing hazard in the Mediterranean Basin, especially those triggered by lightning. Although lightning activity can be predicted with a reasonable level of confidence, the challenge remains in forecasting the thunderstorm’s probability of ignition. The present work aims to characterise the most suitable predictors to forecast lightning-ignited wildfires. Several ERA5 parameters were calculated and compared for two different samples, thunderstorm episodes that caused a wildfire (n = 961) and ordinary thunderstorms (n = 1023) that occurred in Catalonia (NE Iberian Peninsula) in the 2006–2020 period. Lightning wildfires are mostly associated with dry thunderstorms, characterised by: weak-to-moderate Mixed-Layer Convective Available Potential Energy (MLCAPE, 150–1100 J kg−1), significant Dew Point Depression at 850 hPa (DPD850, 3.3–10.1 °C), high Most-Unstable Lifted Condensation Level (MULCL, 580–1450 m) and steep 500–700 hPa Lapse Rate (LR, −7.0–−6.3 °C). Under these conditions, with relatively dry air at lower levels, thunderstorms tend to be high-based, the rain evaporating before reaching the ground and lightning occurring without significant rainfall. Specifically forecasting the probability of LIW occurrence would be of great assistance to the forest protection tactical decision-making process, preparing for “dry” thunderstorm days where multiple ignitions can be expected.

1. Introduction

Wildfires are a growing threat in Mediterranean-climate regions as the climate continues to warm. Wildfires originate from a combination of three ingredients: ignition, weather, and dry fuels. All three are being influenced by climate change, resulting in higher temperatures, extended heat warnings, and droughts, all of which result in drier fuels that lead to higher-intensity wildfires. Concerning the source of ignition, human-caused wildfires have predominated in the southern EU countries over the last centuries [1,2]. Lightning-ignited wildfires (LIW) only represent 1–10% of the forest fires in these countries [3]. Consequently, LIWs are commonly perceived as irrelevant in the area. Although most LIWs burn a few hectares, some of the largest fires recorded in Spain and Portugal have been caused by lightning, e.g., [4,5,6]. Indeed, when the ignition occurs in complex topography difficulting the initial attack, LIWs can develop into complex, largest fires [7,8]. Most LIWs occur during the Mediterranean summer, when extended dry spells, warm temperatures, and low moisture configure extreme meteorological conditions. Under such conditions, thunderstorms can cause a large number of simultaneous ignitions, overwhelming the fire-fighting ignitions capacity of the fire brigades [9].
Although thunderstorms produce thousands of lightning strikes every year, only a few cause ignitions that end in a LIW. Lightning-caused ignitions on forest fuels must overcome a complex process, in which fuel moisture and weather conditions should be conducive to both fire survival and growth [10,11,12] The “lightning efficiency” [13] for a given region is the ratio between the lightning-ignitions that turn into an active wildfire and the entire amount of lightning striking the region. This “success” ratio has been estimated around the globe by different authors and was found to be between 0.1 and 1% (see [14] and references therein). The relative timing between the lightning strike and precipitation is critical to whether lightning ignitions will survive. Most of the lightning tends to occur within the rain shaft of a thunderstorm, where heavy rainfall will extinguish any potential LIW [15,16,17].
Surviving ignitions are mostly attributed to “dry lightning”, those associated with less than 0.1 in. (2.54 mm) of rainfall [18]. Dry lightning can be found outside the rain shaft of an ordinary thunderstorm, e.g., [19,20,21]; or in fast-moving thunderstorms, where rainfall does not have sufficient time to accumulate, e.g., [18,22]. On the other hand, they can also be associated with “dry thunderstorms”, characterised by a high cloud base and low environmental moisture, conditions favouring the evaporation of precipitable water before reaching the ground [23,24,25,26].
In addition to the significance of dry lightning, classifications of the synoptic weather patterns prevailing at large scales offer the convenient potential to improve fire risk forecasts [18,27,28]. Relations between large-scale circulation patterns and wildland fire severity have been studied in Canada [29], California [18,30], Central Europe Alps [31], the Iberian Peninsula [27,32,33,34], and Greece [35] among others. Pineda et al. [28] have shown that LIWs in Catalonia are mostly associated with synoptic patterns dominated by a short-wave trough at 500 hPa, with three variants: shortwave trough with an Iberian thermal low (~1/2 of the LIW), with a Northerly flow (~1/4), and with Prefrontal convection (~1/8).
Nowadays, lightning activity can be predicted with a reasonable level of confidence because it is linked to particular weather conditions [36]. Still, the challenge remains in forecasting the thunderstorm’s probability of triggering a wildfire ignition. The evaluation of the forecast skill of thunderstorm predictors derived from Numerical Weather Prediction (NWP) reanalysis can help identify convective environments prone to LIW occurrence. Taking advantage of the latest available reanalysis from the European Centre for Medium-Range Weather Forecasts (ECMWF), the so-called ERA5 [37], the present work focus on the characterisation of convective environments favouring thunderstorms that trigger LIW in Catalonia. Indeed, being able to identify areas with an elevated probability of LIW occurrence would be of great assistance to the forest protection tactical decision-making process, preparing for “dry” thunderstorm days where multiple ignitions can be expected, i.e., routing detection flight paths to locate lightning-derived ignitions. To this end, the analysis aims to find thunderstorm predictors focused on the LIW, other than typical predictors intended to detect potential deep convection leading to severe weather or flash flooding events. Finally, the sensitivity of these predictors to holdover wildfires is investigated.

2. Materials and Methods

2.1. Subsection Study Domain

Catalonia (~32,000 km²) is in the NE of the Iberian Peninsula (Figure 1). It has a Mediterranean climate, with hot dry summers, rainy springs and falls, and cold winters [38]. Major topographic features include the Pyrenees Mountain range, which sets the northern border, while two lower mountain chains are located parallel to the coastline. The coast with the Mediterranean Sea outlines the eastern part of the region, the proximity to the sea generates milder conditions in summer and winter, in contrast to the flat inland continental areas. Such orographic features contribute to considerable contrasts in temperature and precipitation across the region, annual average temperatures range from 0 °C to 17 °C [39]. Precipitation is characterised by significant spatial and temporal variability. Annual mean rainfall varies from 400 mm in the south to 1300 mm in the north, while extreme daily values can surpass 300 mm in areas located near the coast or in the Pyrenees [40].
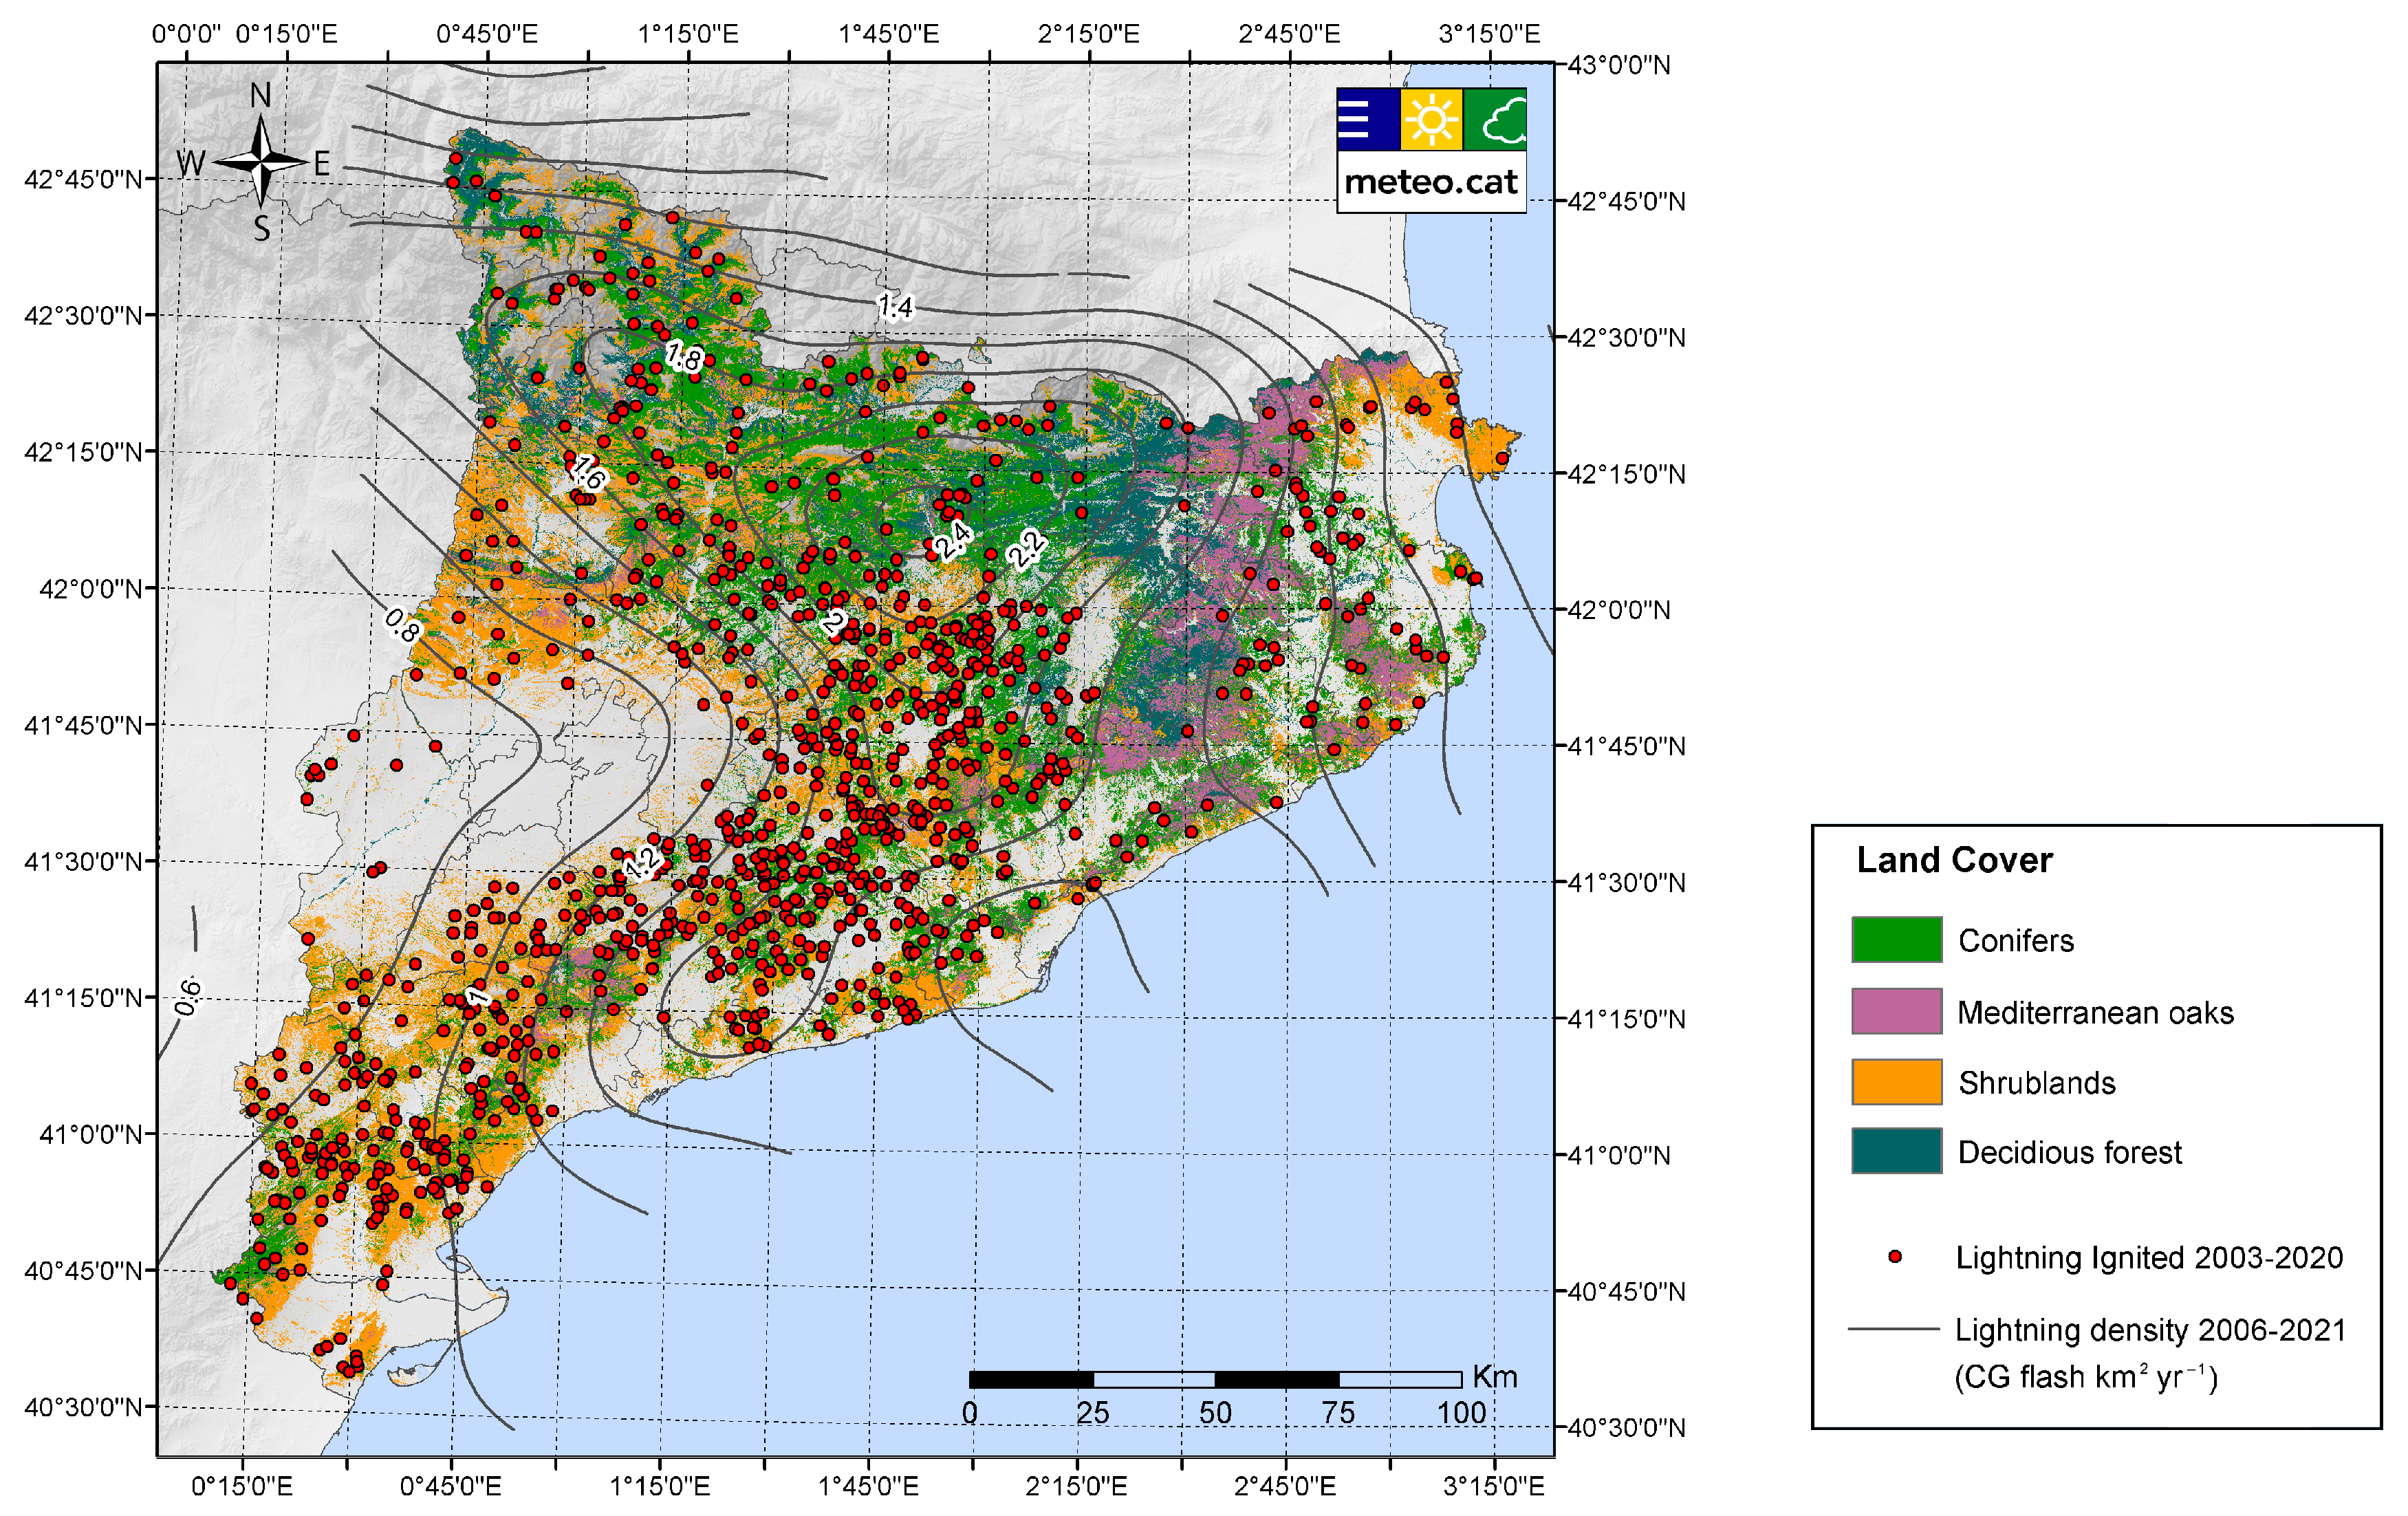
Similar to the temperature and precipitation, the spatial distribution of lightning in Catalonia is governed by the local orographic features, as well as by the distance to the Mediterranean Sea [41,42,43]. Lightning flash density in Catalonia goes from ~1 flash km−2 year−1 in coastal areas to ~2.4 flashes km−2 year−1 in the Pyrenees (Figure 1), a moderate lightning activity within Western Europe [44,45]. Thunderstorm activity gently increases during spring and peaks in summer. From mid-September, lightning activity shifts to the seashore, where it becomes dominant in autumn. This transition is forced by the evolution of the land/sea average temperature, as the sea surface is warmer compared with land from mid-September to April. The diurnal distribution of strikes indicates that lightning activity is linked with daytime-heating initiated thunderstorms, especially at the beginning of the season, with an increase of around 1400 and a maximum of 1700 (local time) followed by a slow decrease [43,46].
Figure 1. Geographical distribution of LIWs for the period 2006 to 2020 in Catalonia [47]. Land cover categories are from the Land Cover Map of Catalonia [48]. Isolines delineate 0.2 lightning density for the same period (CG flash count km−2 yr−1) intervals [49].
Atmosphere 14 00936 g001

2.2. Datasets

The study analyses the LIW that occurred in Catalonia in a period of 15 years (2006–2020), through a variety of data sources, including: (i) wildfire data from the Forest Protection Agency of Catalonia (Servei Prevenció Incendis Forestals, SPIF) database; (ii) lightning data from the Meteorological Service of Catalonia (Servei Meteorològic de Catalunya, SMC); and (iii) atmospheric data from ERA5, the fifth-generation global reanalysis of the ECMWF [37].
The SPIF manages the wildfire database of Catalonia [47]. Records showed there have been 640 wildfires per year which burn 7700 forested hectares each year, on average (1986–2022). However, a small number (<2%) of large fires (>100 ha) accounted for more than 88% of the burnt area, and a few extreme events concentrated the bulk (>65%) of the burnt area [50]. Records include information on the date, time, and coordinates of the point of ignition for each wildfire. Records also include fire causality, which is investigated in the field by the Corps of Rural Agents, using the standard method based on physical evidence and public procedure. Most wildfires in Catalonia during the analysed period (2006–2020) were associated with human activity, only ~12% were ascribed to lightning (n = 1089) [47]. Therefore, there were ~60 LIW per year, with an average size of 2.5 ha. They only account for 2% of the burned area by any kind of wildfire, although some of the LIW that occurred in this period burned hundreds of hectares (i.e., Tivissa 15 June 2014 870 ha; La Guingueta d’Àneu 29 October 2016 630 ha).
Cloud-to-ground (CG) lightning data comes from the Lightning Location System (LLS) operated by the SMC (for details see [51]).
Vertical temperature, dew point, and wind profiles were retrieved from ERA5 [37,52]. The horizontal and temporal resolution is 0.25° and 1 h, respectively. Pseudo-soundings were built up using temperature, dew point, geopotential height, and wind reanalysis data from the 37 pressure levels and surface, as performed in previous studies where convective environments were also characterised, e.g., [53,54].

2.3. Method

SMC-LLS observations were aggregated to the spatiotemporal grid of ERA5 (a 0.25° × 0.25° cell, centred in grid points from the ERA5). Thunderstorm-significant (TS) events were defined as those cells having 100 CGs or more in a 3-h fixed period. Only TS events detected inland Catalonia were selected (n = 1023). Indeed, this sample does not include thunderstorms that generated a LIW, which were selected based on the SPIF wildfire database.
LIW events are defined through the date, time, and geographic coordinates of the occurrence of the lightning that caused the fire. In the first step, a lightning individual from the SMC database must be selected as the ignition origin, among all those that took place around the fire ignition point. As in Soler et al. [21] and Pineda et al. [14], the most probable candidate (MPC) is designated through a “proximity index”, a combined probability of the temporal and spatial distance of each lightning candidate to the fire ignition point [55]. The MPC is the CG with the highest score in the proximity index [14]. In total, 973 LIWs (~90%) were matched using this procedure.
LIWs are the product of three processes: thunderstorm occurrence, fire ignition by a lightning strike, and survival of this ignition until fire spread and detection [11,12]. These processes are complex, involving several factors such as vegetation type, fuel moisture, and weather conditions conducive to lightning ignition, survival, and fire growth. Under dry and warm conditions, lightning-caused ignitions can immediately spread as an active fire. Contrarily, if the fuel moisture content is high—but less than the moisture content of extinction—the fire may survive smouldering as a “holdover fire”, for hours to several days until the environment becomes dry enough to support flaming combustion [14,56,57]. Indeed, the duration of the holdover phase can be obtained by coupling the observed wildland fire data with CG records obtained from the SMC-LLS for each LIW. Pineda et al. [14], who used the same databases, calculated the holdover duration, establishing four categories for the holdover phase: short-term (ST; <6 h), 1-day (1D; 6–30 h), 2-day (2D; 30–54 h), and multi-day (MD; >54 h). In a second phase, the 961 LIW were subdivided into these four holdover categories, with the following number of samples: 586 for short-term holdover, 292 for 1D, 66 for 2D 66, and 29 for MD holdover.
Pseudo-soundings were generated for each LIW and TS events, aiming to calculate several thermodynamic and kinematic parameters. For the LIW events, data from the closest ERA5 grid point was selected, to retrieve the vertical temperature, dew point, and wind profile. In case two or more LIWs were characterised by the same grid cell and hour data, they were treated as a single event, avoiding overrepresentation. In doing so, the original LIW sample (n = 973) was reduced to a final sample (n = 961). ERA5 grid points for TS events (n = 1023) were assigned to the latitude and longitude of the centre of the TS cell, at the initial time of the event.
A large compilation of ERA5-derived thermodynamic and kinematic parameters was calculated to characterize the LIW and the TS environments (see supplementary material Table S1 for the complete list). The literature review has shown that LIWs are spawned in high-based thunderstorm environments which are characterised by low-level dry air, mid-level steep lapse rate, and mid-tropospheric moisture [18,26,58,59,60,61]. Therefore, only a specific selection of the ERA5—parameters were analysed in more detail (Table 1). The computation was mainly conducted using the R language package “ThundeR” [62].
Rorig and Ferguson [18] developed a forecasting methodology to classify convective days as either ‘‘dry’’ or ‘‘wet’’ based on the 850–500 hPa temperature lapse and 850 hPa dewpoint depression. Wet days present classical convection conditions with moisture in the lower atmosphere. In such conditions, lightning will tend to be collocated with widespread precipitation at the ground, extinguishing most of the ignitions that “wet” lightning may trigger in the forest fuels. Contrarily, “dry” lightning days are characterised by high instability and low moisture levels in the lower atmosphere. This combination increases the likelihood that precipitation evaporates before reaching the ground, favouring “dry” lightning and therefore LIW episodes. On this basis, the National Weather Service (NWS)—Reno Weather Forecast Office developed a conceptual model to forecast dry thunderstorms. Essentially, it relies on the pressure of the dynamic tropopause, the jet streak dynamics, the equivalent potential temperature, and the upper-level lapse rates in conjunction with the HLTT [63,64].
In the present work, an explorative analysis worked out variables that showed significant differences between the LIW and the TS samples. In this regard, a Welch’s t-test [65] was calculated on the ERA5 parameters to verify if the median value is significantly different between samples (Table S3). Moreover, the corresponding p-value was calculated as well. The p-value corresponds to the level of marginal significance for the hypothesis of equal median values. If the p-value is lower than 0.05 (less than 5% probability of equal median) the hypothesis of equal medians is rejected, therefore both samples are statistically different [65]. It is worth mentioning here that different medians do not necessarily imply that the analysed variable would be a good predictor for the LIW. Similarly, the Welch corrected analysis of variance test [66] was also calculated, this time to analyse the differences between the four Holdover categories and TS.

3. Results

ERA5 thermodynamic and kinematic parameters have been analysed to find those who demonstrate some skill ability in the forecast of thundery conditions conducive to the LIW occurrence, in comparison to ordinary thunderstorm conditions. As indicated by Nauslar et al. [25], typical surface or lower tropospheric thunderstorm indices such as Totals Totals, the K Index, or the Lifted Index, may be suitable for thunderstorm prediction, but may not reveal the potential for LIW conditions. Results presented in the following focus on the selected parameters (Table 1). Results for the complete set of ERA5 thermodynamic and kinematic parameters are presented as supplementary material Table S2.

3.1. Comparison between TS and LIW

3.1.1. Convective Available Potential Energy (CAPE)

For organised, long-living local thunderstorm development, a sufficient amount of CAPE and vertical wind shear is needed, e.g., [67,68]. Figure 2 shows the CAPE calculated using the surface-based, the most unstable, and the mixed-layer parcels. The mixed-layer CAPE shows the better forecast potential to identify a LIW threat (p-value < 0.0001). Representative values for mixed-layer CAPE necessary to produce thunderstorms in Catalonia range from ~400 to 1200 J kg−1 (interquartile range, IQR) with a median of ~800 J kg−1; whereas LIWs occur with a lower mixed-layer CAPE (IQR 150–1100, median ~600 J kg−1). Although surface-based and most unstable CAPEs also present statistically significant differences between TS and LIW environments, values for those parcels are widespread (LIW 25th percentile is smaller, the median is comparable and the 75th percentile is greater than for TS).

3.1.2. High-Level Total Totals (HLTT)

Some studies [25,26] suggest that dry lightning and subsequent LIW tend to occur in thunderstorms with high-based clouds. Milne [58] developed the High-Level Total Totals Index (HLTT) from the traditional Total Totals index, to predict high-based convection. The HLTT was computed following the equation:
HLTT = T700 + Td700 − (2 × T500)
According to Milne [58], HLTT values of ≥ 28 °C represent the bottom threshold of an environment favourable for high-based convection, with more promising results above 30 °C. In our results for the HLTT (Figure 3a), IQR and median are 26.9–30.6 °C and 28.9 °C for thunderstorms and 27.9–31.5 °C and 29.6 °C for LIW-parent thunderstorms, respectively. Compared to this reference, in our case, there is a one-degree difference between both categories, LIW thunderstorms developing in less warm environments, the median temperature being close to the ideal threshold of 30 °C.

3.1.3. Dew Point Depression (at 850 hPa)

Pérez-Invernón et al. [26] associated LIW thunderstorms with a lower vertical content of moisture, compared to the climatology of Mediterranean thunderstorms. For that matter, the dew point depression at 850 hPa is a good indicator (hereafter DPD850). In the present study, the DPD850 clearly shows the skill to distinguish between TS and LIW (Figure 3b). 75% of ordinary TS cases have DPD850 below 5.5 °C while higher DPD850 was found for LIW. The median of DPD850 for LIW is approximately 6.1 °C, with the 75th percentile close to 10.1 °C.

3.1.4. Dry and Wet Days

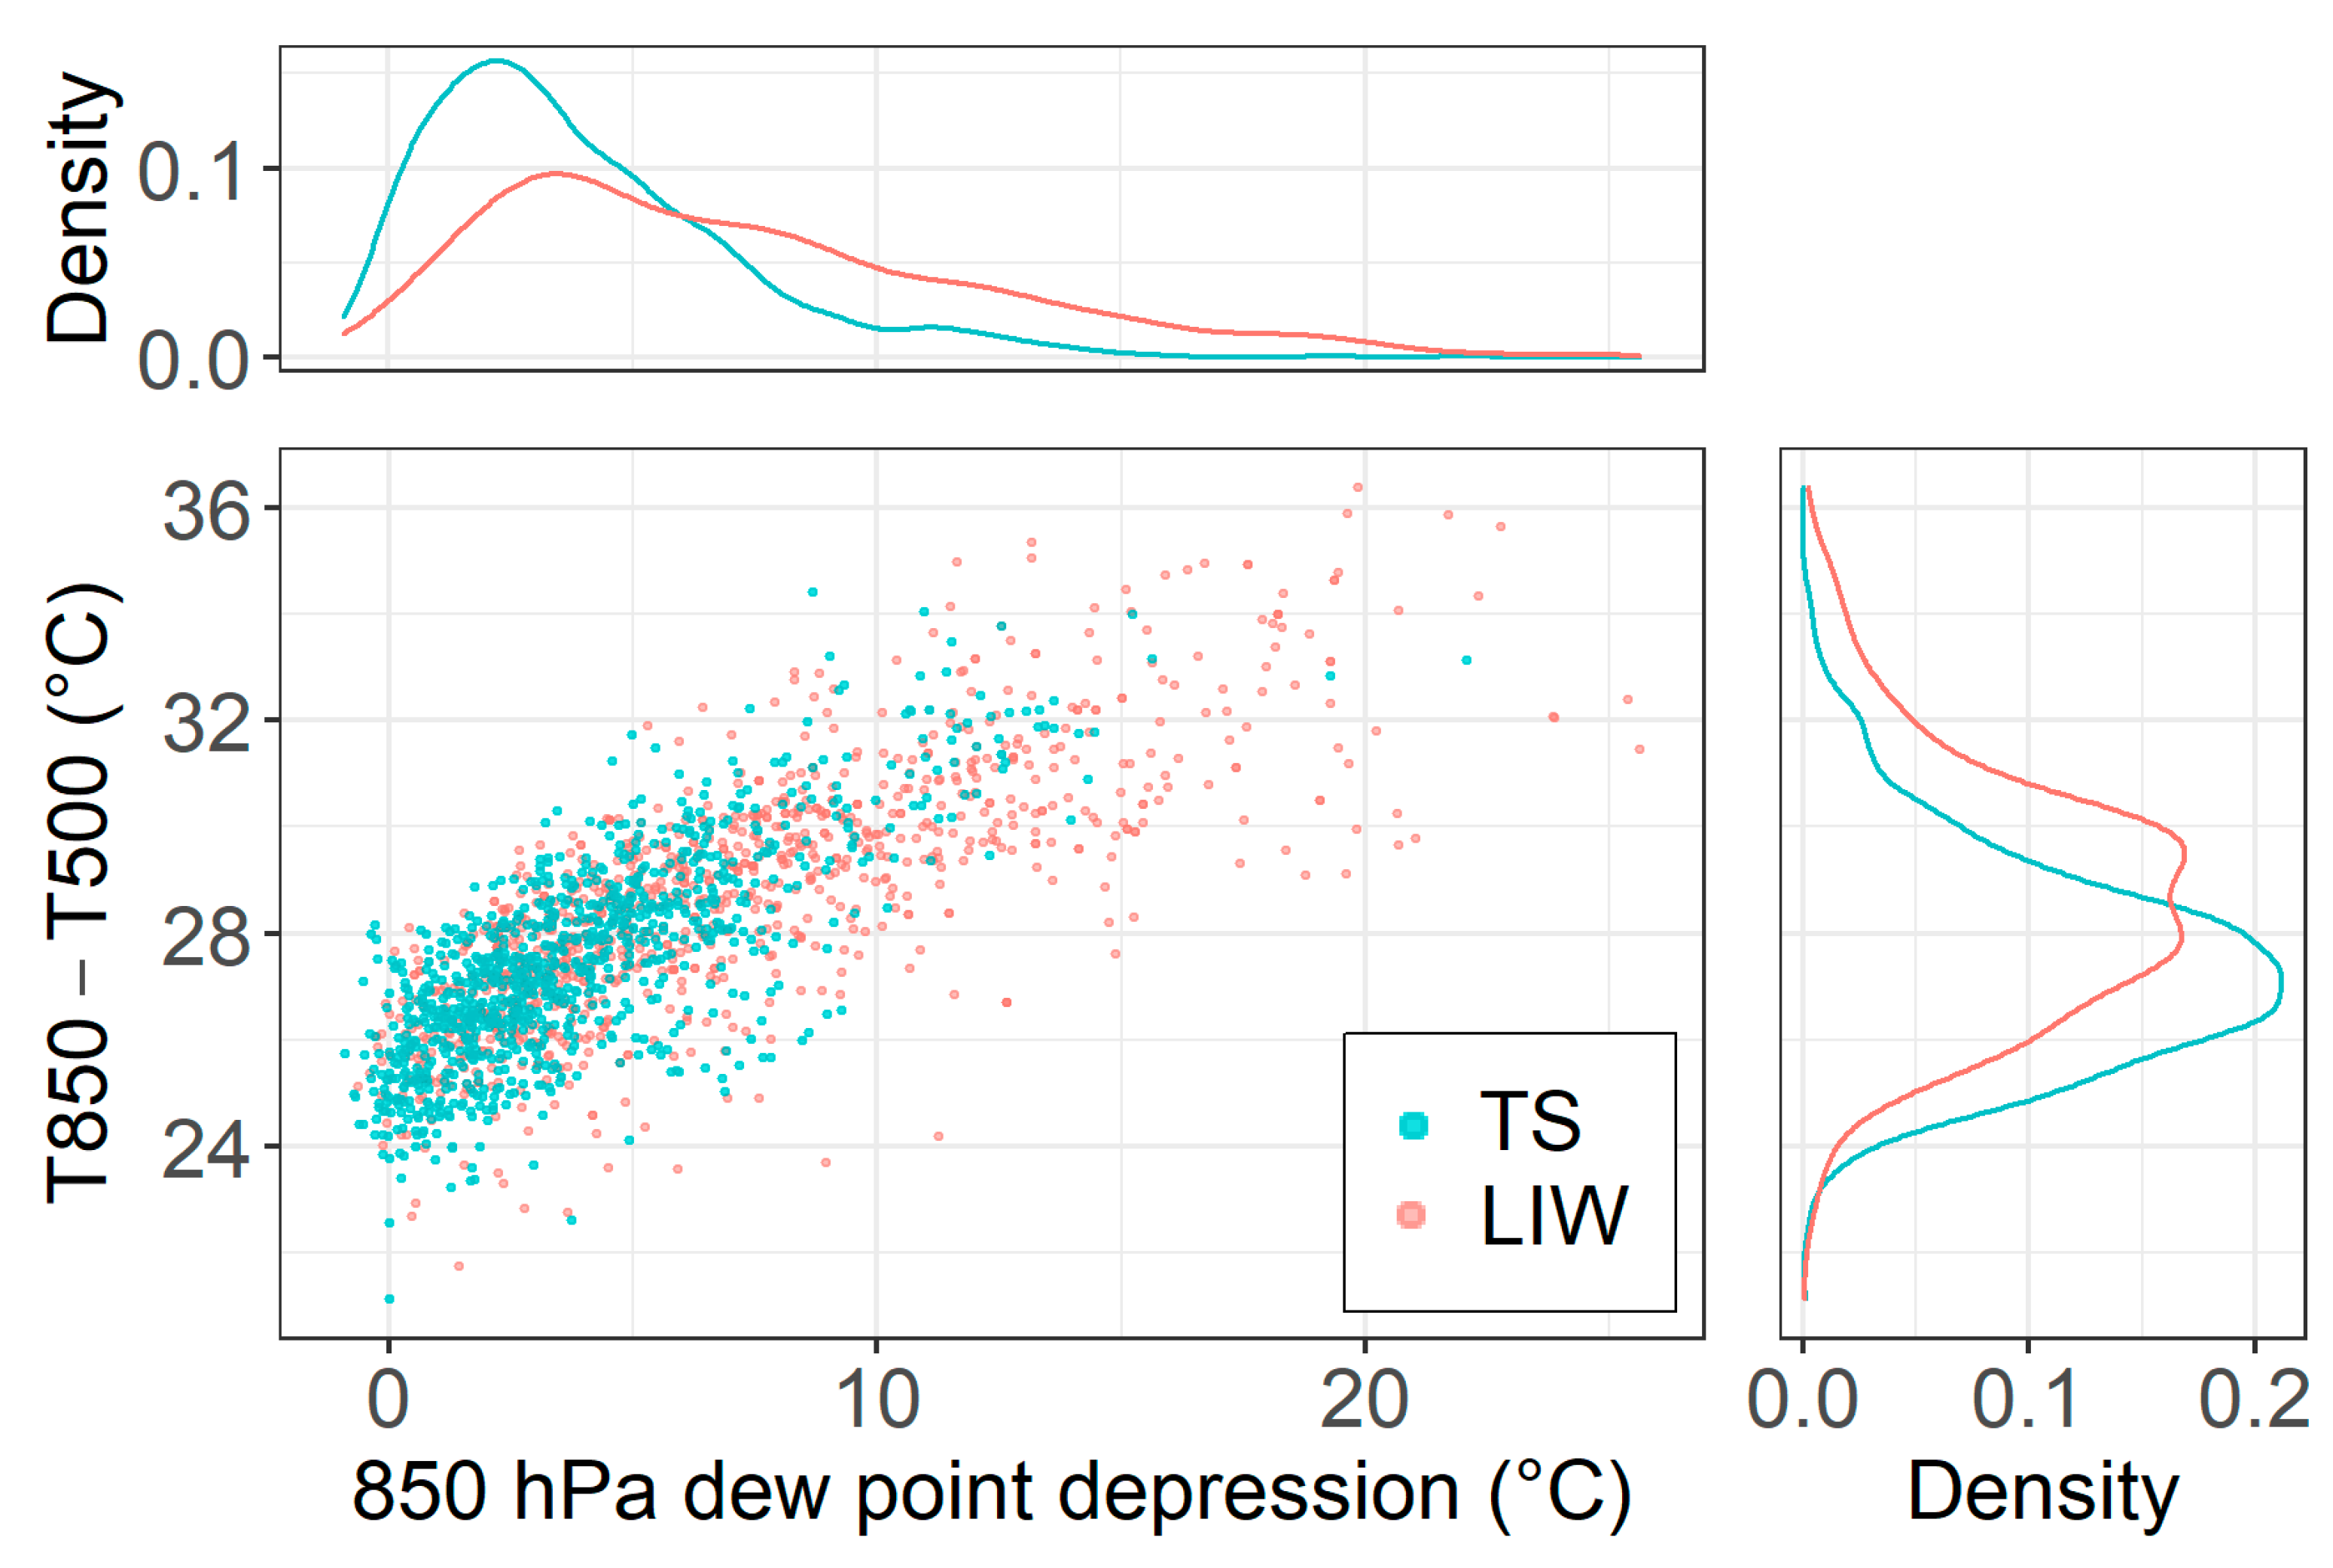
Rorig and Ferguson [18] used the DPD850, in combination with the temperature difference between 850 and 500 hPa to forecast ‘‘dry’’ and ‘‘wet’’ thunderstorm days, the first being more favourable to the presence of dry lightning and consequently, having a higher likelihood of LIW occurrence. Figure 4 shows a scatterplot of the TS and LIW cases as a function of these two parameters. TS cases (blue dots) concentrate in the region of lower values for both variables, the region corresponding to “wet” thundery conditions. Although LIW events (red dots) are more scattered along the plot, they predominate in the region defined as the “dry” region in [18]. It is apparent that higher values of DPD850 and the temperature difference between 850 and 500 hPa typically indicate a higher chance of fire per CG stroke.

3.1.5. Lifted Condensation Level (LCL)

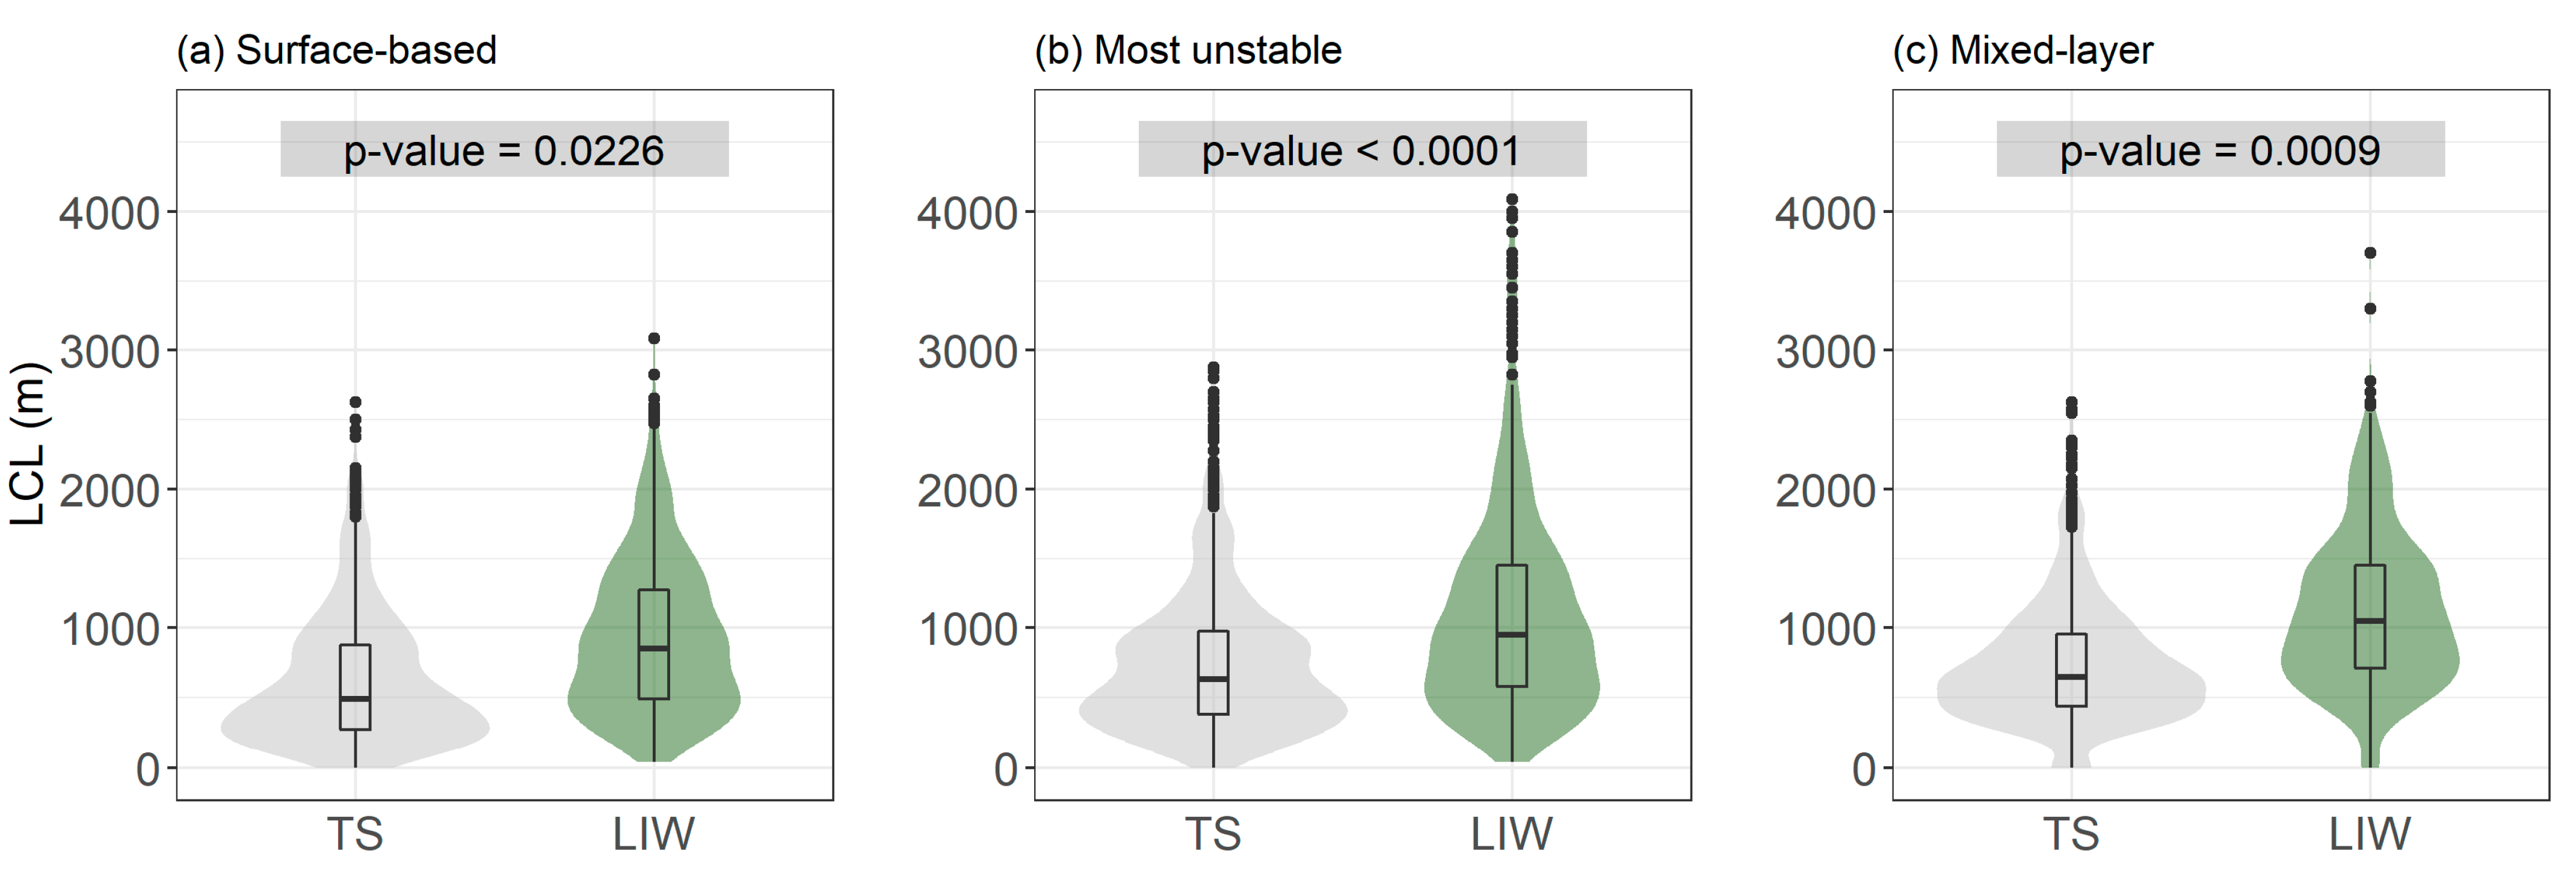
Apart from the DPD850, the lifted condensation level (LCL) can be used to characterize the low-level moisture. Results show that the height of LCL (Figure 5) appears to be a good index to distinguish between TS and LIW, especially the most-unstable LCL. Lower heights (IQR 380–975 m, median 630 m above model surface) are shown for TS, whereas most of the LIW present higher heights (IQR 580–1450, median 950 m above model surface).

3.1.6. Lapse Rate

Westermayer et al. [69] pointed out that the frequency of lightning depends on the lapse rate (in the 850 to 500 hPa layer). For smaller lapse rates, the probability of storms decreases. They stated that this may be caused by the difficulty for convective clouds to maintain sufficient positive buoyancy [70]. Conditional instability requires both a sufficiently large lapse rate with height and sufficiently moist low-level air [71]. In the case of thunderstorms triggering LIWs, results show that they usually occur in environments with a steeper lapse rate than TS cases at all the analysed layers, being consistent with previous studies, e.g., [18,24,61]. In this regard, for the 500–700 hPa lapse rate, the median value is –6.6 °C km−1 for LIWs and –6.3 °C km−1 for TS.

3.1.7. Relative Humidity

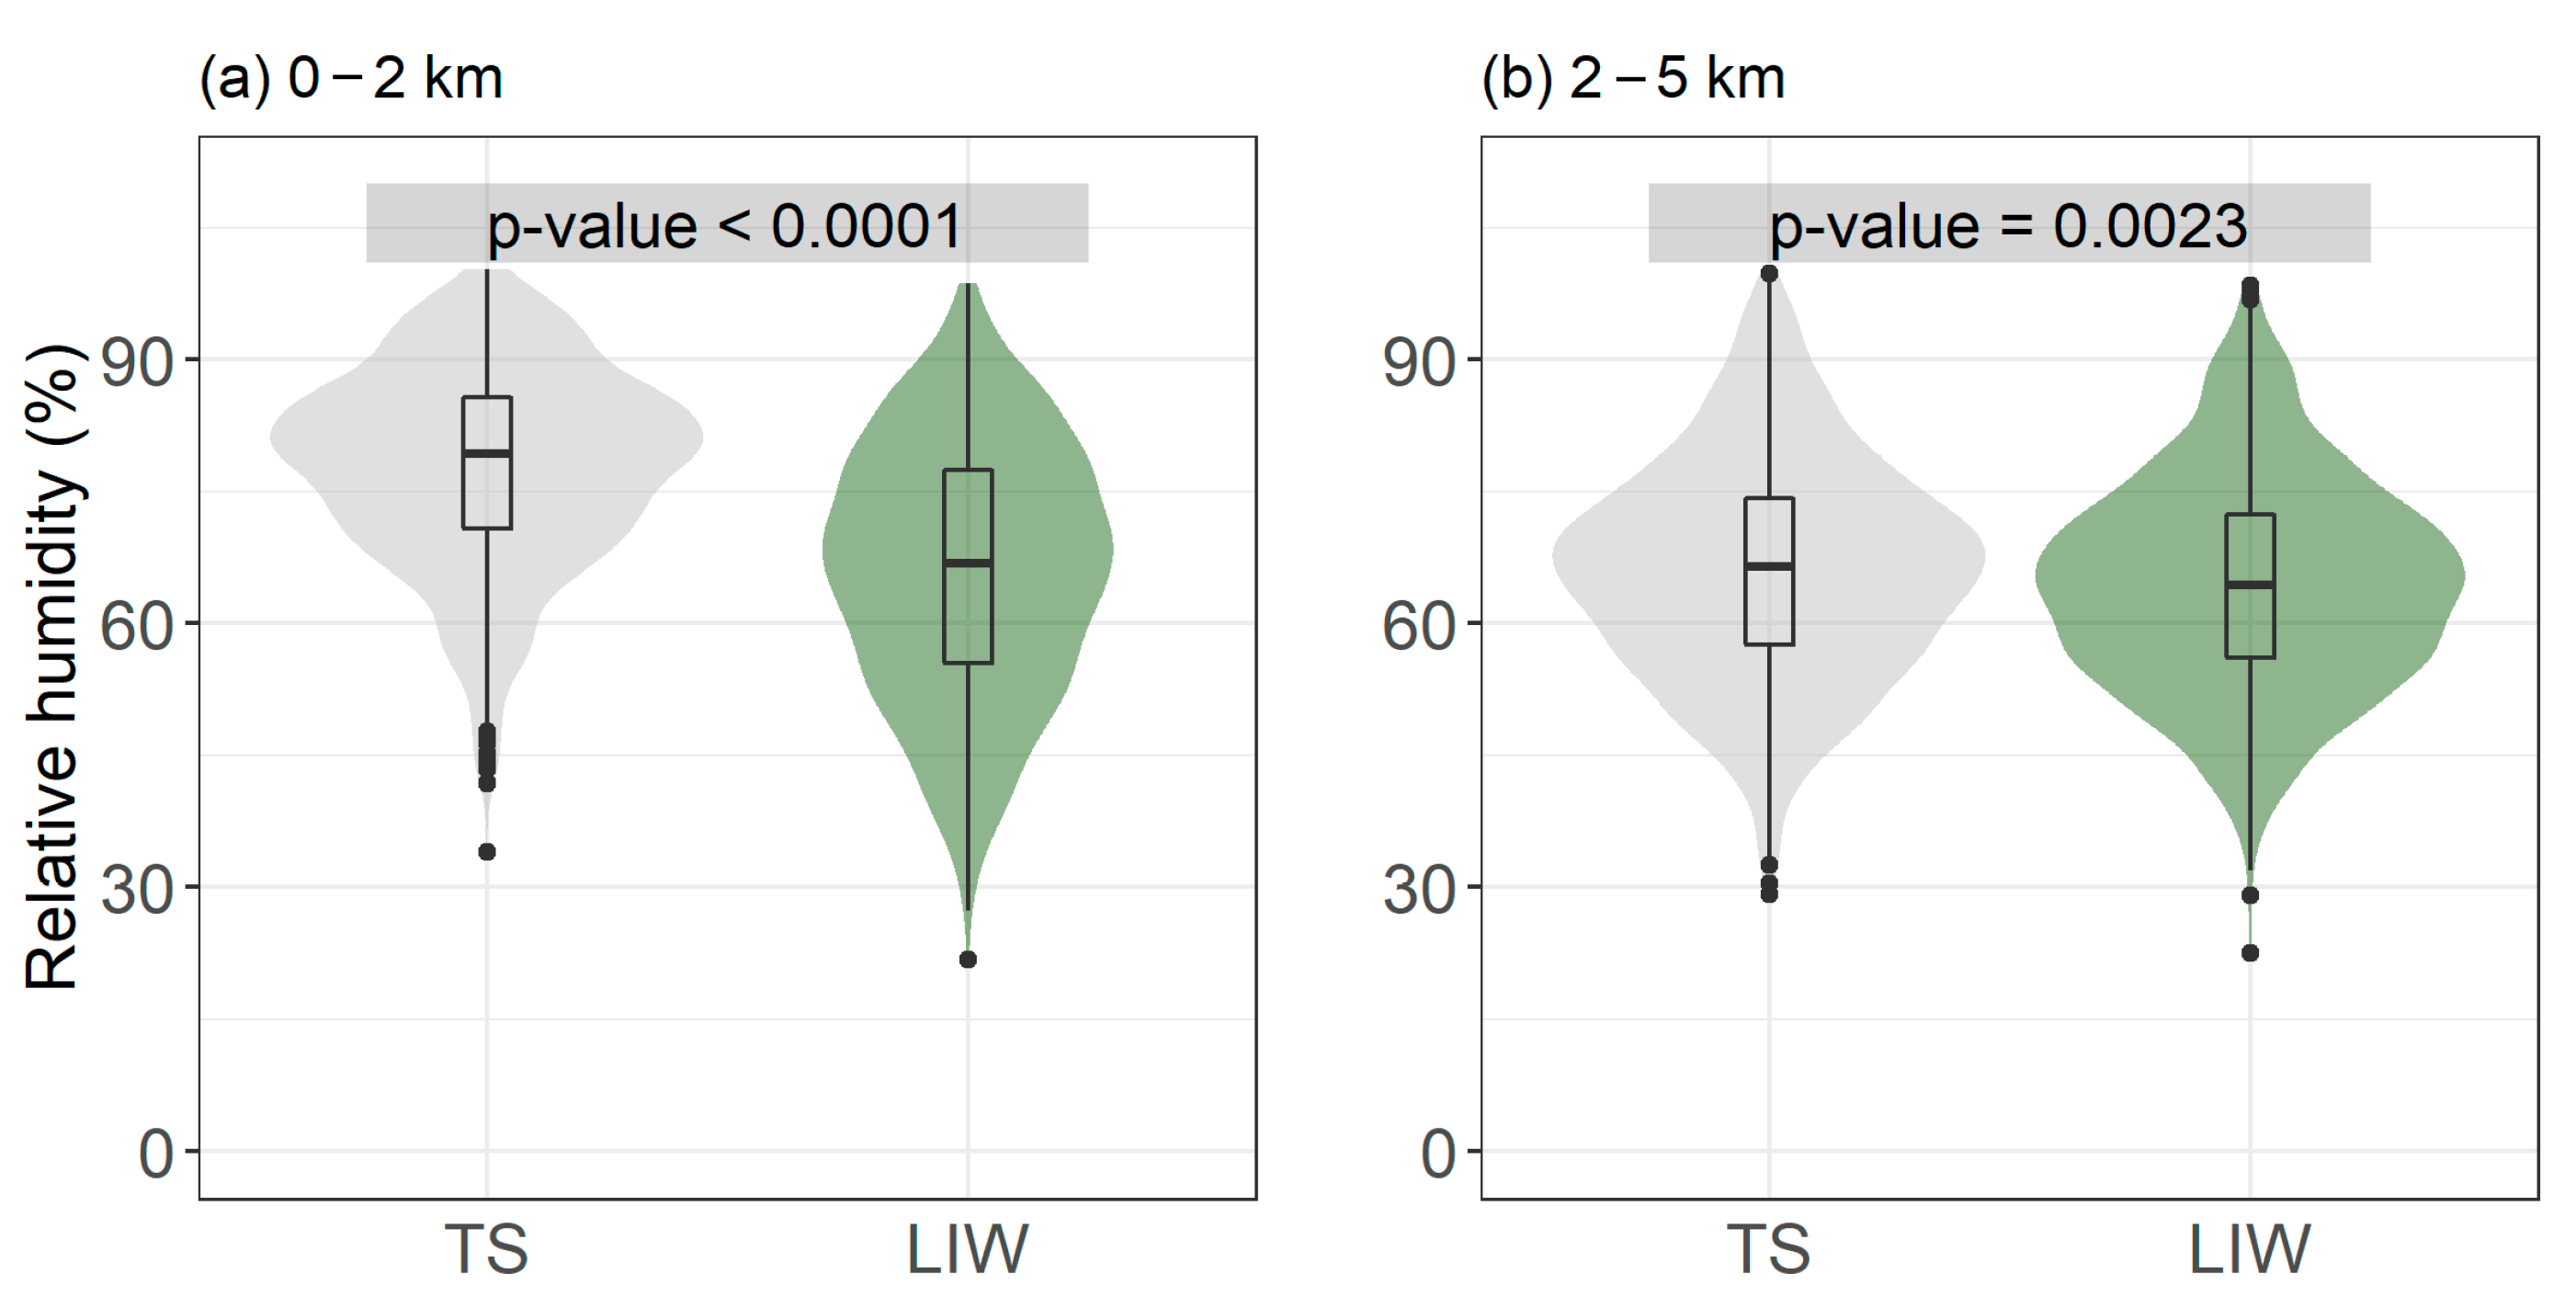
Given adequate CAPE (Figure 2), lightning occurrence strongly depends on the relative humidity (in addition to Convective Inhibition, CIN). Wet days present classical convection conditions, with moisture in the lower atmosphere, whereas dry days present drier air masses at lower levels [18]. Results show that the relative humidity for LIW at the lower levels (0–2 km) is much smaller compared to typical thunderstorm conditions (the median for TS is 79 % and for LIWs is 67 %, with a p-value lower than 0.001), suggesting drier conditions favour the survival of lightning-caused ignitions (Figure 6). Contrarily, at mid-levels (2–5 km) the difference in RH is smaller (the median for TS is 66% and for LIWs is 64%). Indeed, environmental conditions favouring lightning are needed in both categories. Results are in line with those presented by Pérez-Invernón et al. [28], who found the relative humidity for LIW is lower than for typical thunderstorms for altitudes below 600 hPa pressure levels.

3.2. Holdover Fires

In this section, the analysis deepens on the holdover LIWs, throughout the four categories in which the LIW sample was sub-divided, as defined in Pineda et al. [14].

3.2.1. Surface Dew Point Depression

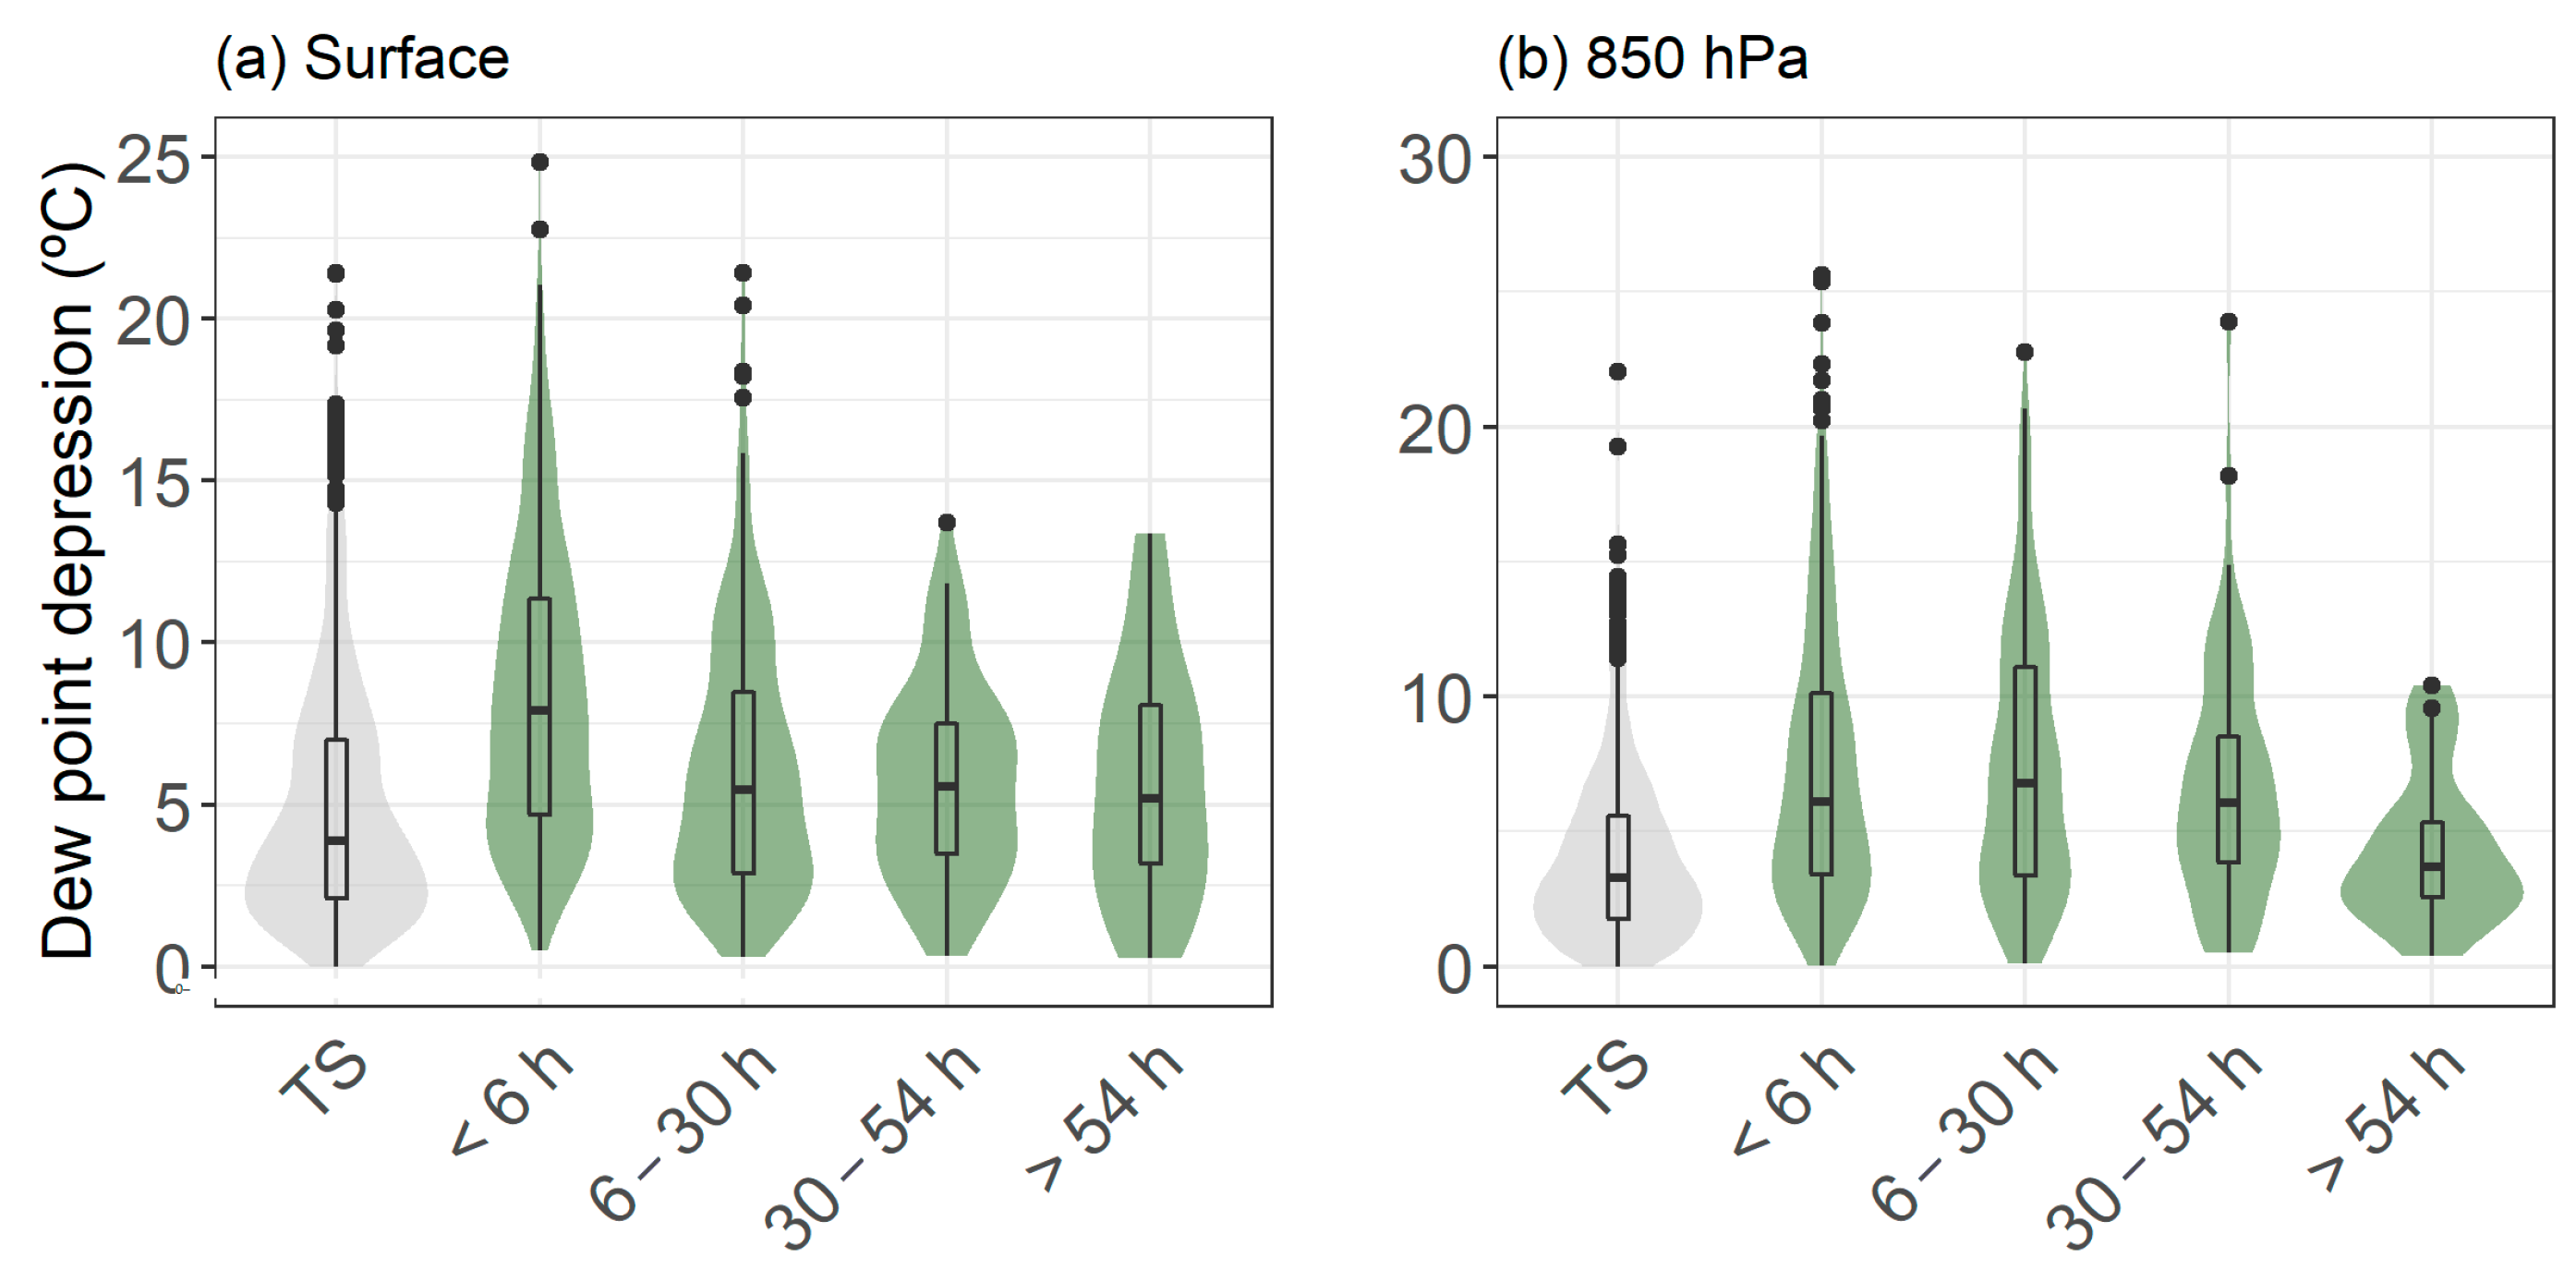
Surface dew point depression (SDPD) showed significant differences (p-value < 0.05) between ordinary thunderstorms (TS events) and all four holdover categories (Figure 7). This parameter is easy to measure and clearly shows the skill to distinguish between TS and LIW episodes, especially with short-term holdover LIWs. SDPD is 4 °C higher in short-term holdover LIWs compared to TS (averaging 7.5 and 5.0 °C respectively). Higher SDPD results in higher cloud base heights and lifted condensation levels (LCL). LCL averaged 630 m for TS, 940 m for all LIWs, and 1060 m for the short-term LIWs.

3.2.2. Temperature and Relative Humidity

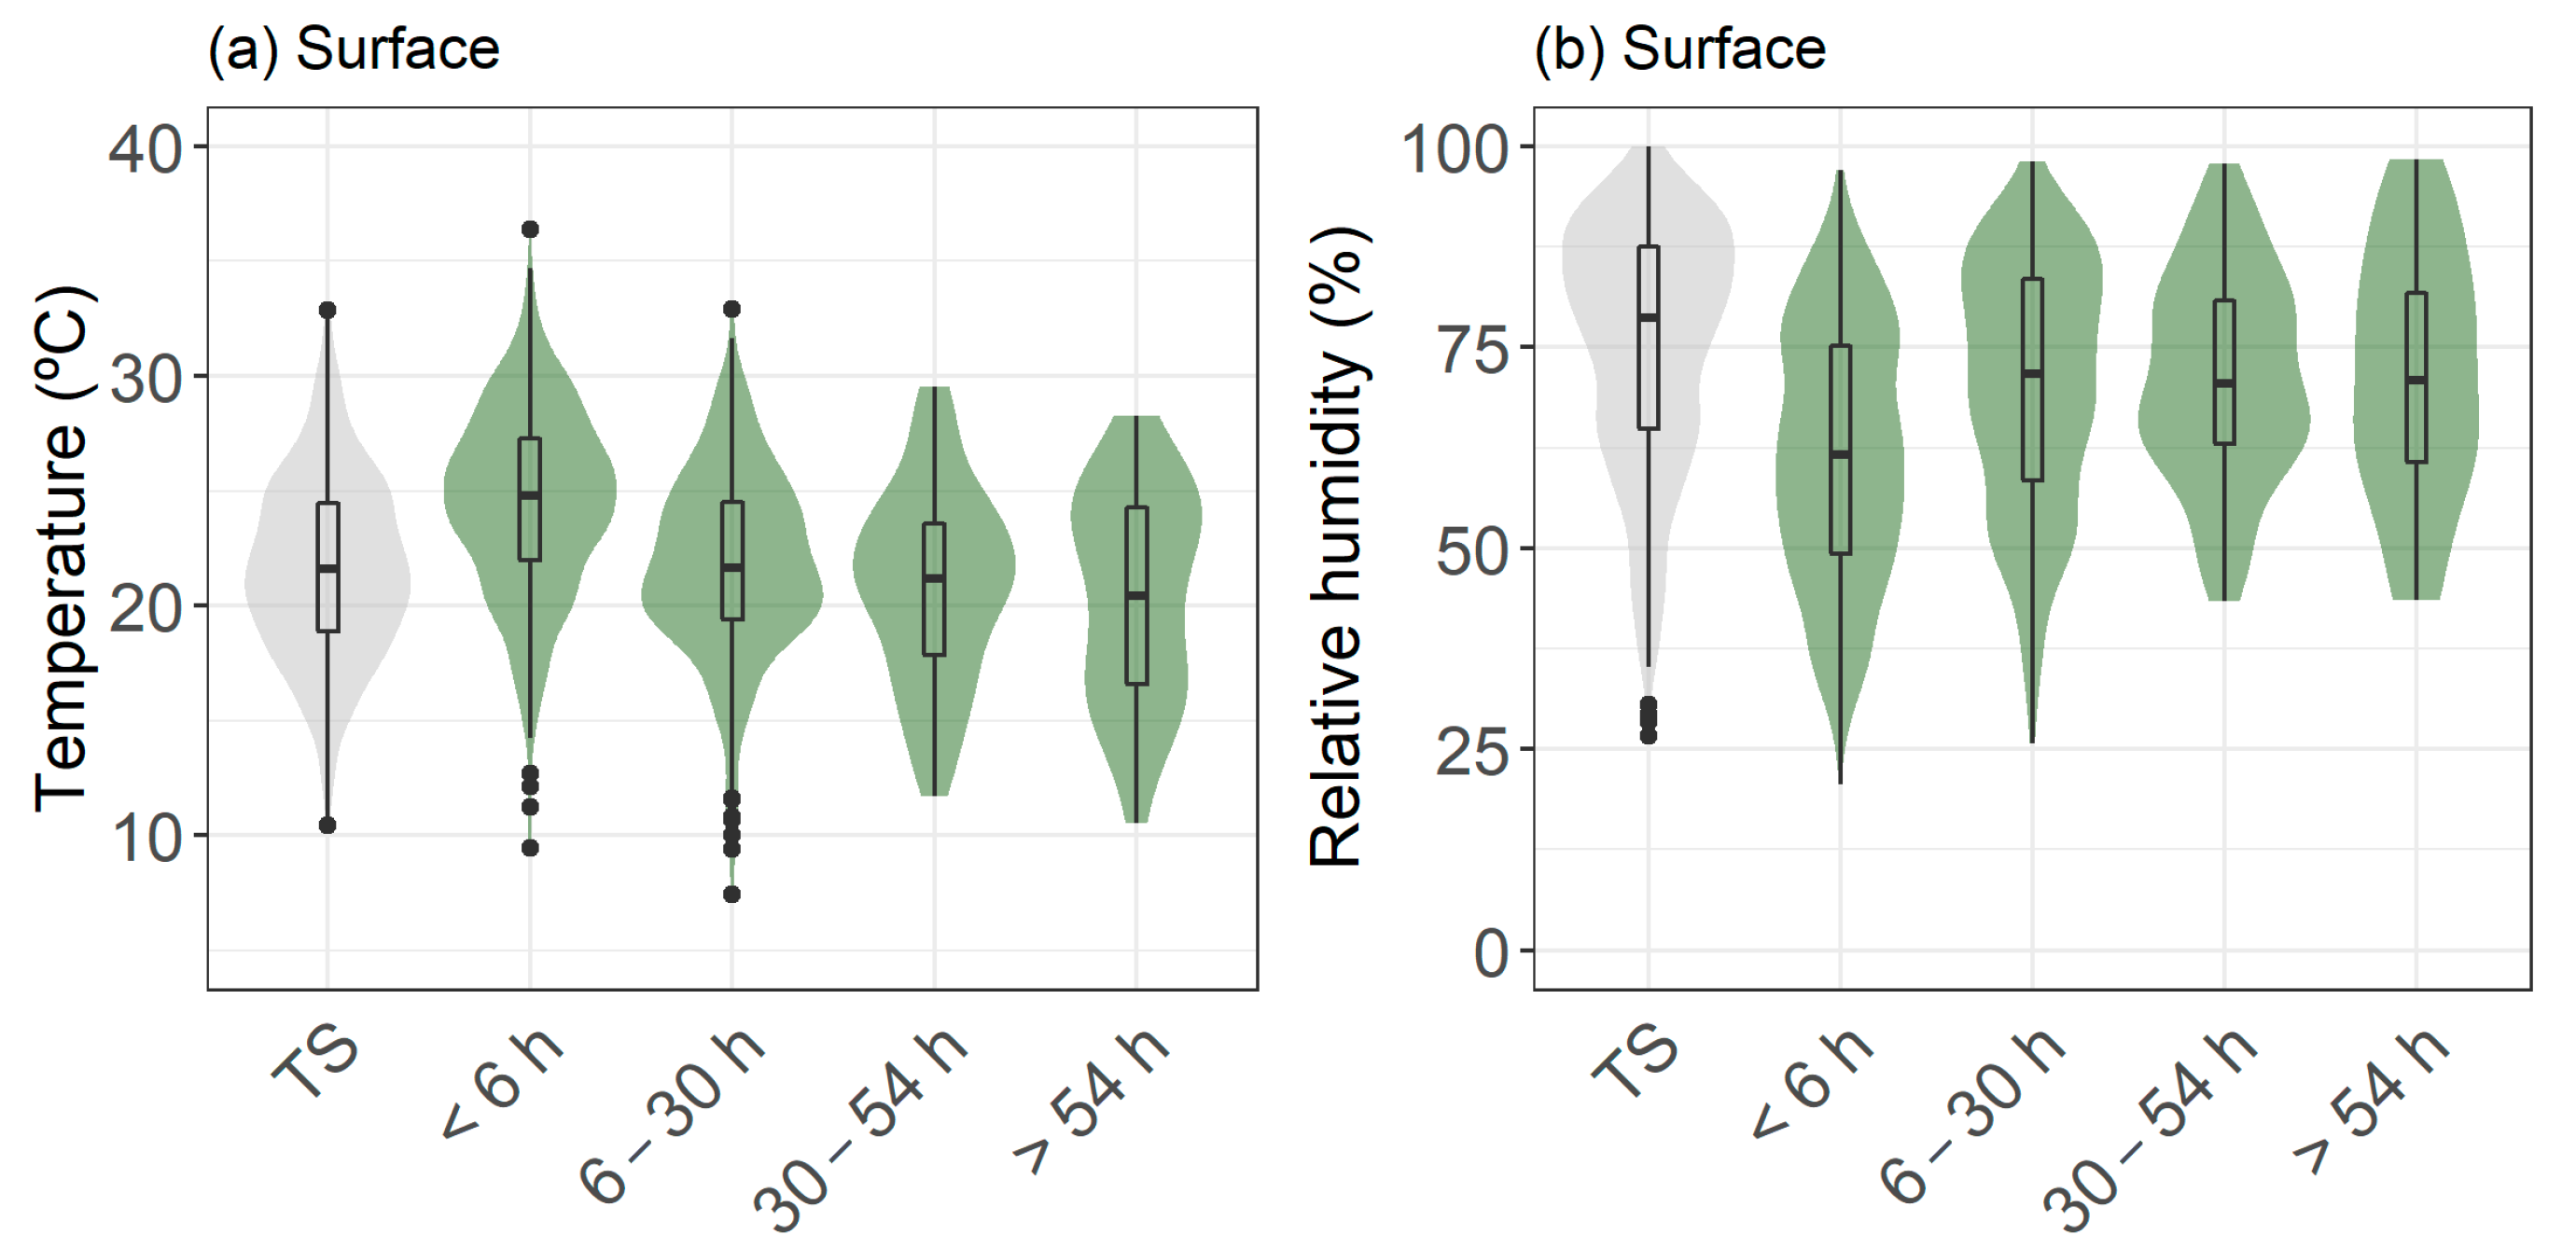
Representative values for surface temperature favouring thunderstorms in Catalonia range from ~19 to 24 °C (IQR) with a median of 21.6 °C; whereas temperatures for short-term LIWs are ~2 °C higher (Figure 8a). As the holdover period increases, temperature differences diminish. Regarding moisture, ordinary thunderstorms take place in a range of RH between 65 and 87% (median 78%); whereas temperatures for short-term LIWs are 12% lower (Figure 8b). As the holdover period increases, RH differences diminish.

3.2.3. Fuel Moisture Index

Temperature and relative humidity were combined in the Fuel Moisture Index (FMI, Equation (2), [59]).
FMI= 10 − 0.25 (T − RH)
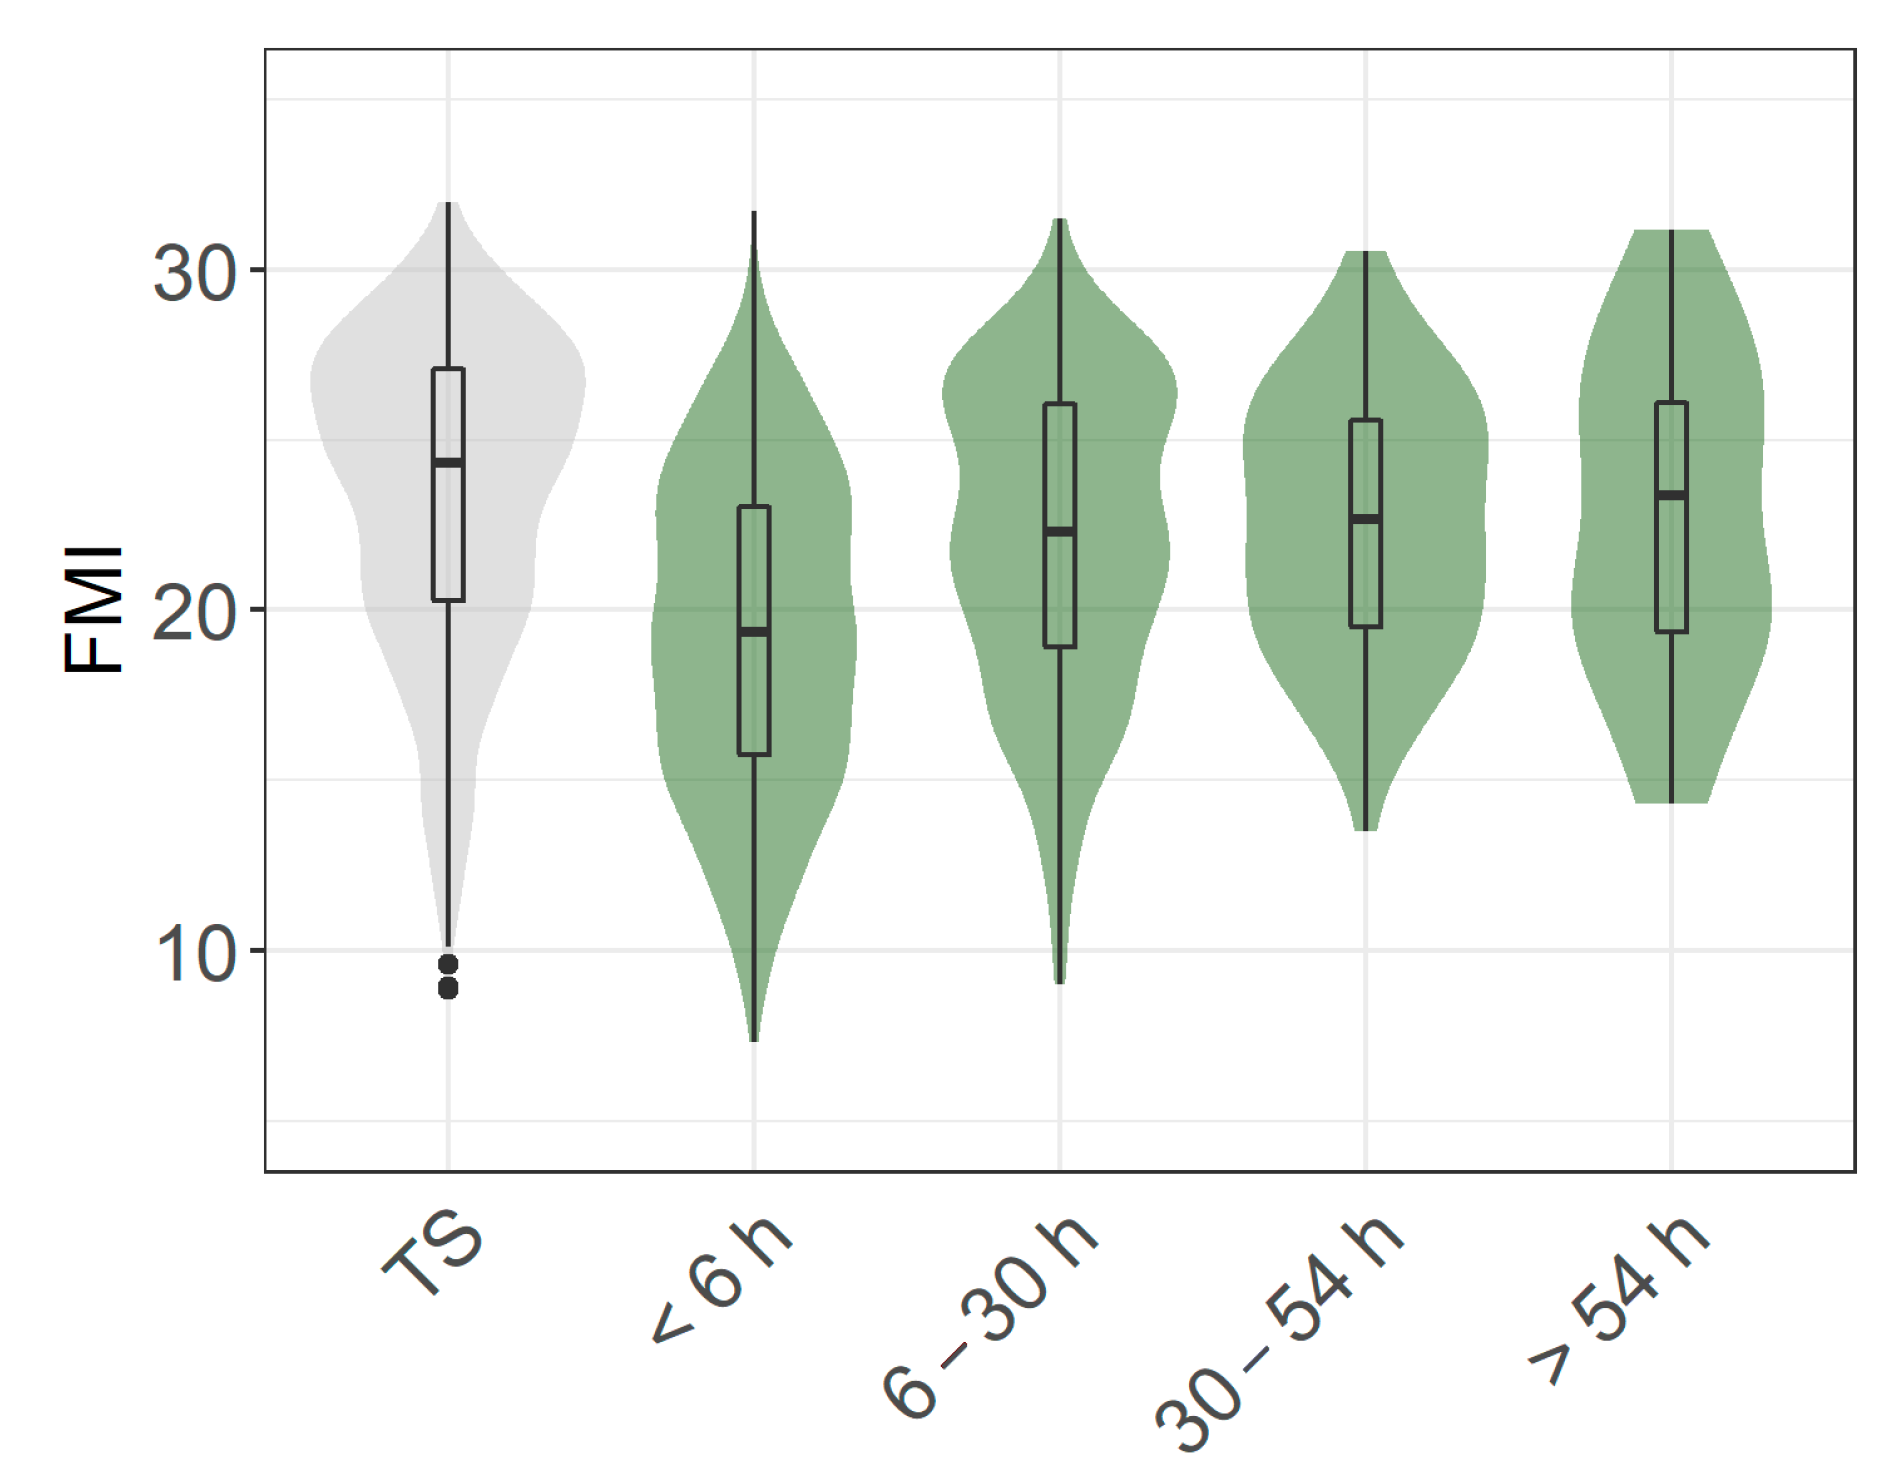
where RH is the relative humidity in percent, and T is the temperature in °C. The FMI is a dimensionless index, with a positive number that decreases as weather conditions become increasingly hotter and drier. However, it is not giving a direct estimate of fuel moisture content. Figure 9 shows that short-term LIWs are 5 points below TS, a significant difference (p-value < 0.001). Contrarily, the FMI has no significant differences between TS and the other three holdover categories.

4. Discussion

4.1. Forecasting LIWs

Since dry lightning is typically associated with thunderstorms that do not produce severe impacts, thunderstorm forecasts do not provide enough attention to this potential threat. Typical lower tropospheric thunderstorm indices such as Total Totals, CAPE, or the Lifted Index are not the most indicated to forecast LIW episodes [72,73].
LIW episodes are generally related to “dry thunderstorm” events, characterised by high-based clouds, moisture vertical contents lower than the climatological, and lower precipitation rates [14,21,26]. Dry thunderstorms need three key ingredients: mid-tropospheric moisture, a lifting mechanism, and a sufficiently dry lower troposphere [18,23]. Lifting can be provided dynamically by transient cyclonic circulations and thermodynamically through steep vertical temperature differences [25,61,64]. In Catalonia, LIW episodes tend to be dynamically related to shortwave troughs at 500 hPa, typically associated with an Iberian thermal low, a northerly flow, or prefrontal convection [28].
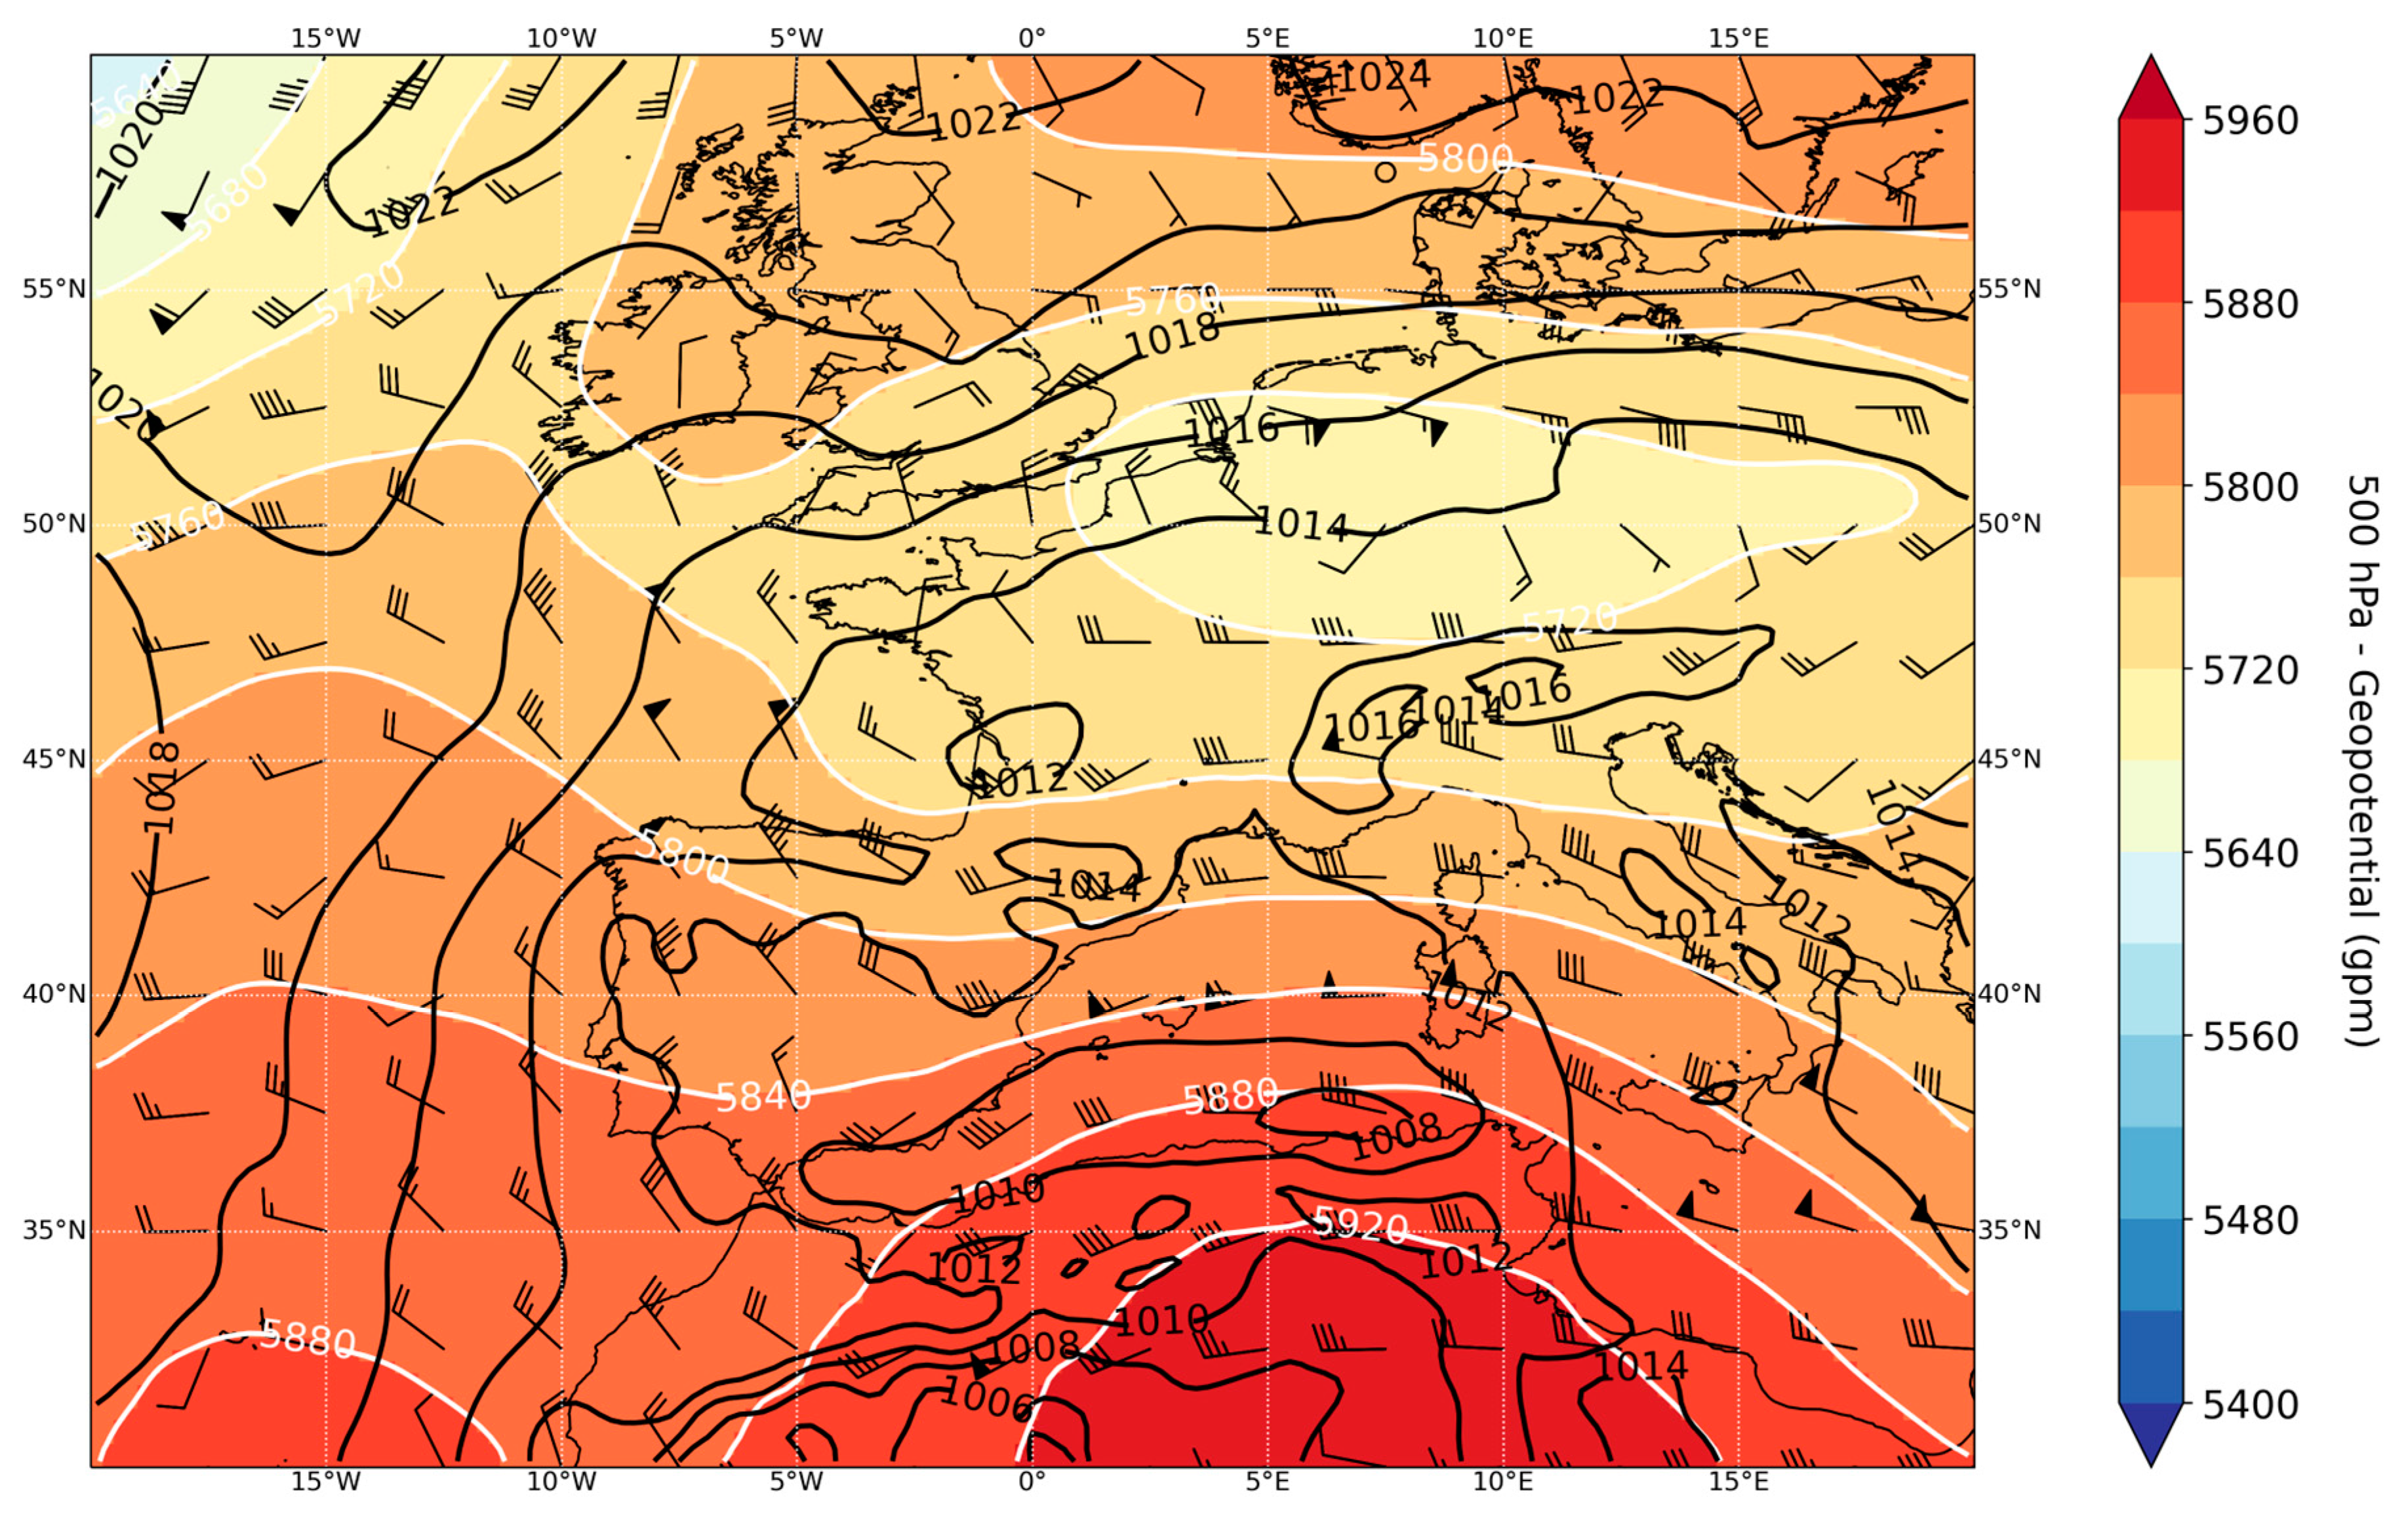
As an example, Figure 10 shows a typical situation favouring the LIW. The map corresponds to 25 July 2014, with 20 LIWs detected in Catalonia between 0400 and 0700 UTC. The episode was spawned by a short-wave trough at mid and upper levels and a surface thermal low located in southern Iberia, which is the most common synoptic configuration for LIW occurrence [28]. Notice the maximum wind speed at 300 hPa associated with a mesoscale jet, just south of Catalonia, a feature commonly identified in LIW cases in the U.S. [25].
Thermodynamically, the present analysis has found that thunderstorms triggering LIWs mostly occur in environments with weak-to-moderate MLCAPE (IQR 150–1100 J kg−1), large DPD850 (IQR 3.3–10.1 °C), high MULCL (IQR 580–1450 m) and steep 500–700 hPa lapse rate (IQR −7.0–−6.3 °C). This is consistent with the three key ingredients mentioned previously and contrasts with TS events, which are spawned by larger MLCAPE (IQR 390–1260 J kg−1), smaller DPD850 (IQR 1.7–5.5 °C), lower MULCL (IQR 380–975 m) and smaller 500–700 hPa lapse rate (IQR −6.6–−6.0 °C) than LIWs. As remarked in [26], low-level dry air conditions (i.e., low relative humidity, high dew point depression, high LCL) in thunderstorm favourable environments are prone to the evaporation of a fraction of the precipitating water, reducing the amount of rain reaching the ground. The probability of occurrence of LIW increases in these conditions.
Rorig and Ferguson [18] used the combination of the DPD850 and the 850–500 hPa temperature difference to classify thunderstorm days as either ‘‘dry’’ or ‘‘wet’’ in the Pacific Northwest of the U.S. A question could be raised whether this method is extendible to other regions. For example, Dowdy and Mills [24] showed consistent results for the southeast of Australia, although the overlapping region in the diagram between LIWs and TS was greater than in [18]. When applied to Catalonia, we found that both LIWs and TS presented smaller values of DPD850 and T850–T500 than in the above-mentioned studies. Nevertheless, LIWs and TS showed a similar distribution in the diagram, with larger DPD and T850–T500 for the first category than for the second one. Therefore, although the overlapping region (also present in [18,24]), LIWs and TS occurrence in Catalonia can be discriminated against using the diagram. In this sense, 66% of LIWs presented DPD850 (3.3 °C) and T850–T500 (27.2 °C) higher than the LIWs 25-percentile of both parameters at the same time, whereas the percentage is 39% for TS. As pointed out by Dowdy and Mills [24], the fact that the relationship between dry lightning and the 850–500 hPa temperature lapse and DPD850 is reasonably similar in the southeast of Australia and the Pacific Northwest of the U.S. indicates that the physics behind dry lightning may be somewhat universal; that is, high-based thunderstorms with low atmospheric moisture at lower levels produce favourable conditions for the occurrence of dry lightning. Despite the differences shown in the present analysis with the aforementioned studies, current results add evidence to support this statement.

4.2. Holdover Fires

Multiple pairwise comparisons (see Supplementary Materials, Table S4) showed that few indices had significant differences between TS and multi-day holdover LIWs (>54 h). These results indicate that long-term holdover LIWs are hard to detect at inception, the original ignition occurring in ordinary thunderstorm conditions not favourable to flaming combustion. On the other hand, pairwise comparisons between short-term LIW (holdover < 6 h) and TS showed significant differences in most of the selected parameters. These results suggest that those ignitions that spread shortly after the lightning strike occur under characteristic environmental conditions, which can be reasonably forecasted using the correct selection of parameters.
The longer the holdover period, the shorter the differences between TS and the holdover categories (at the time of the lightning ignition). Indeed, ordinary thunderstorm environmental conditions are not prone to LIW. This is reflected in the LE index, averaging 0.12% in Catalonia [14]. In other words, there is only one LIW per 840 recorded CG flashes. The LE for Catalonia is in the range of other LE calculated in other regions of the world, between the minimum reported for Finland (0.015% [55] and the maximum for Australia (0.42% [24]).

4.3. Assumptions and Uncertainties

LLS, similar to other remote sensing measurement systems, are not 100% efficient. Inevitably, some lightning strikes will go undetected due to different issues, such as sensor temporary faults, communication faults, and network geometry, among others. Therefore, the performance characteristics of the LLS must be regularly validated through different methods [74]. Regarding the SMC-LLS, the detection efficiency has been established to be around 85–90% [51], with a minimum detectable CG peak current in the range of 3 to 7 kA [75].
As a result, 10% of the wildfires reported in the SPIF database had no lightning candidate from the SMC-LSS. Admittedly, a clear identification of all candidates remains a challenge in the study of the LIW worldwide [76,77]. Moreover, the holdover span adds uncertainty to this matching process [77].
On the other side, the wildfire database will contain inevitable errors, such as wrong cause attribution and inaccuracies in the date, time, and coordinates of the ignition [76,78]. In the present study, the SPIF’s wildfire database is regarded as a high-quality source of information since cause attribution relies on physical evidence gathered in-situ by the Corps of Rural Agents.
The use of reanalysis data, such as the ERA5, instead of real atmospheric sounding measurements, has also pros and cons. In fact, the SMC operates a sounding station, located in Barcelona (N 41° 23′ 4.08″ E 2° 7′ 3.36″—WMO reference 08190). Indeed, direct measurements from soundings will provide greater vertical resolution and a more realistic depiction of the atmospheric vertical profile. Reanalysis data has a lower vertical resolution but, on the other hand, presents a higher temporal and spatial resolution. Atmospheric profiles from reanalysis usually provide data from a given point from a mesh that is generally closer to the event of interest (both in space and time), compared to a sounding station. In fact, the ERA5 resolution is around one order of magnitude smaller than the network density of sounding stations in Europe. Such closeness is a relevant factor in the present study since LIW can take place almost anywhere around Catalonia. Contrarily, the proximity to the sea of Barcelona’s sounding station makes low-level data not representative of the main LIW-affected area, which is located inland. Moreover, the smaller temporal resolution makes the data also less representative, as it does not detect changes on low levels due to the diurnal cycle. Still, Recent studies showed that ERA5 tends to underestimate low-level moisture, CAPE, and vertical wind shear, whereas overestimates of the mean wind and lapse-rate at low levels. In contrast, this reanalysis correctly represents moisture, wind, and temperature at mid-levels [79].

4.4. Future Work

In terms of risk assessment, to successfully predict the daily probability of ignition, fuel type, and fuel state must be considered. Therefore, future work has to focus on the integration of the short-term weather forecast with the long-term ignition potential, based on vegetation type and fuel moisture content. Rodríguez-Pérez et al. [80] suggested the type of vegetation as the most relevant factor for lightning ignition. Pineda et al. [14] reported conifer forests as the land cover with the highest LE in Catalonia (0.17%), followed by shrublands (0.13%). Contrarily, LE in deciduous forests (0.06%) and Mediterranean oaks (0.05%) is half of the median (0.12%). Regarding fuel moisture content, the model by Rodrigues et al. [81] associated the LIW with dead fuels below 10–13% moisture content and moderate drought conditions.

5. Conclusions

Although thunderstorms produce thousands of cloud-to-ground lightning every year, only a few cause ignitions that end in a lightning-ignited wildland fire. Being able to forecast days with a higher probability of lightning ignitions would be of great assistance to wildfire management agencies. Even if most of the lightning-ignited wildfires burn less than one hectare, days with multiple ignitions in remote locations can overwhelm the fire extinction capacity and turn into big wildfires. Typical thunderstorm indices (i.e., Totals, CAPE, or the Lifted Index) are not appropriate to forecast dry thunderstorm events, characterised by high-based clouds, moisture vertical contents lower than the climatological, and lower precipitation rates. Taking advantage of the latest available reanalysis from the European Centre for Medium-Range Weather Forecasts, the so-called ERA5, the present work described the most suitable thunderstorm predictors to forecast lightning wildfires. Results indicate that thunderstorms that trigger wildfires tend to occur in environments with low-level dry air conditions, characterised by weak-to-moderate mixed-layer parcels CAPE (150–1100 J kg−1), large dew point depression at 850 hPa (3.3–10.1 °C), high most-unstable lifted condensation level (580–1450 m) and steep 500–700 hPa lapse rate (−7.0–−6.3 °C). Under these conditions, with relatively dry air at lower levels, thunderstorms tend to be high-based, the rain evaporating before reaching the ground and lightning occurring without significant rainfall. Comparison with similar studies from other parts of the world indicates a considerable degree of universality in the atmospheric conditions associated with dry thunderstorms, suggesting the potential of these thermodynamic and kinematic parameters to forecast lightning fires more widely than just in the area of the study.

Supplementary Materials

The following supporting information can be downloaded at: https://www.mdpi.com/article/10.3390/atmos14060936/s1, Table S1. ERA 5 parameters and derived indices showed in the Supplementary material section, units, and a brief comment [82,83,84]. Table S2. Percentile (P) 25, 50, and 75, Interquartile Range (IQR) and average (AVE) from each analysed parameter for thunderstorm significant events (TS), all lightning-ignited wildfires (LIW), and the four holdover categories: short-term, 1-day, 2-days and multi-day holdover. Table S3. Welch’s t-test: p-value of the Welch’s t-test for each parameter comparing thunderstorm significant events (TS) and lightning-ignited wildfires (LIW) datasets. In bold p-values ≤ 0.1, and shaded in grey, p-values ≤ 0.05. Table S4. Turkey multiple pairwise-comparisons test: p-value of the Turkey test for each parameter comparing among thunderstorm significant events (TS), and the four holdover categories: short-term (ST), 1-day (1D), 2-days (2D), and multi-day (MD) holdover. In bold p-values ≤ 0.1, and shaded in grey, p-values ≤ 0.05.

Author Contributions

Conceptualization, N.P.; methodology, N.P. and O.R.; software, O.R. validation, N.P. and O.R.; formal analysis, N.P. and O.R.; writing—original draft preparation, N.P. and O.R.; writing—review and editing, N.P. and O.R. All authors have read and agreed to the published version of the manuscript.

Funding

This research received no external funding.

Institutional Review Board Statement

Not applicable.

Informed Consent Statement

Not applicable.

Data Availability Statement

Lightning data was drawn from the Servei Meteorològic de Catalunya (SMC) lightning database. Lightning-caused wildfire records were drawn from the Servei de Prevenció d’Incendis Forestals (SPIF) wildfire database. Data shall be requested from the corresponding institution. ERA5 data can be downloaded from Copernicus (https://cds.climate.copernicus.eu/ (accessed on 31 March 2023)). ThundeR package, version 1.1.1, was developed by Bartosz Czernecki, Mateusz Taszarek, Piotr Szuster and is available in https://bczernecki.github.io/thundeR/ (accessed on 31 March 2023).

Acknowledgments

The authors would like to thank their colleagues Patricia Altube and Helen San Segundo for continued support and feedback on statistics and GIS techniques. We acknowledge José A. Terés and the SPIF for providing access to the wildfire database.

Conflicts of Interest

The authors declare no conflict of interest.

References

  1. San-Miguel-Ayanz, J.; Moreno, J.M.; Camia, A. Analysis of large fires in European Mediterranean landscapes: Lessons learned and perspectives. For. Ecol. Manag. 2013, 294, 11–22. [Google Scholar] [CrossRef]
  2. Ganteaume, A.; Camia, A.; Jappiot, M.; San-Miguel-Ayanz, J.; Long-Fournel, M.; Lampin, C. A review of the main driving factors of forest fire ignition over Europe. Environ. Manag. 2013, 51, 651–662. [Google Scholar] [CrossRef] [PubMed]
  3. Camia, A.; Durrant, H.T.; San-Miguel-Ayanz, J. Harmonized Classification Scheme of Fire Causes in the EU Adopted for the European Fire Database of EFFIS; JRC 80682; Institute for Environment and Sustainability, Joint Research Centre, European Commission: Brussels, Belgium, 2013. [Google Scholar]
  4. Pugnet, L.; Lourenço, L.; Rocha, J. L’ignition des feux de forêt par l’action de la foudre au Portugal de 1996 à 2008. Territorium. Rev. Port. Riscos Prevenção E Segurança 2010, 17, 57–70. [Google Scholar]
  5. Russo, A.; Ramos, A.M.; Benali, A.; Trigo, R.M. Forest fires caused by lightning activity in Portugal. In Proceedings of the EGU Conference Abstracts, EGU General Assembly, Vienna, Austria, 8–13 April 2018; p. 17613. [Google Scholar]
  6. Fernandes, P.M.; Santos, J.A.; Castedo-Dorado, F.; Almeida, R. Fire from the Sky in the Anthropocene. Fire 2021, 4, 13. [Google Scholar] [CrossRef]
  7. Nieto, H.; Aguado, I.; García, M.; Chuvieco, E. Lightning-caused fires in Central Spain: Development of a probability model of occurrence for two Spanish regions. Agric. For. Meteorol. 2012, 162–163, 35–43. [Google Scholar] [CrossRef]
  8. Costafreda-Aumedes, S.; Cardil, A.; Molina, D.; Daniel, S.; Mavsar, R.; Vega-Garcia, C. Analysis of factors influencing deployment of fire suppression resources in Spain using artificial neural networks. iForest-Biogeosciences For. 2016, 9, 138–145. [Google Scholar] [CrossRef]
  9. Keeley, J.E.; Syphard, A.D. Large California wildfires: 2020 fires in historical context. Fire Ecol. 2021, 17, 22. [Google Scholar] [CrossRef]
  10. Latham, D.; Williams, E. Lightning and forest fires. In Forest Fires: Behavior and Ecological Effects; Johnson, E.A., Miyanishi, K., Eds.; Academic Press, Inc.: San Diego, CA, USA, 2001. [Google Scholar]
  11. Anderson, K. A model to predict lightning-caused fire occurrences. Int. J. Wildland Fire 2002, 11, 163–172. [Google Scholar] [CrossRef]
  12. Read, N.; Duff, T.J.; Taylor, P.G. A lightning-caused wildfire ignition forecasting model for operational use. Agric. For. Meteorol. 2018, 253–254, 233–246. [Google Scholar] [CrossRef]
  13. Podur, J.; Martell, D.L.; Csillag, F. Spatial patterns of lightning caused forest fires in Ontario, 1976–1998. Ecol. Modell. 2003, 164, 1–20. [Google Scholar] [CrossRef]
  14. Pineda, N.; Altube, P.; Alcasena, F.J.; Casellas, E.; San Segundo, H.; Montanyà, J. Characterising the holdover phase of lightning-ignited wildfires in Catalonia. Agric. For. Meteorol. 2022, 324, 109111. [Google Scholar] [CrossRef]
  15. Petersen, W.A.; Rutledge, S.A. On the relationship between cloud-to-ground lightning and convective rainfall. J. Geophys. Res. 1998, 103, 14025–14040. [Google Scholar] [CrossRef]
  16. Soula, S.; Chauzy, S. Some aspects of the correlation between lightning and rain activities in thunderstorms. Atmos. Res. 2001, 56, 355–373. [Google Scholar] [CrossRef]
  17. Liu, C.; Cecil, D.J.; Zipser, E.J.; Kronfeld, K.; Robertson, R. Relationships between lightning flash rates and radar reflectivity vertical structures in thunderstorms over the tropics and subtropics. J. Geophys. Res. 2012, 117, D06212. [Google Scholar] [CrossRef]
  18. Rorig, M.L.; Ferguson, S.A. Characteristics of lightning and wildland fire ignition in the Pacific Northwest. J. Appl. Meteor. 1999, 38, 1565–1575. [Google Scholar] [CrossRef]
  19. Hall, B.L. Fire ignitions related to radar reflectivity patterns in Arizona and New Mexico. Int. J. Wildland Fire 2008, 17, 317–327. [Google Scholar] [CrossRef]
  20. Pineda, N.; Rigo, T. The rainfall factor in lightning-ignited wildfires in Catalonia. Agric. For. Meteorol. 2017, 239, 249–263. [Google Scholar] [CrossRef]
  21. Soler, A.; Pineda, N.; San Segundo, H.; Bech, J.; Montanyà, J. Characterisation of thunderstorms that caused lightning-ignited wildfires. Int. J. Wildland Fire 2021, 30, 954–970. [Google Scholar] [CrossRef]
  22. Rorig, M.L.; Ferguson, S.A. The 2000 fire season: Lightning-caused fires. J. Appl. Meteor. 2002, 41, 786–791. [Google Scholar] [CrossRef]
  23. Rorig, M.L.; McKay, S.J.; Ferguson, S.A.; Werth, P. Model-generated predictions of dry thunderstorm potential. J. Appl. Meteorol. Climatol. 2007, 46, 605–614. [Google Scholar] [CrossRef]
  24. Dowdy, A.J.; Mills, G.A. Atmospheric and fuel moisture characteristics associated with lightning-attributed fires. J. Appl. Meteorol. Climatol. 2012, 51, 2025–2037. [Google Scholar] [CrossRef]
  25. Nauslar, N.J.; Kaplan, M.L.; Wallmann, J.; Brown, T.J. A Forecast Procedure for Dry Thunderstorms. J. Oper. Meteorol. 2013, 17, 200–214. [Google Scholar] [CrossRef]
  26. Pérez-Invernón, F.J.; Huntrieser, H.; Soler, S.; Gordillo-Vázquez, F.J.; Pineda, N.; Navarro-González, J.; Reglero, V.; Montanyà, J.; van der Velde, O.; Koutsias, N. Lightning-ignited wildfires and long-continuing-current lightning in the Mediterranean Basin: Preferential meteorological conditions. Atmos. Chem. Phys. Discuss. 2021, 21, 17529–17557. [Google Scholar] [CrossRef]
  27. Garcia-Ortega, E.; Trobajo, M.T.; Loópez, L.; Sánchez, J.L. Synoptic patterns associated with wildfires caused by lightning in Castile and Leon, Spain. Nat. Hazards Earth Syst. Sci. 2011, 11, 851–863. [Google Scholar] [CrossRef]
  28. Pineda, N.; Peña, J.C.; Soler, X.; Aran, M.; Pérez-Zanón, N. Synoptic weather patterns conducive to lightning-ignited wildfires in Catalonia. Adv. Sci. Res. 2022, 19, 39–49. [Google Scholar] [CrossRef]
  29. Skinner, W.R.; Flannigan, M.D.; Stocks, B.J.; Martell, D.L.; Wotton, B.M.; Todd, J.B.; Bosch, E.M. A 500 hPa synoptic wildland fire climatology for large Canadian forest fires, 1959–1996. Theor. Appl. Climatol. 2002, 71, 157–169. [Google Scholar] [CrossRef]
  30. van Wagtendonk, J.W.; Cayan, D.R. Temporal and Spatial Distribution of Lightning Strikes in California in Relation to Large-Scale Weather Patterns. Fire Ecol. 2008, 4, 34–56. [Google Scholar] [CrossRef]
  31. Wastl, C.; Schunk, C.; Lüpke, M.; Cocca, G.; Conedera, M.; Valese, E.; Menzel, A. Large-scale weather types, forest fire danger, and wildfire occurrence in the Alps. Agric. For. Meteorol. 2013, 168, 15–25. [Google Scholar] [CrossRef]
  32. Millan, M.; Estrela, M.; Badenas, C. Meteorological processes relevant to forest fire dynamics on the Spanish Mediterranean coast. J. Appl. Meteorol. 1998, 37, 83–100. [Google Scholar] [CrossRef]
  33. Pereira, M.G.; Trigo, R.M.; da Camara, C.C.; Pereira, J.M.C.; Leite, S.M. Synoptic patterns associated with large summer forest fires in Portugal. Agric. For. Meteorol. 2005, 129, 11–25. [Google Scholar] [CrossRef]
  34. Rasilla, D.F.; Garcia-Codron, J.C.; Carracedo, V.; Diego, C. Circulation patterns, wildfire risk and wildfire occurrence at continental Spain. Phys. Chem. Earth 2010, 35, 553–560. [Google Scholar] [CrossRef]
  35. Kassomenos, P. Synoptic circulation control on wildfire occurrence. Phys. Chem. Earth 2010, 35, 544–552. [Google Scholar] [CrossRef]
  36. Coughlan, R.; Di Giuseppe, F.; Vitolo, C.; Barnard, C.; Lopez, P.; Drusch, M. Using machine learning to predict fire-ignition occurrences from lightning forecasts. Meteorol. Appl. 2021, 28, e1973. [Google Scholar] [CrossRef]
  37. Hersbach, H.; Bell, B.; Berrisford, P.; Hirahara, S.; Horányi, A.; Muñoz-Sabater, J.; Nicolas, J.; Peubey, C.; Radu, R.; Schepers, D.; et al. The ERA5 global reanalysis. Q. J. R. Meteorol. Soc. 2020, 146, 1999–2049. [Google Scholar] [CrossRef]
  38. Albentosa, L.M. Bibliografía de Climatología y Meteorología de Cataluña. Rev. Geogr. Dep. Geogr. i AGR 1980, 127–159. [Google Scholar]
  39. Martín-Vide, J.; Sanchez-Lorenzo, A.; Lopez-Bustins, J.A.; Cordobilla, M.J.; Garcia-Manuel, A.; Raso, J.M. Torrential rainfall in northeast of the Iberian Peninsula: Synoptic patterns and WeMO influence. Adv. Sci. Res. 2008, 2, 99–105. [Google Scholar] [CrossRef]
  40. Barrera-Escoda, A.; Llasat, M.C. Evolving flood patterns in a Mediterranean region and climatic factors–the case of Catalonia. Hydrol. Earth. Syst. Sc. 2015, 19, 465–483. [Google Scholar] [CrossRef]
  41. Campins, J.; Jansá, A.; Benech, B.; Koffi, E.; Bessemoulin, P. PYREX Observation and Model Diagnosis of the Tramontane Wind. Meteorol. Atmos. Phys. 1995, 56, 209–228. [Google Scholar] [CrossRef]
  42. Pascual, R.; Callado, A. Meso-analysis of recurrent convergence zones in the north-eastern Iberian Peninsula. In Proceedings of the Second European Conference on Radar Meteorology (ERAD), Delft, The Netherlands, 18–22 November 2002. [Google Scholar]
  43. Pineda, N.; Soler, X.; Vilaclara, E. Aproximació a la Climatologia de Llamps a Catalunya, Nota D’estudi del Servei Meteorològic de Catalunya; Generalitat de Catalunya B-7024-2011; Generalitat de Catalunya: Barcelona, Spain, 2011; Volume 73, ISBN 9788439387282. (In Catalan) [Google Scholar]
  44. Anderson, G.; Klugmann, D.A. European lightning density analysis using 5 years of ATDnet data. Nat. Hazards Earth Syst. 2014, 14, 815–829. [Google Scholar] [CrossRef]
  45. Poelman, D.R.; Schulz, W.; Diendorfer, G.; Bernardi, M. The European lightning location system EUCLID–part 2: Observations. Nat. Hazards Earth Syst. Sci. 2016, 16, 607–616. [Google Scholar] [CrossRef]
  46. Aran, M.; Peña, J.C.; Pineda, N.; Soler, X.; Perez-Zanon, N. Ten-year lightning patterns in Catalonia using Principal Component Analysis. In Proceedings of the 8th European Conference on Severe Storms—ECSS 2015, Wiener, Neustadt, Austria, 14–18 September 2015. [Google Scholar]
  47. Servei de Prevenció d’Incendis Forestals, Departament d’Agricultura, Ramaderia, Pesca i Alimentació, Generalitat de Catalunya (GENCAT). Base de Dades D’incendis Forestals. Available online: http://sac.gencat.cat/ (accessed on 15 March 2023).
  48. Centre de Recerca Ecològica Aplicada i Forestal (CREAF) Land Cover Map of Catalonia (v.2017). Available online: https://www.creaf.uab.es/mcsc/esp/index.htm (accessed on 15 March 2023).
  49. Servei Meteorològic de Catalunya (SMC). Anuari de Dades Meteorològiques. Available online: https://www.meteo.cat/wpweb/climatologia/serveis-i-dades-climatiques/anuaris-de-dades-meteorologiques/xarxa-de-deteccio-de-descarregues-electriques/ (accessed on 14 May 2022).
  50. Alcasena, F.J.; Ager, A.A.; Bailey, J.D.; Pineda, N.; Vega-García, C. Towards a comprehensive wildfire management strategy for Mediterranean areas: Framework development and implementation in Catalonia, Spain. J. Environ. Manag. 2019, 231, 303–320. [Google Scholar] [CrossRef]
  51. Pineda, N.; Montanyà, J. Lightning detection Spain: The particular case of Catalonia. In Lightning: Principles Instruments and Applications; Betz, H.-D., Schumann, U., Laroche, P., Eds.; Springer: Dordrecht, The Netherlands, 2009; pp. 161–185. [Google Scholar]
  52. Copernicus Climate Change Service (C3S). ERA5: Fifth Generation of ECMWF Atmospheric Reanalyses of the Global Climate. Copernicus Climate Change Service Climate Data Store (CDS). Available online: https://cds.climate.copernicus.eu/ (accessed on 15 March 2023).
  53. Rodríguez, O.; Bech, J. Tornadic environments in the Iberian Peninsula and the Balearic Islands based on ERA5 reanalysis. Int. J. Climatol. 2021, 41, E1959–E1979. [Google Scholar] [CrossRef]
  54. Rigo, T.; Rodríguez, O.; Bech, J.; Farnell, C. An observational analysis of two companion supercell storms over complex terrain. Atmos. Res. 2022, 272, 106149. [Google Scholar] [CrossRef]
  55. Larjavaara, M.; Pennanen; Tuomi, T. Lightning that ignites forest fires in Finland. Agric. For. Meteorol. 2005, 132, 171–180. [Google Scholar] [CrossRef]
  56. Flannigan, M.; Wotton, B. Lightning-ignited forest fires in northwestern Ontario. Can. J. For. Res. 1991, 21, 277–287. [Google Scholar] [CrossRef]
  57. Martell, D.L.; Sun, H. The impact of fire suppression, vegetation, and weather on the area burned by lightning-caused forest fires in Ontario. Can. J. For. Res. 2008, 38, 1547–1563. [Google Scholar] [CrossRef]
  58. Milne, R.M. A Modified Total Totals Index for Thunderstorm Potential over the Intermountain West. WR Tech. Attach. 2004, 4, 4–15. [Google Scholar]
  59. Sharples, J.; McRae, R.; Weber, R.; Gill, A. A simple index for assessing fire danger rating. Environ. Modell Softw. 2009, 24, 764–774. [Google Scholar] [CrossRef]
  60. Bates, B.C.; Dowdy, A.J.; Chandler, R.E. Classification of Australian thunderstorms using multivariate analyses of large-scale atmospheric variables. J. Appl. Meteorol. Climatol. 2017, 56, 1921–1937. [Google Scholar] [CrossRef]
  61. Kalashnikov, D.A.; Abatzoglou, J.T.; Nauslar, N.J.; Swain, D.L.; Touma, D.; Singh, D. Meteorological and geographical factors associated with dry lightning in central and northern California. Environ. Res. Clim. 2022, 1, 025001. [Google Scholar] [CrossRef]
  62. ThunderR. ERA5 Sigma Levels Browser Europe. 2022. Available online: http://www.rawinsonde.com/ERA5_Europe/ (accessed on 15 July 2022).
  63. Wallmann, J. A procedure for forecasting dry thunderstorms in the Great Basin using the dynamic tropopause and alternate tools for assessing instability. NOAA/NWS WR Tech. Attach 2004, 4–8. [Google Scholar]
  64. Wallmann, J.; Milne, R.; Smallcomb, C.; Mehle, M. Using the 21 June 2008 California lightning outbreak to improve dry lightning forecast procedures. Weather Forecast. 2010, 25, 1447–1462. [Google Scholar] [CrossRef]
  65. Welch, B.L. The generalization of Student’s problem when several different population variances are involved. Biometrika 1947, 34, 28–35. [Google Scholar] [CrossRef] [PubMed]
  66. Moder, K. How to keep the Type I Error Rate in ANOVA if Variances are Heteroscedastic. Austrian J. Stat. 2007, 36, 179–188. [Google Scholar] [CrossRef]
  67. Johns, R.H.; Doswell, C.A., III. Severe local storms forecasting. Weather Forecast. 1992, 8, 559–569. [Google Scholar] [CrossRef]
  68. Doswell, C.A., III; Schultz, D.M. On the use of indices and parameters in forecasting severe storms. Electron. J. Sev. Storms Meteor. 2006, 1, 1–14. [Google Scholar] [CrossRef]
  69. Westermayer, A.; Groenemeijer, P.; Pistotnik, G.; Sausen, R.; Faust, E. Identification of favorable environments for thunderstorms in reanalysis data. Meteorol. Z. 2017, 26, 59–70. [Google Scholar] [CrossRef]
  70. Houston, A.L.; Niyogi, D. The sensitivity of convective initiation to the lapse rate of the active cloud-bearing layer. Mon. Wea. Rev. 2007, 135, 3013–3032. [Google Scholar] [CrossRef]
  71. Dudhia, J. Back to basics: Thunderstorms: Part 1. Weather 1996, 51, 371–376. [Google Scholar] [CrossRef]
  72. Nauslar, N.J. A Forecast Procedure for Dry Thunderstorms. Master’s Thesis, University of Nevada, Reno, NV, USA, 2010; p. 1484044. [Google Scholar]
  73. Dowdy, A.J. Climatology of thunderstorms, convective rainfall and dry lightning environments in Australia. Clim. Dyn. 2020, 54, 3041–3052. [Google Scholar] [CrossRef]
  74. Nag, A.; Murphy, M.J.; Schulz, W.; Cummins, K.L. Lightning locating systems: Insights on characteristics and validation techniques. Earth Space Sci. 2015, 2, 65–93. [Google Scholar] [CrossRef]
  75. March, V.; Montanyà, J.; Pineda, N. Negative Lightning Current Parameters and Detection Efficiency for Two Operational LLS in Catalonia (NE Spain). In Proceedings of the International Conference on Lightning Protection (ICLP), Shanghai, China, 11–18 October 2014. [Google Scholar]
  76. Schultz, C.J.; Nauslar, N.J.; Wachter, J.B.; Hain, C.R.; Bell, J.R. Spatial, Temporal and Electrical Characteristics of Lightning in Reported Lightning-Initiated Wildfire Events. Fire 2019, 2, 18. [Google Scholar] [CrossRef]
  77. Moris, J.V.; Conedera, M.; Nisi, L.; Bernardi, M.; Cesti, G.; Pezzatti, G.B. Lightning-caused fires in the Alps: Identifying the igniting strokes. Agric. For. Meteorol. 2020, 290, 107990. [Google Scholar] [CrossRef]
  78. MacNamara, B.R.; Schultz, C.J.; Fuelberg, H.E. Flash characteristics and precipitation metrics of Western US lightning-initiated wildfires from 2017. Fire 2020, 3, 5. [Google Scholar] [CrossRef]
  79. Taszarek, M.; Pilguj, N.; Allen, J.T.; Gensini, V.; Brooks, H.E.; Szuster, P. Comparison of Convective Parameters Derived from ERA5 and MERRA-2 with Rawinsonde Data over Europe and North America. J. Clim. 2021, 34, 3211–3237. [Google Scholar]
  80. Rodríguez-Pérez, J.R.; Ordóñez, C.; Roca-Pardiñas, J.; Vecín-Arias, D.; Castedo-Dorado, F. Evaluating lightning-caused fire occurrence using spatial generalized additive models: A case study in central Spain. Risk Anal. 2020, 40, 1418–1437. [Google Scholar] [CrossRef]
  81. Rodrigues, M.; Jiménez-Ruano, A.; Gelabert, P.J.; de Dios, V.R.; Torres, L.; Ribalaygua, J.; Vega-García, C. Modelling the daily probability of lightning-caused ignition in the Iberian Peninsula. Int. J. Wildland Fire 2023, 32, 351–362. [Google Scholar] [CrossRef]
  82. McCann, D.W. 1994: WINDEX—A New Index for Forecasting Microburst Potential. Weather Forecast. 1994, 9, 532–541. [Google Scholar] [CrossRef]
  83. George, J. Weather Forecasting for Aeronautics; Academic Press: London, UK, 1960; p. 673. [Google Scholar]
  84. Miller, R.C. Notes on Analysis and Severe-Storm Forecasting Procedures of the Air Force Global Weather Central; AWS Tech. Rpt. 200(rev); Air Weather Service, Scott AFB, IL: Kansas City, MO, USA, 1972. [Google Scholar]
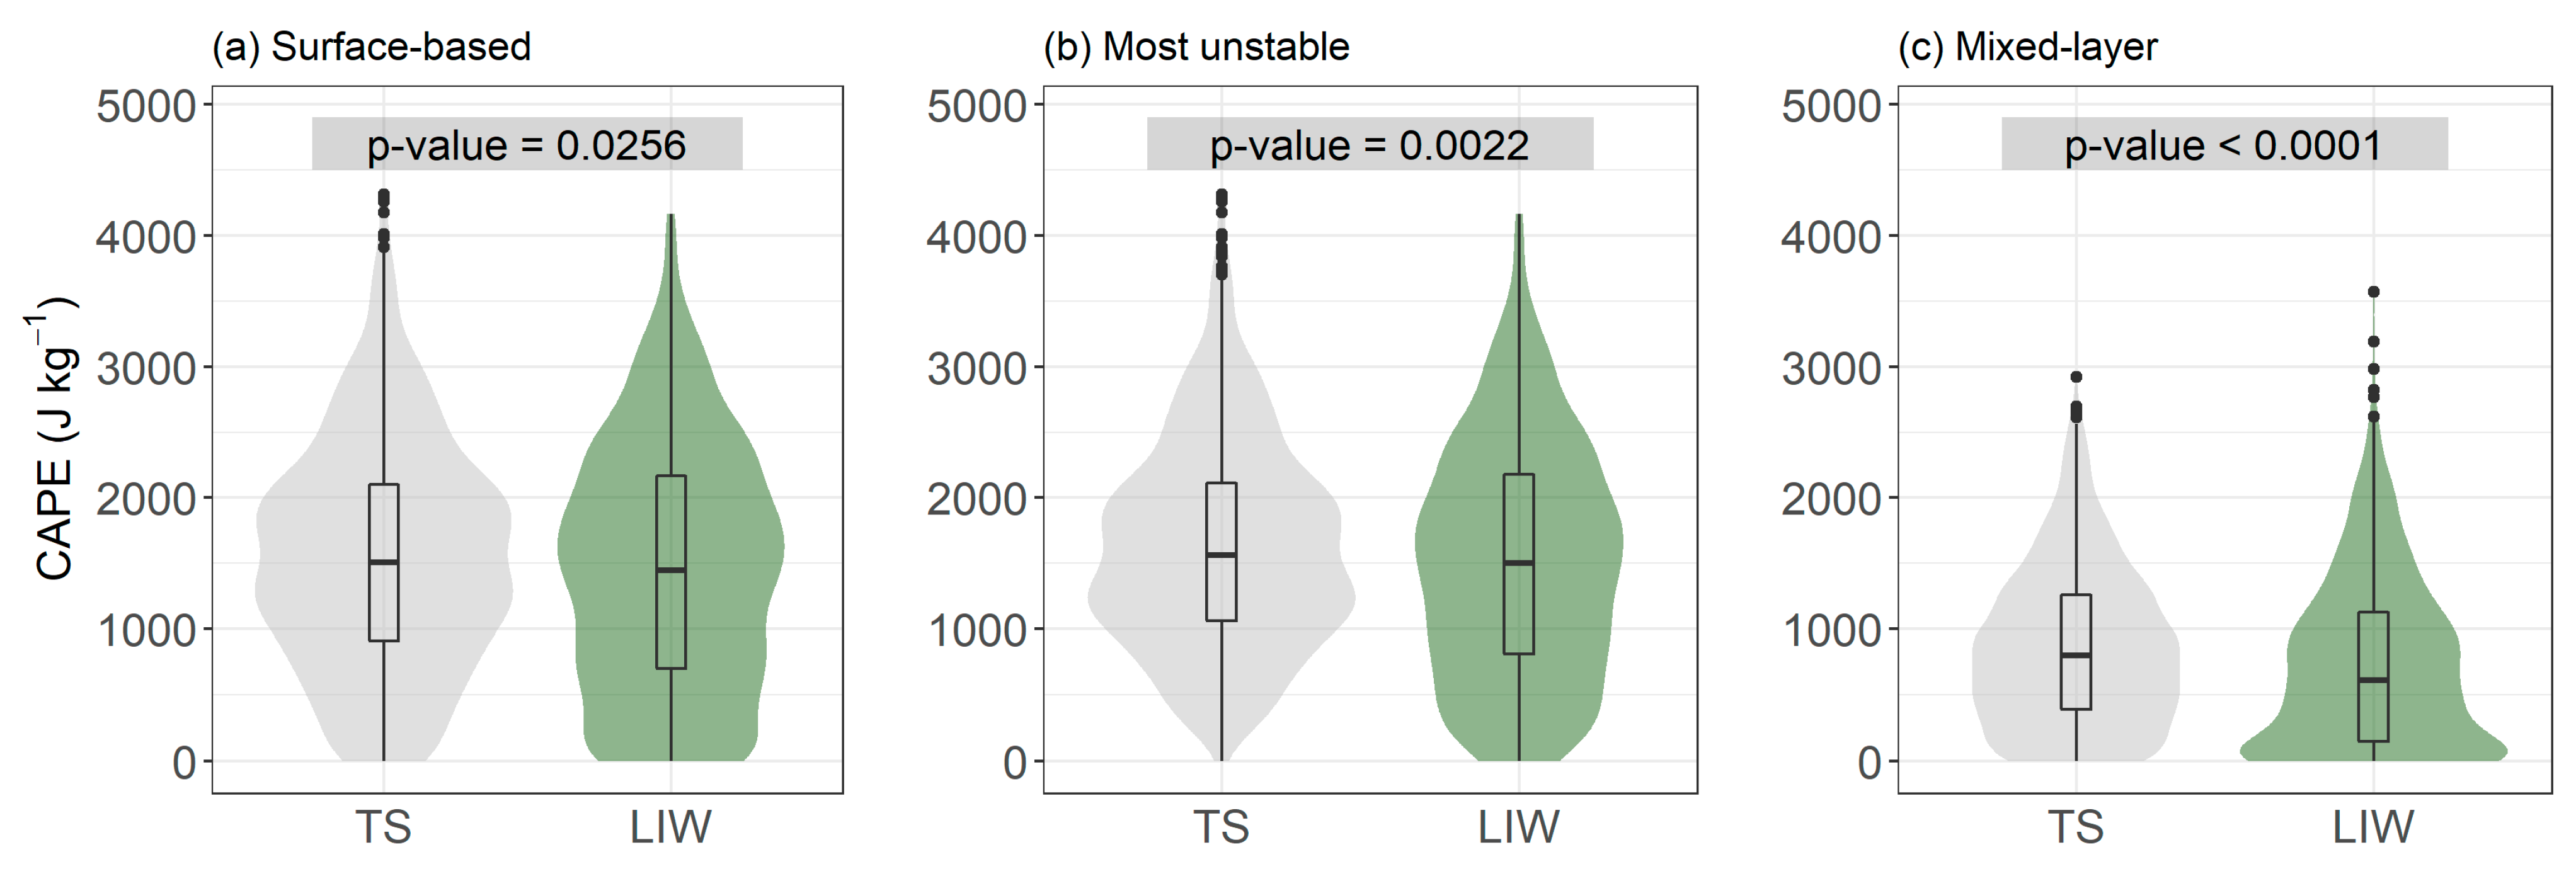
Figure 2. (a) Surface-based, (b) most-unstable, and (c) mixed-layer convective potential available energy (CAPE) for ordinary thunderstorms (TS) and for thunderstorms that caused reported LIWs in Catalonia. Violin plots include the shaded frequency density trace in addition to the boxplot, where the shape represents the density distribution. The inner boxplots displayed in the figures represent the interquartile range (IQR) and the median. There are significant differences between groups in the mixed-layer CAPE (Welch t-test p < 0.0001).
Atmosphere 14 00936 g002
Figure 3. (a) High-Level Total Totals Index (HLTT) and (b) Dew point at 850 hPa (DPD850) for ordinary thunderstorms (TS) and for thunderstorms that caused reported LIWs in Catalonia. There are significant differences between groups (Welch t-test p < 0.0001) in both indices.
Atmosphere 14 00936 g003
Figure 4. Scatterplot of TS and LIW cases as a function of the Dewpoint depression at 850 hPa (X–axis) and the temperature difference between 850 and 500 hPa (Y–axis). The upper and lateral plots show the density of the TS (blue) and LIW (red) for the dewpoint depression at 850 hPa and the temperature difference between 850 and 500 hPa, respectively.
Atmosphere 14 00936 g004
Figure 5. Lifted condensation level (LCL). Surface-based (left), most-unstable (centre), and mixed-layer LCL for ordinary thunderstorms (TS) and for thunderstorms that caused reported LIWs in Catalonia. There are significant differences between groups in the most-unstable LCL (Welch t-test p < 0.0001).
Atmosphere 14 00936 g005
Figure 6. Relative humidity (%) at two levels (0–2 km, 2–5 km) for ordinary thunderstorms (TS) and for thunderstorms that caused reported LIWs in Catalonia. There are significant differences at the lower level (0–2 km) but not at mid-levels.
Atmosphere 14 00936 g006
Figure 7. (a) Surface and (b) 850 hPa dew point depression (°C) for ordinary thunderstorms (TS) and for the four holdover categories in which the LIWs are subdivided. Surface dew point depression showed significant differences (p-value < 0.05) between TS and all four holdover categories. 850 hPa dew point depression presented significant differences between TS and the first three holdover categories.
Atmosphere 14 00936 g007
Figure 8. (a) Surface Temperature (°C) and (b) Surface Relative Humidity (%), for TS and the four holdover categories in which the LIWs are subdivided. Surface Temperature showed significant differences (p-value < 0.05) between ordinary thunderstorms and all four holdover categories, whereas Surface Relative Humidity presented significant differences between ordinary thunderstorms and the first three holdover categories.
Atmosphere 14 00936 g008
Figure 9. Fuel Moisture Index (FMI) for TS and the four holdover categories in which the LIWs are subdivided. The short-term category presented significant differences (p-value < 0.001) from the TS category. Contrarily, the other three holdover categories had no significant differences with TS.
Atmosphere 14 00936 g009
Figure 10. ERA5 reanalysis for 25 July 2014 at 06 UTC. 500 hPa geopotential height (in gpm, shaded colours and black lines), mean sea level pressure (in hPa, white lines), and 300 hPa wind (in kt).
Atmosphere 14 00936 g010
Table 1. ERA 5 parameters and derived indices analysed in this study, units, and brief comments.
ParameterUnitsComments
Convective Available Potential Energy (CAPE)J kg−1Using SB, ML, and MU parcels
Lapse rate (LR)°C km−1Between 700 and 500 hPa
Temperature (T)°CAt 2 m
Temperature difference (T850–T500)°CTemperature at 850 hPa and 500 hPa
Dew point depression (DPD)°CAt 850 hPa and 2 m
Relative humidity (RH)%At 2 m and between 0 and 2 km, and 2 and 5 km
Lifting condensation level (LCL)mUsing SB, ML, and MU parcels
High-level total totals (HLTT)°CAccording to Milne [58]
Fuel Moisture Index (FMI)dimensionlessAccording to Sharples et al. [59]
Disclaimer/Publisher’s Note: The statements, opinions and data contained in all publications are solely those of the individual author(s) and contributor(s) and not of MDPI and/or the editor(s). MDPI and/or the editor(s) disclaim responsibility for any injury to people or property resulting from any ideas, methods, instructions or products referred to in the content.