Article

Optimizing the Surrounding Building Configuration to Improve the Cooling Ability of Urban Parks on Surrounding Neighborhoods

School of Landscape and Architecture, Zhejiang A & F University, Hangzhou 311300, China
*
Author to whom correspondence should be addressed.
Atmosphere 2023, 14(6), 914; https://doi.org/10.3390/atmos14060914
Submission received: 15 April 2023 / Revised: 17 May 2023 / Accepted: 18 May 2023 / Published: 24 May 2023
(This article belongs to the Section Biometeorology)

Abstract

:
Urban parks reduce air temperatures within parks and surroundings by exerting the cooling island effect, significant for mitigating the urban microclimate. However, the park cooling effect may be influenced by the surrounding building configuration, and this needs to be studied in more detail, in particular, to explore how to maximize the cooling effect of parks by adjusting the surrounding building configuration. Thus, in this study, the effects of building height, building interval, and building orientation on the cooling effect of a small urban park were investigated using field measurements and ENVI-met numerical simulations. The results demonstrated that (1) building height, building interval, and building orientation all impact the park cooling effect, but their impacts vary. (2) Building height had the strongest effect on the park cooling intensity, and adjusting building height provided the maximum park cooling intensity (1.2 °C). (3) Building orientation had the most effect on the park cooling distance, 100 m downwind of the park. (4) The park cooling effect is best when the surrounding buildings were parallel to the prevailing wind direction, and the park cool island has the greatest intensity and range. This study can guide decision-makers in optimizing building configuration to maximize the park cooling effect.

1. Introduction

Rapid urbanization has led to the replacement of pre-existing natural surfaces with impermeable surface materials, which, combined with an increase in urban population and the massive generation of anthropogenic heat, has resulted in the gradual enhancement of the urban heat island (UHI) effect [1]. The high temperatures created by urban heat islands have become a serious impediment to the lives of city dwellers and even a fatal threat to their health. Studies have shown a significant increase in the incidence of heat-related illnesses and mortality among urban dwellers [2,3]. In addition, higher temperatures increase the energy consumption for cooling in the summer [4,5] and pollutant emissions [6]. Consequently, government departments and scholars are paying close attention to urban climate issues and are working to find strategies to mitigate continued urban warming. Numerous studies have shown that measures, such as cool roofs, high-albedo pavements, and vegetation, can effectively mitigate urban heat [7,8,9,10,11,12]. Among these, urban green infrastructure is considered an effective way to mitigate urban warming [13,14].
Urban parks are the mainstay of urban green infrastructure, and numerous studies have demonstrated that the air temperature inside parks is lower than that in their surrounding urban areas. This phenomenon is referred to as the “park cool island” (PCI) effect (Figure 1), and the difference in temperature between the park and the surrounding built-up area is defined as the “park cool island intensity” (PCII) [11,15,16,17,18]. After thoroughly comparing and analyzing 47 studies on the cooling effect of parks, Bowler et al. [15] confirmed that parks have a significant cooling effect, with an average cooling intensity of 0.94 °C during the day. In India, 263 urban green spaces were evaluated for their ability to reduce temperatures; the average cooling effect of these urban green spaces was 2.23 °C, with a range of 2.13–2.33 °C [10]. Furthermore, the ‘park breezes’ created by cooler air in the park spread to the surrounding urban areas [19,20], thereby reducing the ambient air temperature (Figure 1) [19,21,22,23]. Numerous studies have found that the park cooling extent in the surroundings is roughly equal to the width of the park [24,25]. This is a property of the park’s cool air propagation to the surrounding environment, which reduces the air temperature of the park surroundings [23,26]. This is crucial for improving the thermal comfort of urban dwellers in summer and for combating urban climate change and achieving sustainable urban development.
A park cooling island is a complex phenomenon formed by a combination of many factors, and numerous scholars have conducted studies on it and the factors that contribute to it. On the one hand, studies have demonstrated that the park cooling effect is influenced by its own characteristic factors [27], such as the size of the park [10,17,28,29], the shape of its boundaries [30], and the composition and layout of its landscape elements [31,32,33,34]. Among these, park size is thought to be the most significant factor influencing the park cooling effect [35], as supported by Geng et al. [36], for parks in various local background climates. It has been demonstrated that there is a non-linear positive correlation between the park cooling intensity and park size [17]. However, according to certain studies, small green spaces can achieve the same cooling intensity as large green spaces. For instance, Oliveira et al. [23] assessed a 0.24-ha small green space in a high-density neighborhood and its environs in Lisbon and discovered that there may be a 6.9 °C temperature differential between the inside of the green space and its surroundings. Therefore, smaller green spaces are more effective in cooling than larger ones [37]. There is an area threshold that maximizes cooling efficiency, called the threshold value of efficiency (TVoE) [29]. TVoE has been thoroughly investigated and verified in different regions. For example, Yao et al. [28] investigated the surface temperature of 31 urban parks in Fuzhou, China, and found that the optimal economic area of urban green space was 1.08 ha. Large and centrally distributed green spaces are often difficult to achieve in the context of high-density urban development. In contrast, small green spaces can be widely and evenly distributed in cities and have a much better cooling potential [38,39]. Therefore, it is important to investigate the cooling effect of small urban green spaces.
On the other hand, the design of the surrounding buildings, including building density and building geometry, can also affect the park cooling effect. Many researchers have studied the cooling effect of parks on the surrounding environment and found that the air temperature in parks was lower than those of the surrounding built environment, and parks had a cooling effect on the surrounding environment [18,40]. Not only that, the cooling extent of the parks was influenced by the height and layout of the surrounding buildings [18]. Hamada and Ohta [40] also found that wide, congested roads or high-rise buildings limit the impact of the park cooling effect. The configuration of the surrounding building was directly related to the cooling effect of the green areas in the surrounding area. Additionally, the effect of surrounding buildings on the park cooling effect may be attributed to the fact that the surrounding buildings affect the microclimate conditions around the park. By observing the temperatures in two parks and the surrounding central business district in Seoul, Korea, Lee et al. [41] discovered that the dispersion of park cool air in the built-up area was influenced by the surrounding buildings. Of more significance is the critical impact of the built environment layout around urban parks on building energy consumption. By establishing different built environment layouts around urban parks, it is confirmed that a sparse high-rise is more conducive to the diffusion of park cool air than a compact high-rise, thus reducing building cooling energy consumption [42]. In the context of urbanization, the impact of buildings on park cooling continues to be tracked. Ruiz et al. evaluated the evolution of the cooling effect of the central park and its surrounding built environment in the city of Mendoza, Argentina, over a 10-year period, showing that the densification of the surrounding built environment has increased the thermal inertia of the built environment and the role of parks as thermal regulators; the thermal benefits of the park have changed from being experienced in the evening to the afternoon [43].
However, most existing studies only provided a qualitative description of or mention the impact of the building configuration around the park on the park cooling effect, without elaborating on the quantitative relationship between various configuration factors and the park cooling effect or the most significant factors affecting the park cooling effect, making them ineffective as planning and design guidelines for the built environment around parks.
The cooling effect of urban parks has been studied using field measurements, remote sensing observations, and numerical simulations [8,10,13,44]. Over the past 30 years, scholars have conducted detailed investigations of the cooling effect of parks through field measurements, confirming that the park cooling effect that spreads outside the park and cools the surrounding urban environment [22,23,45], and in the vertical direction, using hot air balloon measurements, confirmed that the cooing effect of parks could spread over a distance of 50 m in the vertical direction [20]. In addition, remote sensing observation methods complement in situ measurements in terms of scale and magnitude [26,37,39]. Numerical modelling has been applied extensively in urban park cooling effect studies [11,46,47]; Sodoudi et al. [47] investigated the cooling effect of green spaces with different layout patterns through numerical simulations, showing that clustered green spaces have a better cooling effect than dispersed green spaces and that green spaces that are parallel (or nearly parallel) to the wind direction have better cooling effect. Lai et al. [11] explored the effects of different tree layouts on the microclimate of the park. The air temperature in the simulated scenarios for all types of layouts was reduced by values within 1 °C, with the main effect of tree layout being on the distribution of wind, creating larger areas of low wind speed in the downstream areas of the trees. In addition, numerical simulations can provide scientific predictions of cooling effects in urban parks by building idealized urban models and accurately predicting the cooling effects under different scenarios [48].
Based on this, this study examines the influence of surrounding building configuration factors (building height, building interval, and building orientation) on the park cooling effect using the ENVI-met numerical simulation, taking the Chunqiu park in Hangzhou as a case study. Specifically, this study aims to (1) determine whether the configuration characteristics of the surrounding buildings affect the cooling effect of the park and (2) quantify the effects of different building heights, building intervals, and building orientations on the intensity and extent of the cooling effect of the park.

2. Methodology

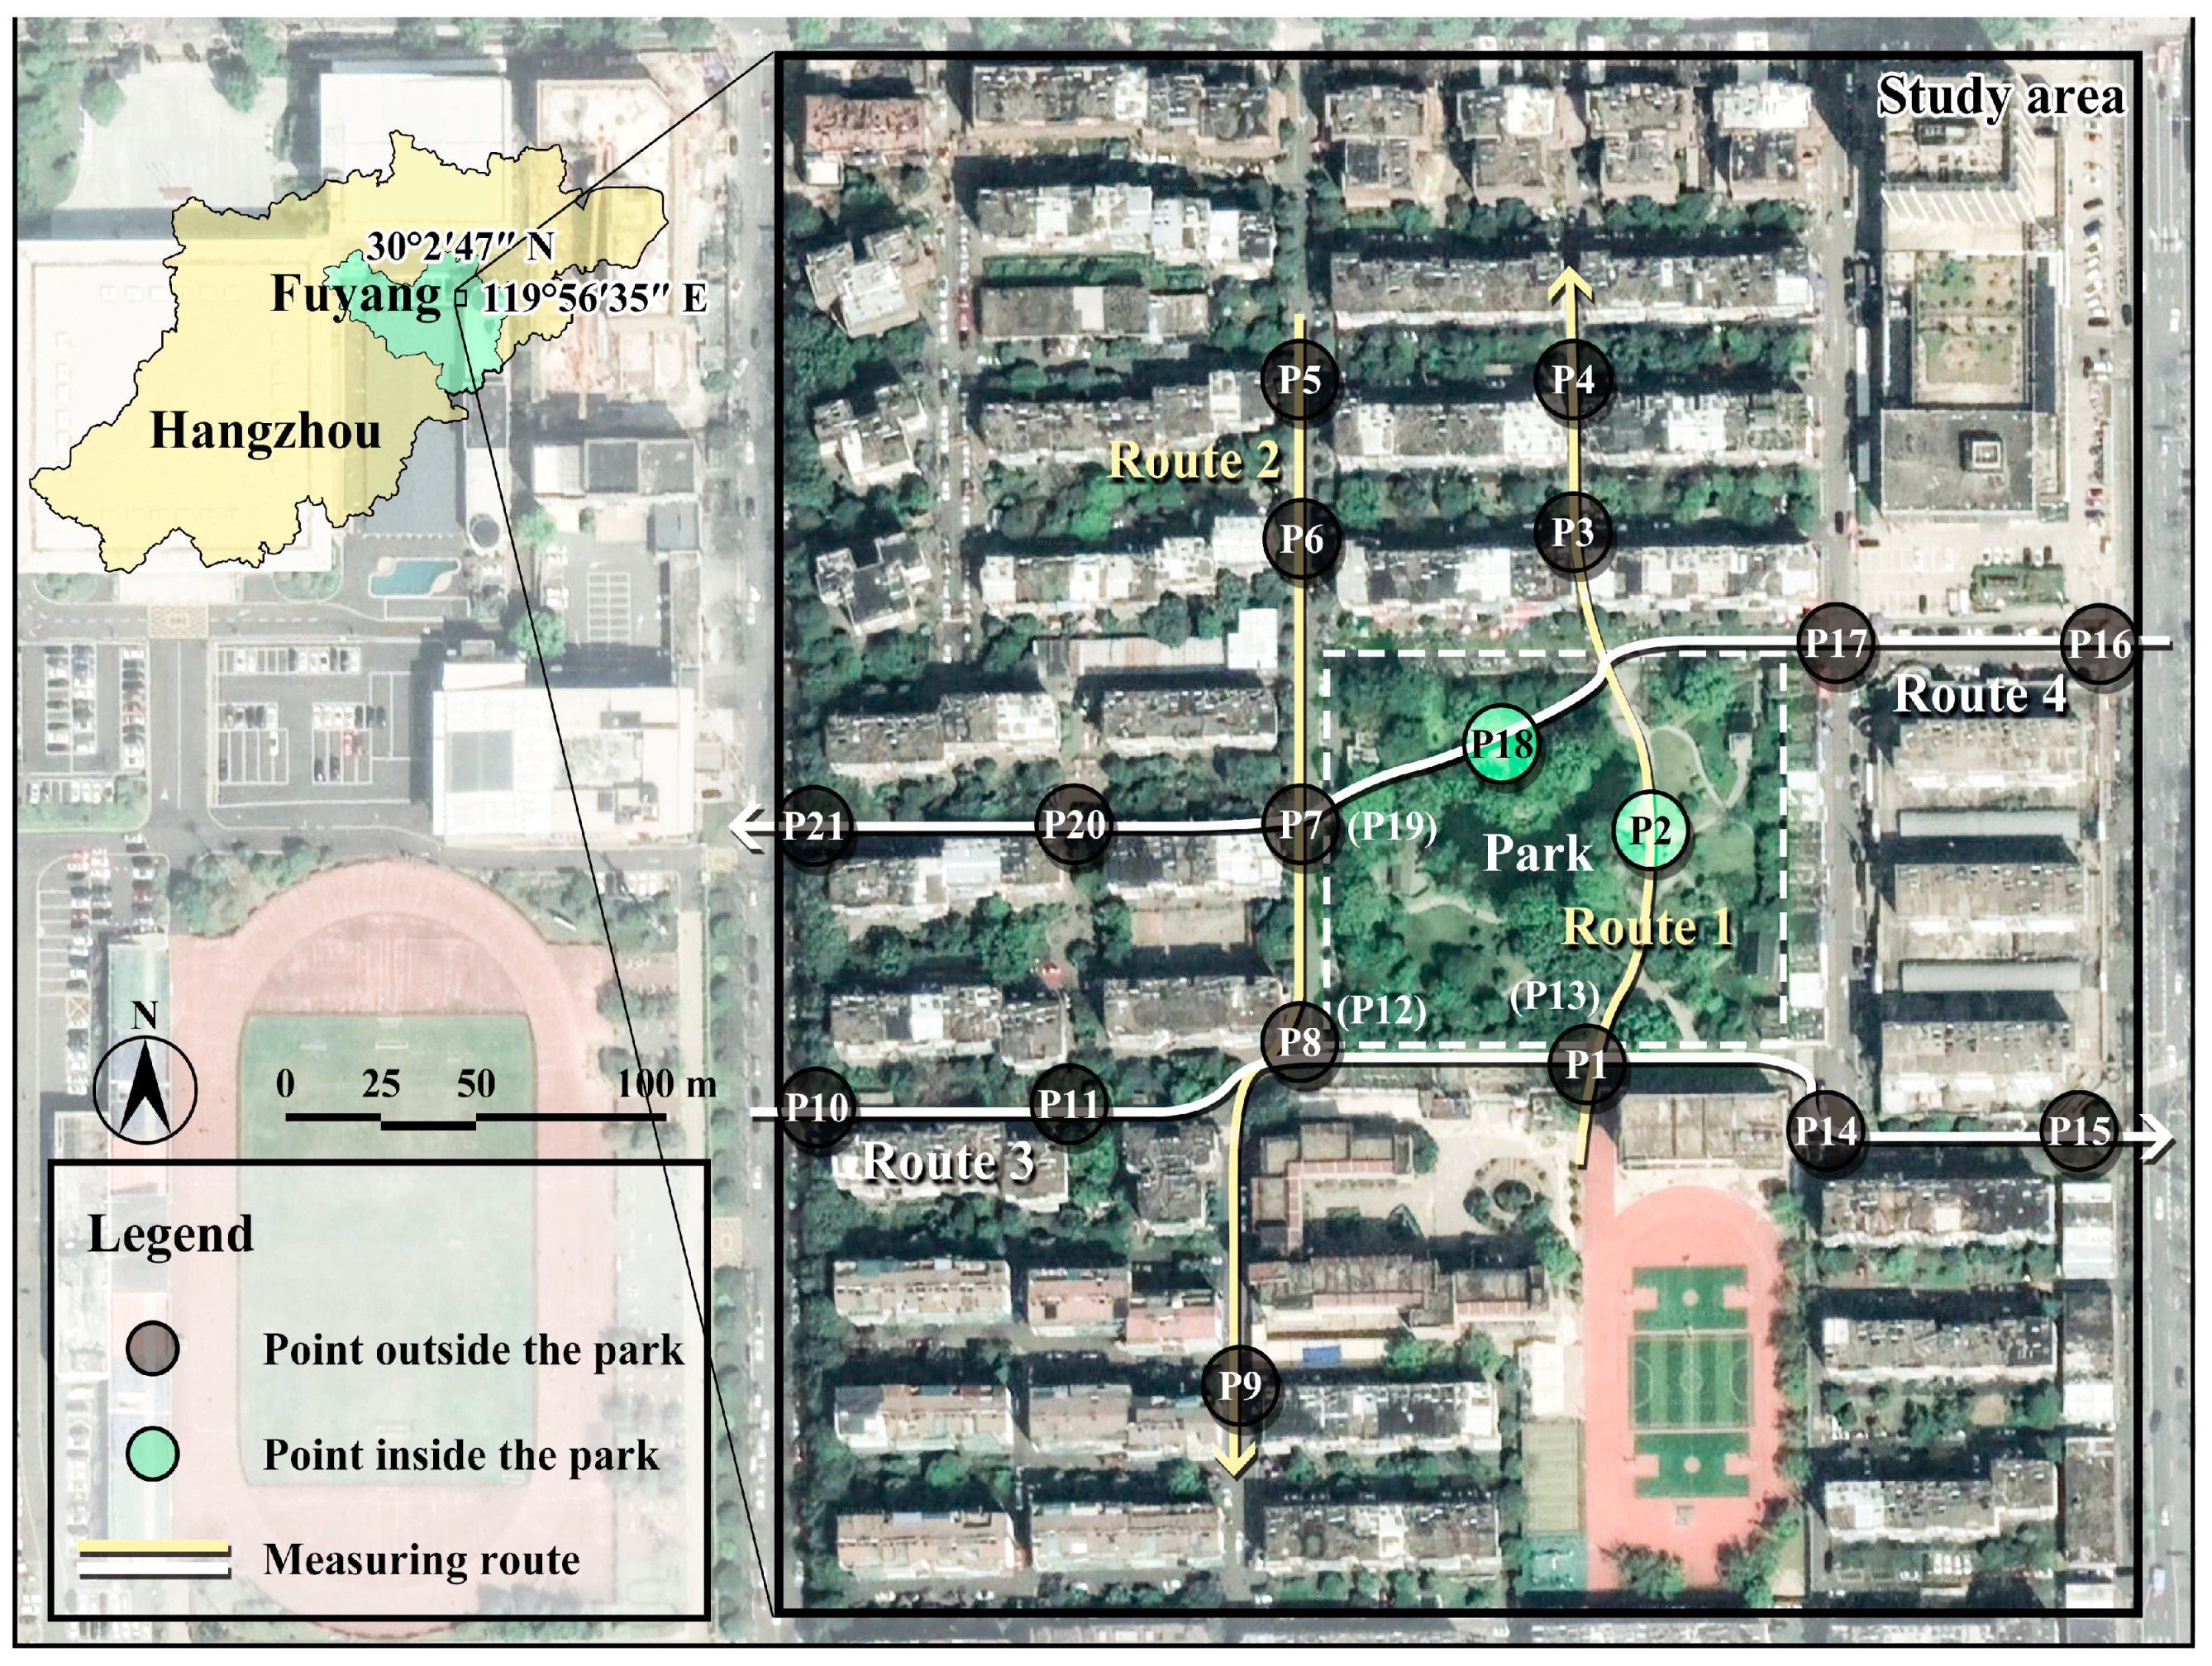
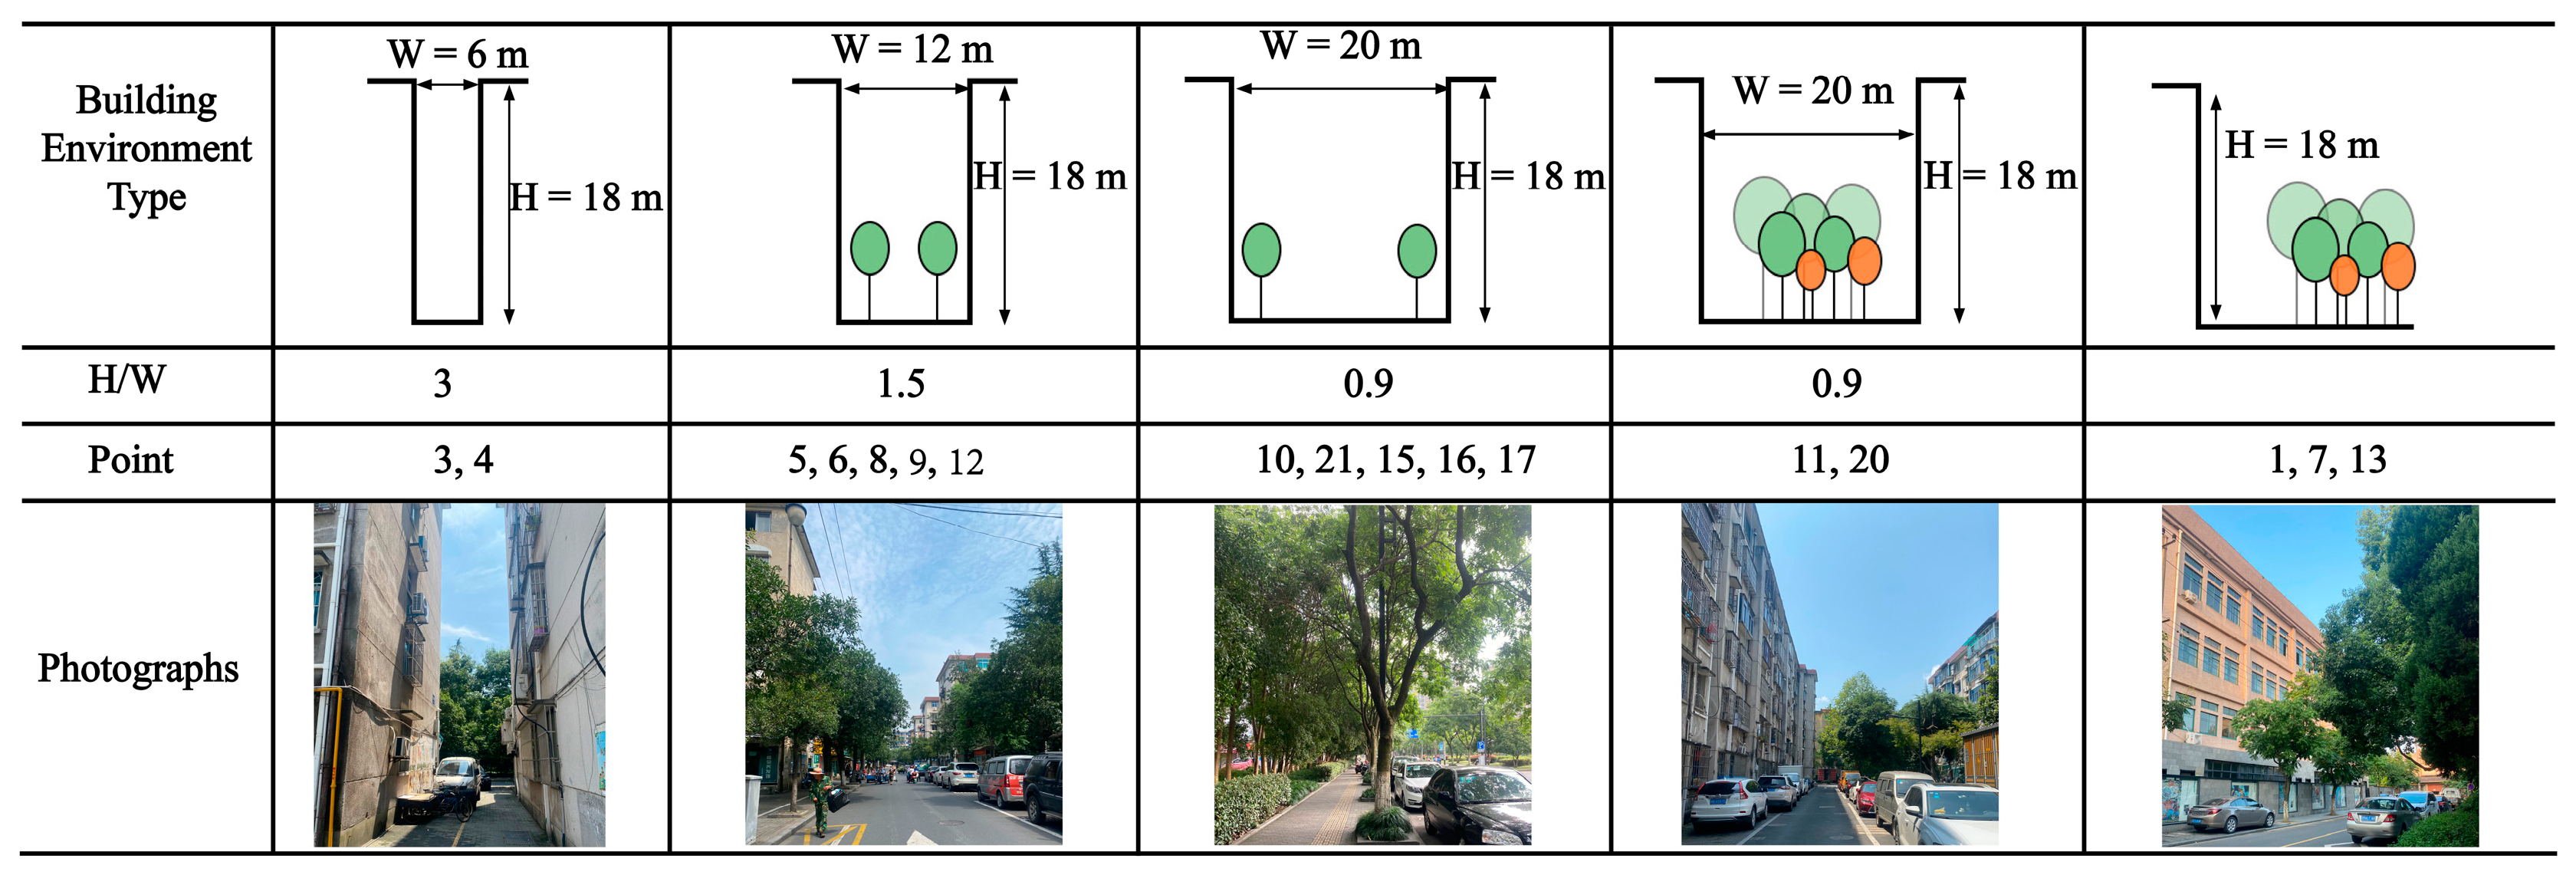
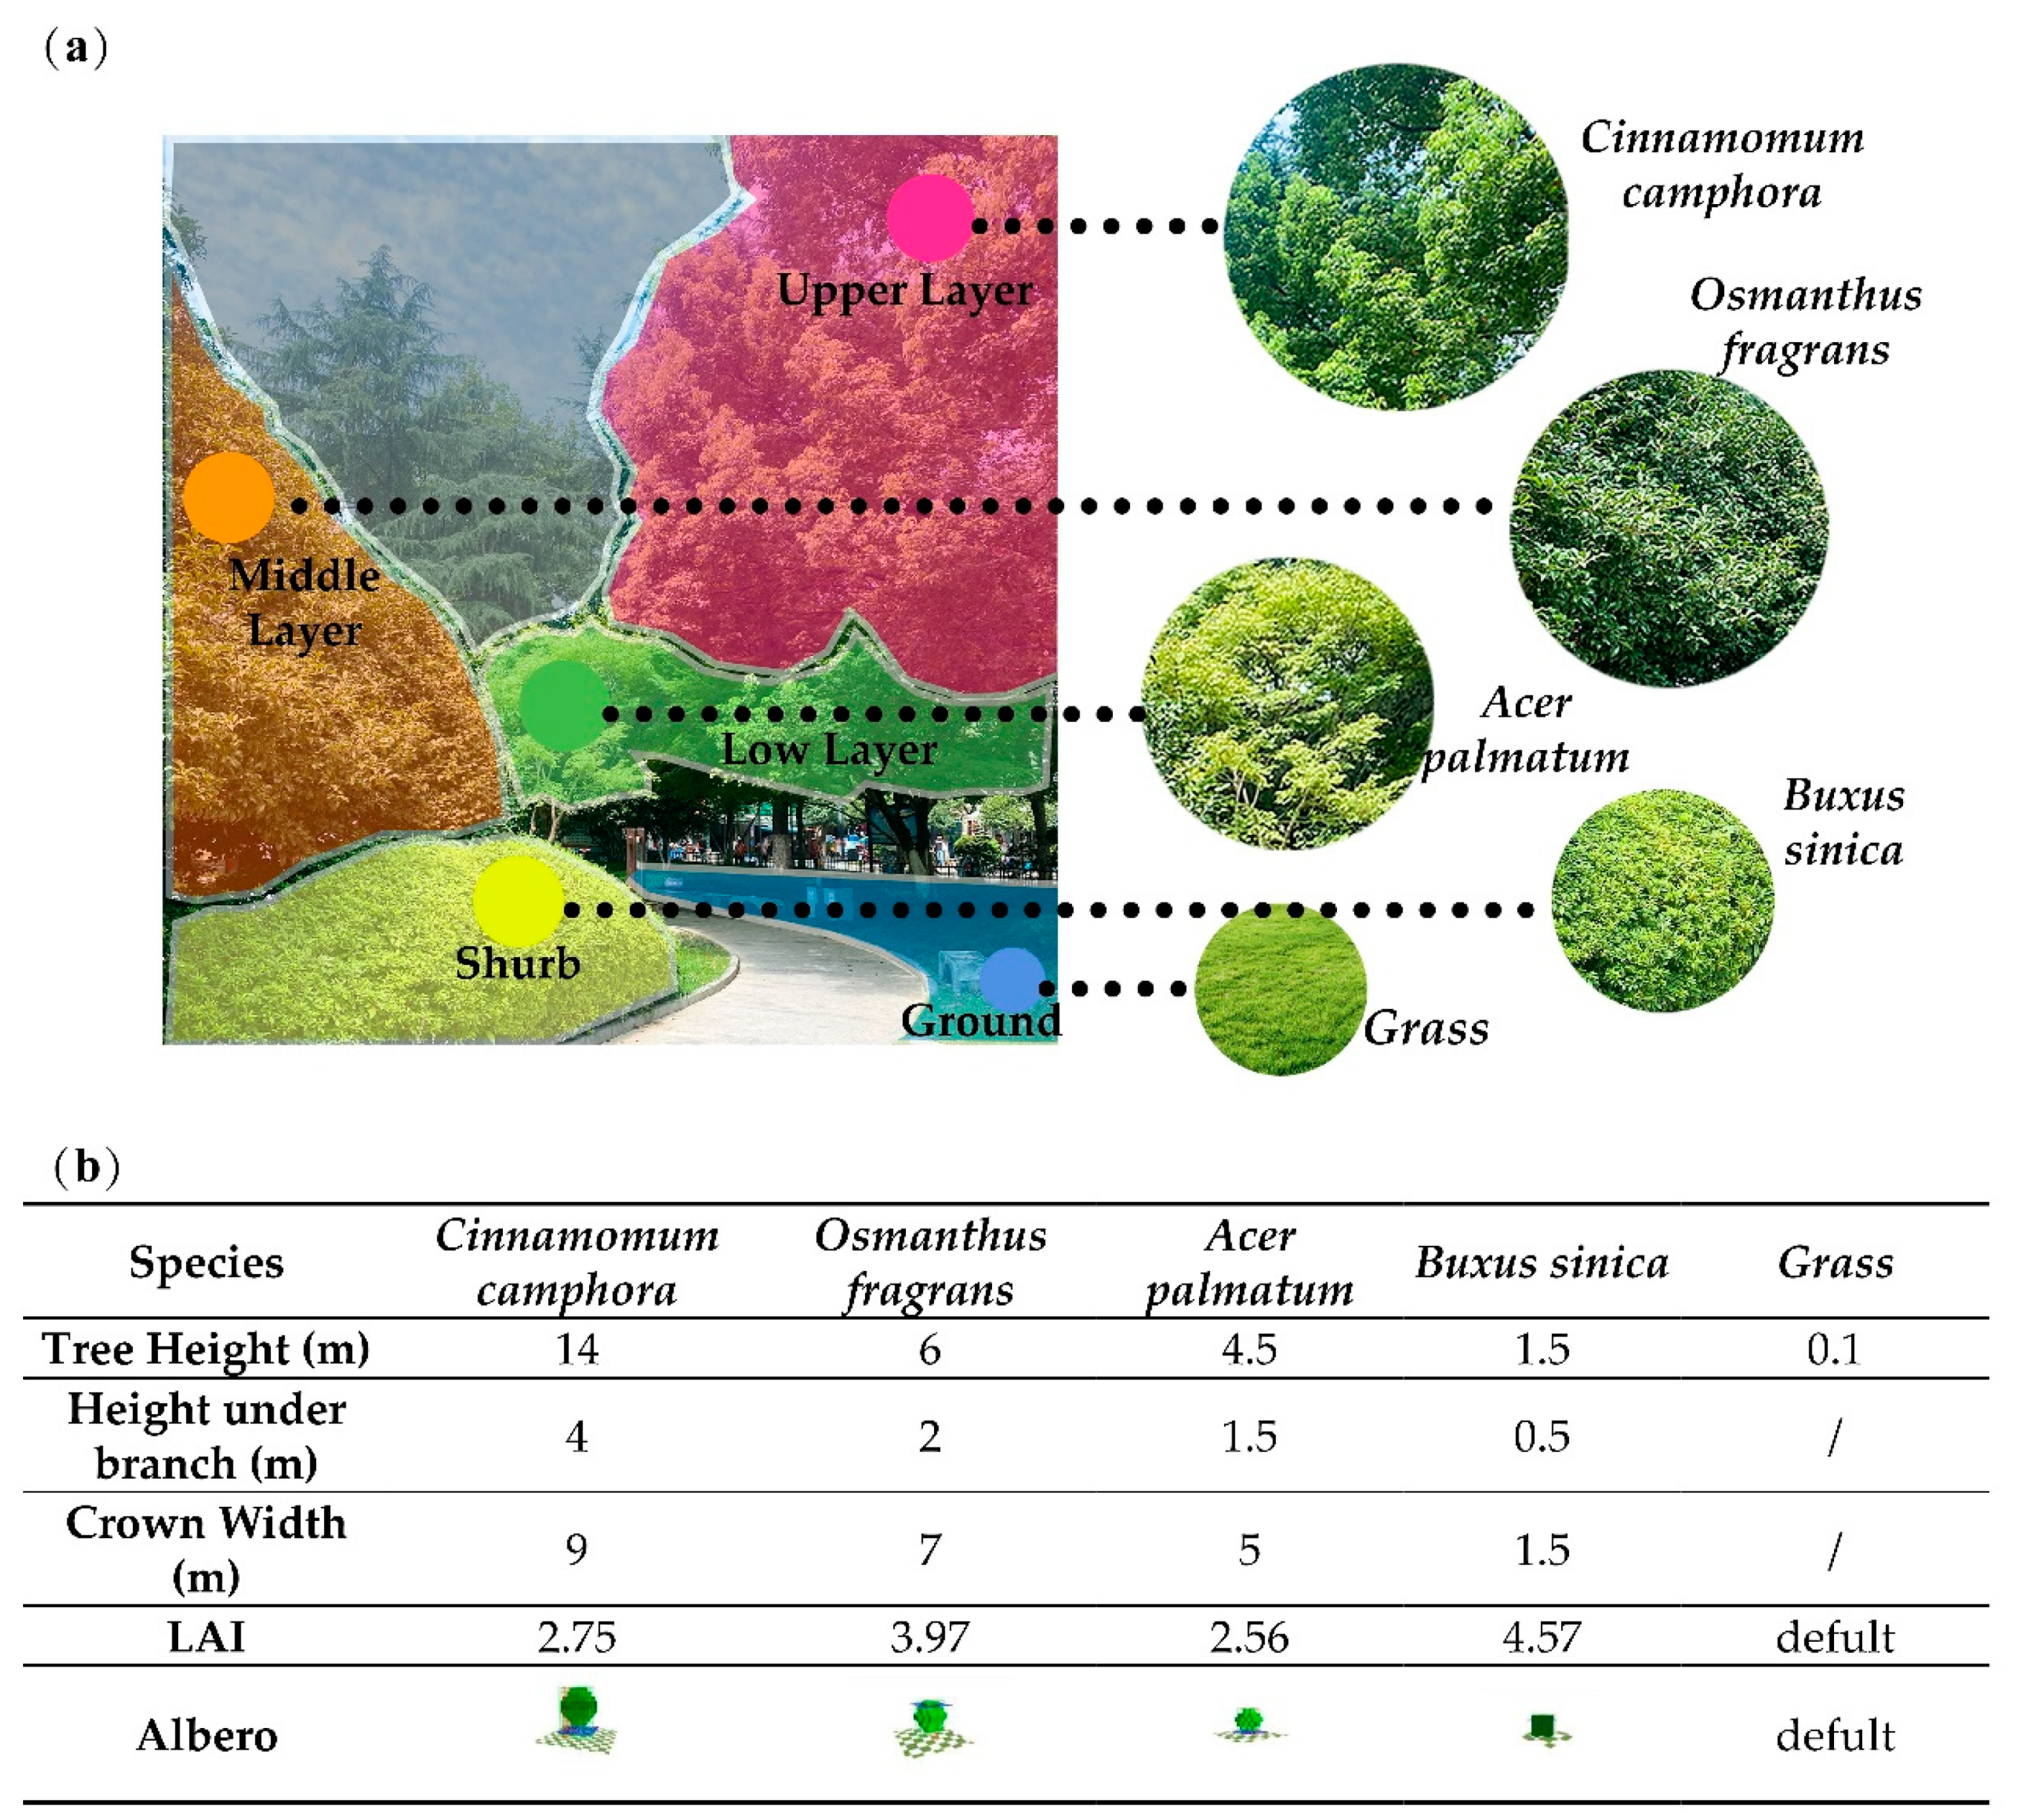
2.1. Study Area and Site Description

This study was conducted in Hangzhou (30.2° N, 119.6° E), located on the south-eastern coast of China. It has a subtropical monsoon climate (Cfa under the Koppen–Geiger climate classification), which is marked by scorching summers, chilly winters, and prevailing east wind. The average temperature throughout the year is 17.8 °C, and the average relative humidity is 70.3%. Hangzhou is located in the hot summer and cold winter region of China, which is characterized by a hot and humid climate in summer. This weather type is extremely detrimental to human thermal comfort. This region accounts for 1/5 of China’s land area and is mostly located in the middle and lower reaches of the Yangtze River, with a developed economy and dense population. Therefore, the exploration of the Hangzhou region as an example is also of great guidance for building configurations to other cities in the same type of region.
Chunqiu Park and its surroundings, located in the Fuyang District of southwest Hangzhou, were the study sample sites. Figure 2 shows the location of the study area and distribution of the measurement routes and sites. The park has a 1.08 ha area and the east, south, west, and north sides of the park’s border have respective buffer distances of 75, 90, 120, and 75 m. Natural vegetation predominates throughout the park, accounting for 73.96% of the vegetation and 17.85% of the water bodies. The park surrounding built-up area is a typical local residential neighborhood that is categorized as a compact medium (LCZ 2) by the local climate zone (LCZ) classification system [49], with structures 18 m tall and a building coverage ratio of 36.82%, and the width of the road can be divided into three classes, which are 6 m, 12 m, and 20 m. Figure 3 shows the characteristics of the built environment outside the park.

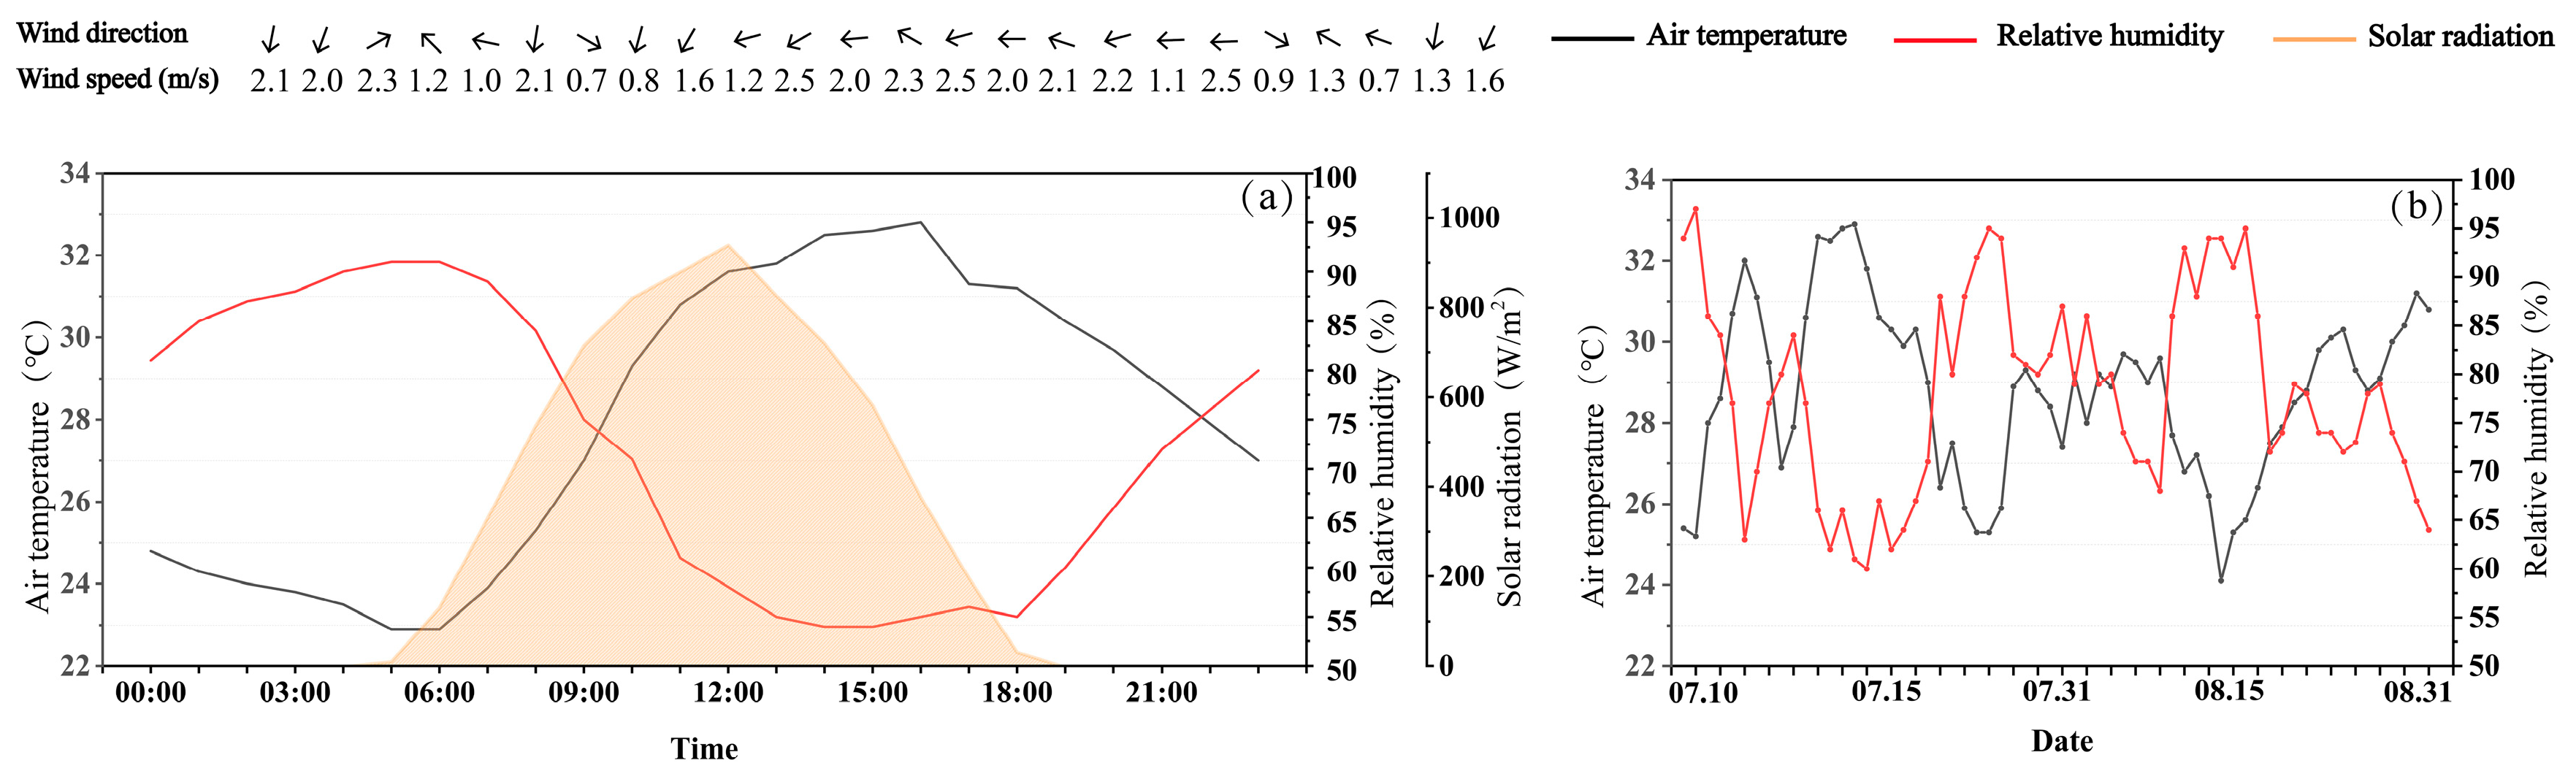
2.2. Field Measurement

On 19 August 2021, mobile traverses were used to collect data on the air temperature (Ta) and relative humidity (RH) every two hours from 8:00 to 22:00. All observations were conducted on clear and windless days. The measurement campaign was performed sequentially according to the (R1-R2-R3-R4) route (each measurement starts at P1 and ends at P21), and the time required to complete the four routes was approximately 25 min. During the measurement, a radiation shield containing a TES1365 temperature and humidity meter (0.4 °C for temperature and 3% RH for humidity) was positioned 1.5 m above the ground. The location of the measurement points and the amount of time that passed were both recorded using the Garmin eTrex10 GPS logger. The measurement approach remains consistent throughout the measurement campaign. Figure 4a shows the weather data on 19 August 2021 recorded by the Fuyang District Meteorological Bureau (54489), including air temperature, relative humidity, solar radiation, wind direction, and wind speed.

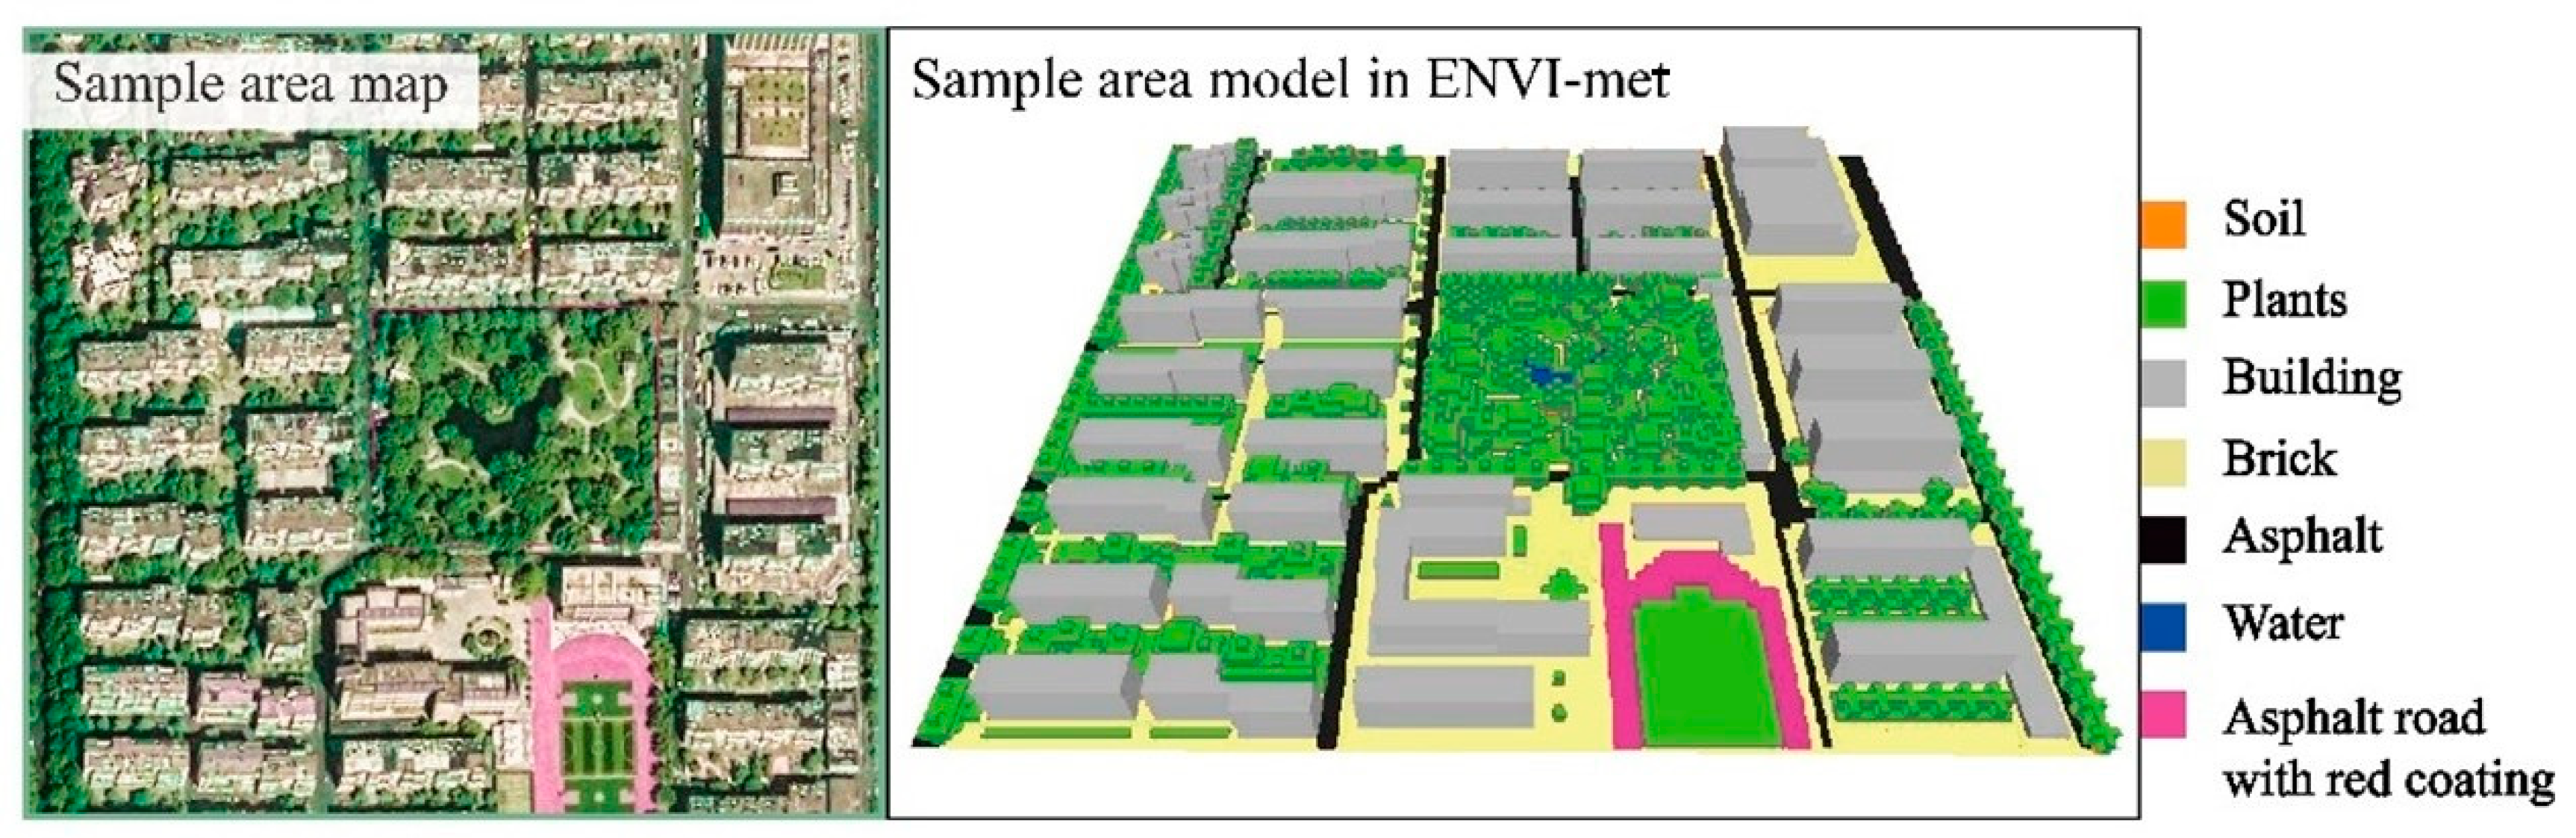
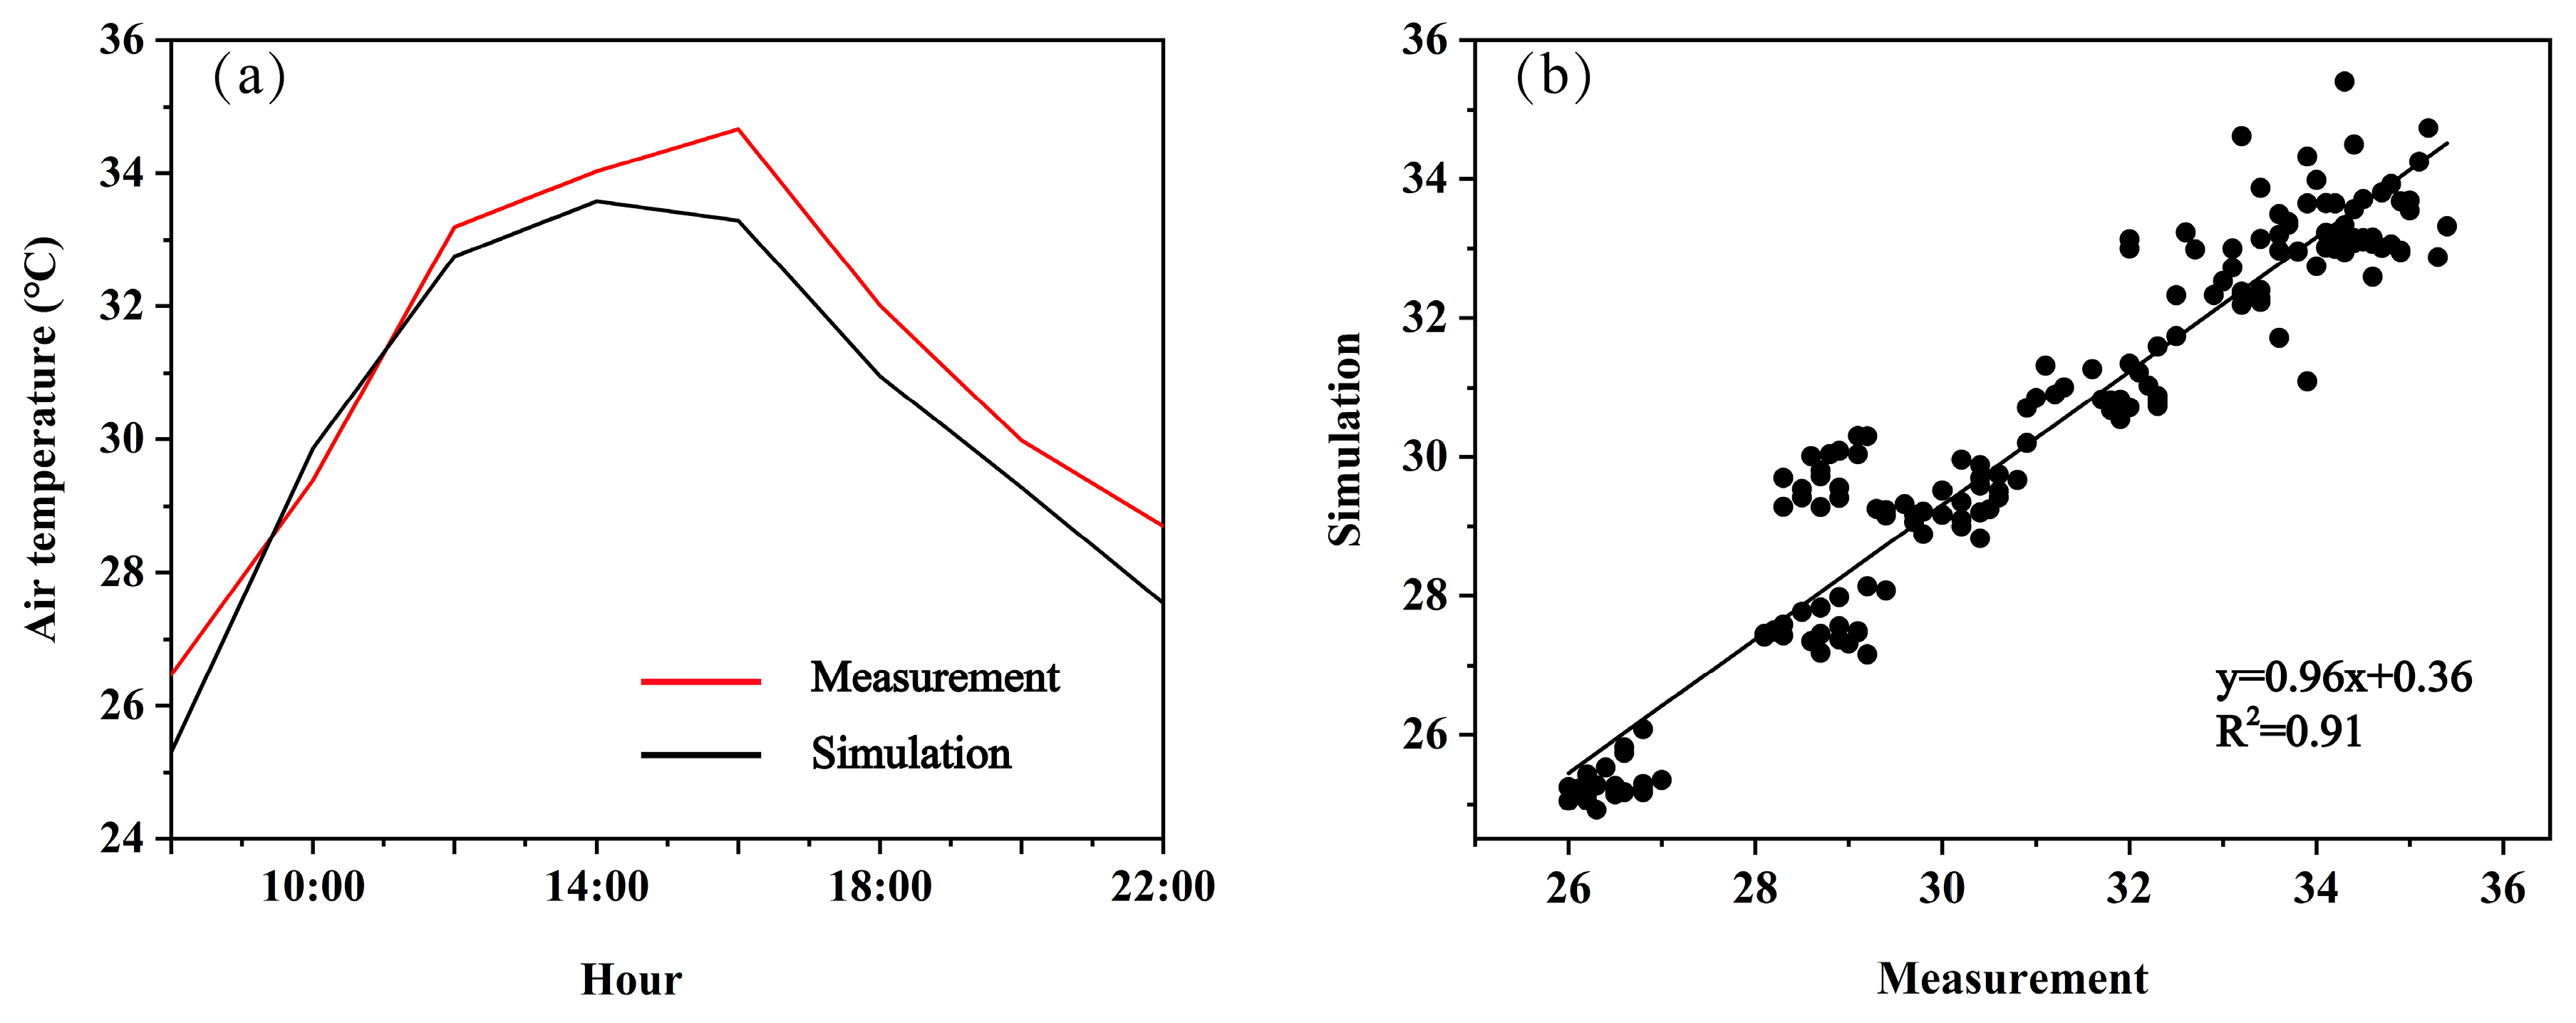
2.3. ENVI-Met Model Verification

ENVI-met is a grid-based numerical simulation software for three-dimensional models. Based on the fundamentals of fluid dynamics and thermodynamics, ENVI-met replicates microscopic qualities in urban environments and evaluates the effects of the atmosphere, greenery, buildings, and materials by modelling the interaction of the ground and plants with air [50]. The model input file and input file for the meteorological boundary conditions are required by ENVI-met [51]. ENVI-met has been widely applied in urban climate studies [46,52] and has been validated to produce relatively accurate results under multitudinous climatic conditions [13].
To verify the viability of applying ENVI-met software in Hangzhou, the sample plots of this study were used to conduct verification. ENVI-met (V4.4.5) was used in this study. The initial stage was to create a model input file, which means constructing a basic model based on the conditions of the sample site. First, the spatial context of the model was established. A 3D scene with a grid size of 152 × 141 × 18 was created, including sufficient buffer areas (blank grids) reserved around the sample plots to eliminate boundary effects. The grid resolution for the horizontal X- and Y-axes and the vertical Z-axis was 3. The latitude and longitude coordinates of the sample site (30°29′ N, 120°16′ E) were entered into the model location, which was related to the radiation of the model. Then, the sample site was gridded one by one for elements such as buildings, vegetation, and paving. The ENVI-met 3D model scene of the sample site is shown in Figure 5. The input parameters for buildings, paving, etc., in ENVI-met are listed in Table 1, and input parameters for the plants are in Figure 6. Additionally, the plant models were 3D-Plants, generated by using the ENVI-met tree establishment method [13,53]. This method requires the plant leaf area index (LAI) values of the plants; therefore, we referred to the relevant results from studies in the same area [54]. LAI was transformed into the plant leaf area density (LAD) required to build the plant model according to Equation (1).
L A I = 0 h L A D . Δ Z
where h is tree height (m), ΔZ is vertical grid size (m), LAI is leaf area index, and LAD is leaf area density (m2/m3).
The second step was to set up the meteorological boundary condition input file. The meteorological data (air temperature, relative humidity, the wind speed, wind direction, and solar radiation data) were provided by the Fuyang District Meteorological Bureau on 19 August 2021; these weather data are shown in Figure 4a. Owing to the ENVI-met software development constraints, the wind direction and speed were maintained at the original set values throughout the simulation. Table 2 lists the meteorological parameters used in the validation simulation.
A correlation analysis between the measurement and simulation air temperature results was performed to verify the feasibility of the ENVI-met model. Figure 7a depicts the variation of measurement and simulation temperatures at 1.5 m above the ground from 08:00 to 22:00 on 21 August 2021, and Figure 7b shows the correlation analysis between the measurement and simulation results. The two curves roughly coincide, and the coefficient of determination (R2) between the measurement and simulation values was 0.91; also, the RMSE was 1.1. R2 values between 0.52 to 1 and RMSE values between 0.26 to 4.83 proved to be valid results in the previous study [55]. These statistics indicate a high degree of agreement between the measurement and simulation values both during the day and night, and the model ran stably throughout the simulation period. ENVI-met can be implemented further to simulate many simulation situations and analyze the temperature distribution patterns both within and outside the park accurately.

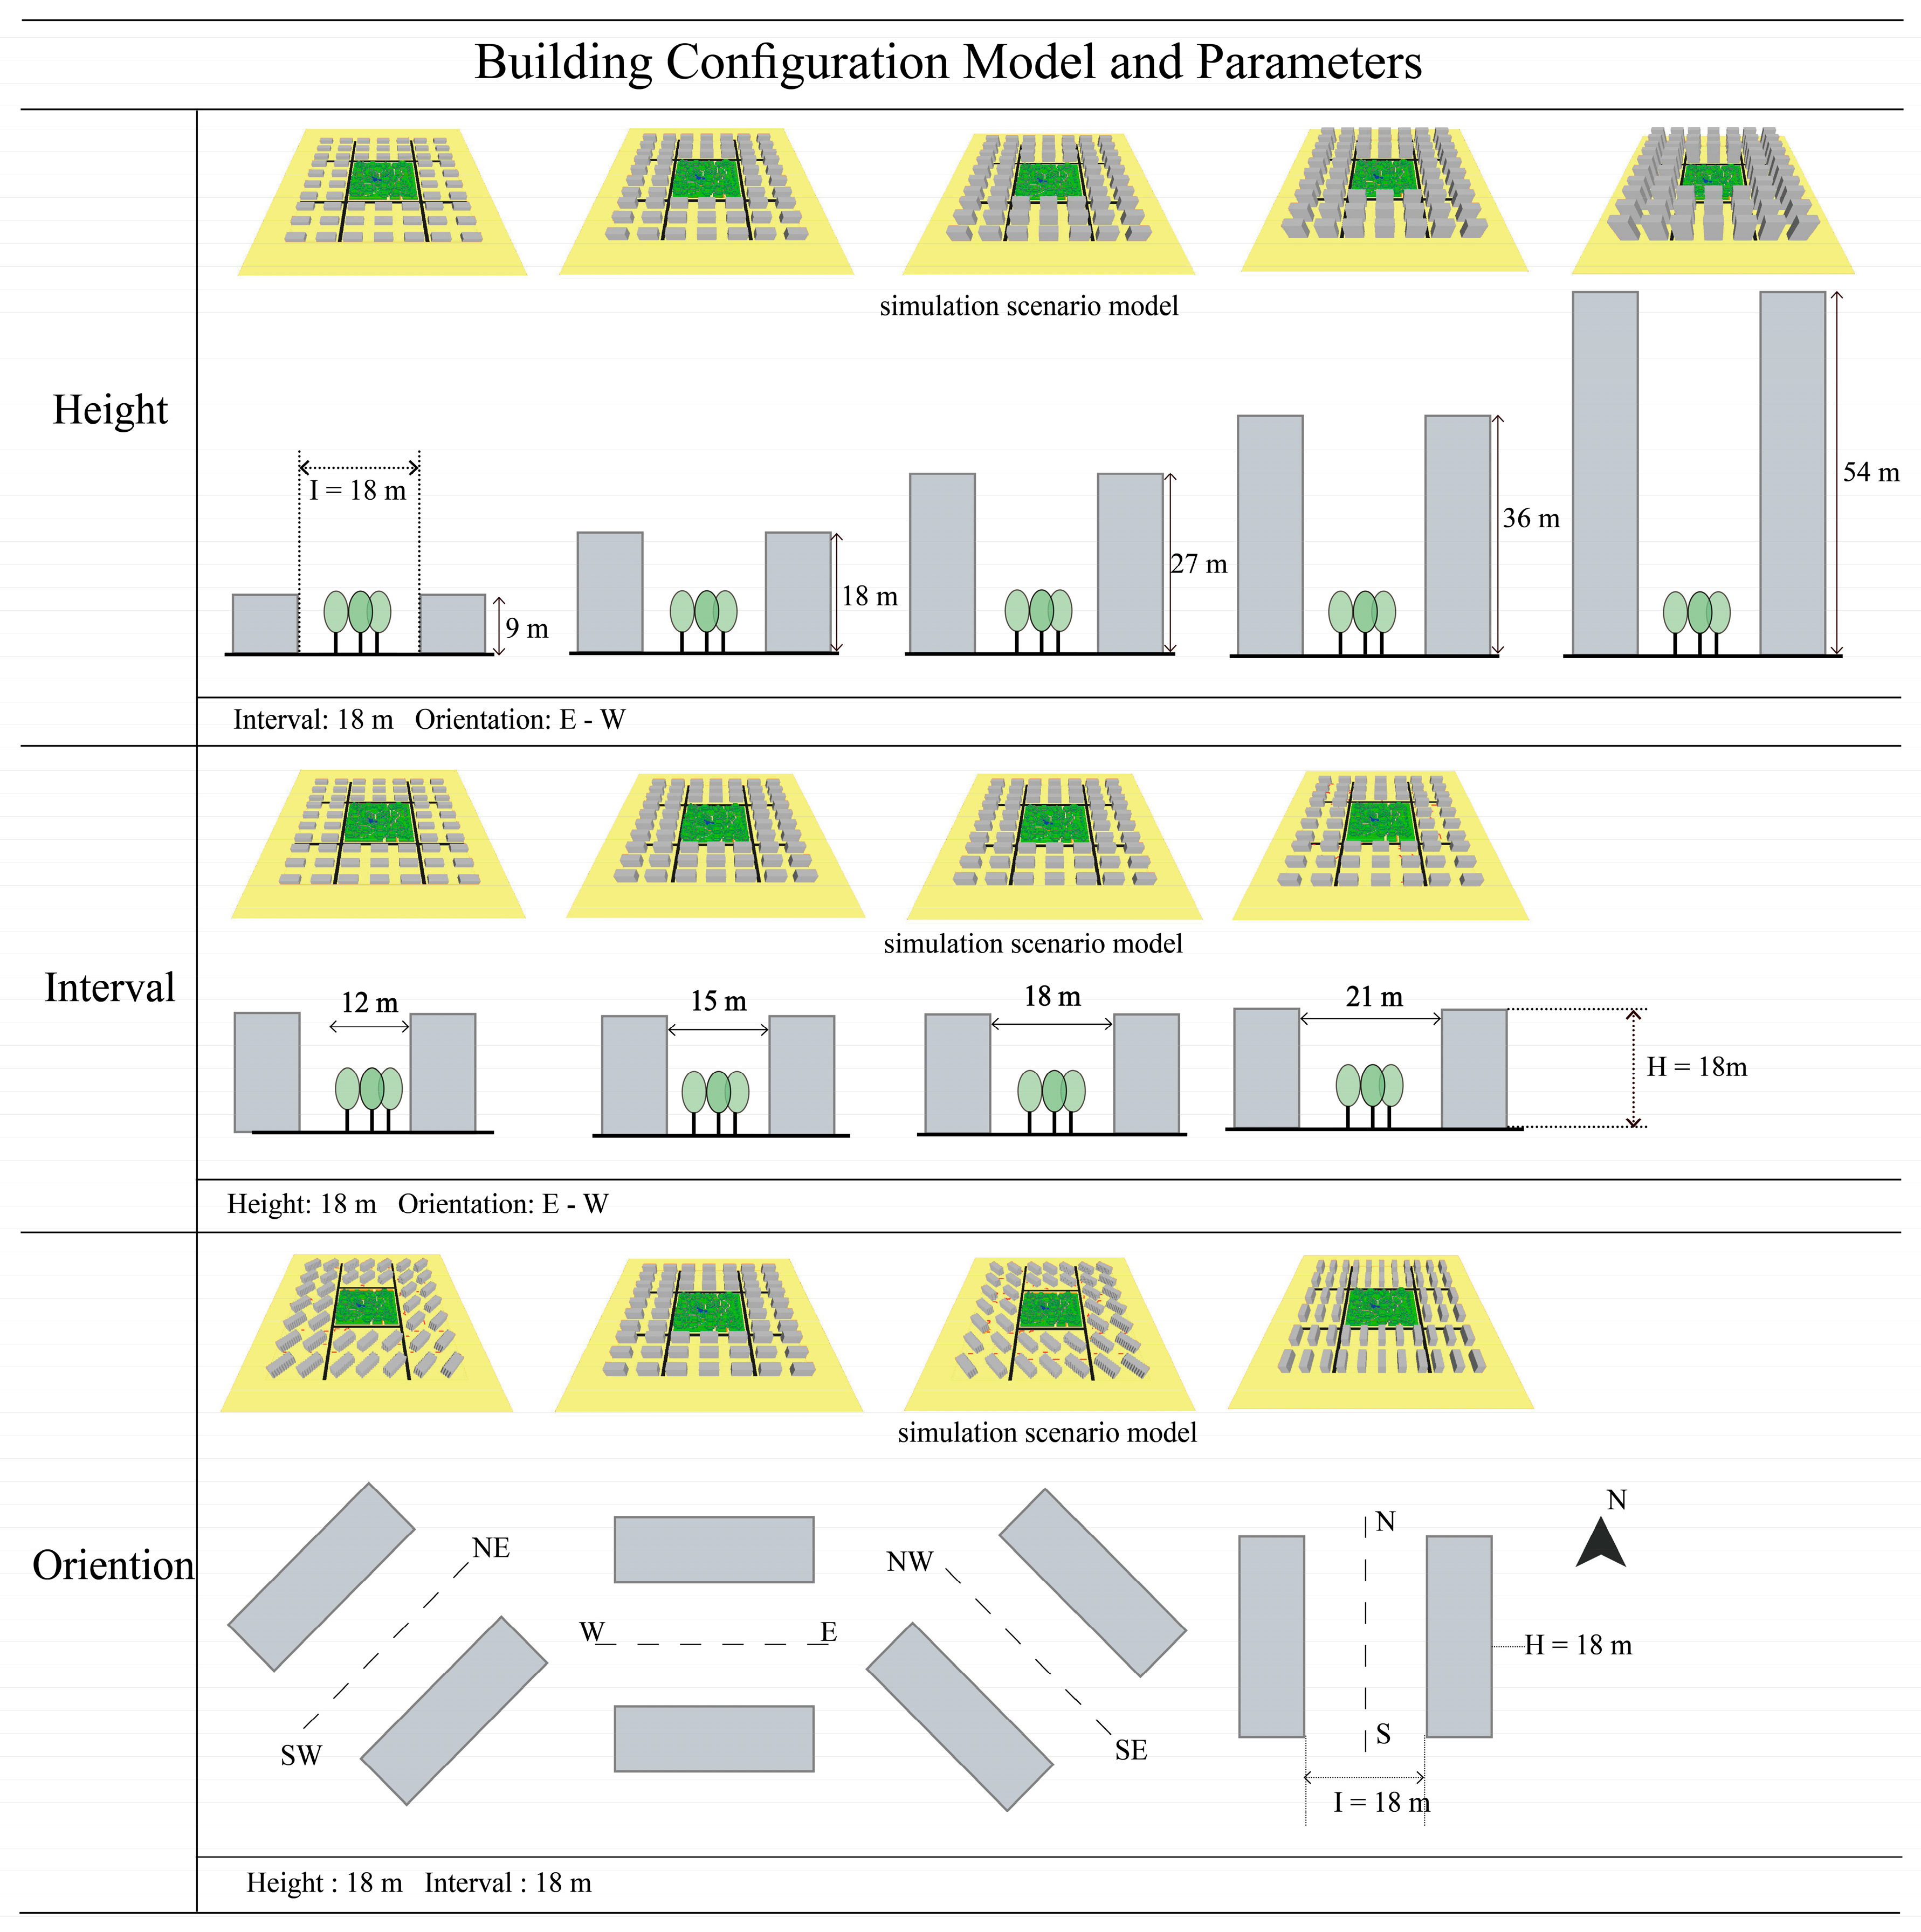
2.4. Numerical Simulation

The building configurations around urban green spaces in Hangzhou were examined through the Zhejiang Province Geographic Information Public Service Platform (https://ditu.zjzwfw.gov.cn/) (accessed on 10 May 2021) in May 2021, including the building height, building interval, and building orientation. The surveyed building configurations were classified according to the LCZ classification system [49], which served as the foundation for the simulation scenarios in this study. The building parameters in the simulation scenarios adhered to the control specifications set forth in the Building Design Code and other pertinent standards. Therefore, in this study, the building parameters of the park surrounding areas were set from three perspectives (Figure 8): building height, building interval, and building orientation. The building height values in the height group were set to 9, 18, 27, 36, and 54 m. The building interval value was constant at 18 m, and the building orientation as E-W does not change. The building interval values in the interval group were set to 12, 15, 18, and 21 m, respectively; the building height was 18 m, and the buildings orientation as E-W did not change. The building orientation in the orientation group was set to N-S, E-W, NE-SW, and NW-SE, and the building interval height was constant at 18 m.
The simulation scenarios were created according to the simulation scheme and used as model input files for the numerical simulation. Appropriate meteorological data from the meteorological stations in Fuyang District were used in the meteorological boundary conditions input file. We chose 15 July 2021 as a typical meteorological day and used the air temperature, relative humidity, wind direction, wind speed, and solar radiation of that day as input files by comparing the meteorological data recorded at the meteorological station from July to August 2021 (Figure 4b). The meteorological inputs used for the simulations are listed in Table 3.

3. Results

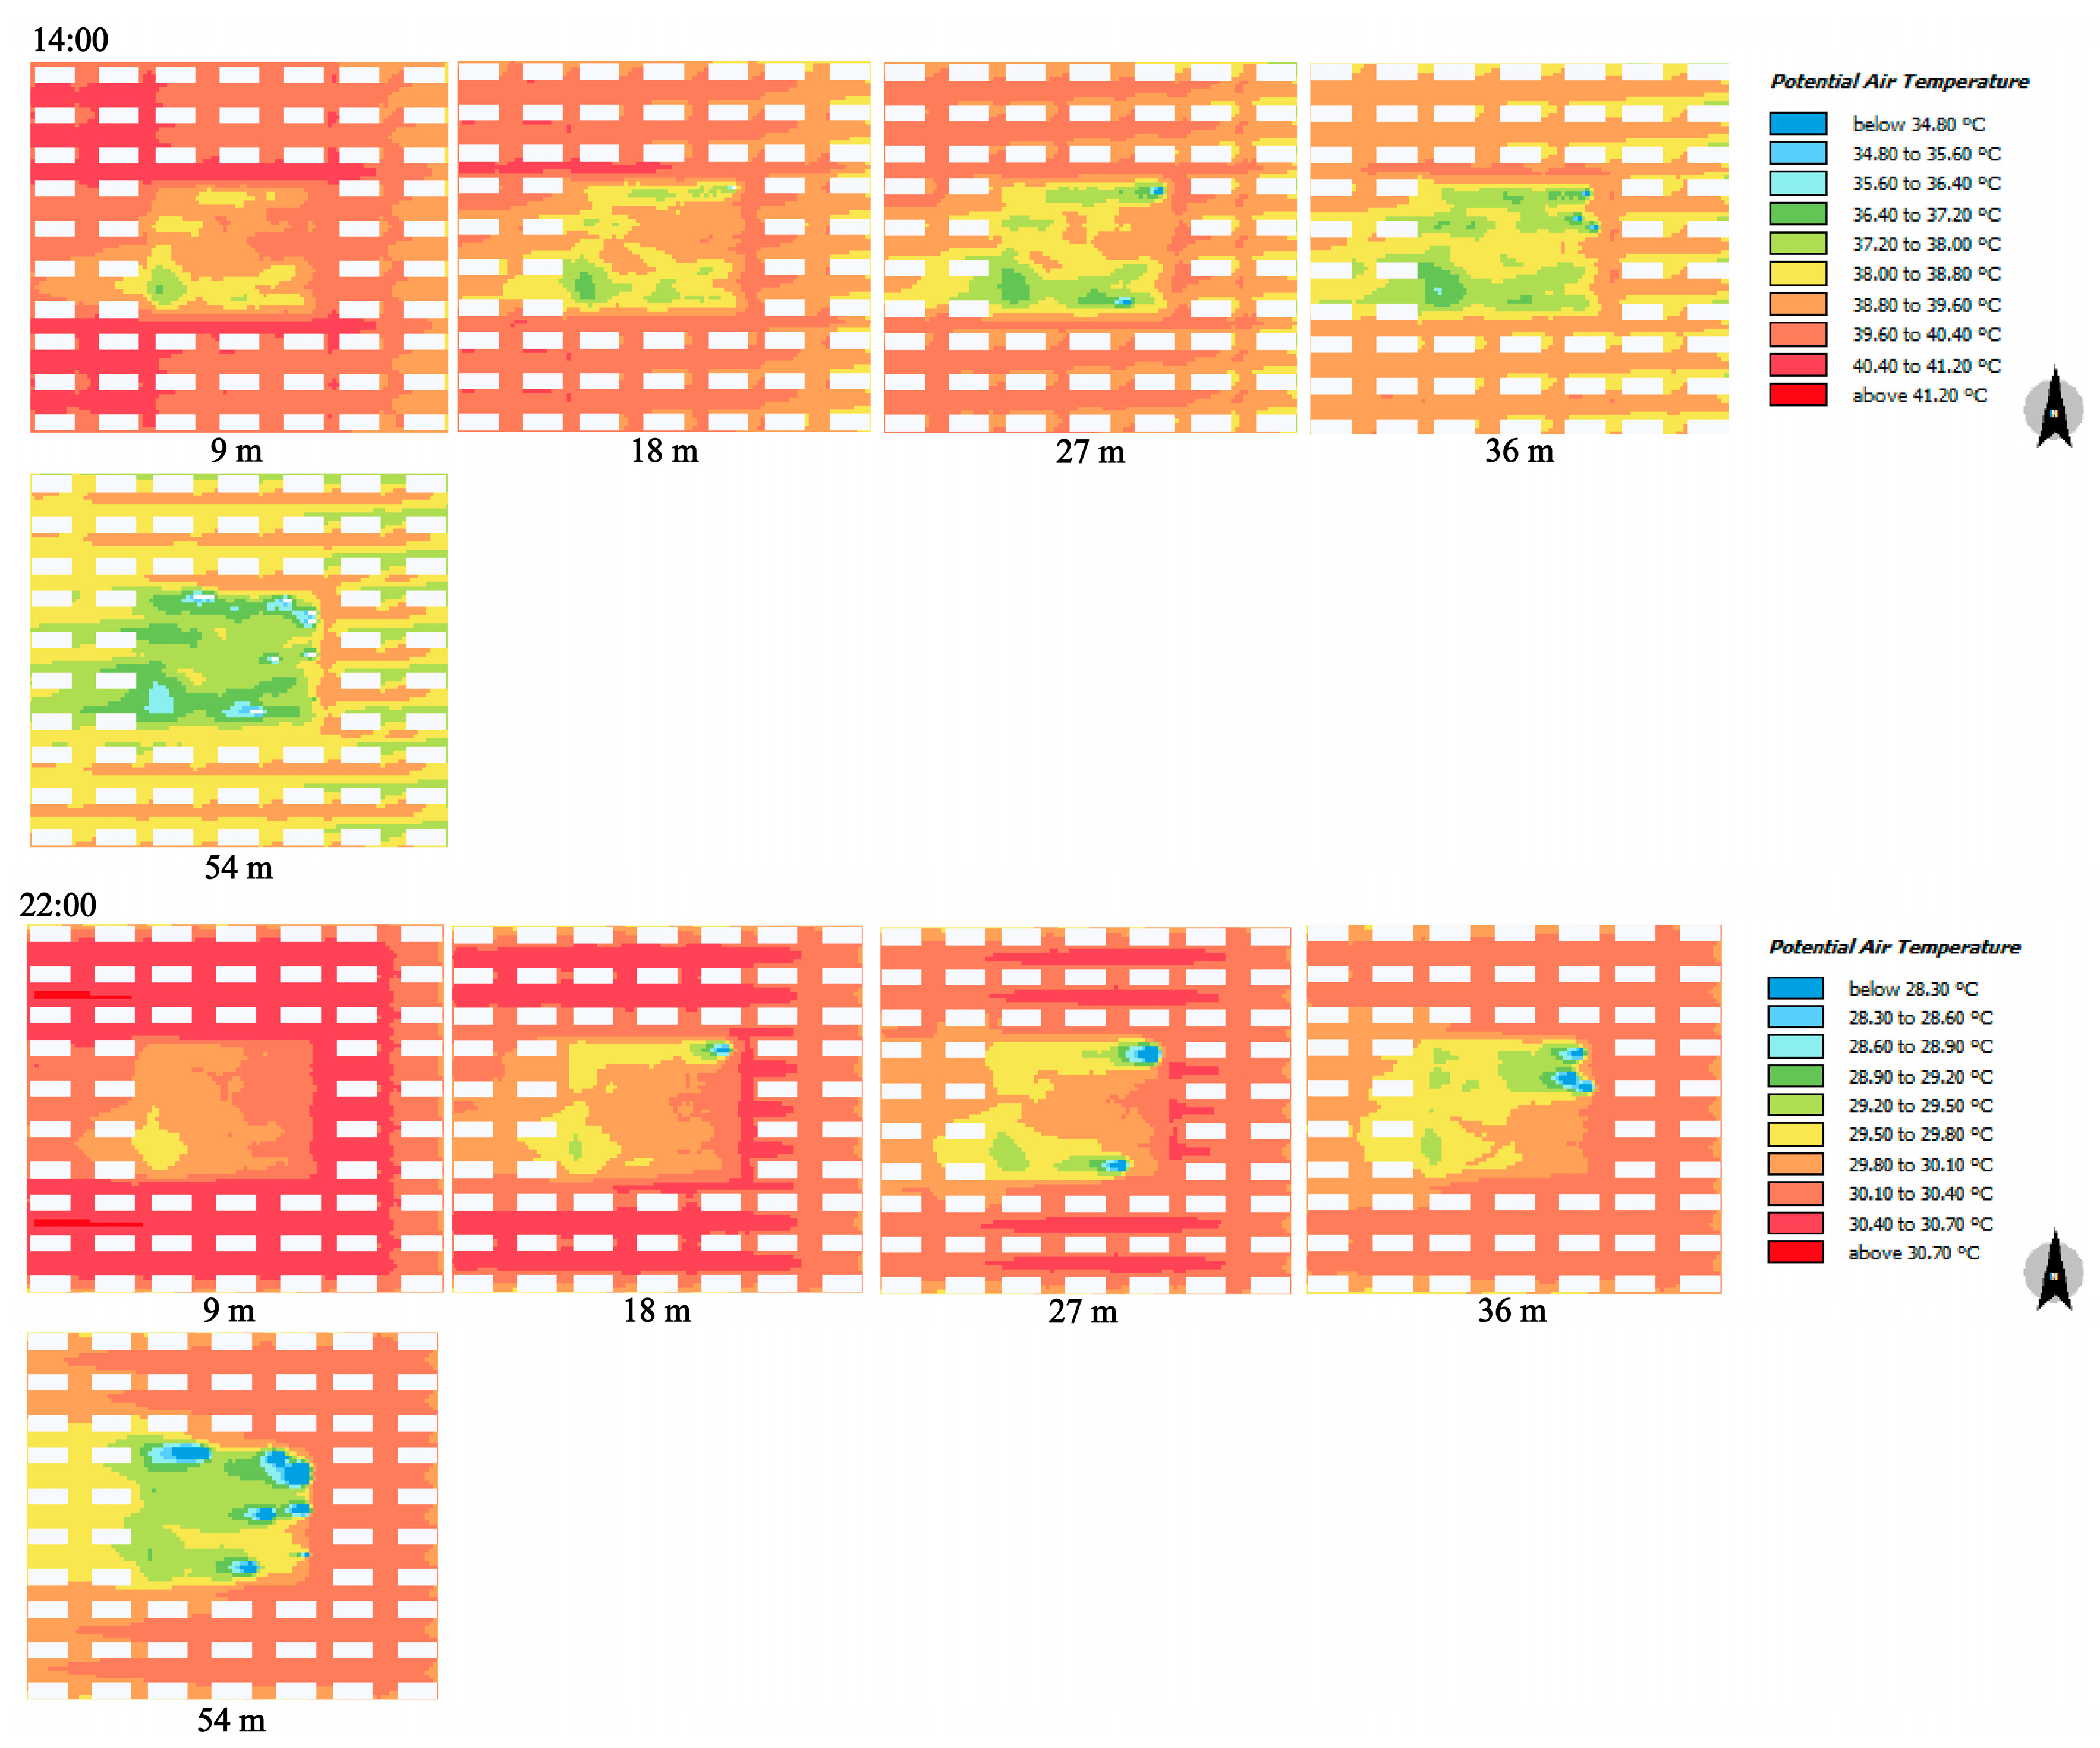
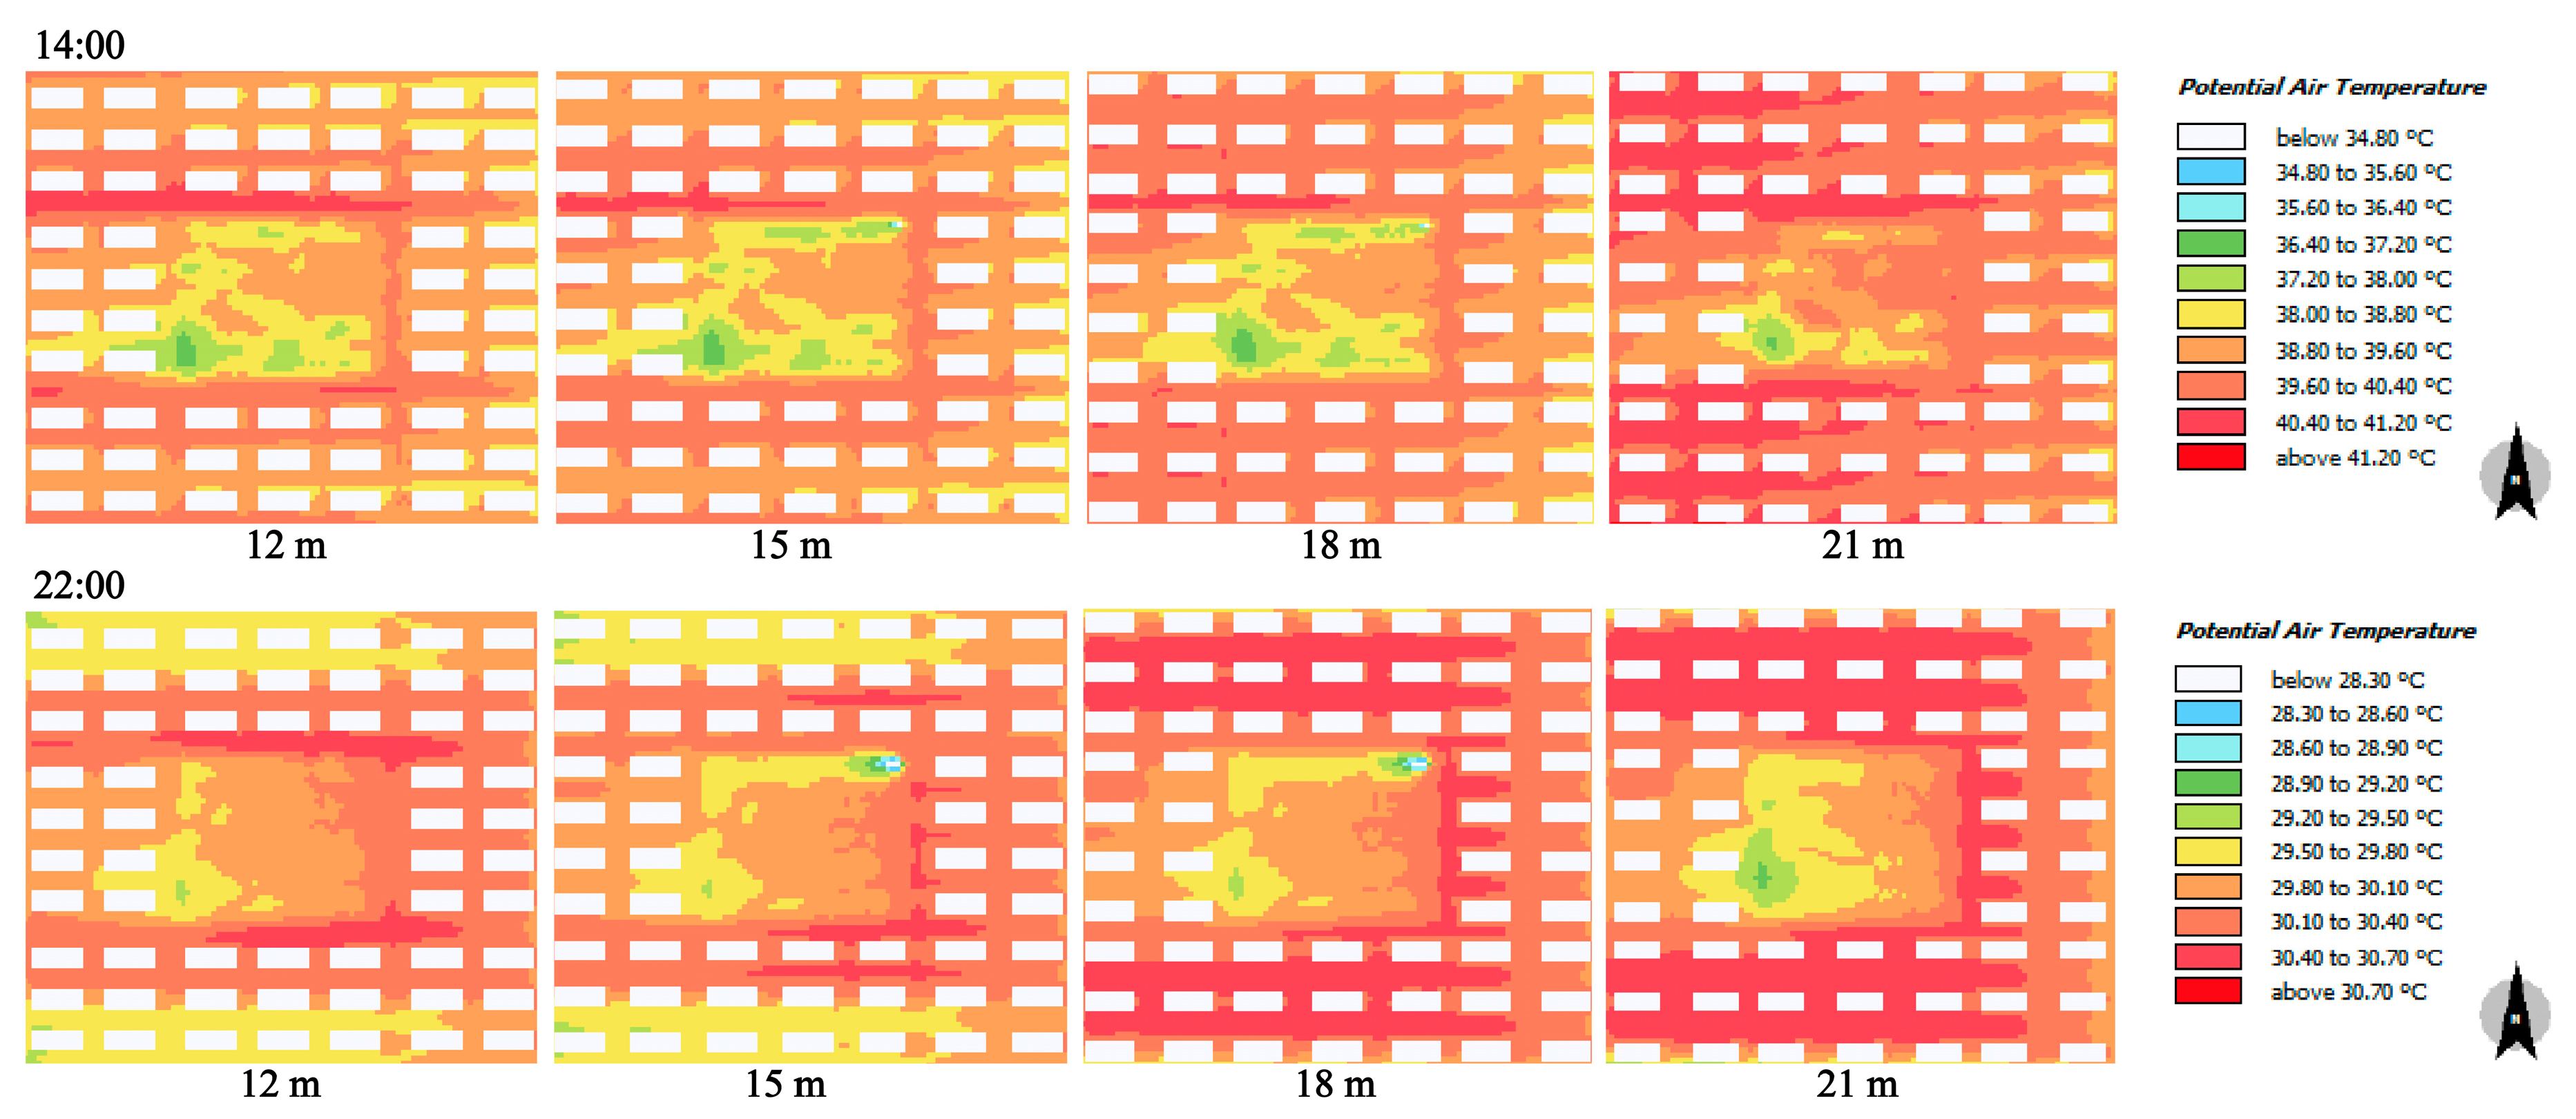
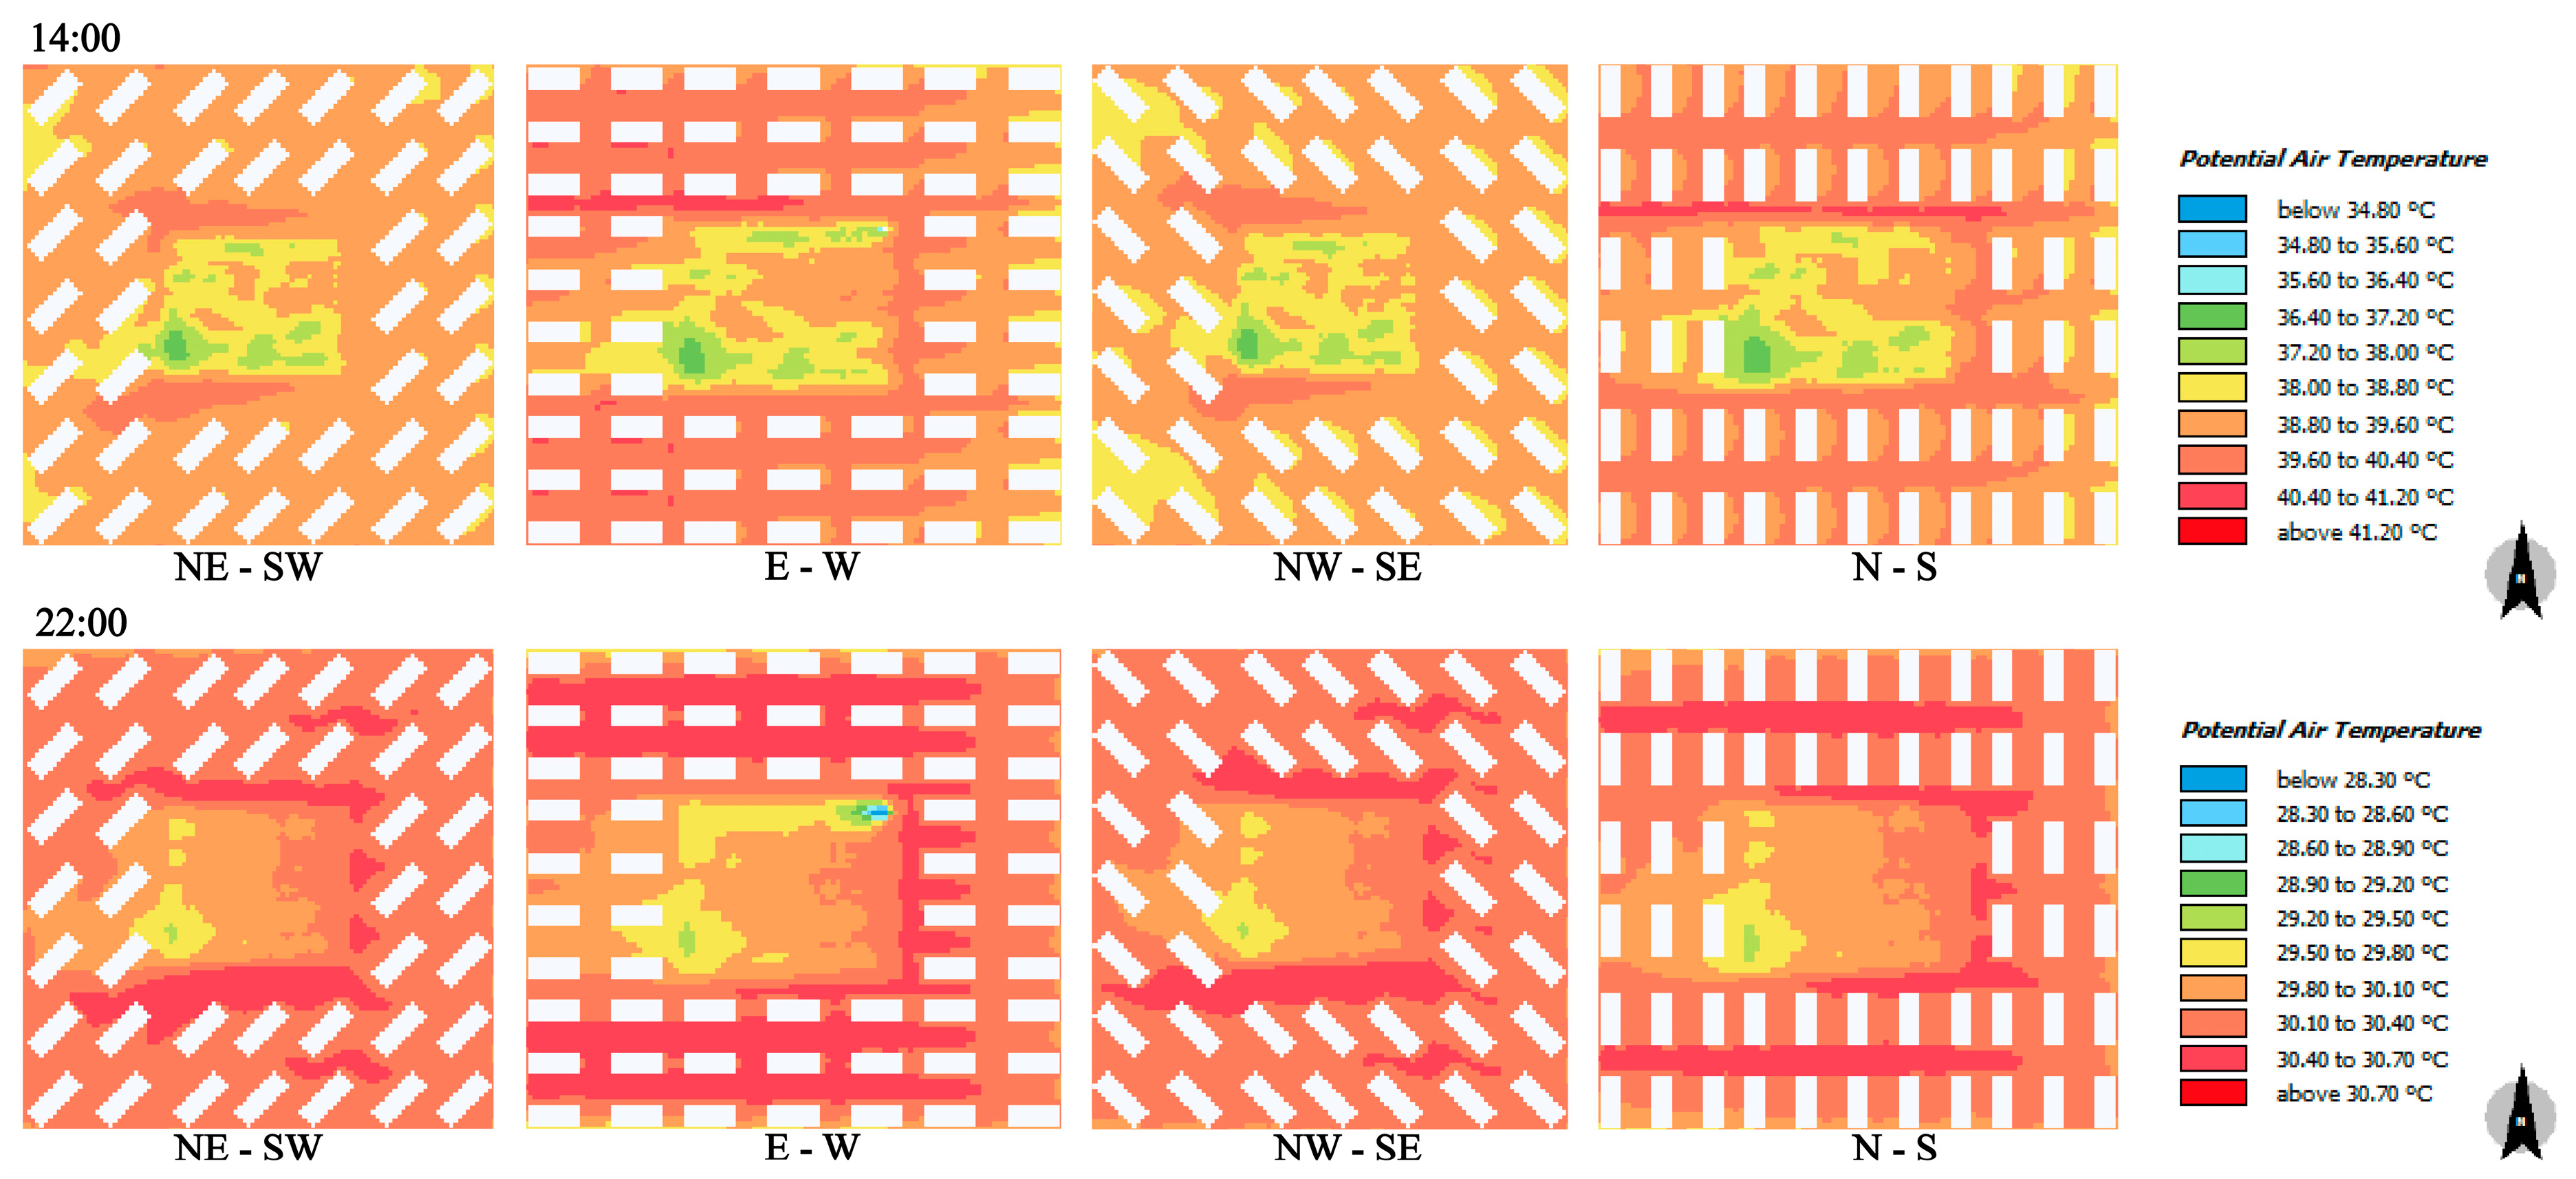
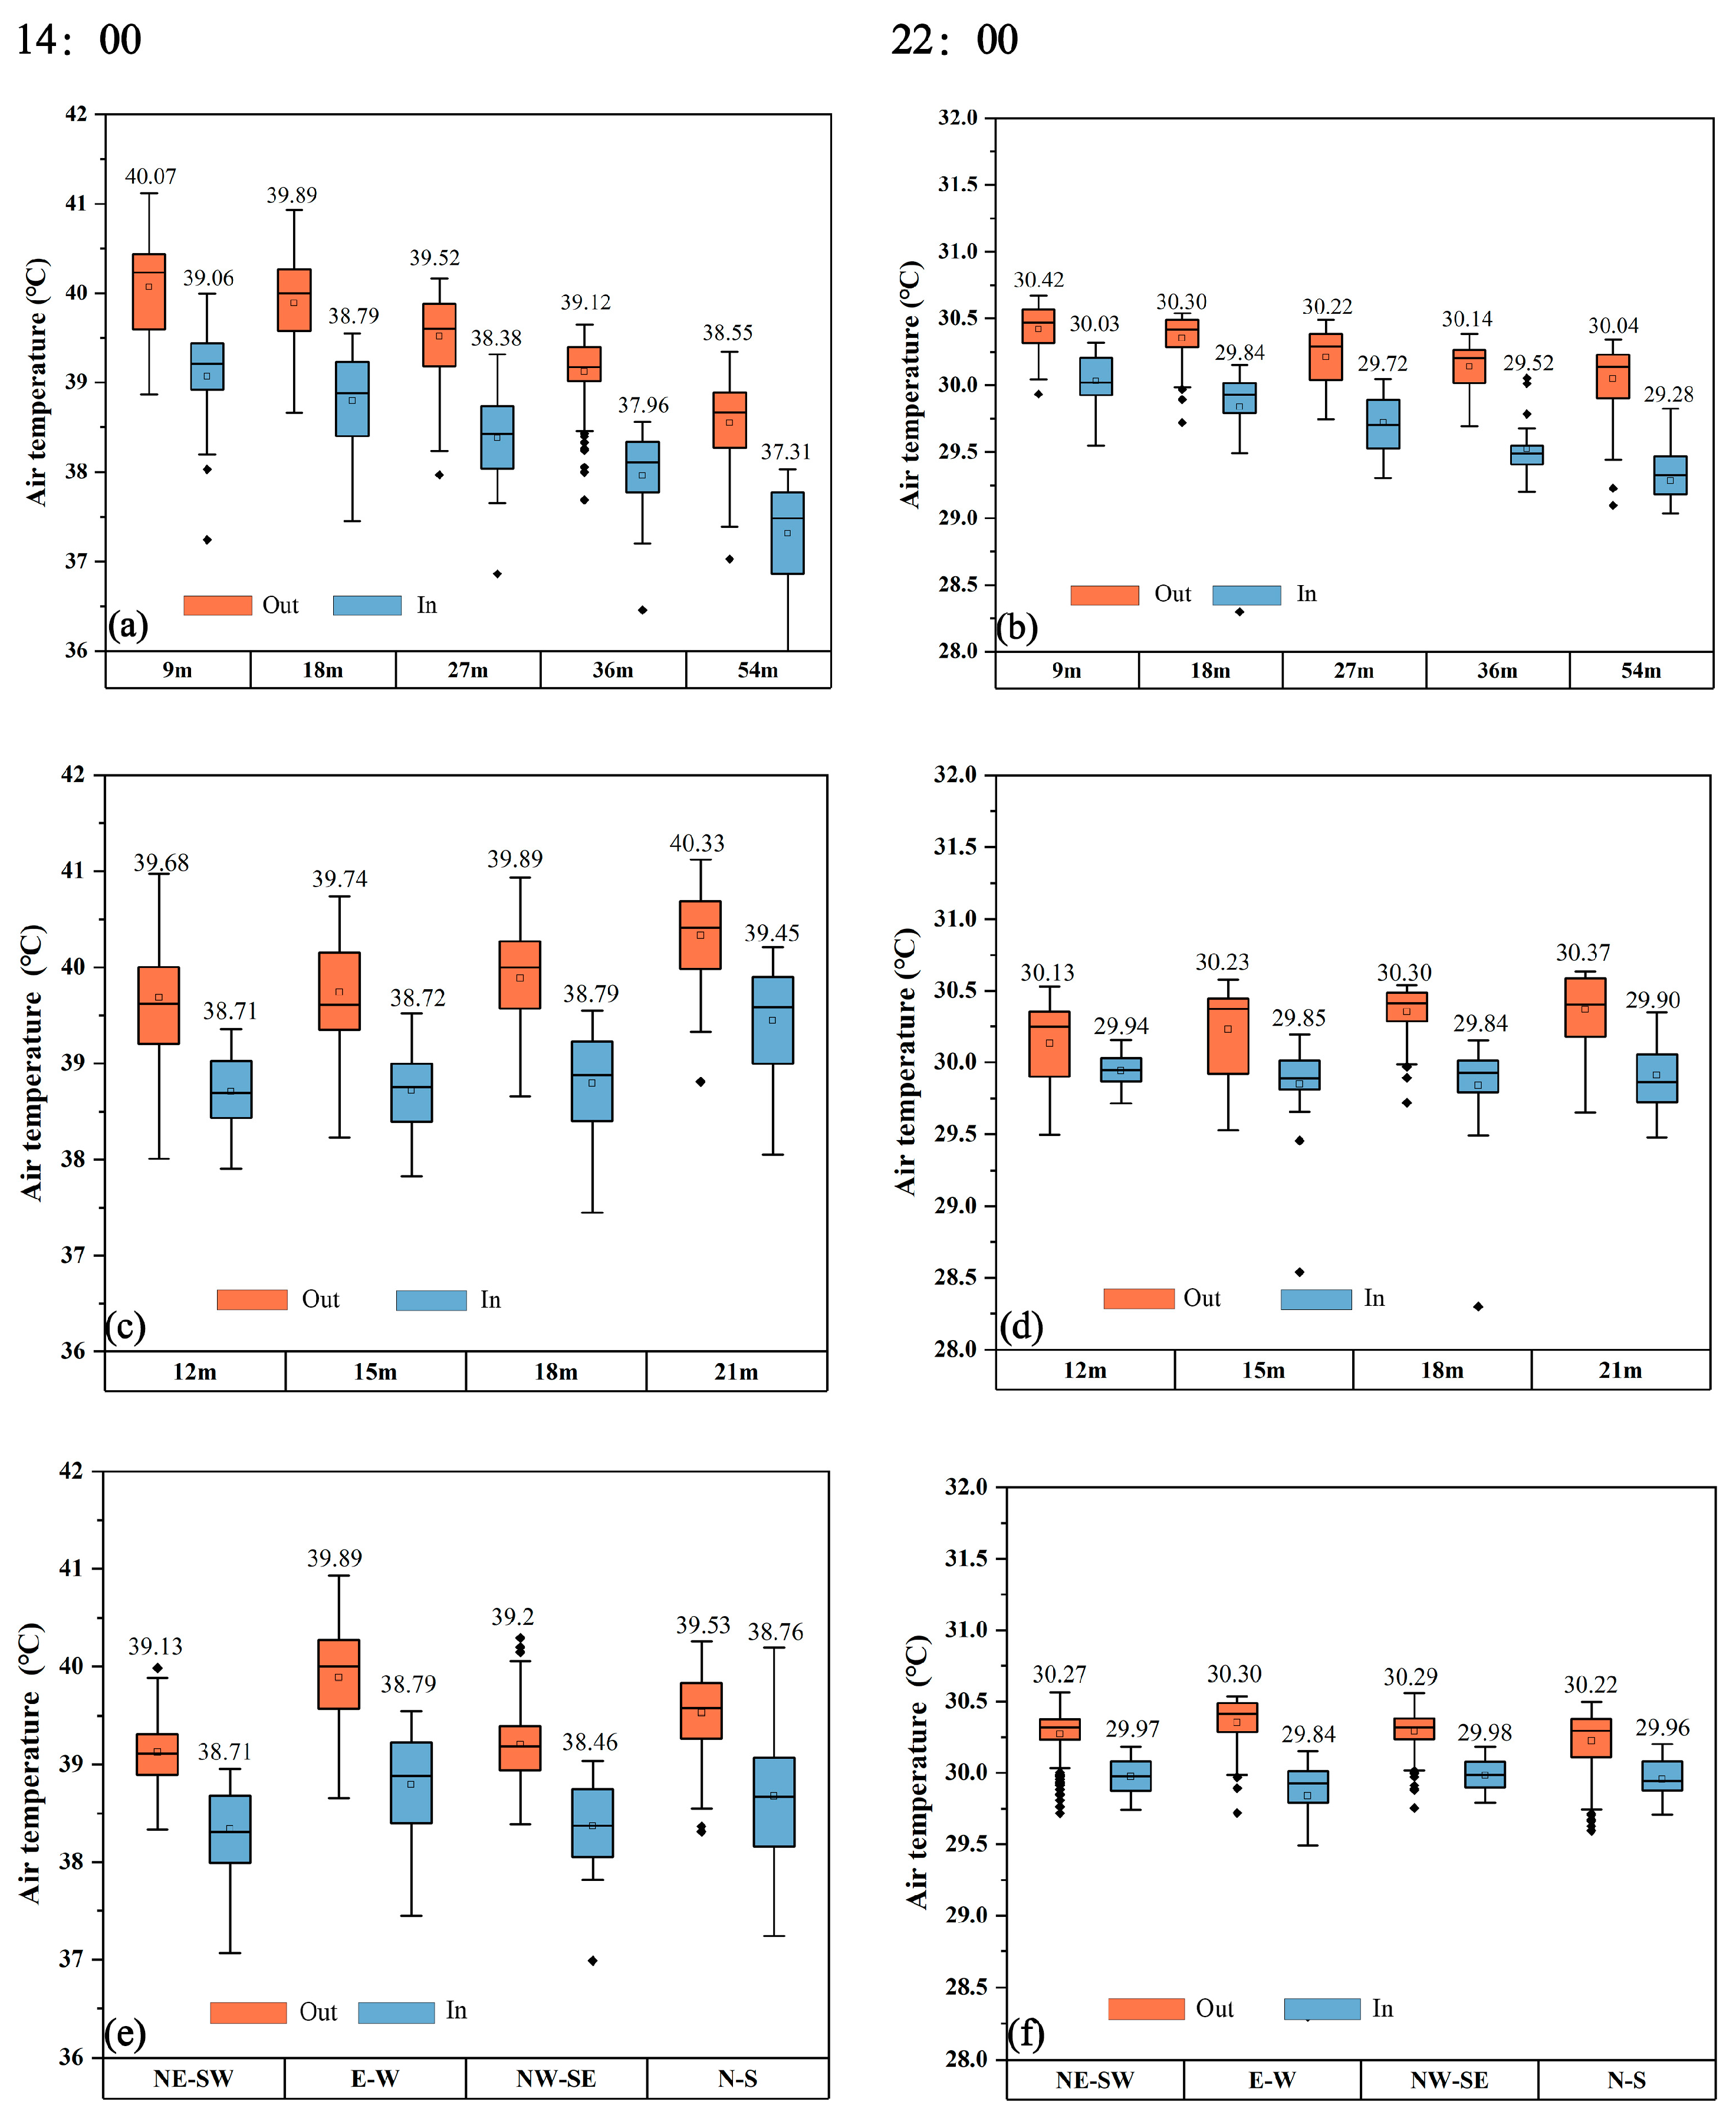
3.1. Influence of Building Configuration on Temperature Distribution Patterns Inside and Outside the Park

Figure 9, Figure 10 and Figure 11 demonstrate that the park has a significant cool island effect in the simulation scenarios with different building configurations, demonstrating that the air temperature is obviously different between the internal and external building areas of the park. In addition, the cool island effect spreads to the exterior building areas, particularly for downwind building areas. In addition, we can also see from the diagram that there was a significant difference in the air temperature distribution pattern between the inside and outside of the park, depending on the configuration of the buildings around the park.
The temperature within and outside the park in the simulation scenario tended to decrease as the building height increased, the distribution of the park cooling islands widened, and the cooling range and distance to the outside building area extended (Figure 9). At 14:00, when the building interval grows and the temperature within and outside the park progressively increases, the distribution of cooling islands gradually decreases, and the cooling range and distance to the exterior of the building steadily decrease. At 22:00, the temperature within the park starts to gently decrease as it continues to steadily increase outside. The distance and extent of cooling in the exterior building areas first decrease and then increase as the distribution of cooling islands in the park gradually increases. The building orientation affects the placement of cool islands in the park and the flow of cool air in the park’s external building areas. Building orientation upwind of the park alters the placement of cool islands, but building orientation downwind of the park has a substantial impact on the transmission of cool air (Figure 10). The cool park air propagates along the building street valley to the downwind building area and travels the greatest distance in the “E-W” building orientation scenario among the four building orientations; in the “NE-SW” and “NW-SE” scenarios, the downwind building area blocks the park cool air and distorts its path of propagation; in the “N-S” scenario, the park cool air blows vertically to the downwind building, most of which is blocked, and only a small portion can propagate to the building area, and the propagation distance is shorter (Figure 11).

3.2. Influence of Building Configuration on Park Cooling Distances

The temperature variance along the “E-W” direction for the different building configuration scenarios is shown in Figure 12. Except for the effects of incoming boundary conditions, the trend in the temperature profile is generally consistent, with temperatures being lower in the park’s interior and gradually increasing as they move towards the outer building sections.
A comparison of the temperature curves for different building heights shows that the temperature curves become lower with increasing building height, with the highest curve being 9 m and the lowest being 54 m. The temperature difference between the two adjacent curves is 0.3–0.5 °C, meaning that the temperature at the corresponding position decreases by 0.3–0.5 °C for every 9 m increase in building height (Figure 12a,b). According to the trend in the temperature curves for different building intervals, as the values of the interval increased, the magnitude of the change in adjacent temperature curves gradually increased. Overall, the reduction in the temperature curves for adjacent intervals was not significant and the temperature curves did not change consistently inside or outside the park. The temperature steadily increased in the exterior building sections as the interval widened. However, at 14:00 the trend was towards a decrease followed by an increase inside the park, with the “18 m” temperature curve being the lowest and the “21 m” curve being the highest. In the park’s interior at 22:00, there was a trend toward less activity (Figure 12c,d). According to the trends in the temperature profiles of the various building orientations, there was little variation in the temperature values with building orientation; however, the trends in the temperature profiles varied greatly, particularly in the exterior building areas. The temperature curves for “E-W” and “N-S” broadened smoothly and gradually from the park to the exterior of buildings. In contrast, for the point of entry into the built-up area, the “NE-SW” and “NW-SE” curves demonstrated a sharp increase in temperature, followed by erratic fluctuations (Figure 12e,f).
These results show that building configuration affects the park cooling effect, and the cooling distance as an indicator of the park cooling effect deserves further investigation. Different building configuration simulation scenarios showed varied park cooling distances. The park cooling island effect has a smaller impact on upwind building areas and a more significant impact on downwind building areas. However, the most significant cooling impact occurred within 20 m of the boundary, where the rate of temperature reduction was faster (Figure 12). For all building height and interval scenarios, the park cooling distance was approximately the same. The cooling distance was also slightly greater during the day than at night, approximately 100 m during the day and 80 m at night (Figure 12a–d). The park cooling distance was more affected by the building orientation. The park in “E-W” building orientation had a cooling distance outside the park boundary of approximately 100 m, while the park in “N-S” orientation had a cooling distance of 50 m (Figure 12e,f).

3.3. Influence of Building Configuration on the Cooling Intensity of the Park

Cooling intensity is an essential indicator that can accurately evaluate the park cooling effect. The temperature in the internal and external building areas of the park gradually decreased as the building height increased from 9 to 54 m, and the average temperature difference between the internal and external areas gradually widened (Figure 13). This suggests that, as building height increased, the cooling intensity of the park steadily increased. It is noteworthy that the average temperature difference between the interior and exterior of the park at 14:00 was 1.0–1.24 °C, but the average temperature difference between the two at 22:00 was 0.39–0.94 °C. This indicates that the park cooling intensity is greater during the day than at night, and building height has a stronger impact on the park cooling effect at night than during the day (Figure 13a,b).
At 14:00, the average temperature in the internal and external building areas of the park showed a gradual increase as the building interval increased from 12 to 21 m, whereas the average temperature difference between the internal and external areas of the park showed a trend of increasing and then decreasing. This indicates that as the building interval increases, the park cooling intensity gradually increases and ultimately decreases. The average temperature difference between the inside and outside of the park varied from 0.88–1.1 °C. However, at 22:00, as the building interval increased, the average temperature in the park surrounding building areas continued to increase gradually, the average temperature inside the park tended to decrease and then increase, and the average temperature difference between the inside and outside of the park tended to increase gradually. This indicates that the cooling intensity gradually increased as the interval between buildings increased. The difference in the mean temperature between the inside and outside of the park ranged from 0.19–0.47 °C (Figure 13c,d).
At 14:00, the average temperature inside the park in the four-building orientation simulation scenarios was in the order of E-W > N-S > NE-SW > NW-SE, the average temperature in the external building area was E-W > N-S > NE-SW > NW-SE, and the average temperature difference between the internal and external areas was E-W > N-S > NW-SE > NE-SW. The mean temperature difference between the inside and outside of the park ranged from 0.42–1.1 °C. At 22:00, for the four orientation scenarios, the average temperature was in the following order: inside the park, NW-SE > NE-SW > N-S > E-W and outside the park, E-W > NW-SE > NE-SW > N-S. The average temperature difference inside and outside was in the order of E-W > NE-SW = NW-SE > N-S, ranging from 0.26–0.46 °C (Figure 13e,f).

4. Discussion

The building configuration around parks has long been considered a potential factor influencing the park cooling effect; however, most existing studies have only described or mentioned it qualitatively. In this study, we investigated the influence of parks’ surrounding building configurations, including building height, building interval, and building orientation, on the park cooling effect through numerical simulation and quantified the differences in influence between different building configurations. The findings from the numerical simulations may provide suggestions for future urban park design.
Empirical and simulation studies have confirmed that a range of factors affect the cooling effect of urban green spaces [29,56,57]. This investigated the cooling effect of urban parks under different external building configuration characteristics through numerical simulations. The results showed that under various building configurations, the temperature inside the park was lower than that in the surrounding building areas. This shows that the park has a significant cooling effect. In addition, the results showed that the cooling effect of the park varied depending on the time of day and was stronger during the day than at night, which is in line with the findings of many other studies. The park cooling intensity ranged from 0.42 to 1.24 °C during the daytime, with a cooling distance of up to 100 m. In contrast, the cooling intensity at night varied from 0.19 to 0.94 °C, with a cooling distance of up to 80 m. The temperature difference between the park and its surroundings ranged from 0.5 to 3.0 °C during peak heating periods during the day, while the park displayed less variation in cooling at night. This agrees with Motazedian et al. [22], who investigated the climatic interactions between a small park and its surrounding urban environment in Melbourne at high temperatures. However, Zoulia et al. [58], in Athens, Greece, monitored thermal conditions in the National Garden in the city center and in the nearby urban area and discovered that the temperature difference between the park and the built-up area was greater at night, particularly for areas with a high aspect ratio (H/W). The main difference between our study and that of Zoulia et al. [58] is that they were conducted in different climates and were not the same in the urban context. Coupled with rapid urbanization in China, the development of dense park surroundings has altered the role of parks as cooling regulators, resulting in stronger cooling effects in parks during the day than at night [43].
In addition, this study discovered variations in the park cooling effect in different building configuration scenarios. The building height had the most significant effect on the park’s potential to reduce air temperature, while building orientation had the most significant effect on the cooling distance of the park.

4.1. The Effect of Building Height on the Park Cooling Effect

In this study, the park cooling intensity increased with increasing building height, and the distribution of park cool air in the downwind building area increased. The essential reason for the park cooling effect to increase progressively with building height is the geometry of the urban buildings. During the day, taller buildings provide more effective shading, reducing, or delaying the impact of direct solar radiation on near-surface temperatures, while avoiding the disturbance of solar radiation in urban parks. Parks can cool not only themselves but also the surrounding building areas, and this cooling effect of parks on their interior and exterior becomes more pronounced as the building height increases. This phenomenon was also observed in previous studies [59,60]. At night, the ground and buildings become heat sources because of the stored heat from direct solar radiation during the day. However, as building height increases, the ground and buildings are effectively shaded and received less solar radiation and stored heat. The higher the building, the more pronounced this phenomenon becomes, and the park can cool more of the building area with the same amount of cooling, thus making the cooling effect of the park more significant.
Numerous studies have been conducted on how urban form affects the cooling effect of parks over time. Through numerical simulations, Ouyang et al. [57] showed that in subtropical regions, urban geometry with higher SVF at night led to better cooling in urban parks. In addition, we discovered that although park cooling intensity was higher during the day than at night, the effect of building height variation on park cooling intensity was more pronounced at night. This is because park cooling variability at night is more likely to be influenced by site characteristics, such as SVF, building geometry, and irrigation level [22].

4.2. The Effect of Building Spacing on the Park Cooling Effect

The building interval is a strict requirement in urban planning, especially in detailed urban planning, and the main basis for determining the building interval is usually to meet sunlight requirements. Therefore, previous planning indicators and urban climate-related studies have not addressed the effect of building intervals on the urban thermal environment. In this study, we investigated the impact of building intervals on the cooling effect of parks using numerical simulations. We found that building intervals have an impact on the park cooling effect and that this impact changes with time.
In the simulated scenarios, as the building interval widens during the day, the average temperature of the park and the surrounding building areas tended to gradually increase, while the park cooling intensity tended to first increase and then decrease. The size of the park cooling islands and the distribution of the park cool air in the surrounding building areas also gradually decreased with increasing intervals. The average temperature in the surrounding building areas of the park continued to increase steadily at night as the building interval widened but tended to first decrease and then increase inside the park. Additionally, the park cooling intensity gradually increased, and the distribution area of the park cooling islands gradually expanded, whereas the cooling distance of the park cool air in the building areas first decreased and then subsequently increased. The results show that changing the building interval influences the park cooling effect, which is mainly reflected in the change in the park cooling intensity. In reality, there are two factors that mainly influence the building interval on the park cooling effect: solar radiation and ventilation conditions. The H/W steadily decreased as building interval increased. During the daytime, the simulation scenarios were more likely to be exposed to direct solar radiation and accumulate heat, causing the temperature to increase. However, at night, with more space between the buildings, heat stored during the day can be released. In addition, with increasing building intervals, the ventilation conditions in the simulation scenario become more fluid, and the cooler park air can be more easily transmitted to the surrounding building areas. As a result, park cooling intensity generally tends to gradually increase with increasing building interval.
The results of this study are supported by the findings of previous studies. Morakinyo et al. [61] conducted a comparative study in Hong Kong, China, and found that the potential of greenery to enhance environmental thermal comfort becomes more significant when urban spaces are more open. Simultaneously, Dimoudi and Marialena [62] confirmed that the wake effect decreases as the H/W decreases, increasing the park cooling effect by increasing air mixing.

4.3. Influence of Building Orientation on the Park Cooling Effect

Over the past few decades, numerous studies have investigated the effects of urban canyon geometry (which involves building orientation) on the distribution patterns of microclimate parameters and found that different building orientations significantly alter solar energy capture, shading, and wind flow, all of which have a significant impact on air and surface temperatures and human thermal comfort [48,63]. Through numerical simulations of urban canyon geometry in the central business district of Nanjing, China, Deng et al. [48] found that air temperature and thermal comfort varied between building orientations and over time and that temperatures were consistently highest at all building orientations in the afternoon. In addition, we discovered that the effect of building orientation on park cooling intensity was not significant but had a greater effect on park cooling distance and distribution. According to this study, the “E-W” orientation had the longest cooling distance, while the “N-S” orientation had the shortest one. In the “E-W” orientation scenario, the buildings were parallel to the direction of the prevailing wind, allowing the cool air in the park to easily reach the surrounding building areas while reducing the air temperature in the building areas downwind of the park and allowing the park cool air to travel further. This corroborates the findings of Motazedian et al. [22], who investigated the climate interactions between a relatively small park and its surrounding urban environment during high summer temperatures and discovered that the park cooling effect propagated along the downwind direction, with the direction and intensity of cooling depending on the wind direction and speed. Upmanis et al. [25] demonstrated that buildings parallel to park boundaries are perpendicular to the prevailing winds, blocking cool air from entering urban building areas to some extent. As a result, in the “N-S” orientation simulation scenario, only a small portion of cool air from the park entered the building area, resulting in the shortest cooling distance from the park. In the “NE-SW” and “NW-SE” orientation simulation scenarios, the propagation of cool air from the park shifted in the building areas due to the angles between the buildings and the prevailing wind direction [63], which hindered the flow of cool air from the park to the surrounding building areas.

4.4. Implications for Urban Planning

Urban park cooling is a crucial way to mitigate urban heat [27,35,56,64]. The optimization and maximization of the park cooling effect have been topics of focus in many studies. Urban green spaces can be planned and created as parks using criteria such as park size and shape, plant varieties, planting patterns, and the proportion of blue and green spaces [56,64]. However, urban green space planning and design in China and other nations must adhere to urban building plans, rail transport plans, and other guidelines. Coupled with the high density and intensive development of cities and scarcity of land resources, the size and shape of park green spaces are often difficult for urban green space designers to control. From the perspective of park surroundings, urban building configurations can be planned to optimize the urban thermal environment, which has thus far been overlooked in urban planning. Different architectural building orientations with respect to the sun and wind can heat or cool the surrounding area, having a noticeable impact on urban temperature and thermal comfort [65,66]. At the same time, building configurations affect the cooling energy required by surrounding buildings by influencing the diffusion of park cool air [42]. Therefore, building configuration has a considerable impact on the cooling effect of urban green spaces. As found in this study, building height and interval can affect the intensity and extent of park cooling, while building orientation can influence the location of park cooling islands and the path of cool air propagation in parks, which in turn affects park cooling distance. Based on this, urban planners can rationalize and optimize the three-dimensional structure of urban buildings by adjusting building heights, building intervals, and building orientations to maximize the cooling effect of urban park green spaces.

5. Conclusions

This study focused on the effect of the surrounding building configuration on a small urban park and the cooling effect of the park. We studied the effects of building height, building interval, and building orientation on the park cooling effect using ENVI-met numerical simulation and evaluated the effects in terms of air temperature inside and outside the park, park cooling intensity, and distance. The aim was to explore how to maximize the cooling effect of the park by adjusting the building configurations around the park. The results are shown below:
(1)
Building height, building interval, and building orientation all have an impact on the park cooling effect, but their impacts vary.
(2)
Building height had the strongest and most significant effect on the park cooling intensity, decr and adjusting building height in this study gave the maximum park cooling intensity, with a maximum of 1.2 °C.
(3)
Building orientation had the most significant effect on the park cooling distance, with the maximum cooling distance downwind of the park being 100 m and the minimum being roughly 30 m for all four building orientations.
(4)
The park cooling effect is best when the surrounding buildings were parallel to the prevailing wind direction, and the park cool island has the greatest intensity and range. In contrast, the park had the shortest cooling distance when the building orientation was perpendicular to the prevailing wind direction, with the cooling effect being mainly concentrated within 30 m of the park boundary.
(5)
The results of the study can provide scientific guidance for maximizing the cooling potential of urban parks and the configuration of urban buildings. It is important in mitigating the urban environment, improving the thermal comfort of urban residents, reducing energy consumption for cooling, building climate-resilient cities, and even contributing to global carbon neutrality goals.

Author Contributions

Conceptualization, Q.H. and H.Y.; Investigation, Q.H. and X.N.; Methodology, Q.H.; Software, Q.H., H.W. and Y.H.; Validation, Q.H.; Visualization, Q.H. and X.N.; Data curation, H.W. and Y.H.; Writing–original draft preparation, Q.H.; Writing–review&editing, Q.H., X.N. and H.Y.; Project administration, Y.H. and Z.B.; Resources, Y.H. and Z.B.; Funding acquisition, Y.H. and Z.B.; Supervision, H.Y. All authors have read and agreed to the published version of the manuscript.

Funding

This research was funded by Zhejiang Provincial Natural Science Foundation of China under Grant No. LGF21E080001 and National Natural Science Foundation of China under Grant No. 51508515.

Institutional Review Board Statement

Not applicable.

Informed Consent Statement

Not applicable.

Data Availability Statement

Not applicable.

Conflicts of Interest

The authors declare no conflict of interests.

References

  1. Oke, T.R.; Mills, G.; Christen, A.; Voogt, J.A. Urban Climates; Cambridge University Press: Cambridge, UK, 2017. [Google Scholar]
  2. Cai, W.; Zhang, C.; Suen, H.P.; Ai, S.; Bai, Y.; Bao, J. The 2020 China report of the Lancet Countdown on health and climate change. Lancet Public Health 2021, 6, e64–e81. [Google Scholar] [CrossRef]
  3. He, G.; Xu, Y.; Hou, Z.; Ren, Z.; Zhou, M.; Chen, Y.; Zhou, C.; Xiao, Y.; Yu, M.; Huang, B.; et al. The assessment of current mortality burden and future mortality risk attributable to compound hot extremes in China. Sci. Total Environ. 2021, 777, 146219. [Google Scholar] [CrossRef]
  4. Santamouris, M.; Cartalis, C.; Synnefa, A.; Kolokotsa, D. On the impact of urban heat island and global warming on the power demand and electricity consumption of buildings—A review. Energy Build. 2015, 98, 119–124. [Google Scholar] [CrossRef]
  5. Yang, X.; Peng, L.L.H.; Jiang, Z.; Chen, Y.; Yao, L.; He, Y.; Xu, T. Impact of urban heat island on energy demand in buildings: Local climate zones in Nanjing. Appl. Energy 2020, 260, 114279. [Google Scholar] [CrossRef]
  6. Kalisa, E.; Fadlallah, S.; Amani, M.; Nahayo, L.; Habiyaremye, G. Temperature and air pollution relationship during heatwaves in Birmingham, UK. Sustain. Cities Soc. 2018, 43, 111–120. [Google Scholar] [CrossRef]
  7. Fahed, J.; Kinab, E.; Ginestet, S.; Adolphe, L. Impact of urban heat island mitigation measures on microclimate and pedestrian comfort in a dense urban district of Lebanon. Sustain. Cities Soc. 2020, 61, 102375. [Google Scholar] [CrossRef]
  8. Fu, J.; Dupre, K.; Tavares, S.; King, D.; Banhalmi-Zakar, Z. Optimized greenery configuration to mitigate urban heat: A decade systematic review. Front. Archit. Res. 2022, 11, 466–491. [Google Scholar] [CrossRef]
  9. Saneinejad, S.; Moonen, P.; Carmeliet, J. Comparative assessment of various heat island mitigation measures. Build. Environ. 2014, 73, 162–170. [Google Scholar] [CrossRef]
  10. Shah, A.; Garg, A.; Mishra, V. Quantifying the local cooling effects of urban green spaces: Evidence from Bengaluru, India. Landsc. Urban Plan. 2021, 209, 104043. [Google Scholar] [CrossRef]
  11. Lai, D.; Liu, Y.; Liao, M.; Yu, B. Effects of different tree layouts on outdoor thermal comfort of green space in summer Shanghai. Urban Clim. 2023, 47, 101398. [Google Scholar] [CrossRef]
  12. Xi, C.; Wang, D.; Cao, S.-J. Impacts of trees-grass area ratio on thermal environment, energy saving, and carbon benefits. Urban Clim. 2023, 47, 101393. [Google Scholar] [CrossRef]
  13. Liu, Z.; Cheng, W.; Jim, C.Y.; Morakinyo, T.E.; Shi, Y.; Ng, E. Heat mitigation benefits of urban green and blue infrastructures: A systematic review of modeling techniques, validation and scenario simulation in ENVI-met V4. Build. Environ. 2021, 200, 107939. [Google Scholar] [CrossRef]
  14. Algretawee, H. The effect of graduated urban park size on park cooling island and distance relative to land surface temperature (LST). Urban Clim. 2022, 45, 101255. [Google Scholar] [CrossRef]
  15. Bowler, D.E.; Buyung-Ali, L.; Knight, T.M.; Pullin, A.S. Urban greening to cool towns and cities: A systematic review of the empirical evidence. Landsc. Urban Plan. 2010, 97, 147–155. [Google Scholar] [CrossRef]
  16. Cao, X.; Onishi, A.; Chen, J.; Imura, H. Quantifying the cool island intensity of urban parks using ASTER and IKONOS data. Landsc. Urban Plan. 2010, 96, 224–231. [Google Scholar] [CrossRef]
  17. Chang, C.-R.; Li, M.-H.; Chang, S.-D. A preliminary study on the local cool-island intensity of Taipei city parks. Landsc. Urban Plan. 2007, 80, 386–395. [Google Scholar] [CrossRef]
  18. Chen, Y.; Wong, N.H. Thermal benefits of city parks. Energy Build. 2006, 38, 105–120. [Google Scholar]
  19. Gunawardena, K.R.; Wells, M.J.; Kershaw, T. Utilising green and bluespace to mitigate urban heat island intensity. Sci. Total Environ. 2017, 584–585, 1040–1055. [Google Scholar] [CrossRef] [PubMed]
  20. Sugawara, H.; Narita, K.I.; Mikami, T. Vertical structure of the cool island in a large urban park. Urban Clim. 2021, 35, 100744. [Google Scholar] [CrossRef]
  21. Chow, W.T.L.; Pope, R.L.; Martin, C.A.; Brazel, A.J. Observing and modeling the nocturnal park cool island of an arid city: Horizontal and vertical impacts. Theor. Appl. Climatol. 2010, 103, 197–211. [Google Scholar] [CrossRef]
  22. Motazedian, A.; Coutts, A.M.; Tapper, N.J. The microclimatic interaction of a small urban park in central Melbourne with its surrounding urban environment during heat events. Urban For. Urban Green. 2020, 52, 126688. [Google Scholar] [CrossRef]
  23. Oliveira, S.; Andrade, H.; Vaz, T. The cooling effect of green spaces as a contribution to the mitigation of urban heat: A case study in Lisbon. Build. Environ. 2011, 46, 2186–2194. [Google Scholar] [CrossRef]
  24. Spronken-Smith, R.A.; Oke, T.R. The thermal regime of urban parks in two cities with different summer climates. Int. J. Remote Sens. 2010, 19, 2085–2104. [Google Scholar] [CrossRef]
  25. Upmanis, H.; Eliasson, I.; Sven, L. The influence of green areas on nocturnal temperatures in a high latitude. Int. J. Climatol. 1998, 18, 681–700. [Google Scholar] [CrossRef]
  26. Peng, J.; Dan, Y.; Qiao, R.; Liu, Y.; Dong, J.; Wu, J. How to quantify the cooling effect of urban parks? Linking maximum and accumulation perspectives. Remote Sens. Environ. 2021, 252, 112135. [Google Scholar] [CrossRef]
  27. Yan, H.; Wu, F.; Dong, L. Influence of a large urban park on the local urban thermal environment. Sci. Total Environ. 2018, 622–623, 882–891. [Google Scholar] [CrossRef]
  28. Yao, X.; Yu, K.; Zeng, X.; Lin, Y.; Ye, B.; Shen, X.; Liu, J. How can urban parks be planned to mitigate urban heat island effect in “Furnace cities” ? An accumulation perspective. J. Clean. Prod. 2022, 330, 129852. [Google Scholar] [CrossRef]
  29. Yu, Z.; Guo, X.; Jørgensen, G.; Vejre, H. How can urban green spaces be planned for climate adaptation in subtropical cities? Ecol. Indic. 2017, 82, 152–162. [Google Scholar] [CrossRef]
  30. Qiu, K.; Jia, B. The roles of landscape both inside the park and the surroundings in park cooling effect. Sustain. Cities Soc. 2020, 52, 101864. [Google Scholar] [CrossRef]
  31. Du, H.; Song, X.; Jiang, H.; Kan, Z.; Wang, Z.; Cai, Y. Research on the cooling island effects of water body: A case study of Shanghai, China. Ecol. Indic. 2016, 67, 31–38. [Google Scholar] [CrossRef]
  32. Lin, B.-S.; Lin, C.-T. Preliminary study of the influence of the spatial arrangement of urban parks on local temperature reduction. Urban For. Urban Green. 2016, 20, 348–357. [Google Scholar] [CrossRef]
  33. Peng, J.; Xie, P.; Liu, Y.; Ma, J. Urban thermal environment dynamics and associated landscape pattern factors: A case study in the Beijing metropolitan region. Remote Sens. Environ. 2016, 173, 145–155. [Google Scholar] [CrossRef]
  34. Yan, H.; Fan, S.; Guo, C.; Wu, F.; Zhang, N.; Dong, L. Assessing the effects of landscape design parameters on intra-urban air temperature variability: The case of Beijing, China. Build. Environ. 2014, 76, 44–53. [Google Scholar] [CrossRef]
  35. Yu, Z.; Yang, G.; Zuo, S.; Jørgensen, G.; Koga, M.; Vejre, H. Critical review on the cooling effect of urban blue-green space: A threshold-size perspective. Urban For. Urban Green. 2020, 49, 126630. [Google Scholar] [CrossRef]
  36. Geng, X.; Yu, Z.; Zhang, D.; Li, C.; Yuan, Y.; Wang, X. The influence of local background climate on the dominant factors and threshold-size of the cooling effect of urban parks. Sci. Total Environ. 2022, 823, 153806. [Google Scholar] [CrossRef]
  37. Chen, M.; Jia, W.; Yan, L.; Du, C.; Wang, K. Quantification and mapping cooling effect and its accessibility of urban parks in an extreme heat event in a megacity. J. Clean. Prod. 2022, 334, 130252. [Google Scholar] [CrossRef]
  38. Bao, T.; Li, X.; Zhang, J.; Zhang, Y.; Tian, S. Assessing the Distribution of Urban Green Spaces and its Anisotropic Cooling Distance on Urban Heat Island Pattern in Baotou, China. ISPRS Int. J. Geo-Inf. 2016, 5, 12. [Google Scholar] [CrossRef]
  39. Zhang, Y.; Murray, A.T.; Turner, B.L. Optimizing green space locations to reduce daytime and nighttime urban heat island effects in Phoenix, Arizona. Landsc. Urban Plan. 2017, 165, 162–171. [Google Scholar] [CrossRef]
  40. Hamada, S.; Ohta, T. Seasonal variations in the cooling effect of urban green areas on surrounding urban areas. Urban For. Urban Green. 2010, 9, 15–24. [Google Scholar] [CrossRef]
  41. Lee, S.-H.; Lee, K.-S.; Jin, W.-C.; Song, H.-K. Effect of an urban park on air temperature differences in a central business district area. Landsc. Ecol. Eng. 2009, 5, 183–191. [Google Scholar] [CrossRef]
  42. Wang, P.; Yang, Y.; Ji, C.; Huang, L. Positivity and difference of influence of built environment around urban park on building energy consumption. Sustain. Cities Soc. 2023, 89, 104321. [Google Scholar] [CrossRef]
  43. Ruiz, M.A.; Colli, M.F.; Martinez, C.F.; Correa-Cantaloube, E.N. Park cool island and built environment. A ten-year evaluation in Parque Central, Mendoza-Argentina. Sustain. Cities Soc. 2022, 79, 103681. [Google Scholar] [CrossRef]
  44. Du, H.; Cai, W.; Xu, Y.; Wang, Z.; Wang, Y.; Cai, Y. Quantifying the cool island effects of urban green spaces using remote sensing Data. Urban For. Urban Green. 2017, 27, 24–31. [Google Scholar] [CrossRef]
  45. Qi, Q.; Meng, Q.; Wang, J.; Ren, P. Developing an optimized method for the ‘stop-and-go’ strategy in mobile measurements for characterizing outdoor thermal environments. Sustain. Cities Soc. 2021, 69, 102837. [Google Scholar] [CrossRef]
  46. Lam, C.K.C.; Lee, H.; Yang, S.-R.; Park, S. A review on the significance and perspective of the numerical simulations of outdoor thermal environment. Sustain. Cities Soc. 2021, 71, 102971. [Google Scholar] [CrossRef]
  47. Sodoudi, S.; Zhang, H.; Chi, X.; Müller, F.; Li, H. The influence of spatial configuration of green areas on microclimate and thermal comfort. Urban For. Urban Green. 2018, 34, 85–96. [Google Scholar] [CrossRef]
  48. Deng, J.-Y.; Wong, N.H. Impact of urban canyon geometries on outdoor thermal comfort in central business districts. Sustain. Cities Soc. 2020, 53, 101966. [Google Scholar] [CrossRef]
  49. Stewart, I.D.; Oke, T.R. Local Climate Zones for Urban Temperature Studies. Bull. Am. Meteorol. Soc. 2012, 93, 1879–1900. [Google Scholar] [CrossRef]
  50. Bruse, M.; Fleer, H. Simulating surface–plant–air interactions inside urban environments with a three dimensional numerical model. Environ. Model. Softw. 1998, 13, 373–384. [Google Scholar] [CrossRef]
  51. Salata, F.; Golasi, I.; de Lieto Vollaro, R.; de Lieto Vollaro, A. Urban microclimate and outdoor thermal comfort. A proper procedure to fit ENVI-met simulation outputs to experimental data. Sustain. Cities Soc. 2016, 26, 318–343. [Google Scholar] [CrossRef]
  52. Hami, A.; Abdi, B.; Zarehaghi, D.; Maulan, S.B. Assessing the thermal comfort effects of green spaces: A systematic review of methods, parameters, and plants’ attributes. Sustain. Cities Soc. 2019, 49, 101634. [Google Scholar] [CrossRef]
  53. Yang, Y.; Gatto, E.; Gao, Z.; Buccolieri, R.; Morakinyo, T.E.; Lan, H. The “plant evaluation model” for the assessment of the impact of vegetation on outdoor microclimate in the urban environment. Build. Environ. 2019, 159, 106151. [Google Scholar] [CrossRef]
  54. Yanmei, D.; Lv, M.; Yu, Q.; Zhang, Y.; Bao, Z. Study on leaf area index analysis of common garden tree species in Hangzhou Huagang Guangyu Park. Adv. Omamental Hortic. China 2015, 10, 757–766. [Google Scholar]
  55. He, X.; Gao, W.; Wang, R. Impact of urban morphology on the microclimate around elementary schools: A case study from Japan. Build. Environ. 2021, 206, 108383. [Google Scholar] [CrossRef]
  56. Li, Y.; Fan, S.; Li, K.; Zhang, Y.; Kong, L.; Xie, Y.; Dong, L. Large urban parks summertime cool and wet island intensity and its influencing factors in Beijing, China. Urban For. Urban Green. 2021, 65, 127375. [Google Scholar] [CrossRef]
  57. Ouyang, W.; Morakinyo, T.E.; Ren, C.; Ng, E. The cooling efficiency of variable greenery coverage ratios in different urban densities: A study in a subtropical climate. Build. Environ. 2020, 174, 106772. [Google Scholar] [CrossRef]
  58. Zoulia, I.; Santamouris, M.; Dimoudi, A. Monitoring the effect of urban green areas on the heat island in Athens. Environ. Monit. Assess. 2009, 156, 275–292. [Google Scholar] [CrossRef]
  59. Chan, S.Y.; Chau, C.K. On the study of the effects of microclimate and park and surrounding building configuration on thermal comfort in urban parks. Sustain. Cities Soc. 2021, 64, 102512. [Google Scholar] [CrossRef]
  60. Perini, K.; Magliocco, A. Effects of vegetation, urban density, building height, and atmospheric conditions on local temperatures and thermal comfort. Urban For. Urban Green. 2014, 13, 495–506. [Google Scholar] [CrossRef]
  61. Morakinyo, T.E.; Kong, L.; Lau, K.K.-L.; Yuan, C.; Ng, E. A study on the impact of shadow-cast and tree species on in-canyon and neighborhood’s thermal comfort. Build. Environ. 2017, 115, 1–17. [Google Scholar] [CrossRef]
  62. Dimoudi, A.; Marialena, N. Vegetation in the urban environment: Microclimatic analysis and benefits. Energy Build. 2003, 35, 69–76. [Google Scholar] [CrossRef]
  63. Abdallah, A.S.H.; Mahmoud, R.M.A. Urban morphology as an adaptation strategy to improve outdoor thermal comfort in urban residential community of new assiut city, Egypt. Sustain. Cities Soc. 2022, 78, 103648. [Google Scholar] [CrossRef]
  64. Zhou, Y.; Zhao, H.; Mao, S.; Zhang, G.; Jin, Y.; Luo, Y.; Huo, W.; Pan, Z.; An, P.; Lun, F. Studies on urban park cooling effects and their driving factors in China: Considering 276 cities under different climate zones. Build. Environ. 2022, 222, 109441. [Google Scholar] [CrossRef]
  65. Karimimoshaver, M.; Shahrak, M.S. The effect of height and orientation of buildings on thermal comfort. Sustain. Cities Soc. 2022, 79, 103720. [Google Scholar] [CrossRef]
  66. Nugroho, N.Y.; Triyadi, S.; Wonorahardjo, S. Effect of high-rise buildings on the surrounding thermal environment. Build. Environ. 2022, 207, 108393. [Google Scholar] [CrossRef]
Figure 1. Schematic illustration of the park cool island and park breeze.
Atmosphere 14 00914 g001
Figure 2. Location of study area and distribution of the measurement routes and points.
Atmosphere 14 00914 g002
Figure 3. The characteristics of the built environment outside the park.
Atmosphere 14 00914 g003
Figure 4. The weather data recorded by the Fuyang District Meteorological Bureau for 19 August 2021 (a), meteorological data (air temperature, relative humidity) provided by the Fuyang Meteorological Bureau for the month of July, August 2021 (b).
Atmosphere 14 00914 g004
Figure 5. ENVI-met 3D model scene of the study area.
Atmosphere 14 00914 g005
Figure 6. Dominant plants in each layer of the plant community structure in the park (a), plant in parameters in ENVI-met (b).
Atmosphere 14 00914 g006
Figure 7. Measurement and simulation temperature graphs (a) and the correlation between measurement and simulation temperature (b) on 19 August 2021.
Atmosphere 14 00914 g007
Figure 8. Illustration of building configuration parameters for the simulation scenarios in this study.
Atmosphere 14 00914 g008
Figure 9. Spatial distribution of air temperature at 1.5 m above ground in the simulation scenarios of the building height at 14:00 and 22:00.
Atmosphere 14 00914 g009
Figure 10. Spatial distribution of air temperature at 1.5 m above ground in the simulation scenarios of the building interval at 14:00 and 22:00.
Atmosphere 14 00914 g010
Figure 11. Spatial distribution of air temperature at 1.5 m above ground in the simulation scenarios of the building orientation at 14:00 and 22:00.
Atmosphere 14 00914 g011
Figure 12. Air temperature profiles at 1.5 m height along the “E-W” direction for the simulation scenarios. Building height simulation scenarios at 14:00 (a) and 22:00 (b), building interval simulation scenarios at 14:00 (c) and 22:00 (d), building interval simulation scenarios at 14:00 (e) and 22:00 (f).
Atmosphere 14 00914 g012
Figure 13. Box plot of air temperature at 1.5 m height inside and outside the park in the simulation scenarios. Building height simulation scenarios at 14:00 (a) and 22:00 (b), building interval simulation scenarios at 14:00 (c) and 22:00 (d), building orientation simulation scenarios at 14:00 (e) and 22:00 (f), orange box: cooling intensity of the park exterior (building area), blue box: cooling intensity inside the park.
Atmosphere 14 00914 g013
Table 1. Input parameters for materials.
TypeMaterialInput Parameter [Unit]Setting
Building wall and roofConcreteAlbedo0.4
Emissivity0.9
Thermal conductivity
[W/(m.K)]
1.6
LaneAsphaltAlbedo0.2
Emissivity0.9
BrickAlbedo0.5
Emissivity0.9
SidewalkConcreteAlbedo0.4
Emissivity0.9
WaterbodyWaterAlbedo0
Emissivity0.96
Table 2. Summary of input meteorological parameters during the validation simulation.
Parameter TypeParameter NameSetting
Location on earthName of locationHangzhou, China
Latitude, longitude30°29′ N, 120°16′ E
Time and dateStart date19 August 2021
Start time00:00
Total simulation time24 h
Initial meteorological conditionsInitial temperature of atmosphere297.8 K
(Initial) relative humidity at 2 m81%
(Initial) specific humidity at
model top (2500 m)
7.0 g/kg
Wind speed measured at 10 m 2.0 m/s
Wind direction (0: N,180: S)90°
Roughness length0.1
Radiation adjustment factor
Forcing mode
0.8
Full forcing
Soil dataInitial temperature,
upper layer (0–20 cm)
28.6 °C
Initial temperature,
middle layer (20–50 cm)
28.6 °C
Initial temperature,
deep layer (0–20 cm)
28.0 °C
Table 3. Summary of input meteorological parameters during the scenario simulation.
Parameter TypeParameter NameSetting
Location on earthName of locationHangzhou, China
Latitude, longitude30°29′ N, 120°16′ E
Time and dateStart date15 July 2021
Start time00:00
Total simulation time24 h
Initial meteorological conditionsInitial temperature of atmosphere304.7 K
(Initial) relative humidity at 2 m64%
(Initial) specific humidity at
model top (2500 m)
7.0 g/kg
Wind speed measured at 10 m 2.0 m/s
Wind direction (0: N, 180: S)90°
Roughness length0.1
Radiation adjustment factor
Forcing mode
0.8
Full forcing
Soil dataInitial temperature,
upper layer (0–20 cm)
28.6 °C
Initial temperature,
middle layer (20–50 cm)
28.6 °C
Initial temperature,
deep layer (0–20 cm)
28.0 °C
Disclaimer/Publisher’s Note: The statements, opinions and data contained in all publications are solely those of the individual author(s) and contributor(s) and not of MDPI and/or the editor(s). MDPI and/or the editor(s) disclaim responsibility for any injury to people or property resulting from any ideas, methods, instructions or products referred to in the content.

