
Brightness Temperature Characteristics of Short-Duration Heavy Rainfall in the Chengdu–Chongqing Railway Region in China


Abstract
1. Introduction
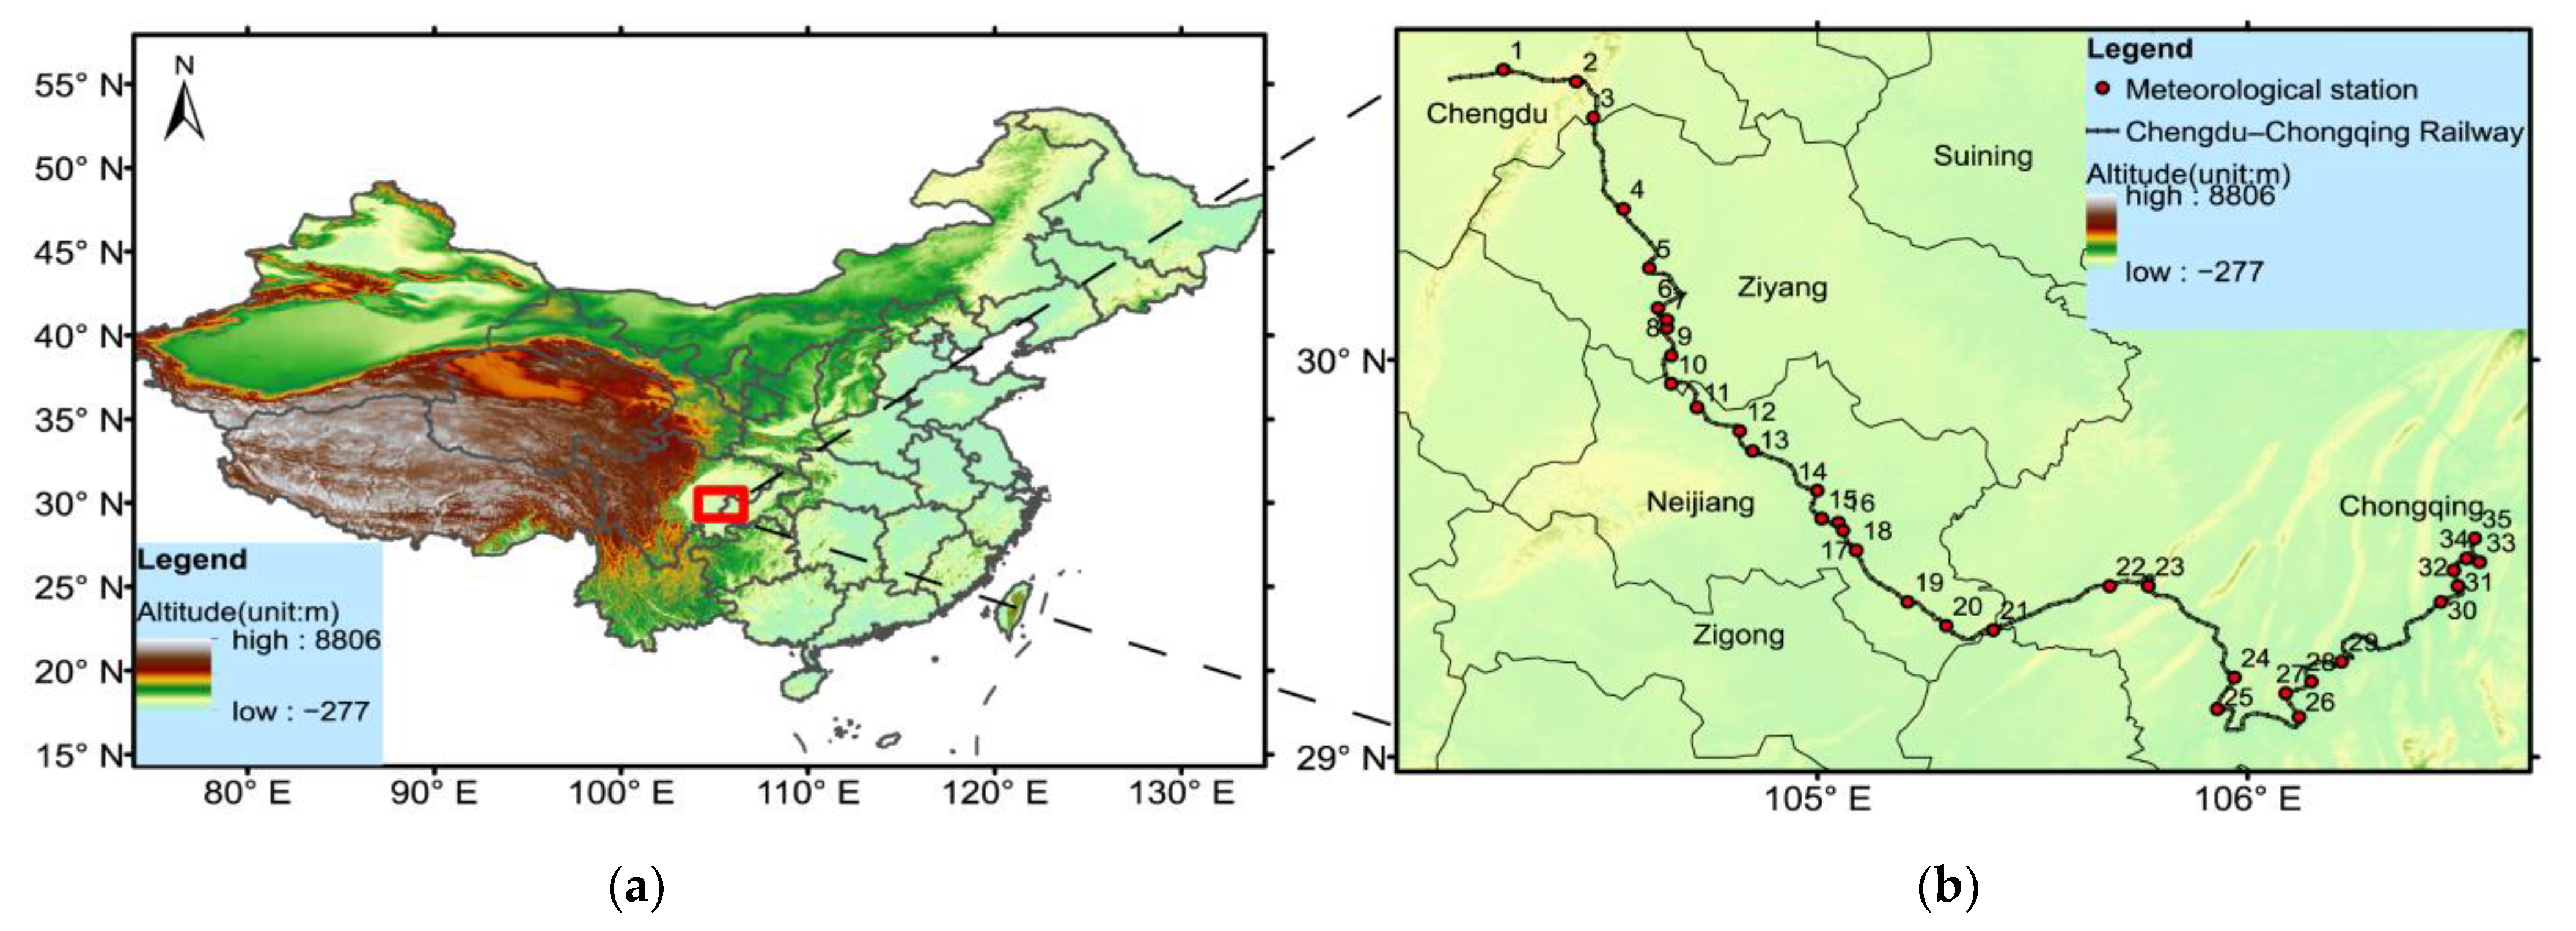
2. Data and Methods
3. Spatiotemporal Distribution Characteristics of SDHR
4. Relationship between SDHR and TBB and Its Estimating Equation
4.1. TBB Characteristics of SDHR
4.2. TBB Characteristics of the Different Levels of SDHR
4.3. Relationship between SDHR and TBB and Its Estimating Equation
5. Conclusions
- (1)
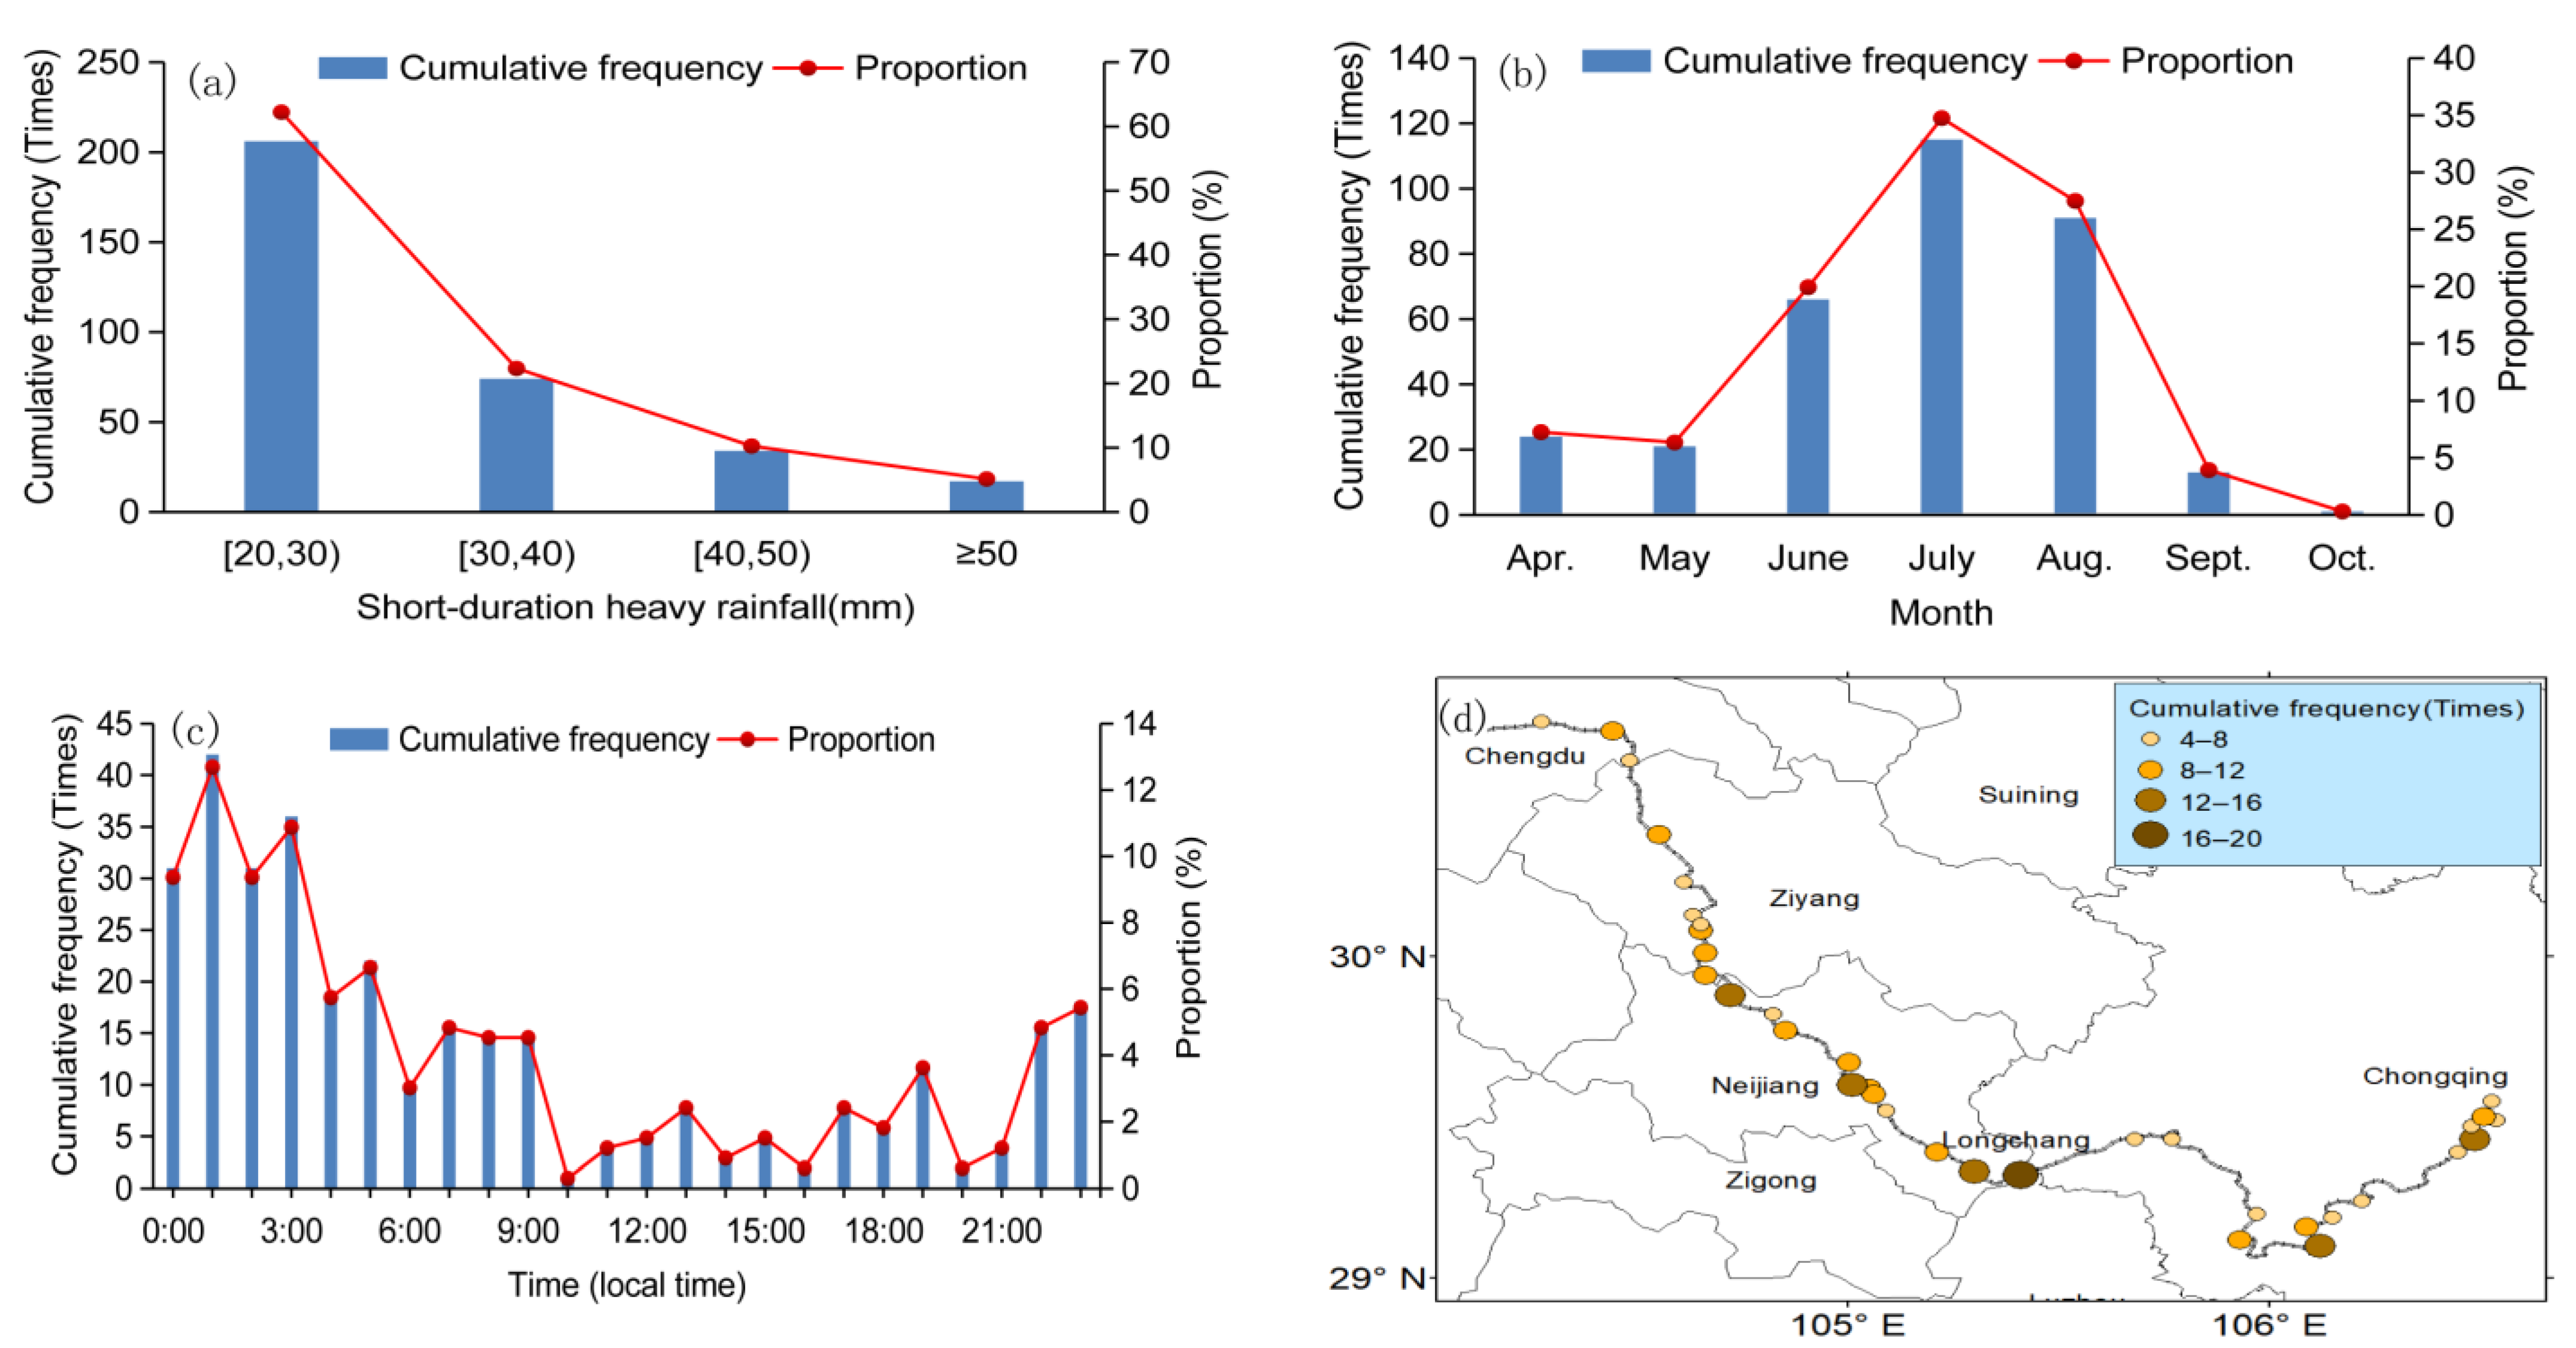
- The frequency of SDHR along the CCR decreased with increasing rainfall intensity. SDHR events with an hourly rainfall of 20–30 mm occurred most frequently, and those with hourly rainfall ≥ 50 mm occurred least frequently. SDHR events were mainly concentrated in June to August and occurred most frequently in July. SDHR showed clear diurnal variation, occurring most frequently at night, particularly between 22:00–05:00 and 06:00–09:00, with a peak at 01:00.
- (2)
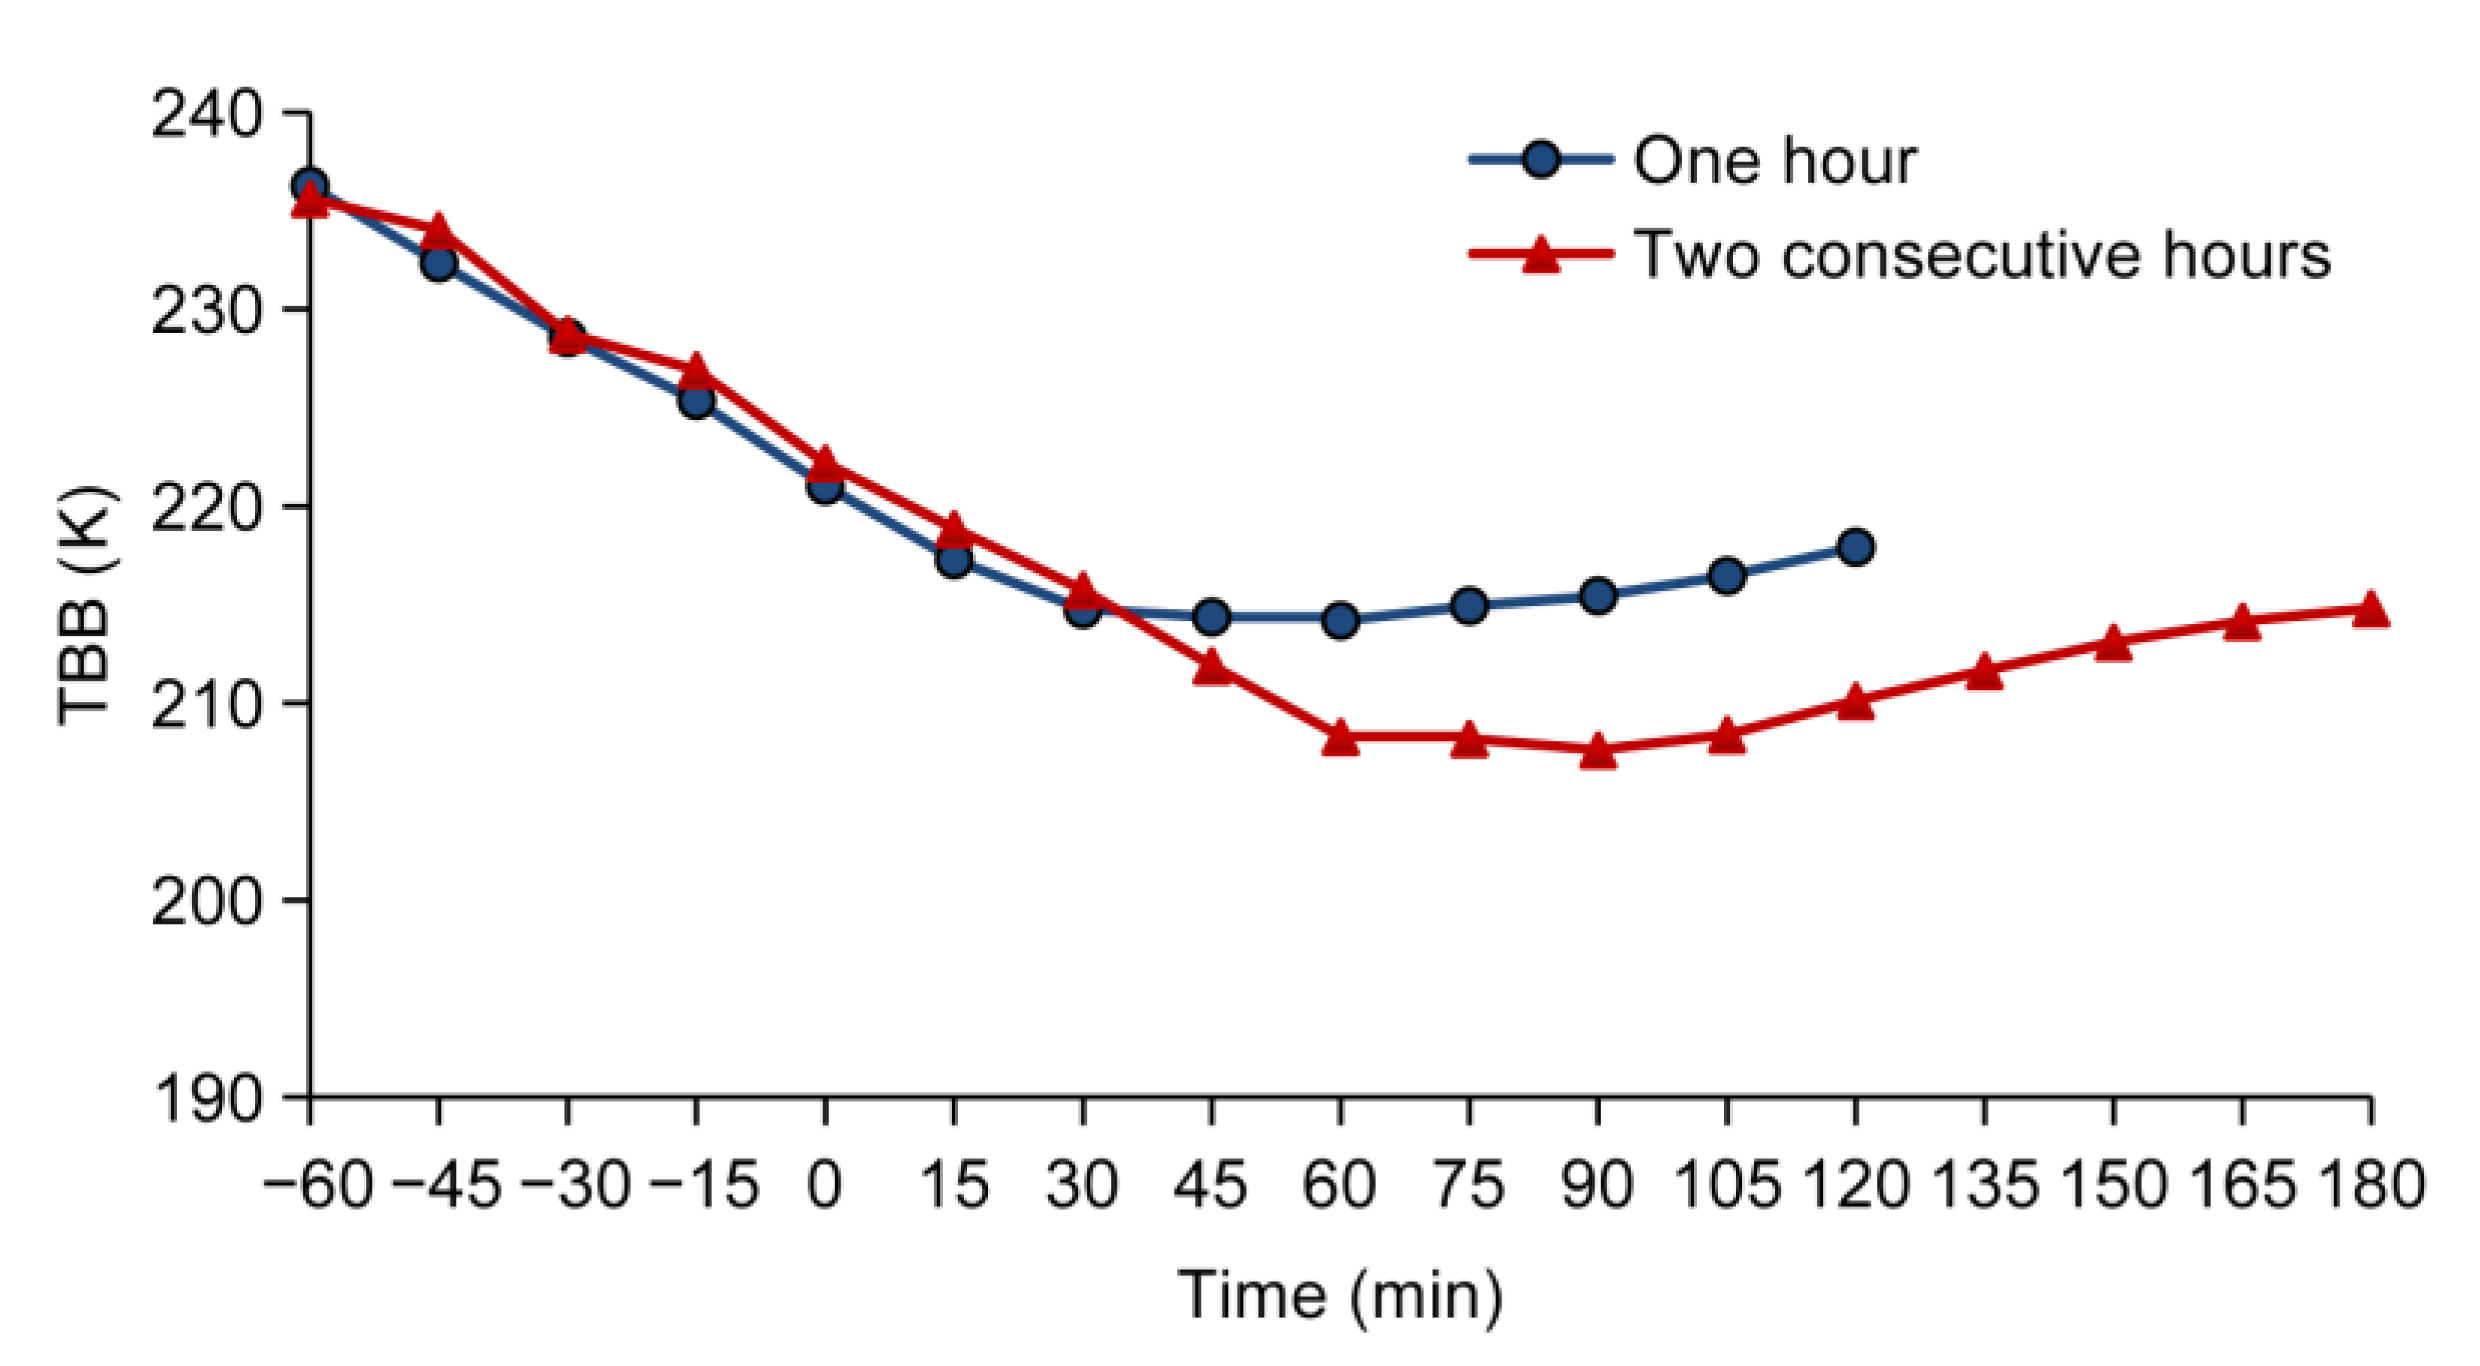
- TBB decreased rapidly 1 h before the occurrence of SDHR along the CCR. SDHR was accompanied by a decrease in TBB to its minimum value, after which TBB increased, and the SDHR ceased. In cases where TBB approached a minimum value at 1 h but continued to drop slightly, SDHR continued.
- (3)
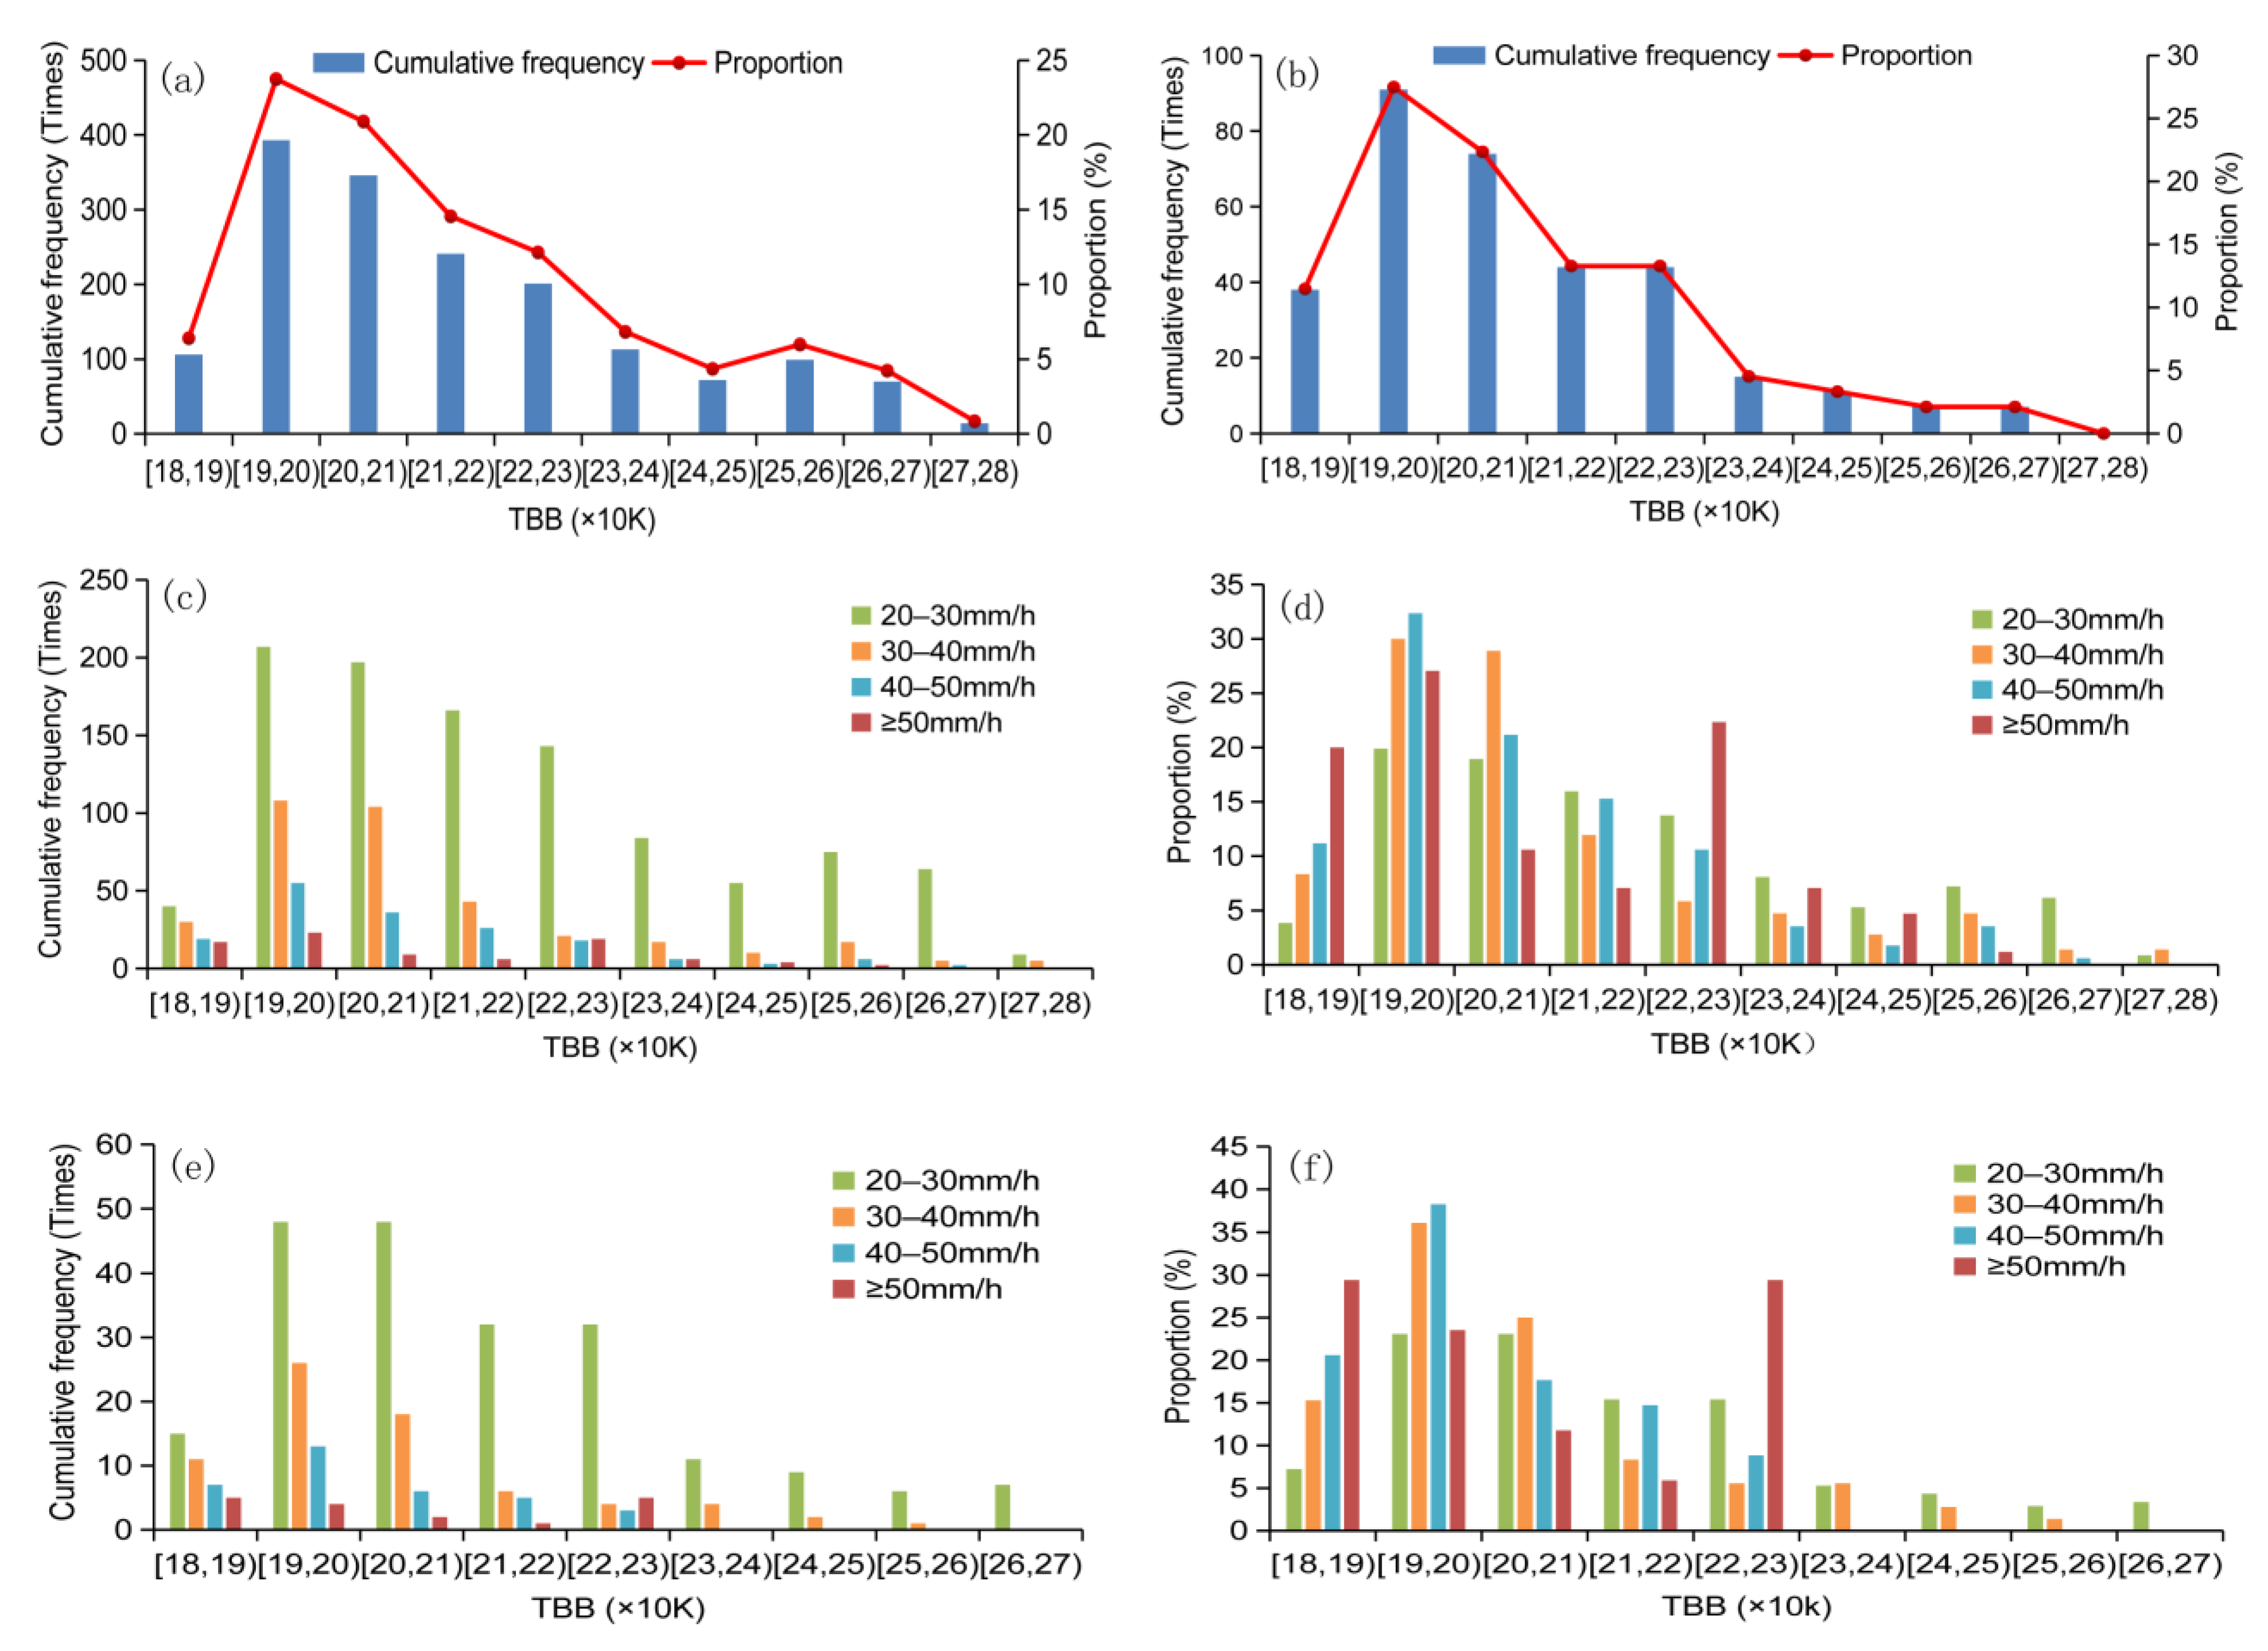
- During SDHR events, the majority of the TBB values were recorded in the range 190–230 K; within this range, values between 190 and 200 K were most frequently recorded. For SDHR events with an hourly rainfall of 20–30 mm, the majority of the TBB values were recorded in the range 190–230 K; for rainfall values of 30–40 mm and 40–50 mm, the majority of the TBB values were recorded in the range 180–220 K; and for rainfall values ≥ 50 mm, the majority of the TBB values were recorded in the ranges 180–210 K and 220–230 K. In general, lower TBB values are associated with more intense SDHR. An estimating equation was established for the rainfall values of SDHR events. The estimates were found to be consistent with the actual rainfall measurements, which could enable future estimates of rainfall values for SDHR along the CCR.
Author Contributions
Funding
Institutional Review Board Statement
Informed Consent Statement
Data Availability Statement
Conflicts of Interest
References
- Chen, J.; Zheng, Y.G.; Zhang, X.L.; Zhu, P.J. Distribution and diurnal variation of warm-season short-duration heavy rainfall in relation to the MCSs in China. Acta Meteor. Sin. 2013, 27, 868–888. [Google Scholar] [CrossRef]
- Kendon, E.J.; Blenkinsop, S.; Fowler, H.J. When will we detect changes in short-duration precipitation extremes? J. Clim. 2018, 31, 2945–2964. [Google Scholar] [CrossRef]
- Liu, K.; Wang, M.; Zhou, T.J. Increasing costs to Chinese railway infrastructure by extreme precipitation in a warmer world. Transpor. Res. D-Transp. Environ. 2021, 93, 102797. [Google Scholar] [CrossRef]
- Palin, E.J.; Oslakovic, I.S.; Gavin, K.; Quinn, A. Implications of climate change for railway infrastructure. WIREs Clim. Chang. 2021, 12, e728. [Google Scholar] [CrossRef]
- Ma, J.L.; Yao, X.P. Summer extreme precipitation in the key region of the Sichuan-Tibet Railway. Adv. Atmos. Sci. 2023, 40, 843–855. [Google Scholar] [CrossRef]
- Alexander, L.V.; Zhang, X.; Peterson, T.C.; Caesar, J.; Gleason, B.; Klein Tank, A.M.G.; Haylock, M.; Collins, D.; Trewin, B.; Rahimzadeh, F.; et al. Global observed changes in daily climate extremes of temperature and precipitation. J. Geophys. Res.-Atmos. 2006, 111, D05109. [Google Scholar] [CrossRef]
- Wang, Y.Q.; Zhou, L. Observed trends in extreme precipitation events in China during 1961-2001 and the associated changes in large-scale circulation. Geophys. Res. Lett. 2005, 32, L09707. [Google Scholar] [CrossRef]
- Zhai, P.M.; Zhang, X.B.; Wan, H.; Pan, X.H. Trends in total precipitation and frequency of daily precipitation extremes over China. J. Clim. 2005, 18, 1096–1108. [Google Scholar] [CrossRef]
- Westra, S.; Fowler, H.; Evants, J.P.; Alexander, L.V.; Berg, P.; Johnson, F.; Kendon, E.J.; Lenderink, G.; Roberts, N.M. Future changes to the intensity and frequency of short-duration extreme rainfall. Rev. Geophys. 2014, 52, 522–555. [Google Scholar] [CrossRef]
- Donat, M.G.; Lowry, A.L.; Alexander, L.V.; O’Gorman, P.A.; Maher, N. More extreme precipitation in the world’s dry and wet regions. Nat. Clim. Chang. 2016, 6, 508–513. [Google Scholar] [CrossRef]
- Myhre, G.; Alterskjar, K.; Stjern, C.W.; Hodnebrog, Q.; Marelle, L.; Samset, B.H.; Sillmann, J.; Schaller, N.; Fischer, E.; Schulz, M.; et al. Frequency of extreme precipitation increases extensively with event rareness under global warming. Sci. Rep. 2019, 9, 16063. [Google Scholar] [CrossRef]
- Martel, J.L.; Mailhot, A.; Brissette, F. Global and regional projected changes in 100-yr subdaily, daily, and multiday precipitation extremes estimated from three large ensembles of climate simulations. J. Clim. 2020, 33, 1089–1103. [Google Scholar] [CrossRef]
- Hichens, N.M.; Brooks, H.E.; Schumacher, R.S. Spatial and temporal characteristics of heavy hourly rainfall in the United States. Mon. Weather Rev. 2013, 141, 4564–4575. [Google Scholar] [CrossRef]
- Li, Z.; Yang, D.W.; Hong, Y.; Zhang, J.; Qi, Y.C. Characterizing spatiotemporal variations of hourly rainfall by gauge and radar in the mountainous three gorges region. J. Appl. Meteorol. Clim. 2014, 53, 873–889. [Google Scholar] [CrossRef]
- Li, H.Q.; Cui, X.P.; Zhang, D.L. A statistical analysis of hourly heavy rainfall events over the Beijing metropolitan region during the warm seasons of 2007–2014. Int. J. Climatol. 2017, 37, 4027–4042. [Google Scholar] [CrossRef]
- Jiang, X.L.; Luo, Y.L.; Zhang, D.L.; Wu, M.W. Urbanization enhanced summertime extreme hourly precipitation over the Yangtze river delta. J. Clim. 2020, 33, 5809–5826. [Google Scholar] [CrossRef]
- Li, J.; Yu, R.C.; Sun, W. Duration and seasonality of hourly extreme rainfall in the central eastern China. Acta Meteor. Sin. 2013, 27, 799–807. [Google Scholar] [CrossRef]
- Zhang, H.; Zhai, P.M. Temporal and spatial characteristics of extreme hourly precipitation over eastern China in the warm season. Adv. Atmos. Sci. 2011, 28, 1177–1183. [Google Scholar] [CrossRef]
- Zheng, Y.G.; Gong, Y.D.; Chen, J.; Tian, F.Y. Warm-season diurnal variations of total, stratiform, convective, and extreme hourly precipitation over central and eastern China. Adv. Atmos. Sci. 2019, 36, 143–159. [Google Scholar] [CrossRef]
- Luo, Y.L.; Wu, M.W.; Ren, F.M.; Li, J.; Wong, W.K. Synoptic situations of extreme hourly precipitation over China. J. Clim. 2016, 29, 8703–8719. [Google Scholar] [CrossRef]
- Wu, M.; Wu, C.C.; Yen, T.H.; Luo, Y.L. Synoptic analysis of extreme hourly precipitation in Taiwan during 2003-12. Mon. Weather Rev. 2017, 145, 5123–5140. [Google Scholar] [CrossRef]
- Yang, P.; Ren, G.Y.; Hou, W.; Liu, W.D. Spatial and diurnal characteristics of summer rainfall over Beijing municipality based on a high-density AWS dataset. Int. J. Climatol. 2013, 33, 2769–2780. [Google Scholar] [CrossRef]
- Liang, P.; Ding, Y. The long-term variation of extreme heavy precipitation and its link to urbanization effects in Shanghai during 1916–2014. Adv. Atmos. Sci. 2017, 34, 321–334. [Google Scholar] [CrossRef]
- Wang, D.S.; Wang, X.W.; Liu, L.; Wang, D.G.; Zeng, Z.Z. Urban signatures in the spatial clustering of precipitation extremes over mainland China. J. Hydrometeorol. 2021, 22, 639–656. [Google Scholar] [CrossRef]
- Yang, P.; Ren, G.Y.; Yan, P.C. Evidence for a strong association of short-duration intense rainfall with urbanization in the Beijing urban area. J. Clim. 2017, 30, 5851–5870. [Google Scholar] [CrossRef]
- Wu, M.W.; Luo, Y.L.; Chen, F.; Wong, W.K. Observed link of extreme hourly precipitation changes to urbanization over coastal south China. J. Appl. Meteor. Climatol. 2019, 58, 1799–1819. [Google Scholar] [CrossRef]
- Tian, F.Y.; Zheng, Y.G.; Zhang, T.; Zhang, X.L.; Mao, D.Y.; Sun, J.H.; Zhao, S.X. Statistical characteristics of environmental parameters for warm season short-duration heavy rainfall over central and eastern China. J. Meteor. Res. 2015, 29, 370–384. [Google Scholar] [CrossRef]
- Meng, Y.N.; Sun, J.H.; Zhang, Y.C.; Fu, S.M. A 10-Year climatology of mesoscale convective systems and their synoptic circulations in the southwest mountain area of China. J. Hydrometeorol. 2020, 22, 23–41. [Google Scholar] [CrossRef]
- Ma, R.Y.; Sun, J.H.; Yang, X.L. A 7-Yr climatology of the initiation, decay, and morphology of severe convective storms during the warm season over north China. Mon. Weather Rev. 2021, 149, 2599–2612. [Google Scholar] [CrossRef]
- Zou, Q.L.; Cui, X.P.; Hao, S.F. The statistical relationship of lightning activity and short-duration rainfall events over Guangzhou, China, in 2017. Weather Forecast. 2022, 37, 601–615. [Google Scholar] [CrossRef]
- Chen, Y.R.; Li, Y.Q. A thermodynamic condition affecting the movement of a southwest China vortex case. Meteorol. Atmos. Phys. 2022, 134, 36. [Google Scholar] [CrossRef]
- Chen, Y.R.; Li, Y.Q.; Kang, L. An index reflecting mesoscale vortex–vortex interaction and its diagnostic applications for rainstorm area. Atmos. Sci. Lett. 2019, 20, e902. [Google Scholar] [CrossRef]
- Chen, Y.R.; Li, Y.Q. Analysis of a late-autumn rainstorm in the Sichuan basin on the eastern side of the Tibetan plateau. Adv. Meteorol. 2019, 2019, 8797368. [Google Scholar] [CrossRef]
- Chen, Y.R.; Li, Y.Q.; Qi, D.M. Analysis of the convective characteristics during the mutual evolution of an inverted trough/low vortex and its induced rainstorm over the northeastern Sichuan basin, China. Meteorol. Atmos. Phys. 2019, 131, 807–825. [Google Scholar] [CrossRef]
- Chen, Y.R.; Li, Y.Q. Convective Characteristics and formation conditions in an extreme rainstorm on the eastern edge of the Tibetan plateau. Atmosphere 2021, 12, 381. [Google Scholar] [CrossRef]
- Chen, Y.R.; Li, Y.Q.; Liu, X.C.; Zhu, L. Helicity characteristics of cyclonic vortexes and their effect on convection in a wide-ranging extreme rainstorm in China. Atmos. Sci. Lett. 2023, 24, e1162. [Google Scholar] [CrossRef]
- Deng, M.Y.; Lu, R.Y.; Li, C.F. Contrasts between the interannual variations of extreme rainfall over western and eastern Sichuan in mid-summer. Adv. Atmos. Sci. 2022, 39, 999–1011. [Google Scholar] [CrossRef]
- Zheng, Y.G.; Xue, M.; Li, B.; Chen, J.; Tao, Z.Y. Spatial characteristics of extreme rainfall over China with hourly through 24-hour accumulation periods based on national-level hourly rain gauge data. Adv. Atmos. Sci. 2016, 33, 1218–1232. [Google Scholar] [CrossRef]
- Huang, J.; Sun, S.L.; Xue, Y.; Li, J.J.; Zhang, J.C. Spatial and temporal variability of precipitation and dryness/wetness during 1961−2008 in Sichuan province, west China. Water Resour. Manag. 2014, 28, 1655–1670. [Google Scholar] [CrossRef]
- Li, J.; Zhao, Y.D.; Iqbal, J. Variation patterns of extreme precipitation and relation to ocean-atmospheric climate in Sichuan province China from 1961 to 2017. Theor. Appl. Climatol. 2019, 137, 3009–3026. [Google Scholar] [CrossRef]
- Yang, J.; Zhang, Z.Q.; Wei, C.Y.; Lu, F.; Guo, Q. Introducing the new generation of Chinese geostationary weather satellites, Fengyun-4. Bull. Am. Meteor. Soc. 2017, 98, 1637–1658. [Google Scholar] [CrossRef]
- Yu, Z.F.; Ma, S.; Han, D.; Li, G.L.; Yan, W.; Liu, J.D. Physical and optical properties of clouds in the southwest Vortex from FY-4A cloud retrievals. J. Appl. Meteor. Climatol. 2022, 61, 1123–1138. [Google Scholar] [CrossRef]
- Xu, L.; Cheng, W.; Deng, Z.R.; Liu, J.J.; Wang, B.; Lu, B.; Wang, S.D.; Dong, L. Assimilation of the FY-4A AGRI clear-sky radiance data in a regional numerical model and its impact on the forecast of the “21·7” Henan extremely persistent heavy rainfall. Adv. Atmos. Sci. 2022, 40, 920–936. [Google Scholar] [CrossRef]
- Shao, J.L.; Gao, H.; Wang, X.; Zhang, Q.Q. Application of Fengyun-4 satellite to flood disaster monitoring through a rapid multi-temporal synthesis approach. J. Meteor. Res. 2020, 34, 720–731. [Google Scholar] [CrossRef]
- Pearson, K. VII. Mathematical contributions to the theory of evolution. -III. Regression, heredity, and panmixia. Philos. Trans. R. Soc. Lond. 1896, 187A, 253–318. [Google Scholar] [CrossRef]


| One Hour before SDHR | During the Occurrence of SDHR | One Hour after SDHR | |
|---|---|---|---|
| Mean TBB | −0.1025 | −0.2469 | −0.2422 |
| Minimum TBB | −0.1358 | −0.2638 | −0.2244 |
| Local Time | 2:00 | 3:00 | 4:00 | 5:00 | 6:00 | 7:00 | ||||||||
|---|---|---|---|---|---|---|---|---|---|---|---|---|---|---|
| Site | SHV | LC | ZZ | YX | FX | YLB | LGM | YLB | SFT | ZX | WF | RH | SBT | |
| Measured rainfall (mm) | 41.5 | 40.8 | 38.7 | 35 | 48.8 | 34.4 | 25.3 | 41 | 21.4 | 20.6 | 32.3 | 34.1 | 26.7 | |
| Estimated rainfall (mm) | Equation (5) | 31.2 | 30.6 | 30.3 | 31.1 | 30.4 | 29.7 | 32.9 | 31.5 | 32.2 | 32.6 | 29.3 | 29.6 | 30.6 |
| Equation (6) | 32.2 | 31.4 | 31.0 | 32.0 | 31.1 | 30.4 | 34.6 | 32.6 | 33.6 | 34.3 | 29.9 | 30.3 | 31.5 | |
| Absolute error (mm) | Equation (5) | 10.3 | 10.2 | 8.4 | 3.9 | 18.4 | 4.7 | 7.6 | 9.5 | 10.8 | 12 | 3 | 4.5 | 3.9 |
| Equation (6) | 9.3 | 9.4 | 7.7 | 3.0 | 17.7 | 4.0 | 9.3 | 8.4 | 12.2 | 13.7 | 2.4 | 3.8 | 4.8 | |
| Absolute error rate (%) | Equation (5) | 24.8 | 25.0 | 21.7 | 11.1 | 37.7 | 13.7 | 30.0 | 23.2 | 50.5 | 58.3 | 9.3 | 13.2 | 14.6 |
| Equation (6) | 22.4 | 23.0 | 19.9 | 8.6 | 36.3 | 11.6 | 36.8 | 20.5 | 57.0 | 66.5 | 7.4 | 11.1 | 18.0 | |
Disclaimer/Publisher’s Note: The statements, opinions and data contained in all publications are solely those of the individual author(s) and contributor(s) and not of MDPI and/or the editor(s). MDPI and/or the editor(s) disclaim responsibility for any injury to people or property resulting from any ideas, methods, instructions or products referred to in the content. |
© 2023 by the authors. Licensee MDPI, Basel, Switzerland. This article is an open access article distributed under the terms and conditions of the Creative Commons Attribution (CC BY) license (https://creativecommons.org/licenses/by/4.0/).
Share and Cite
Liu, X.; Chen, Y.; Guo, J.; Song, W.; Dan, J. Brightness Temperature Characteristics of Short-Duration Heavy Rainfall in the Chengdu–Chongqing Railway Region in China. Atmosphere 2023, 14, 896. https://doi.org/10.3390/atmos14050896
Liu X, Chen Y, Guo J, Song W, Dan J. Brightness Temperature Characteristics of Short-Duration Heavy Rainfall in the Chengdu–Chongqing Railway Region in China. Atmosphere. 2023; 14(5):896. https://doi.org/10.3390/atmos14050896
Chicago/Turabian StyleLiu, Xinchao, Yongren Chen, Jie Guo, Wenwen Song, and Jia Dan. 2023. "Brightness Temperature Characteristics of Short-Duration Heavy Rainfall in the Chengdu–Chongqing Railway Region in China" Atmosphere 14, no. 5: 896. https://doi.org/10.3390/atmos14050896
APA StyleLiu, X., Chen, Y., Guo, J., Song, W., & Dan, J. (2023). Brightness Temperature Characteristics of Short-Duration Heavy Rainfall in the Chengdu–Chongqing Railway Region in China. Atmosphere, 14(5), 896. https://doi.org/10.3390/atmos14050896