Article

Analysis of Large-Scale Environmental Features during Maximum Intensity of Tropical Cyclones Using Reanalysis Data

by
Mohan Murali Krishna Gorja
1,
Venkata Sai Gulakaram
2,
Naresh Krishna Vissa
1,*,
Yesubabu Viswanadhapalli
3 and
Bhishma Tyagi
1
1
Department of Earth and Atmospheric Sciences, National Institute of Technology Rourkela, Rourkela 769008, India
2
Indian National Centre for Ocean Information Services (INCOIS), Hyderabad 500090, India
3
Weather and Climate Research Group, National Atmospheric Research Laboratory, Gadanki, Tirupati 517112, India
*
Author to whom correspondence should be addressed.
Atmosphere 2023, 14(2), 333; https://doi.org/10.3390/atmos14020333
Submission received: 2 December 2022 / Revised: 2 February 2023 / Accepted: 2 February 2023 / Published: 7 February 2023
(This article belongs to the Section Meteorology)

Abstract

:
The present study investigates the variation in large-scale environments during the maximum intensity of tropical cyclones (TCs) formed in the Bay of Bengal. TC tracks are classified into four groups based on their direction of movement using the k-means clustering technique. Results from the pressure level and azimuthal-averaged radial-height wind fields near the vortex centre show weak deep layer wind shear (WS) and abundant moisture in all clusters. However, large-scale environmental differences in the northwest quadrant are identified with a contrasting combination of WS and humid environment between clusters. The composites of OLR are also analyzed during maximum intensities of TCs. Results show that anomalous high OLR in the west–northwest direction from the vortex centre, along with the low OLR around the vortex centre, signify the formation of a strong OLR dipole during TC peak intensity. Furthermore, OLR dipole metrics, such as magnitude, orientation, and distance, are observed by having mean of 235 Wm−2, 147, and 1782 km along with standard deviation of 14 Wm−2, 34°, and 492 km, respectively. The identified large-scale environmental fields from this study could provide valuable insights for predicting the intensity and movement of TCs.

1. Introduction

Tropical cyclones (TCs) are intense atmospheric vortices formed over warm tropical ocean waters. Most TCs develop and strengthen when a pre-existing disturbance is associated with tropical cloud clusters. They propagate into the region where favourable conditions, such as high sea surface temperature (>26 °C), a large gradient in equivalent potential temperature, sufficient moisture between the surface to mid-troposphere, and low-level positive vorticity, exist [1]. The formation of TCs often causes a colossal impact on livelihoods and property during their landfall by inducing intense rainfall, gusty winds, severe terrestrial flooding, and high storm surges [2,3]. These catastrophic impacts depend on the inherent characteristics, such as size, intensity, and movement, of TCs that drastically change during their lifecycle. Therefore, numerous researchers have rigorously studied using observations and models to understand the factors and underlying mechanisms responsible for the variation in intensity and movement of TCs [4,5,6,7,8,9,10,11,12,13]. The atmospheric fields, such as wind shear and moisture in the low-level to mid-troposphere, influence the genesis and intensity of TCs [4,14,15,16,17]. The movement of TCs is governed by an average of tropospheric wind fields or steering flows [4,10] and the beta effect [9,18,19]. In addition to atmospheric factors, the formation and development of TCs are also prominently influenced by oceanic parameters by fuelling a significant amount of energy through heat fluxes at the air–sea interface [5,6,8,13,20,21,22,23,24]. However, the prior studies could be more comprehensive in understanding dynamics and environmental conditions modulating TC characteristics up to small spatial scales.
On the other hand, it is found that the characteristics of TCs are also influenced by the interaction of the vortex with external forces, such as surrounding large-scale environmental fields and existing synoptic-scale systems [25,26,27,28]. Lee et al. [29] emphasized that the genesis of TCs over the North Indian Ocean (NIO) is associated with an accelerated lower-tropospheric wind flow that enhances low-level positive vorticity and large-scale vertical ascent, whereas the intensification of TCs is caused due to the formation of the upper-tropospheric trough, development of upper-level outflow channels, and gradual turning of initial asymmetric shearing vorticity into symmetric curvature vorticity. Similarly, Ventham and Wang [30] investigated synoptic-scale flow patterns during a TC’s intensification phase. They found that the confluence of low-level winds, establishment of well-defined upper-level outflows, and presence of troughs and ridges at appropriate locations favour the intensification of TCs. In addition, previous studies also identified that the advection of dry air and the relative location of moist/dry air in combination with wind shear from the vortex centre also play a crucial role in modulating the intensity of TCs [31,32,33].
The movement of TCs can be determined by identifying the appropriate steering level, i.e., pressure level, at which the movement matches with the flow direction of the surrounding wind field [34,35]. For example, Pal and Chatterjee [36] identified that the wind vectors flow at the 200 hPa level, determining the direction of movement of TCs in the Bay of Bengal (BoB). Further, their findings suggest that easterly trade winds in the lower latitudes and sub-tropical westerlies in higher latitudes play a critical role in fluctuating TC paths. The combined effects of diabetic heating associated with asymmetric convection and beta effect also influence the movement of TCs in the absence of steering flow [19]. The tracks of TCs are also influenced by the presence of synoptic-scale systems, such as troughs or ridges in the subtropics, in addition to steering flows [34,37]. Francis et al. [27] elucidated how the movement of TCs, such as Shaheen (2021) and Gonu (2007), in the Arabian Sea (AS) over the NIO is influenced by the presence of strong anti-cyclonic ridges and high-pressure systems. Therefore, understanding these large-scale features will help in estimating the track and intensity of TCs. In the Pacific and Atlantic oceans, the variation in large-scale environmental features is investigated using composite analysis, which provides better insights into the formation and development of TCs [11,38,39,40].
The NIO comprises two semi-enclosed basins viz. AS and BoB accounted for 7% of global TCs annually [41,42,43]. The formation of TCs in NIO has a distinct bimodal character with two peaks varying TC occurrence from pre-monsoon (March–May) to post-monsoon (October–December) season, especially over the BoB [44]. The BoB region accounts for 70–80% of cyclogenesis compared to the adjacent AS and is more susceptible to the formation and development of severe cyclones [45,46]. During the landfall of TCs, the adjacent topographically low-lying flat regions experience severe socio-economic consequences [46,47,48]. However, the variation in large-scale environmental features during the lifecycle of TCs is less explored over NIO, especially in the BoB, than in other ocean basins. Therefore, the present study attempted to examine the variation in different large-scale environmental features affecting TC characteristics by using a composite analysis of TCs formed over the BoB.
The remainder of the manuscript is designed as follows. The data and methodology used in the present study are illustrated in Section 2. The results from a composite analysis showing large-scale mean features are discussed in Section 3. Finally, the main conclusions of the study and future scope are summarized in Section 4.

2. Materials and Methods

2.1. TC Tracks Data

TCs best tracks data provided by Regional Specialized Meteorological Centre (RSMC), India Meteorological Department (IMD), New Delhi, are used. The best tracks data provide information of TCs, such as position, intensity, mean sea level pressure (MSLP), and central pressure drop. The IMD classified the category of TCs formed over NIO based on 3 min average, 10 m height from the surface of the maximum sustained wind (MSW) [49]. For the present study, 93 TCs occurred during pre-monsoon consisting of 24 TCs, and post-monsoon with 69 TCs over the BoB are considered between 1982 and 2020.

2.2. ERA5 Reanalysis Data

The various reanalysis data sets are used to understand physical mechanisms associated with the genesis and evolution of complex atmospheric phenomena such as TCs [38,39,50]. The suitability of the fifth generation of European Centre for Medium-Range Weather Forecasts (ECMWF) atmospheric reanalysis of global climate data (ERA5) for understanding the TC characteristics, such as location, intensity, and movement, was examined in the NIO [28,51,52]. Therefore, the ERA5 data were used in the present study to examine the variation in large-scale features during TCs. ERA5 data with horizontal and vertical resolutions of 0.25° × 0.25° and 37 pressure levels (1000 hPa to 1 hPa), respectively, at the hourly temporal resolution, were prepared by combining model data and observations on a real-time basis through data assimilation techniques [53]. The single-level variable of outgoing long-wave radiation (OLR) at the top of the atmosphere and multiple pressure level variables, such as relative humidity (RH), zonal (u) and meridional (v) components of winds, and divergence at 3 h intervals, are used in the present study.

2.3. Clustering Technique

The tracks of TCs obtained from IMD best track data are classified into four clusters using a non-hierarchical k-means clustering technique [54,55]. This method divides tracks of TCs based on the last position of TCs (Figure 1), which is classified as the cyclone (≥34 kt) stage before decaying into deep depression or depression, as defined by the IMD. The clustering method was previously used over the Atlantic Ocean basin by choosing genesis and maximum intensity locations [56,57]. Similarly, the reference points used for clustering in the present study accounted for the direction of movement of TCs along with genesis locations. In the classification, Cluster-1 consists of 26 TCs that are moving towards the northeast (NE) direction and striking the Myanmar coast, and Cluster-2 has 20 TCs that are traveling towards North (N) and striking Bangladesh and the state of West Bengal in India. Cluster-3 and Cluster-4 have the 25 and 22 TCs that are moving westward (W) and west–northwestward direction, respectively. The total number of TC tracks obtained in each cluster is shown in Figure 2. There have been intensity-wise differences in the number of cyclones grouped into each cluster, with Cluster-1 and Cluster-2 having the maximum number of TCs with more intensity, whereas Cluster-3 and Cluster-4 are with weak TCs, as shown in Table S1.

2.4. Composite Analysis

The variables from the ERA5 data are collocated with location and time of TCs at maximum intensity for different clusters. Then, the variables are extracted from the centre of TCs to 22.75° (~2500 km) radius before, during, and after 3 h of peak intensity. The rationale for considering a three-hour window is to better ensure the same size, e.g., Cluster-1 sample size is from 26 to 78. Finally, the mean composite maps are generated by averaging the extracted variables for each identified cluster.

2.5. OLR Dipole Characteristics

The characteristics of OLR dipole are calculated by following Smith et al. [11], and definitions are given below.
Dipole distance: The distance between the centre of TCs to the region of high OLR.
Dipole orientation: The angle measured between the vortex centre and the position of high OLR in the anti-clockwise direction from the due East.
Dipole Magnitude: The difference between the high OLR and low OLR near the vortex centre.

3. Results and Discussion

3.1. Composites of Divergence and Wind Fields

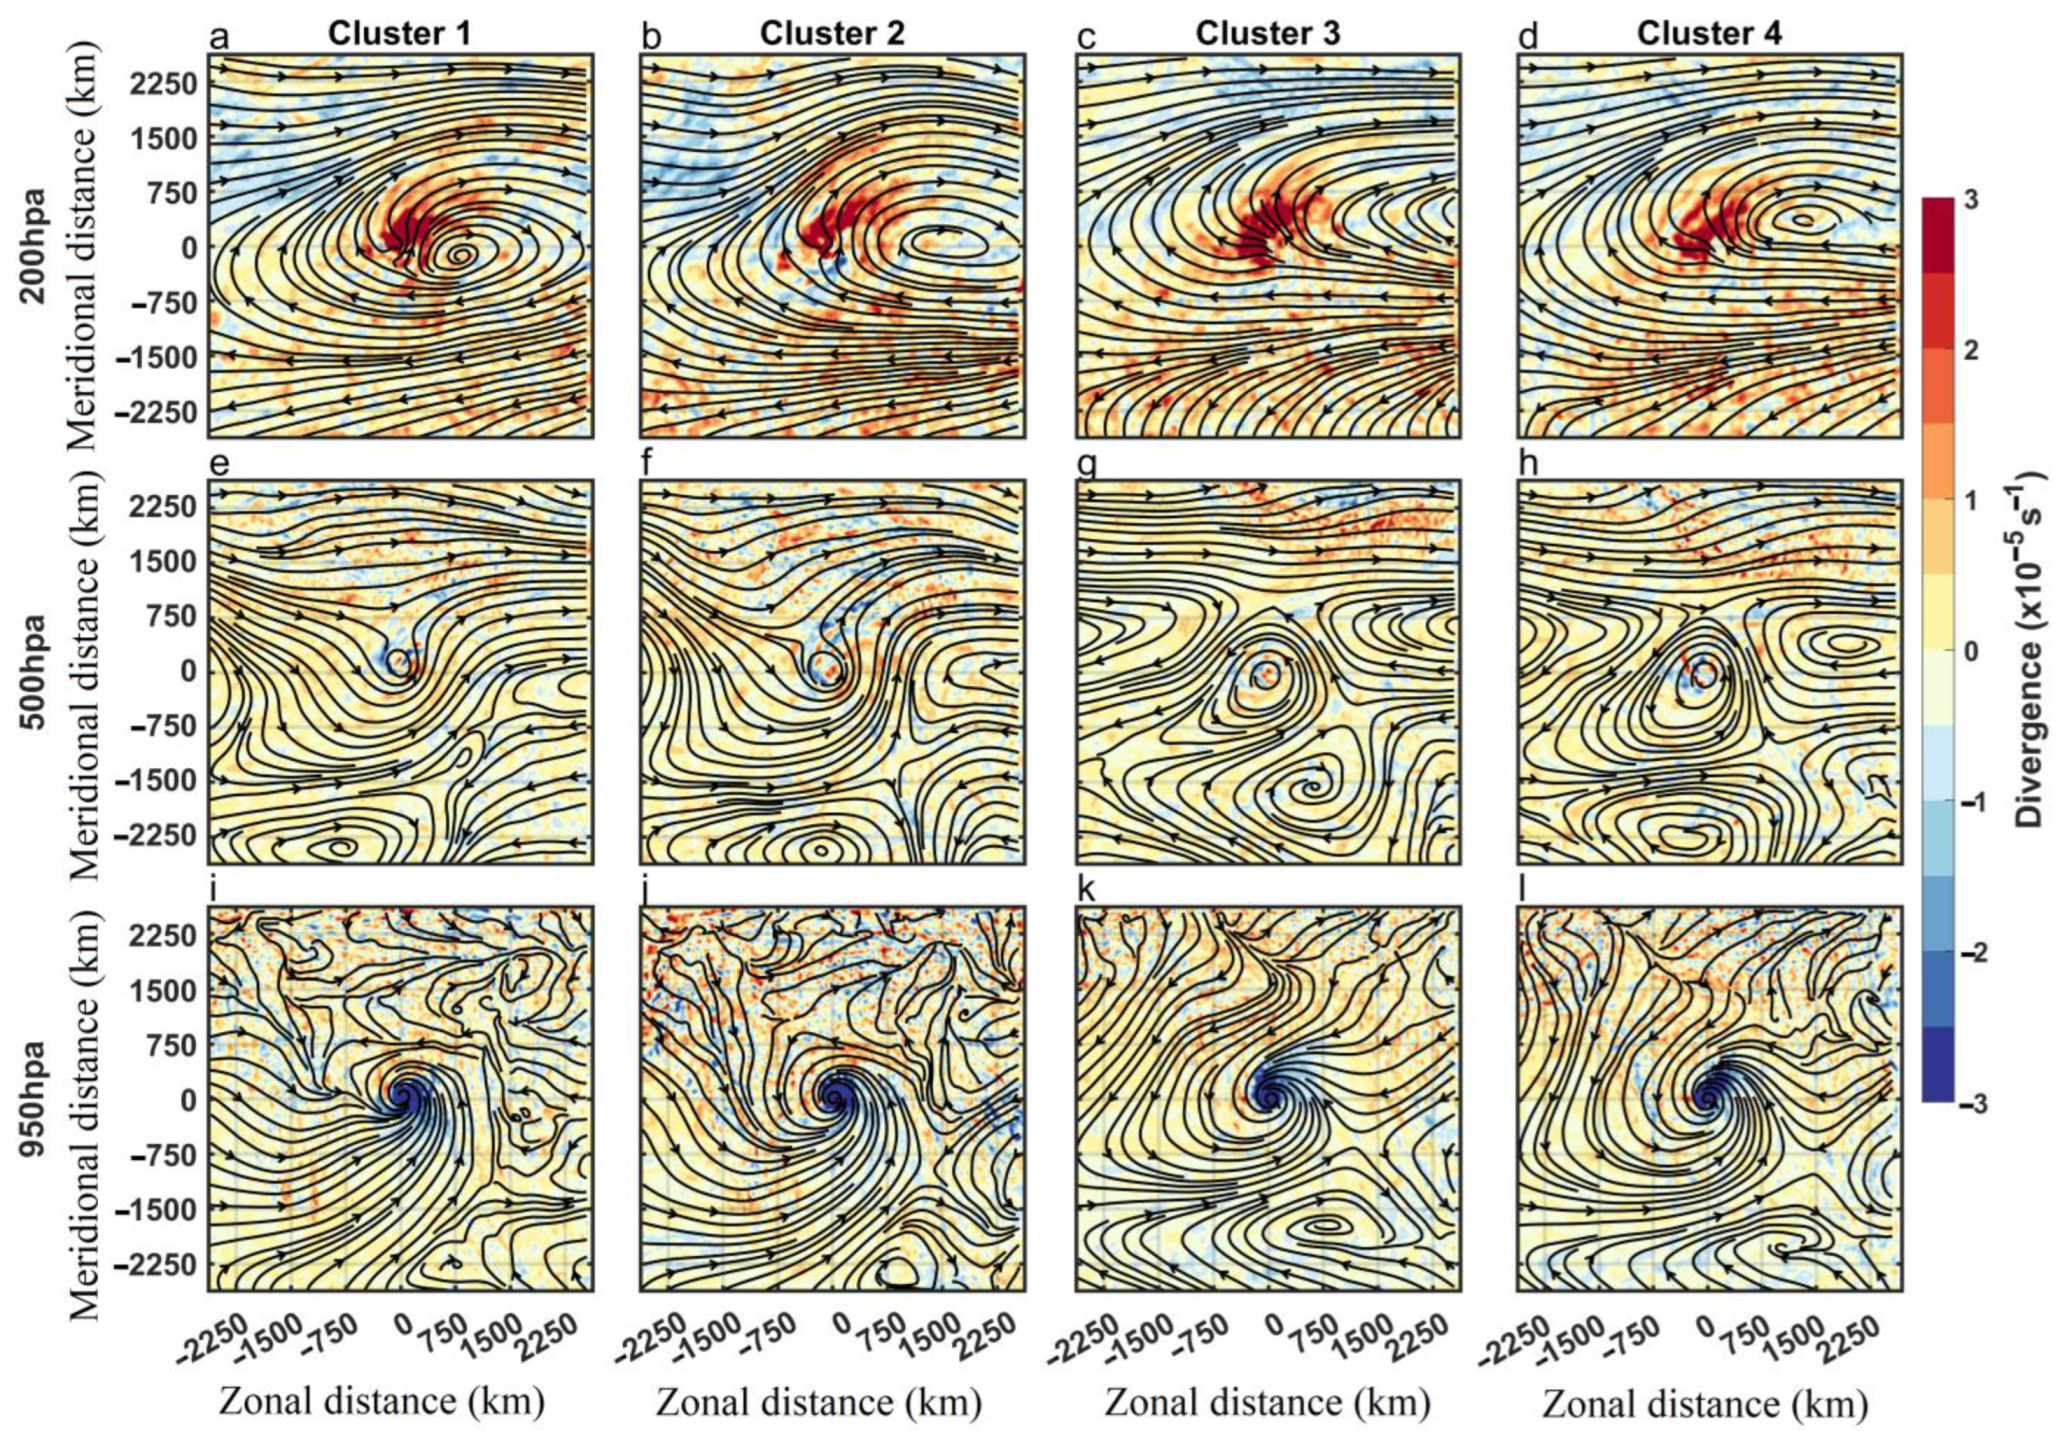
The mean composites of divergence and circulation patterns at 950 hPa, 500 hPa, and 200 hPa levels for different clusters are shown in Figure 3. Results show that near the centre of TCs in all clusters, strong negative divergence values (~−3 × 10⁻⁵ s−1) associated with cyclonic circulation are evident at 950 hPa (Figure 3i–l). The cyclonic circulation evident in the low level (950 hPa) is established by the confluence of westerlies and south-westerlies in Cluster-1 and Cluster-2, whereas by northerlies and westerlies in Cluster-3 and Cluster-4. This confluence of low-level winds is helpful for the intensification of TCs [30]. In the upper atmosphere (200 hPa), substantial divergence (~3 × 10⁻⁵ s−1) is evident near the centre of TCs in all the clusters, and an eastward shift of anti-cyclonic circulation from the centre is noticed in the upper level for clusters with a higher number of weak TCs, i.e., Cluster-3 and Cluster-4, than clusters with higher-intensity TCs, i.e., Cluster-1 and Cluster-2. The above eastward shift of an upper-level anti-cyclonic circulation for clusters with weak TCs is attributed to the wind shear distribution [40]. In addition, the circulation pattern in the upper level reveals the presence of strong westerly flow on the poleward side of the TC centre, and strong easterly flow is noticed on the equatorward of the TCs. However, in the mid-troposphere (500 hPa), no clear evidence of convergence or divergence is observed, whereas the streamline flow in Cluster-1 and Cluster-2 shows the northerly flow in the west, and southerly flow to the east from meandering westerlies, resulting in a trough to the equatorward side of the vortex centre, and strong westerlies flow in the poleward side. In Cluster-3 and Cluster-4, the mid-tropospheric cyclonic circulation is embedded with an anti-cyclonic flow to the west and east sides and westerlies on the poleward side. These meandering westerly flows and the presence of anti-cyclonic ridges play a crucial role in modulating the TC tracks in the north and north-eastward, and westward and west-northwestward directions, respectively, over BoB [28]. A clockwise circulation is depicted in all clusters to the far equatorward side of the cyclone in the lower and mid-troposphere, and this signifies that the dual cyclones on either side of the hemisphere can result in modulating the track and intensity of the TCs in the North Indian Ocean [23,29,58].

3.2. Composites of Relative Humidity

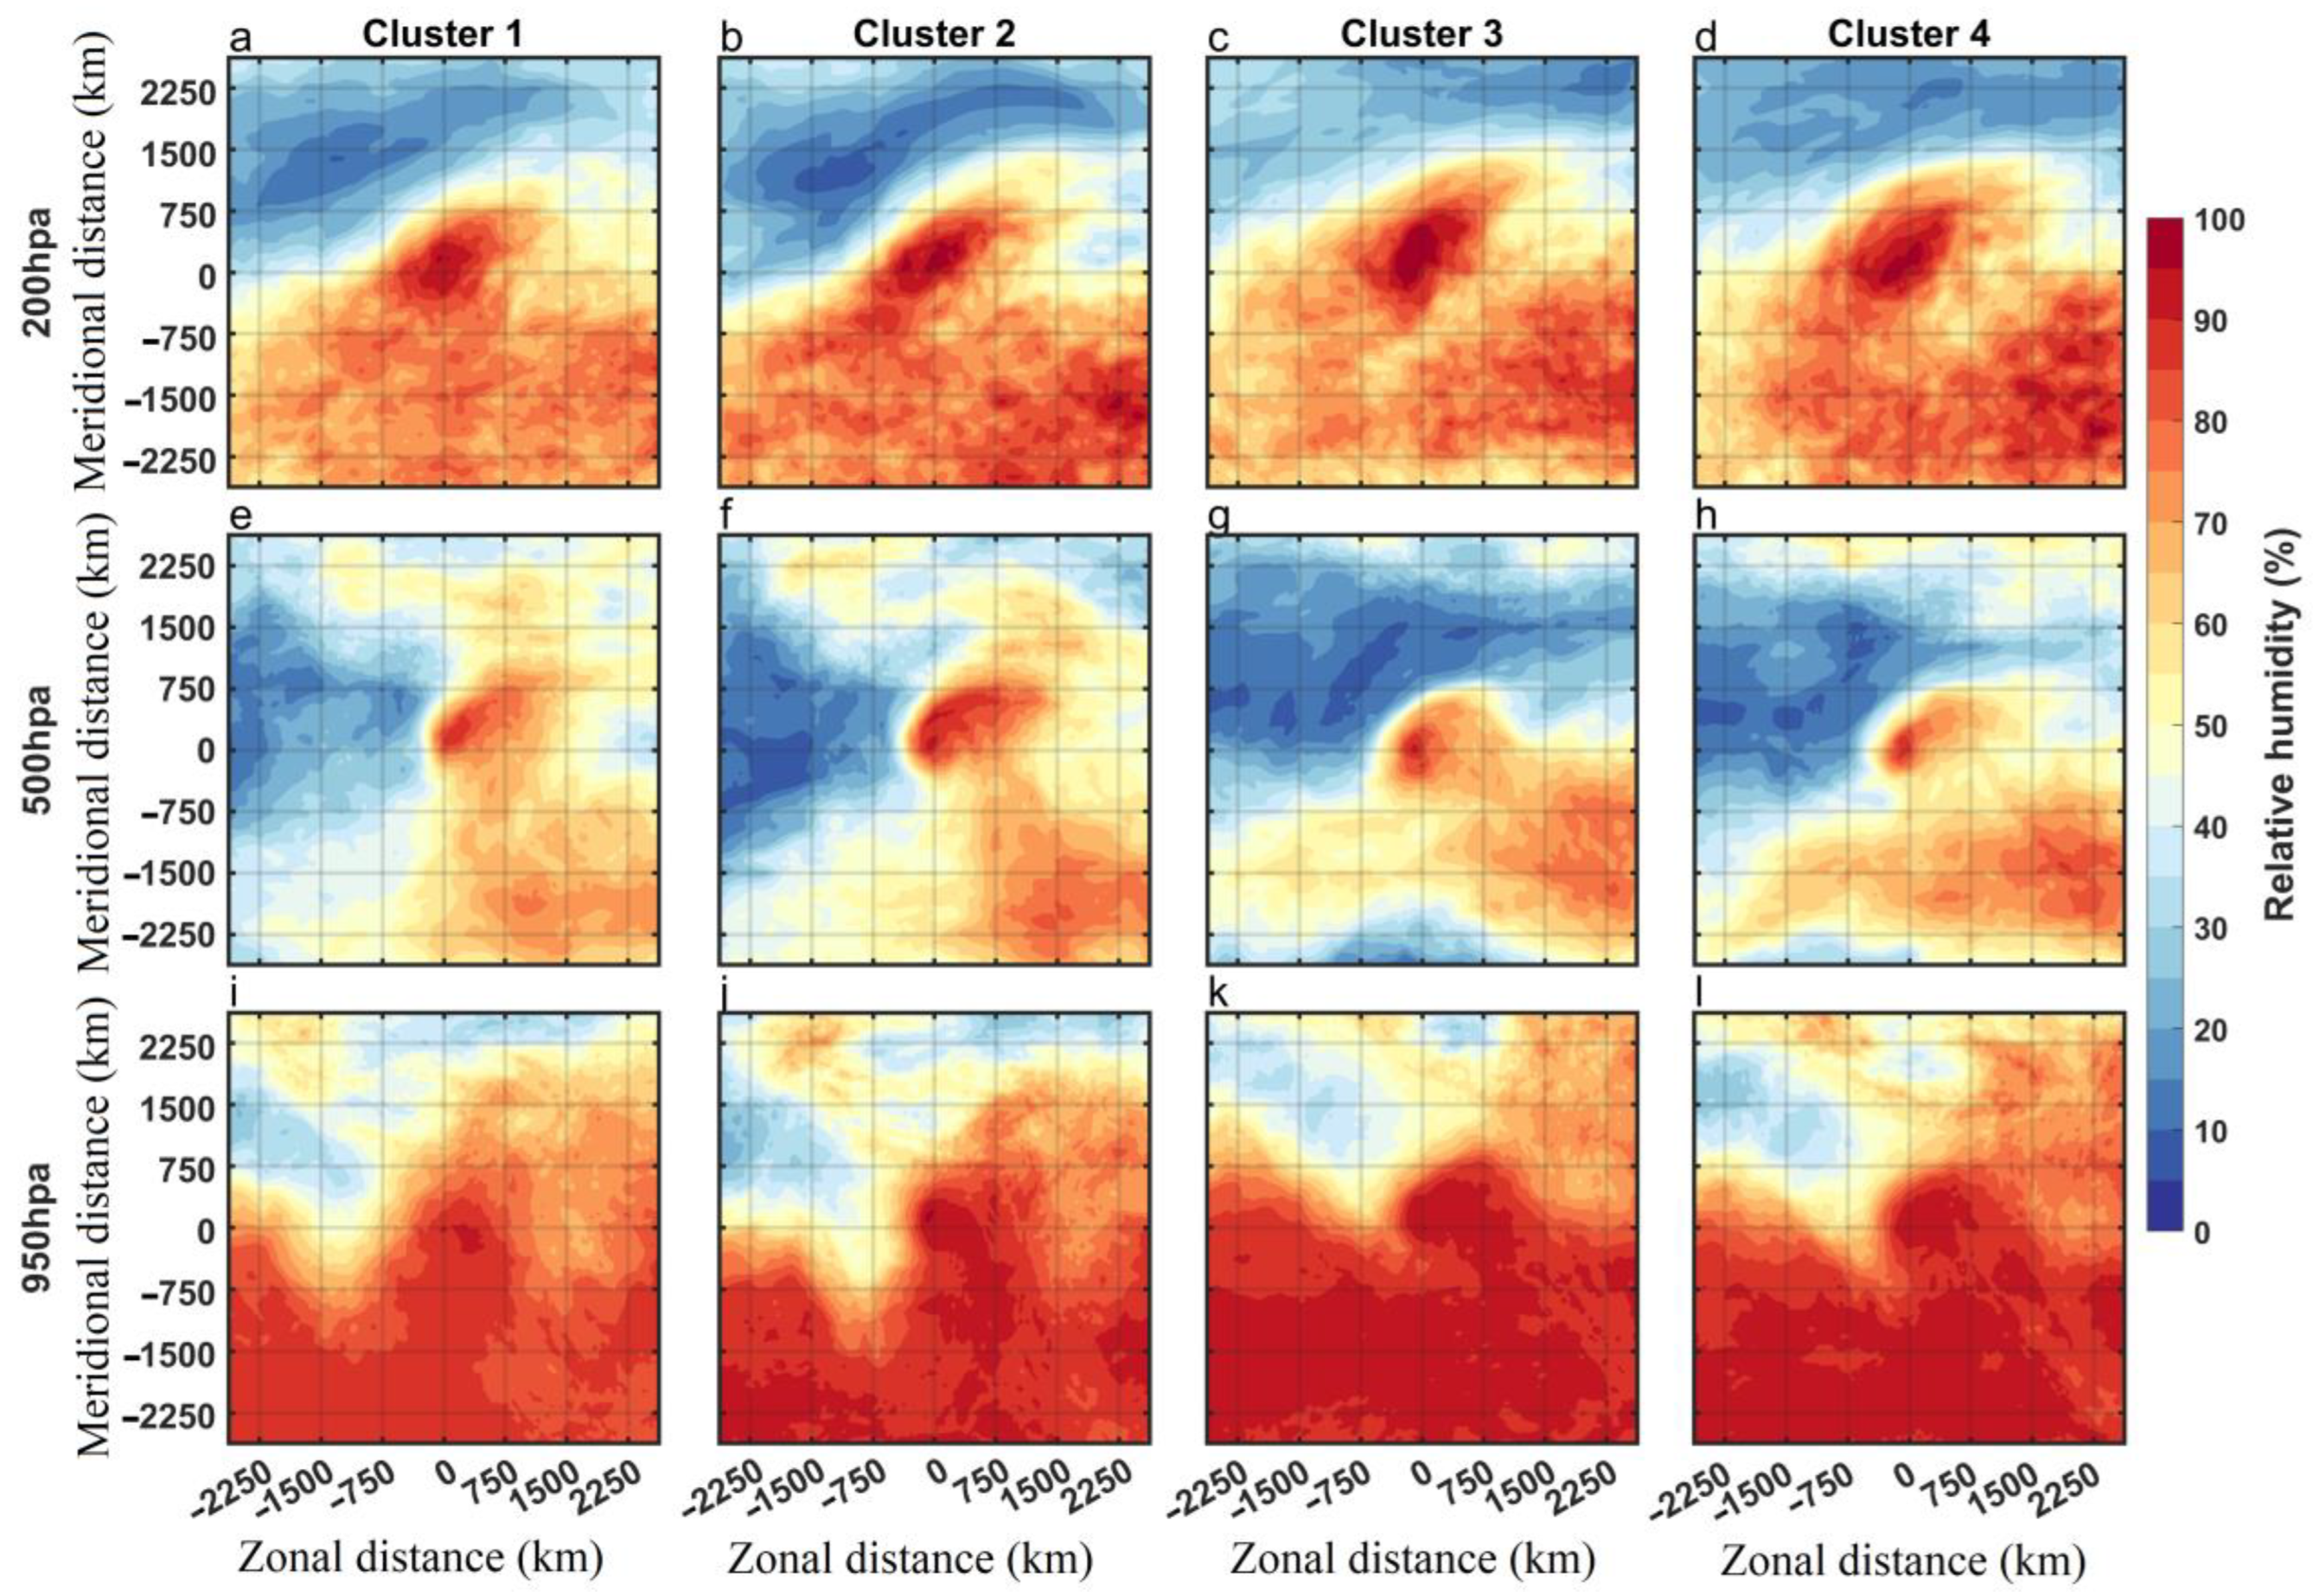
Similar to the divergence and circulation pattern, the mean composites of RH at 950 hPa, 500 hPa, and 200 hPa levels for different clusters are also generated and shown in Figure 4. In the vicinity of the vortex centre, a higher amount of RH (~70–90%) was observed in all clusters at all selected levels. In the lower level of the atmosphere (950 hPa), higher RH (~90%) is observed equatorward to the vortex centre, and relatively lesser RH (~60%) is distributed on the poleward side in all of the clusters. In the upper atmosphere (200 hPa), variation in RH is similar to the lower atmosphere (950 hPa) with relatively lesser magnitudes with RH ~70% in the equatorward and ~20% in the poleward from the vortex centre. The low moist air (dry air) observed in the upper level is present in the West-northwest (WNW) direction from the vortex centre, clearly evident in Cluster-1 and Cluster-2, whereas in the mid-troposphere (500 hPa), the composites of RH reveal the presence of a dipole pattern with higher moist air near the vortex centre and lower moist air (dry air) observed in the WNW direction. The presence of dry air in the northwest quadrant of the TC centre can decrease upward buoyancy and subsequently influence the intensity of the TCs. In addition, the location of RH (moist/dry) at the mid-tropospheric level can also modulate TC intensity by promoting or inhibiting rain bands and convection into the outer core region [4,59,60].

3.3. Radial-Height Distribution of Divergence, Streamline Fields, and Wind Shear

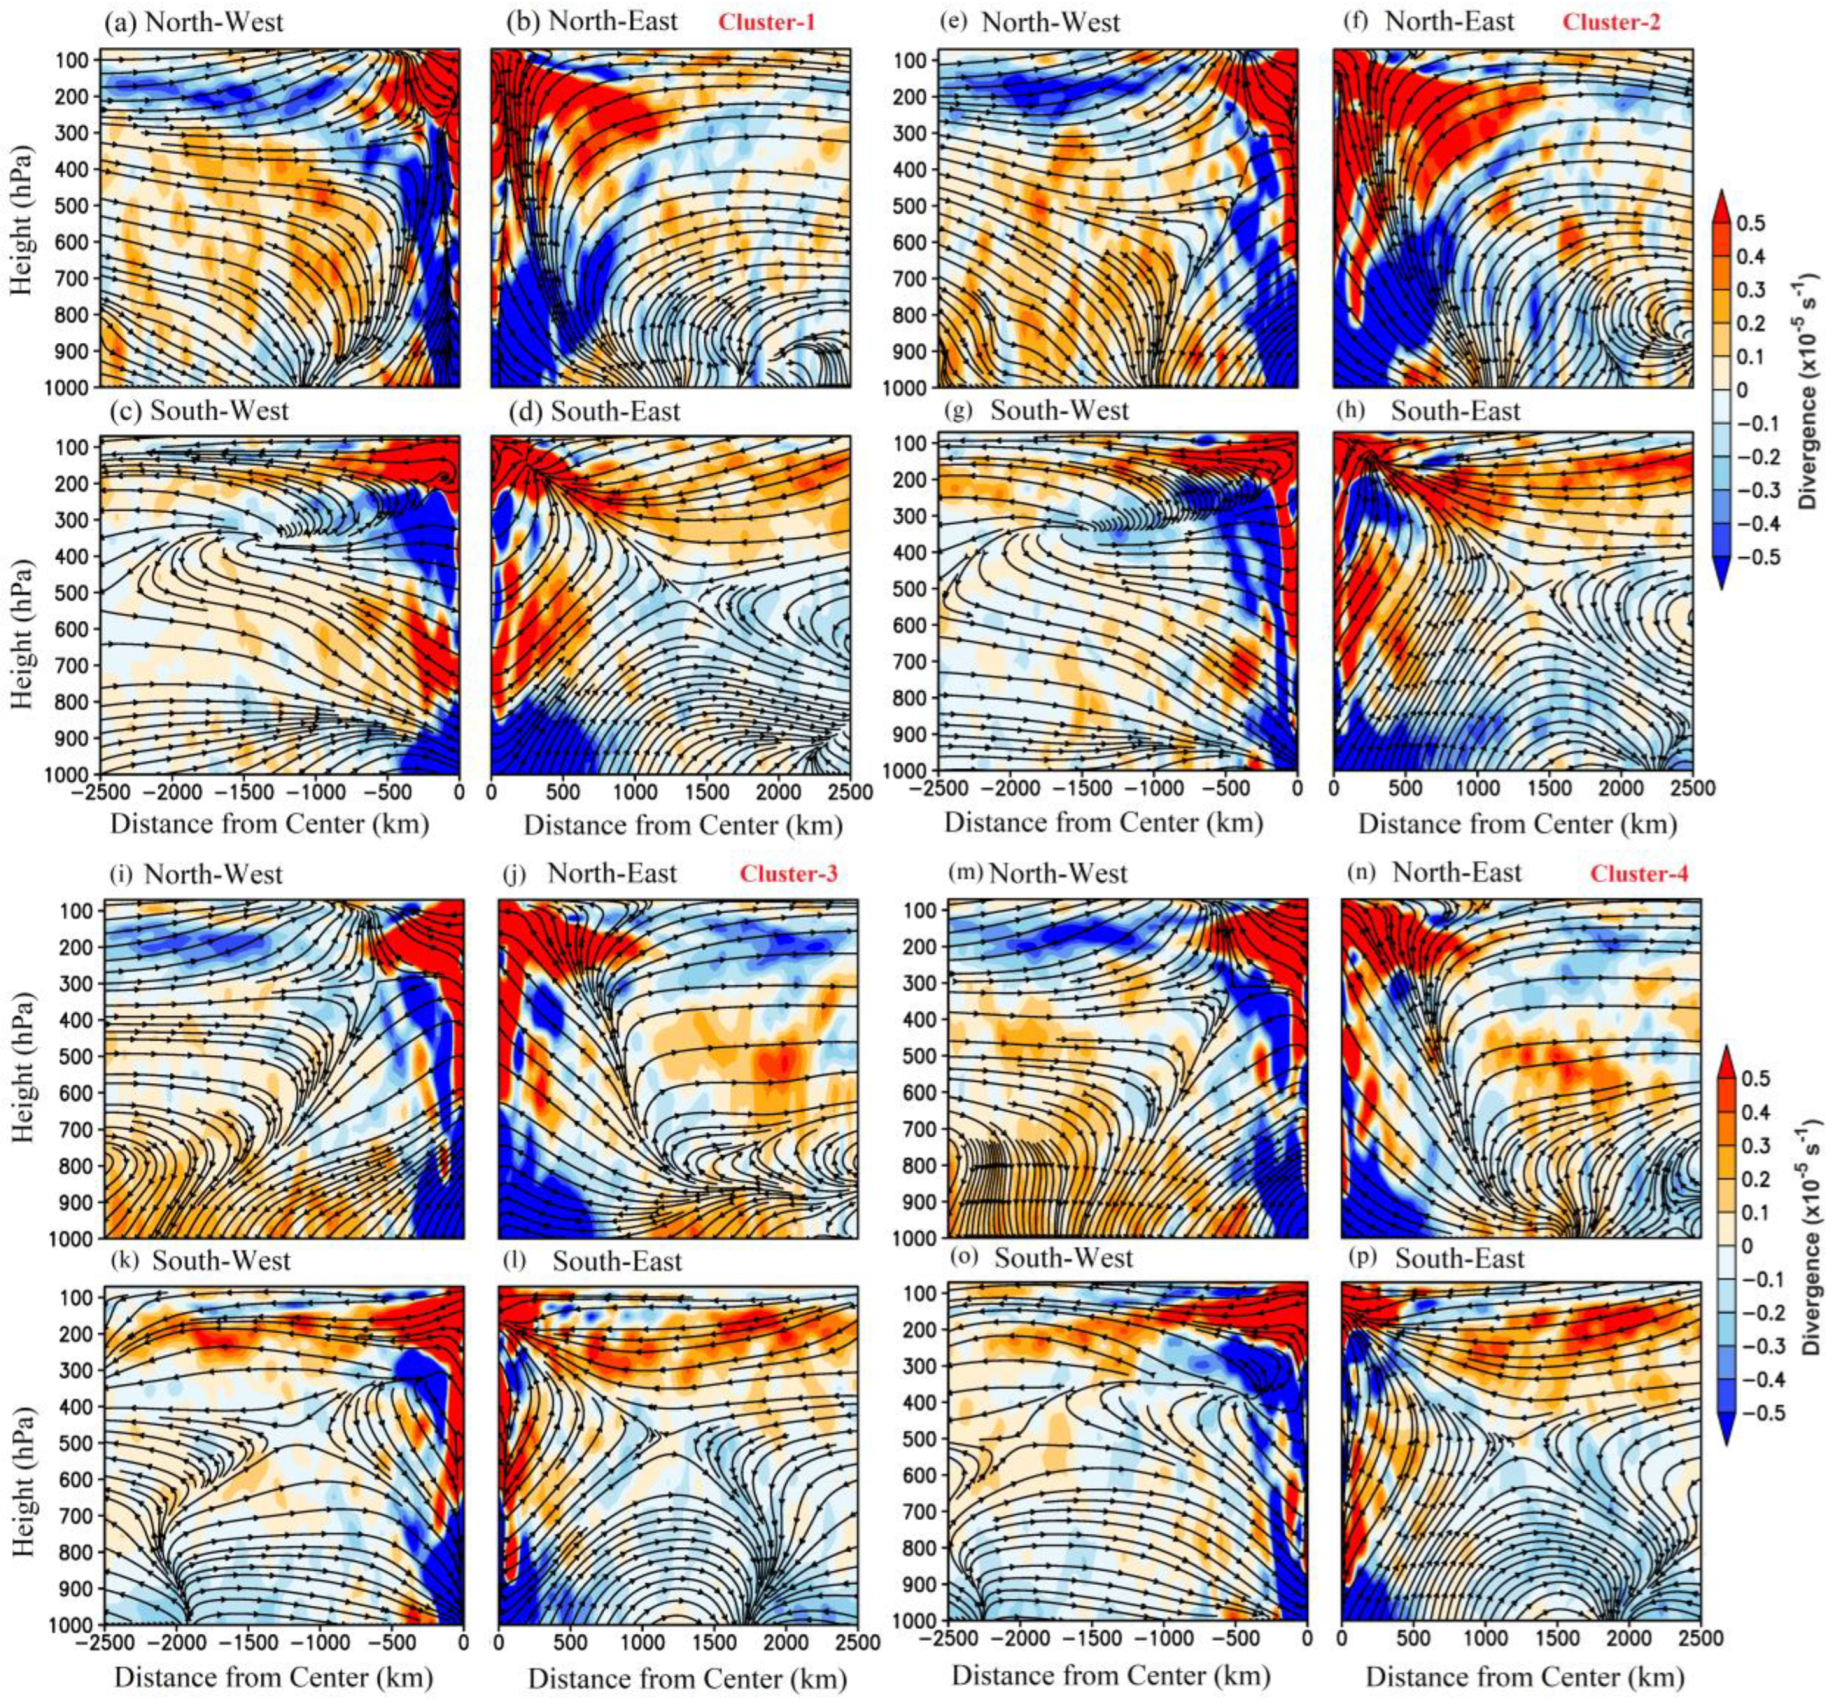
The mean composites of the radial-height cross-section of divergence and circulation are generated for all clusters by averaging divergence/wind vectors in zonal and meridional directions at all the pressure levels. The composites are further divided into North–West (NW), North–East (NE), South–West (SW), and South–East (SE) quadrants for each cluster from the centre of TCs, as shown in Figure 5. The features identified from azimuthally averaged wind fields and divergence include strong low-level convergence and upper-level divergence. Large-scale environmental features indicate westerly and easterly flows in the poleward side (NW and NE) and equatorward side (SW and SE) quadrants in the upper atmosphere, respectively, which are consistent with the results from the selected pressure level analysis (Section 3.1). However, it is found that distinct circulation patterns are represented among quadrants in each cluster. In the NE quadrant, strong updrafts are evident near the vortex centre for all the clusters. The NW quadrant is occupied by strong divergence signals in low-mid tropospheric levels and convergence in the upper level beyond 750 km from the vortex centre for all clusters. The distant westerlies observed in the NW quadrant are opposed by the radial outflows from the vortex centre, resulting in the formation uplifting above 300 hPa.
Similarly, the subsidence flows formed from 300 hPa to lower levels are associated with the observed background divergence. In the North-West Pacific, Smith et al. [11] showed the presence of subsidence in the NW quadrant of TCs. However, in the present study, subsiding and uplifting motions are observed in the NW quadrant of TCs. The westerly flows observed in the NW quadrant of Cluster-1 and Cluster-2 are relatively more robust compared to Cluster-3 and Cluster-4. In the SW quadrant, upper-level outflows and low-level inflows are evident in all the clusters. Ventham and Wang [30] showed that these upper-level outflows and lower-level inflows have played a prominent role in the intensification of TCs. However, the SE quadrant shows the presence of an alternative trough and ridge flow patterns and forms a saddle or neutral point centred near ~1250 km from the vortex centre in the vertical atmosphere.
Furthermore, the deep-layer wind shear (WS) was computed by taking the wind speed difference between each level from a reference (850 hPa) level, similar to Chen et al. [61]. The radial-height cross-section of deep-layer shear overlaid by RH computed cluster-wise and azimuthal averages shown in Figure 6, similar to Figure 5, showed distinct spatial differences in the distribution of significant upper-level shear among each cluster having different TC movements. However, a comprehensive understanding of WS impact on other storm relative flows needs to be analysed further during various stages of TCs. A weak WS is observed around the vortex centre throughout the troposphere. Beyond 1000 km, WS gradually increases from the surface to the upper troposphere with maximum values of 30–33 ms−1 prevailing at nearly the 200 hPa level, especially in northward quadrants (NW and NE) in all clusters, whereas in the case of northwest Pacific region TCs, strong WS (~30 ms−1) is present in both the poleward and equatorward sides, though there is weak WS around the vortex centre [62,63]. The distribution pattern (spatial) of WS and RH is observed to be the same for all clusters, i.e., quadrant-wise. In the NW quadrant, low RH (25–40%) air and a significant amount of WS (24–27 ms−1) are observed, and this possibly plays a crucial role in modulating the intensity of TCs through the ventilation effect established in the low to mid-tropospheric level from the advection of dry air and large-scale WS [39,40,64,65,66].
Further, the NW quadrant has shown distinct differences in the distribution of WS and RH among each cluster. Cluster-1 and Cluster-2 are observed with relatively lesser WS and higher moister environment than Cluster-3 and Cluster-4. It implies that the clusters with higher-intensified TCs (i.e., Cluster-1 and Cluster-2 from Figure 2) have a different large-scale environment compared with the clusters with less-intensified TCs (Cluster-3 and Cluster-4 from Figure 2), and these differences are also identified in the Northwest Pacific cases [40], whereas, in the NE quadrant, the presence of stronger WS and a significant RH (60–70%) may not have much implication on TC intensity. The southward quadrants (SW and SE) are covered with relatively weak WS and higher RH amounts, especially the SE quadrant, with advection of abundant moist air towards the vortex centre associated with an environment conducive for convection [61]. Additionally, we identified large-scale environmental differences in the radial-height distribution of RH and WS during pre-monsoon and post-monsoon seasons, as shown in Figure S1.
The presence of upper-level convergence (Figure 5) and low-mid troposphere dry air, along with large-scale WS (Figure 6) in the NW quadrant from the vortex centre, signifies the existence of suppressed convection. Therefore, the variation in OLR during TCs is investigated and discussed in the next section.

3.4. Composites of Outgoing Longwave Radiation

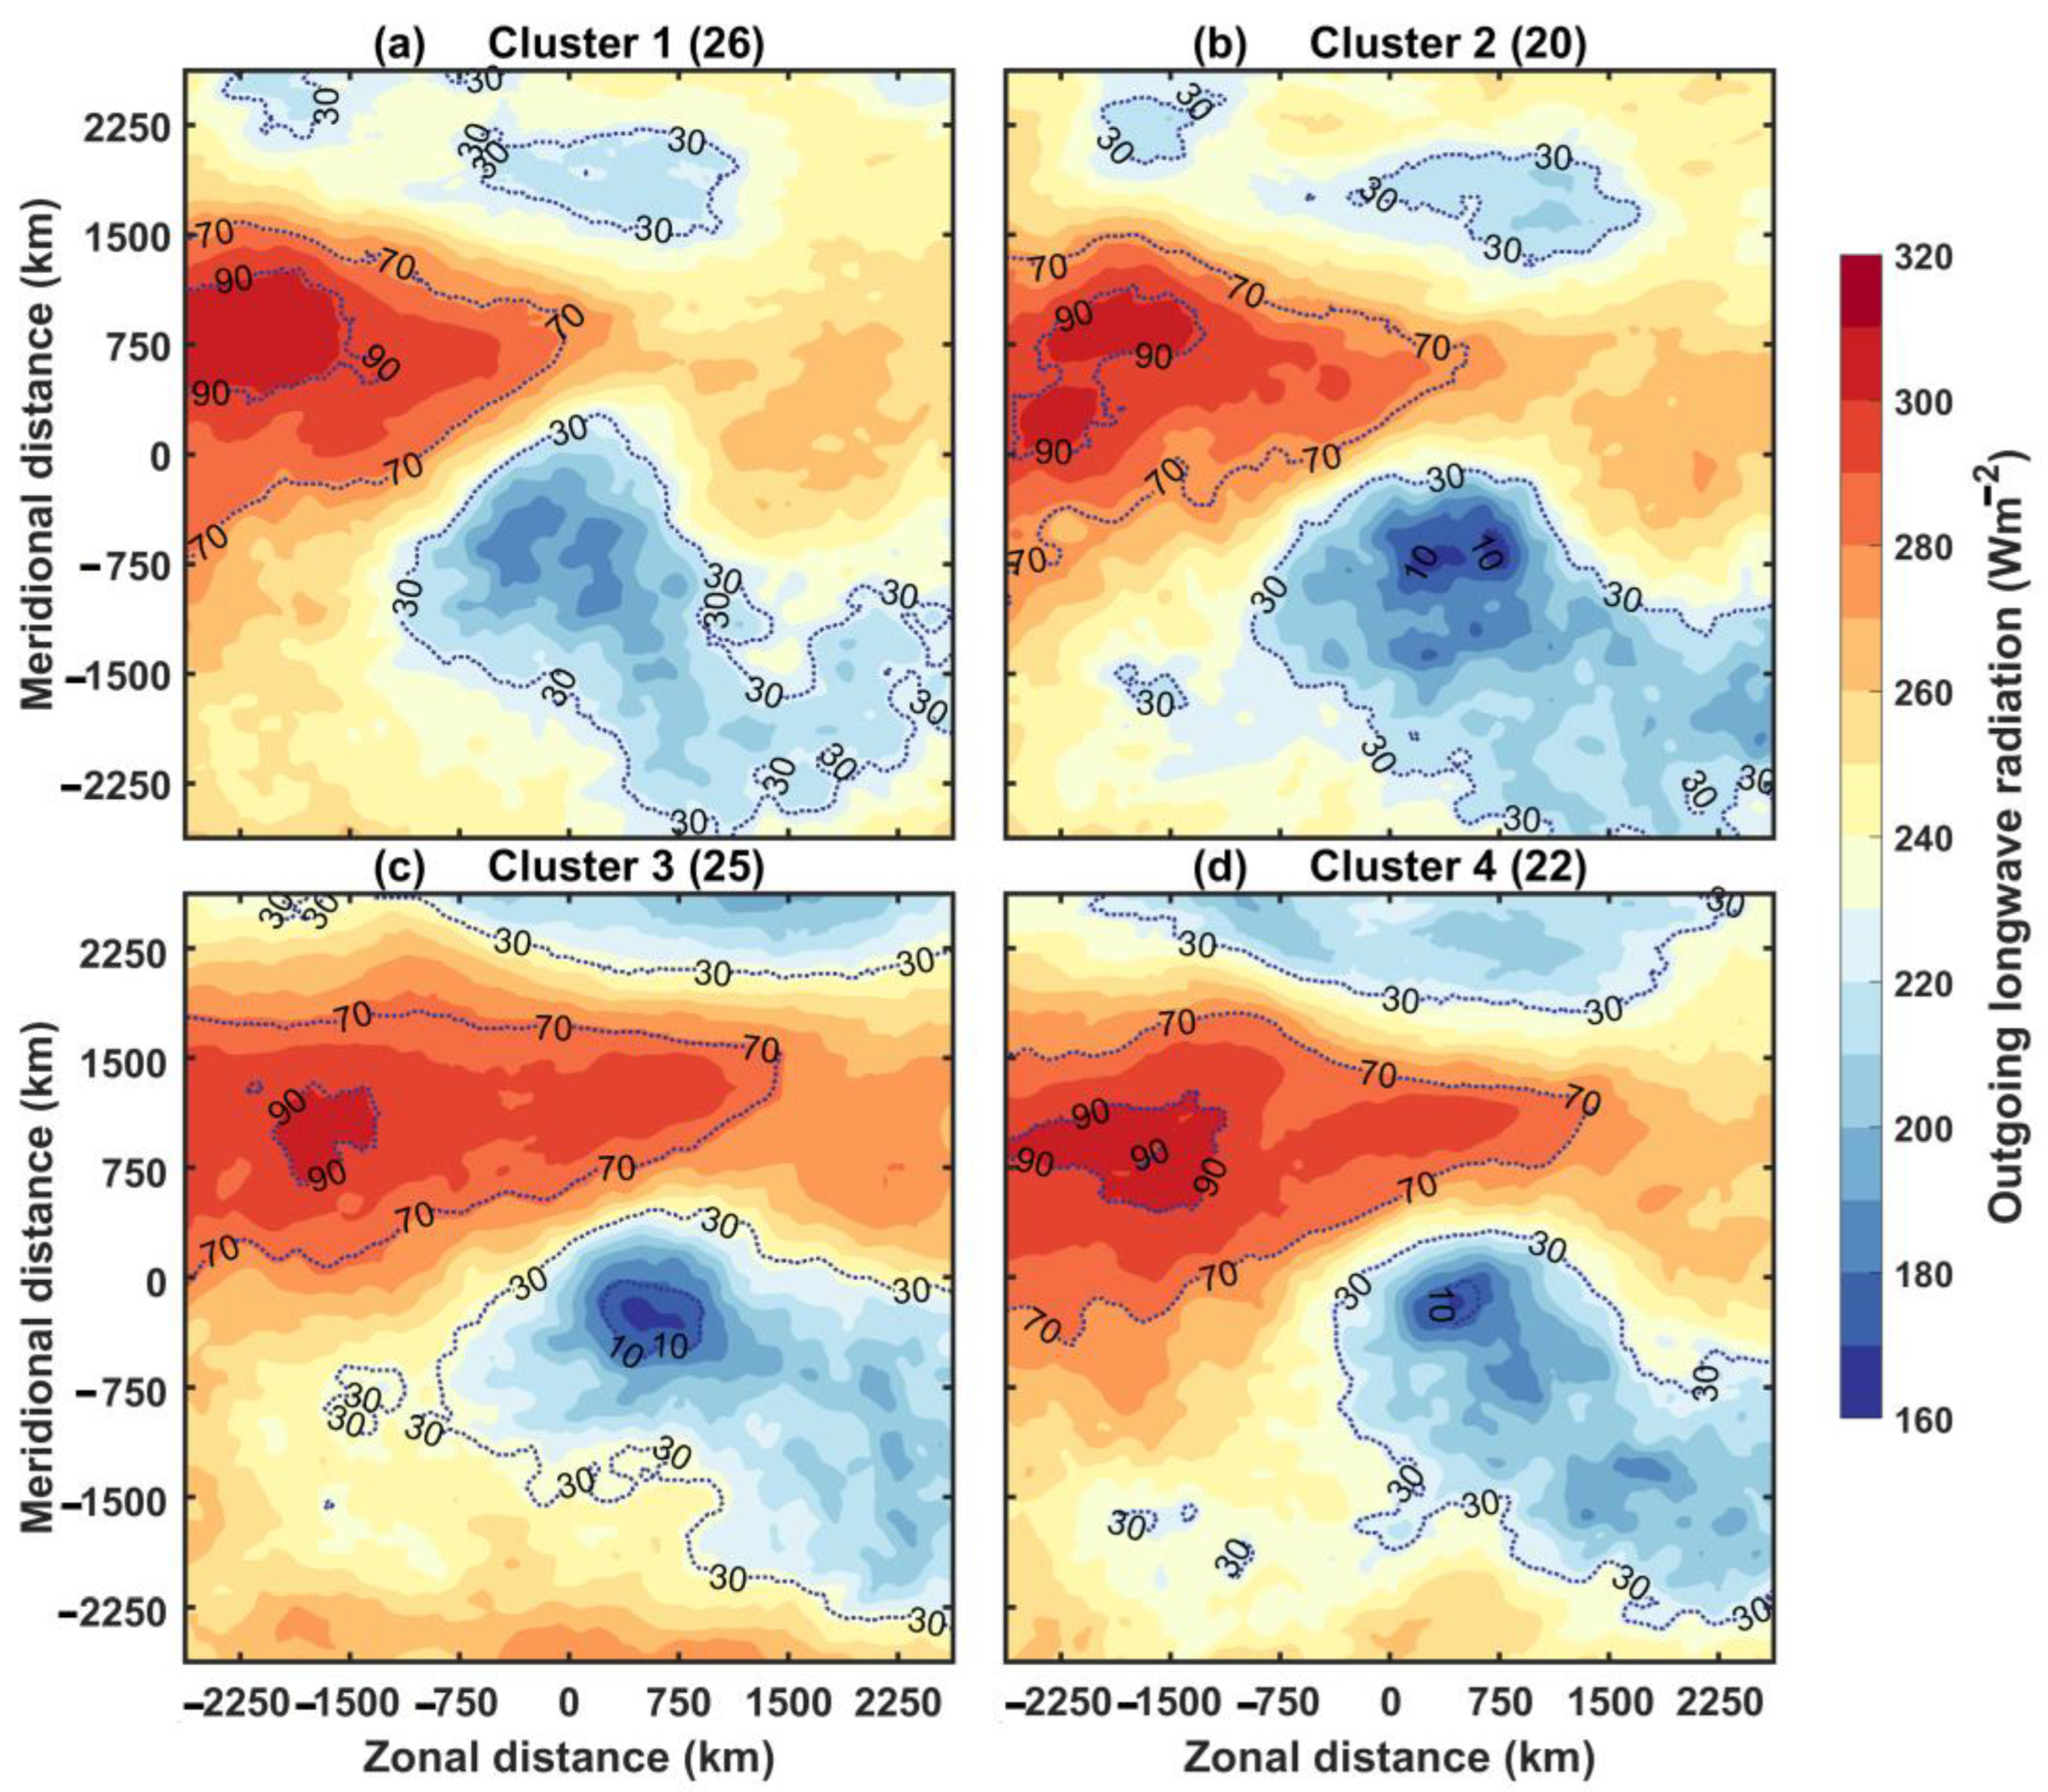
OLR is a potential predictor for cyclones as this variable can provide essential background environmental information on convection and cloud clusters during the passage of TCs [67,68]. Therefore, the composites of OLR during the maximum intensities of TCs are also analysed for different clusters. The mean composites of OLR for different clusters are shown in Figure 7, which depicts the mean values with shading and percentile distributions computed among each cluster with dotted contours. These percentile distributions slightly vary among each cluster (Figure S2a), which is apparent from the probability density distribution of OLR (Figure S2). The values ranging between 200 and 300 Wm−2 show higher density for all clusters. It is also observed that around the vortex centre (5° × 5° box) has a higher density of OLR of about 220 Wm−2, whereas the high OLR regions (5° × 5° box), with OLR values of about 275 Wm−2, are showing higher density (Figure S2b,c), with Cluster-3 and Cluster-4 identified with peaks compared to Cluster-1 and Cluster-2. Similarly, the distribution is also verified for different categories of the TCs (Figure S2d–f). The OLR composites clearly depicted a significant dipole pattern in all clusters (Figure 7), with a band of low OLR (<160 Wm−2) area represented by contours of 10 or lesser percentile observed from the vortex centre to 750 km. The anomalous high OLR (>320 Wm−2) area with contours of 90 percentiles is spread beyond 750 km in the WNW direction from the vortex centre. Over the BoB, Subrahmanyam et al. [69] identified relatively high OLR values to the southeast from the centre of TC. However, their study is limited to the ocean basin with a single case study. The anomalous region of high OLR, identified in all the clusters, is associated with low moist or dry air (Figure 4). This high OLR region is also associated with the upper-level convergence and the low-level divergence region, evident in the WNW direction from the vortex centre (Figure 3). The location of the high OLR region is co-located with the presence of dry air in the mid-troposphere and large-scale subsidence and divergence region in the NW quadrants in Figure 5. Smith et al. [11] also found a similar dipole pattern of OLR over the NWP. In addition, we also analysed this OLR pattern intensity wise (Figure S3) and season wise, i.e., pre- and post-monsoon (Figure S4).
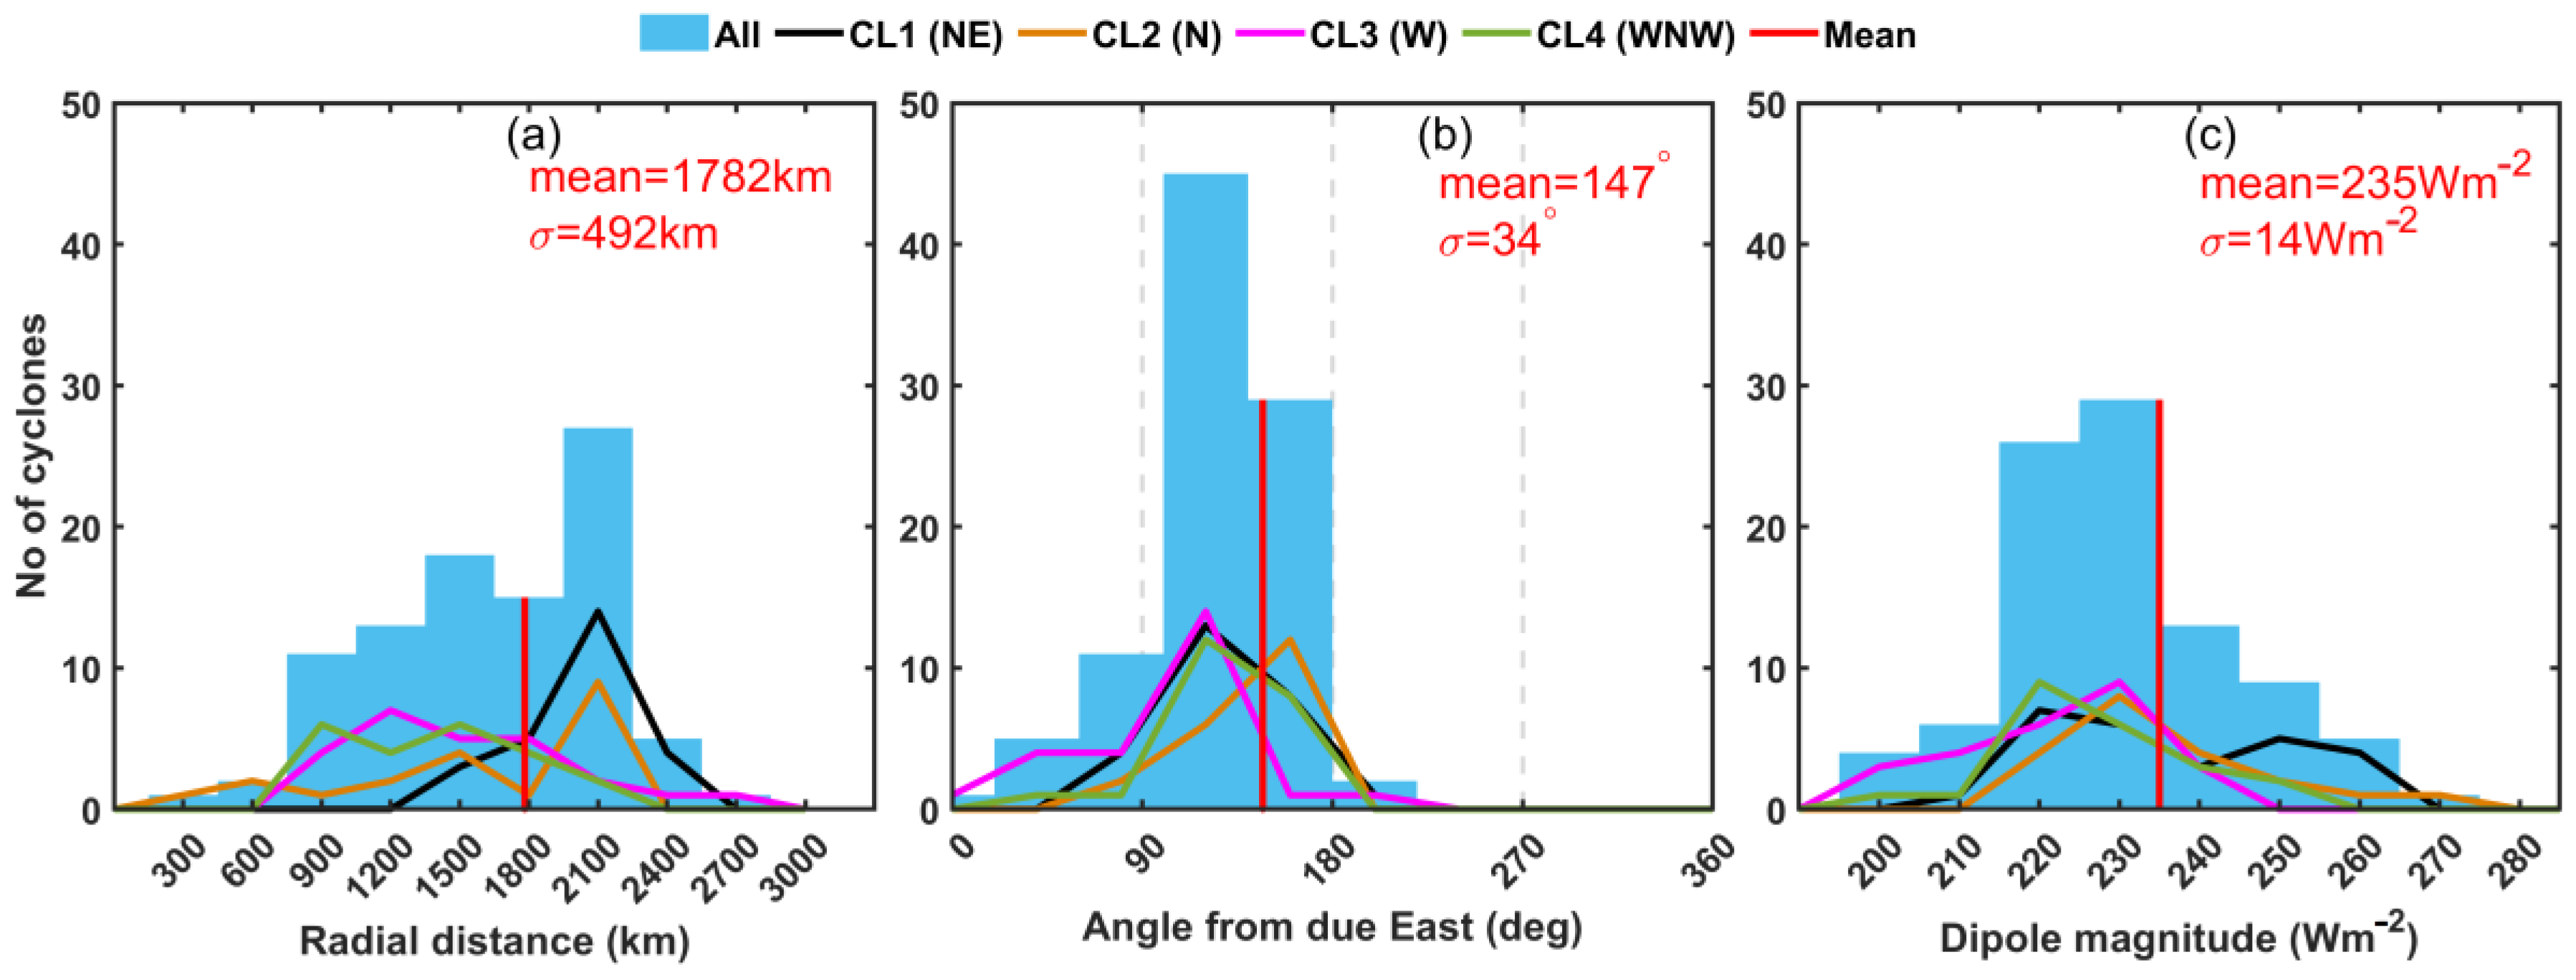
Furthermore, various dipole characteristics, such as dipole distance, dipole orientation, and dipole magnitude, are examined to understand the position of the anomalous high OLR region from the vortex centre. A bar plot representing the frequency and dipole characteristics is shown in Figure 8. The maximum number of TCs has a dipole distance of ~2100 km, with an average of 1782 km for all the TCs. Dipole orientation shows that the maximum number of TCs having the high OLR positioned ~110° due east from the vortex centre, with a mean angle of ~147°. The variation in dipole magnitude is ~220 Wm−2 to ~230 Wm−2 for the maximum number of TCs in the BoB, with a mean magnitude of ~235 Wm−2. However, the mean dipole characteristics are different for each cluster, indicating that the position and magnitude of high OLR vary depending on the direction of TCs. These dipole metrics of mean and standard deviation are also identified with some seasonal variation, as shown in Table S2. These differences are possibly attributed to the large-scale environmental differences observed in Figure S1.
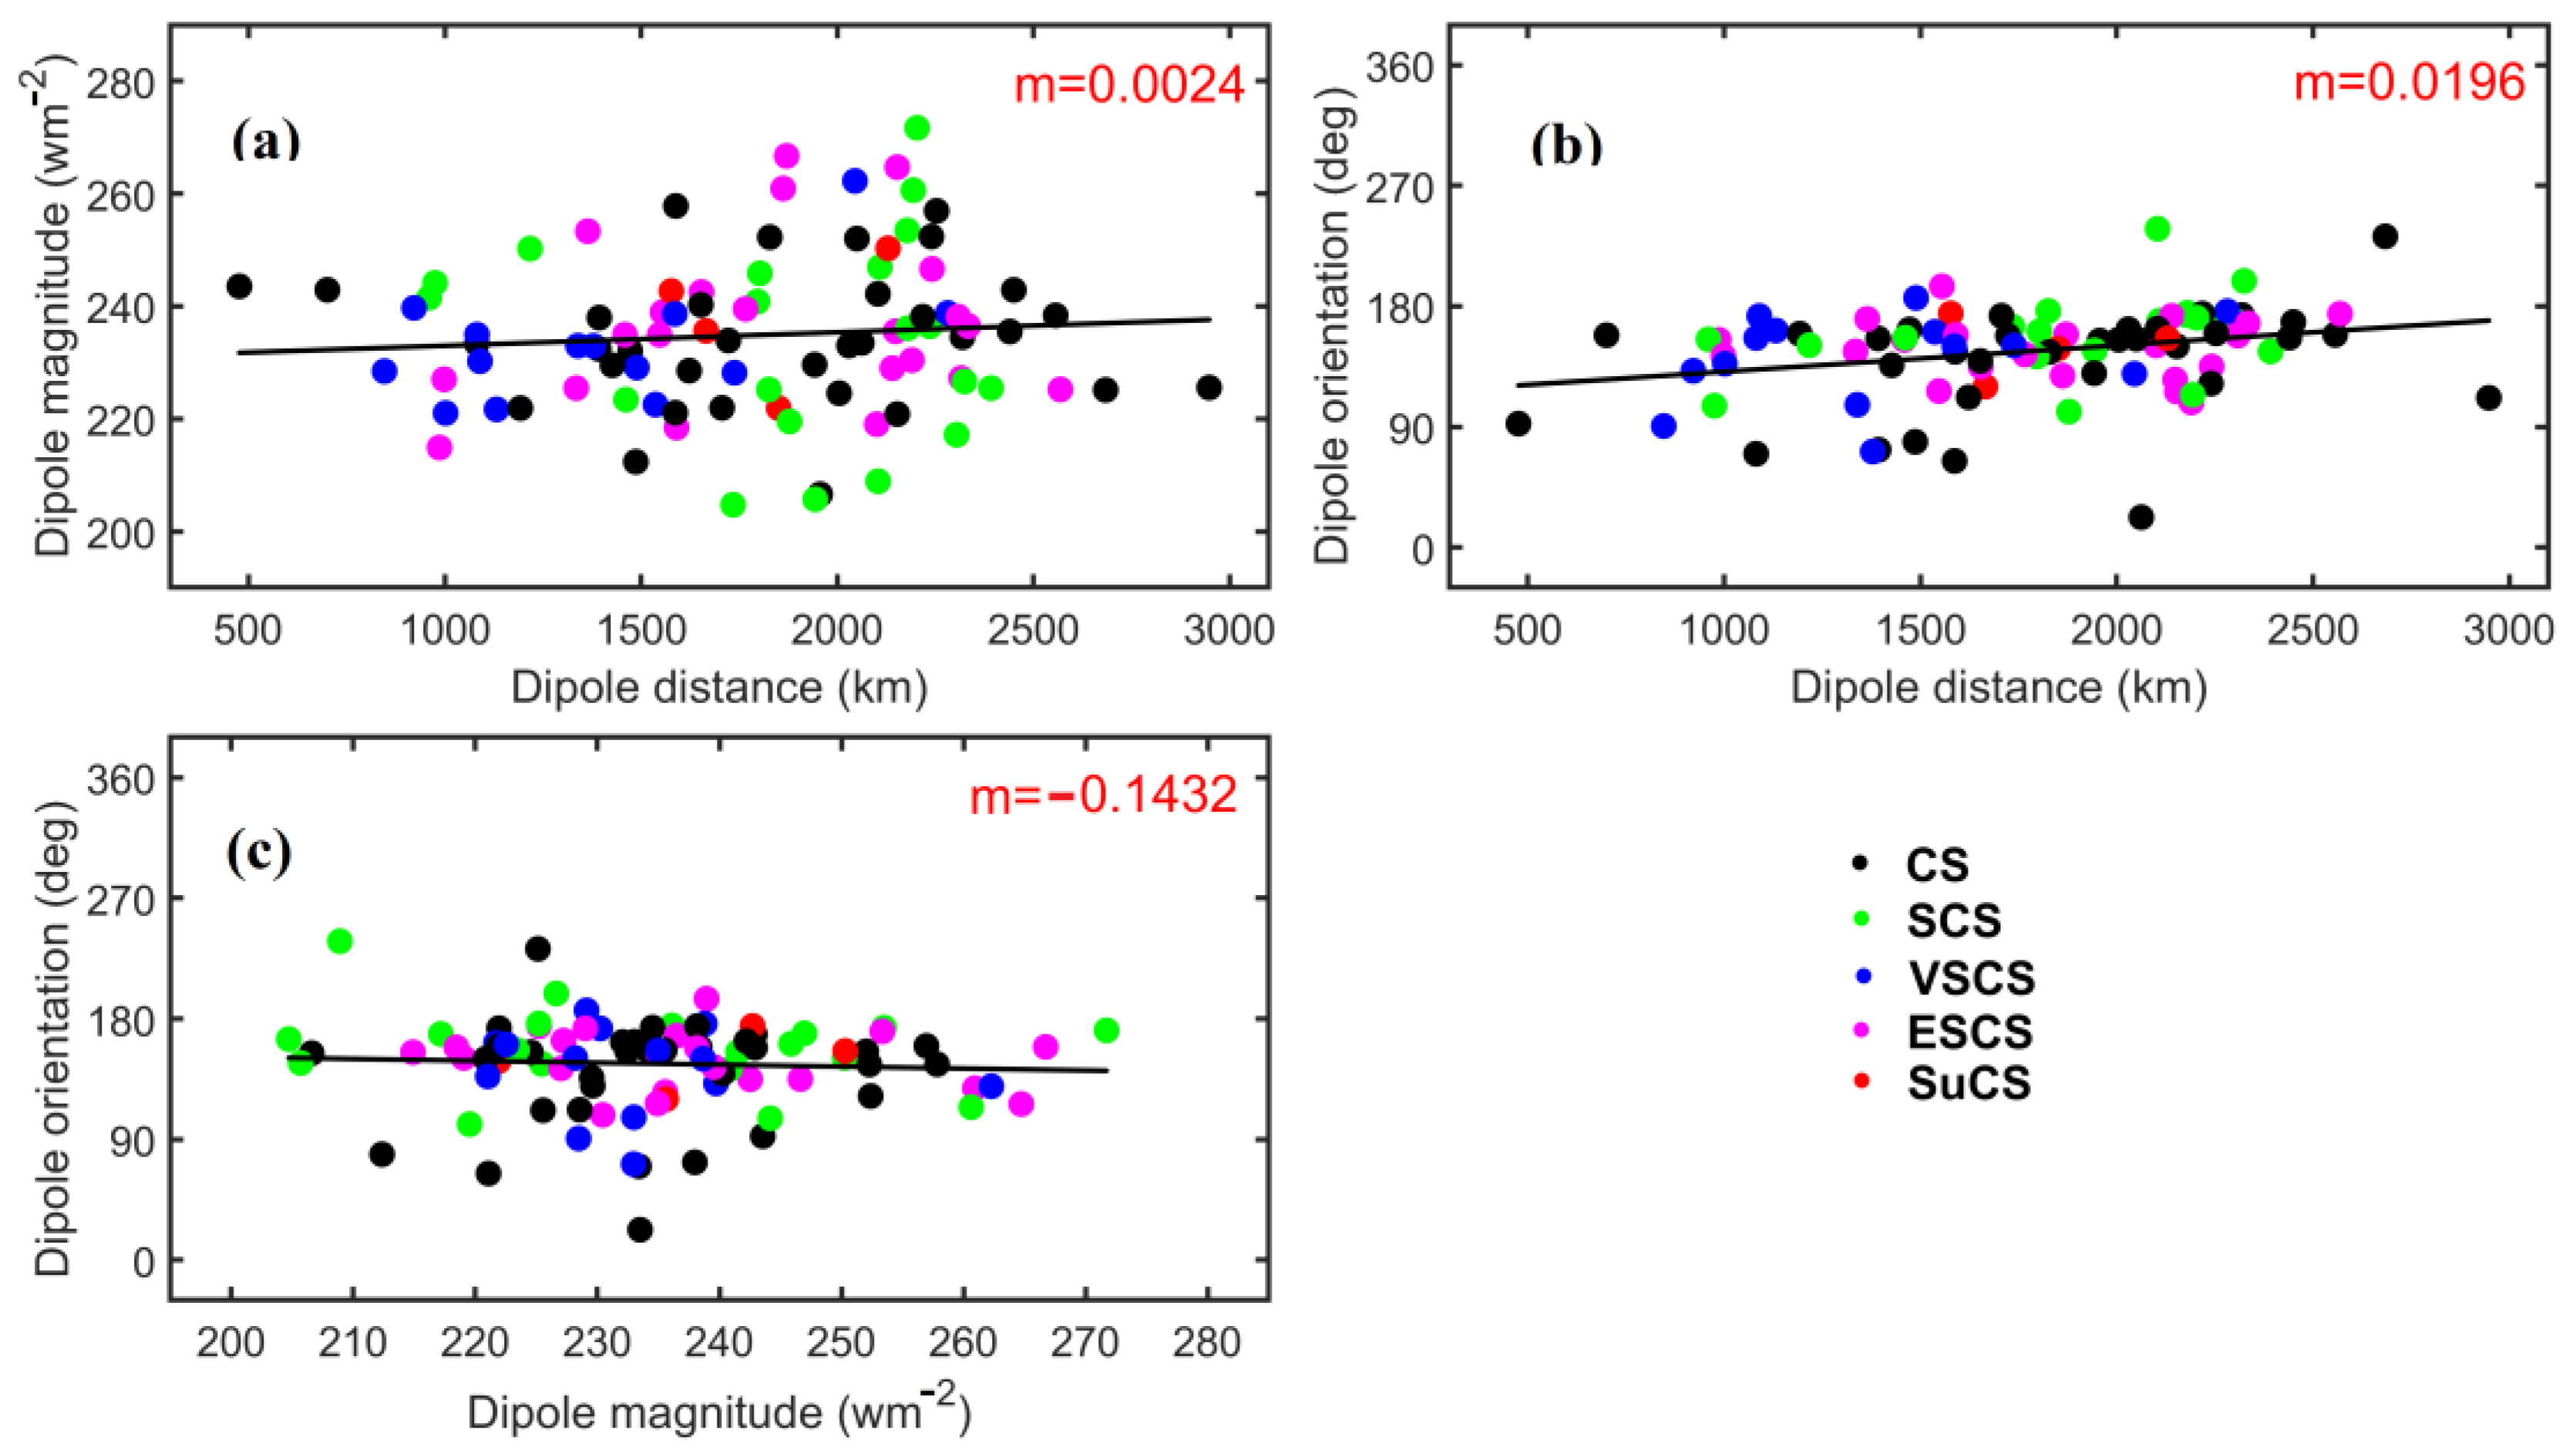
In addition to the above dipole characteristics, the linear variation in dipole properties for 93 TCs is shown in Figure 9. Results suggest that with the increase in dipole distance, increases in dipole magnitude (Figure 9a) and orientation (Figure 9b) are observed. The increase in dipole orientation with the increase in dipole distance suggests that the region of high OLR is shifting towards the west with the increase in dipole distance. The dipole orientation decreases significantly with the increase in the dipole magnitude (Figure 9c). It signifies that the dipole magnitude reduces with the increase in northward orientation of the position of the high OLR region. However, no proper relationship is observed among these properties with respect to the intensities of TCs. Similarly, these dipole characteristics show a similar relationship during both pre- and post-monsoon seasons (Figure S5).

4. Summary and Conclusions

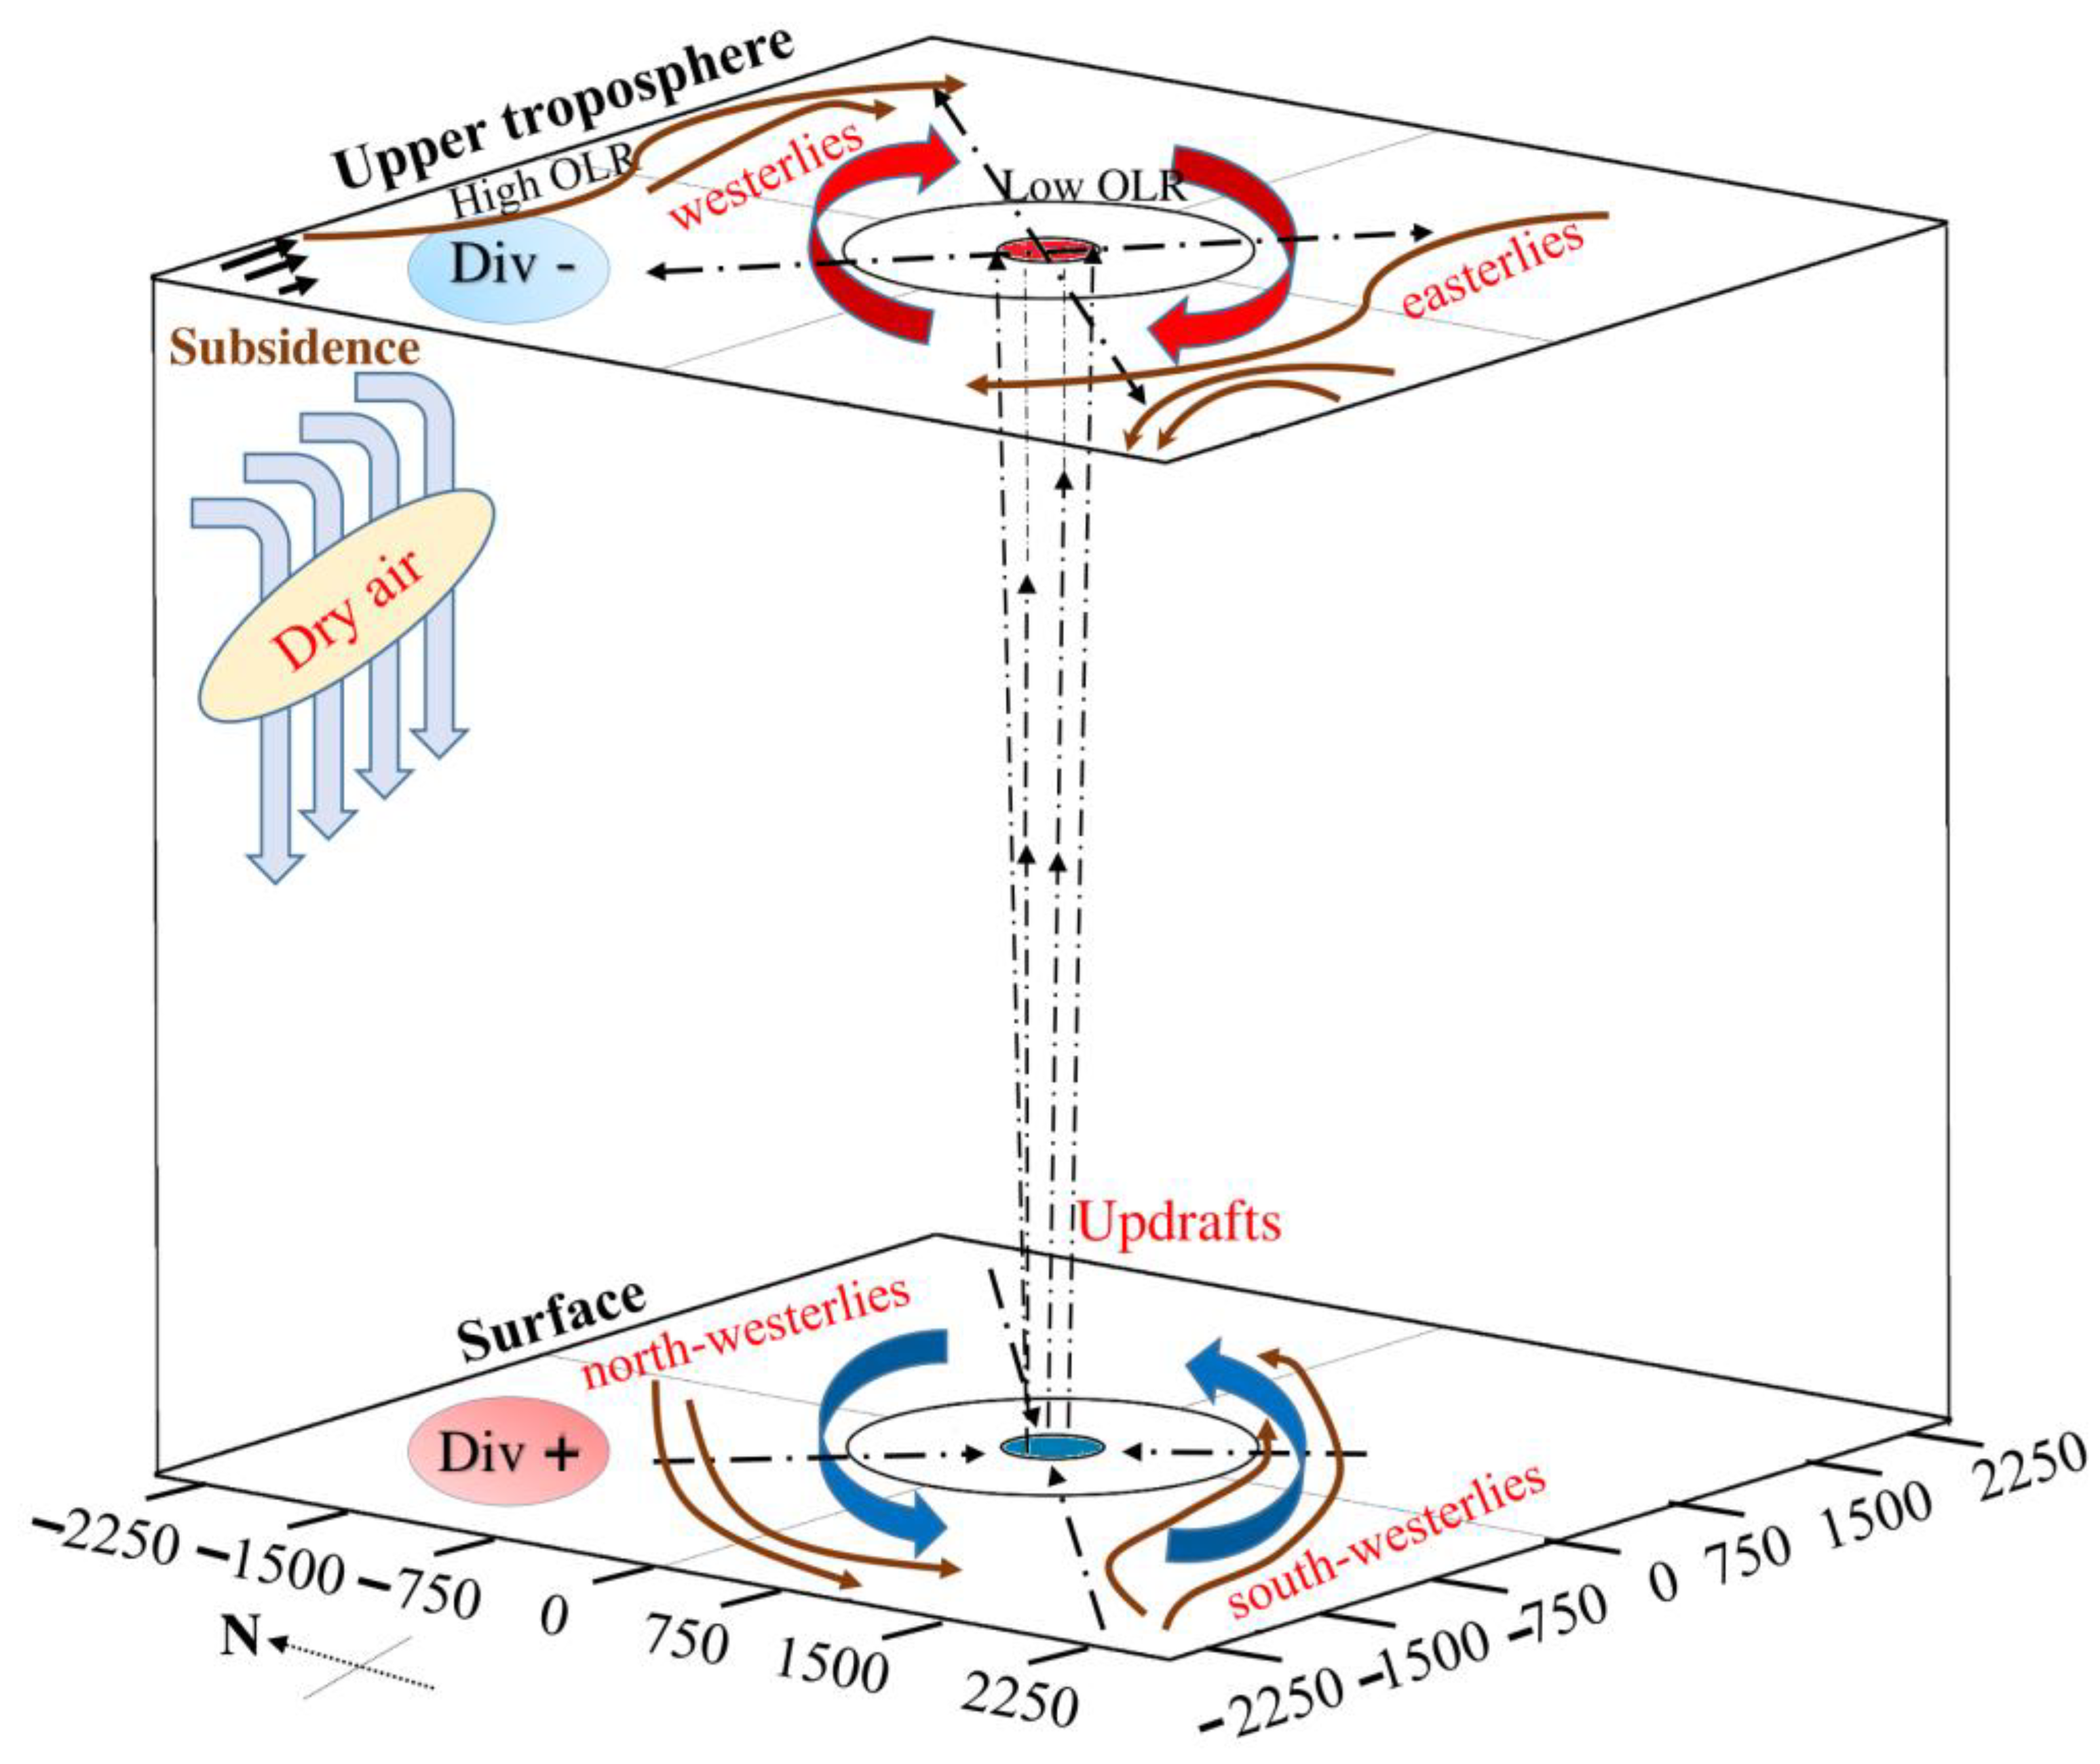
TCs are intense circular storms originating over the warm tropical ocean and characterized by low atmospheric pressure, strong winds, and heavy rainfall. The present study analyses the variation in large-scale background environmental factors during the maximum intensity of TCs using ERA5 reanalysis data. A schematic diagram (Figure 10) demonstrates the objective framework of the present study. Initially, the tracks of TCs are divided into four groups based on the direction of movement using the k-means clustering technique. Then, the mean composites of large-scale atmospheric variables are estimated during the maximum intensity of TCs.
The mean composites of divergence and streamlines of wind fields show the strong convergence and cyclonic circulation formed due to the confluence of winds around the vortex centre in the lower atmosphere. In the upper atmosphere (200 hPa), a strong divergence is observed near the vortex centre of TCs, and an eastward shift of anti-cyclonic circulation from the vortex centre is evident in all the clusters. The distribution of RH lower and upper atmosphere reveals that moist air lies on the equatorward side, and relatively drier air is present on the poleward side. The composites of the radial-height cross-section of divergence and streamlines of wind fields show the presence of upper-level convergence, and low to mid-tropospheric divergence is evident in the NW quadrant. In the SE quadrant, the occurrence of a neutral point is evident with the alternative cyclonic and anti-cyclonic circulation in the vertical atmosphere. However, the upper-level outflows and lower-level inflows are evident in the SW quadrant of TCs formed over the BoB. Similarly, in the radial-height composites of WS and RH, strong upper-level WS and dry air advection in the low-mid troposphere towards the vortex centre are apparent in the NW quadrant of each cluster. The upper-level convergence and presence of dry air, along with significant WS in the NW quadrant of TCs, signify the existence of suppressed convection. Therefore, the mean composites of OLR are also analysed during the maximum intensity of TCs. The mean composites of OLR show the presence of anomalous high OLR in the NW quadrant that is associated with upper-level convergence and dry air. The presence of low OLR near the vortex centre and anomalous high OLR in the WNW direction signifies the occurrence of a strong OLR dipole during the maximum intensities of TCs over the BoB. Further, the mean characteristics of OLR dipole, such as dipole magnitude, dipole orientation, and dipole distance, are also estimated for all the TCs. Results from the present study postulate composite mean features and metrics for 93 TCs formed over the BoB and are helpful for improving the accuracy of TC forecasting.
We utilized ERA5 data as the currently available highest-resolution global dataset. There are no other observational datasets to support our findings, which led us to choose the closest possible reanalysis (ERA5). However, these global reanalysis datasets in general tend to underestimate the intensity of extreme events [70,71,72]. Recent regional climate analysis studies [70,72,73] clearly stressed the need for high-resolution regional reanalysis datasets for analysing extreme events over the Indian region, which can effectively incorporate the localized representation in simulating weather events. The future scope of the present work is to evaluate the large-scale features associated with TCs over the NIO by using an advanced mesoscale weather model.

Supplementary Materials

The following supporting information can be downloaded at: https://www.mdpi.com/article/10.3390/atmos14020333/s1, Figure S1: Radial-height cross-section of azimuthally averaged divergence (shaded, ×10−5 s−1) and wind fields (streamlines) shown in each quadrant of the north-west (NW), north-east (NE), south-west (SW), and south-east (SE) from the vortex centre using ERA5 data for pre-monsoon (ad) and post-monsoon (eh); Figure S2: Probability density distribution of outgoing longwave radiation (OLR, Wm−2) based on (ac) Movement (clusters) and (df) Intensity (Categories: Cyclonic systems (CS), Severe cyclonic systems (SCS), Very severe cyclonic systems (VSCS) and Extremely severe and Super cyclonic systems (ESCS-SuCS)); Figure S3: Composites of outgoing longwave radiation (OLR, Wm−2) for (a) Cyclonic systems (CS), (b) Severe cyclonic systems (SCS), (c) Very severe cyclonic systems (VSCS), and (d) Extremely severe and Super cyclonic systems (ESCS-SuCS). The dotted contours represent percentile values. The value in the parenthesis represents the number of tropical cyclones obtained of each category; Figure S4: Composites of outgoing longwave radiation (OLR, Wm−2) for (a) Pre-monsoon TCs, (b) Post-monsoon TCs. The dotted contours represent percentile values. The value in the parenthesis represents the number of tropical cyclones obtained during each season; Figure S5: Scatterplot represents the linear variation in dipole characteristics (a,b) dipole distance vs. dipole magnitude, (c,d) dipole distance vs. dipole orientation, and (e,f) dipole magnitude vs. dipole orientation between pre- and post-monsoon. Different colours represent each category of TCs; Table S1: Frequency of TCs grouped into each cluster showing intensity and seasonal wise; Table S2: Seasonal wise mean and standard deviation (SD) of Outgoing longwave radiation (OLR) dipole metrics from observation (ERA5) data.

Author Contributions

Conceptualization, N.K.V., M.M.K.G. and Y.V.; methodology, M.M.K.G., V.S.G. and N.K.V.; software, M.M.K.G., V.S.G. and N.K.V.; validation, M.M.K.G., V.S.G. and Y.V.; formal analysis, M.M.K.G., V.S.G. and N.K.V.; investigation, M.M.K.G., V.S.G., N.K.V. and Y.V.; resources, N.K.V., B.T. and Y.V.; data curation, M.M.K.G., V.S.G. and Y.V.; writing—original draft preparation M.M.K.G. and V.S.G.; writing—review and editing, N.K.V., Y.V. and B.T.; visualization, M.M.K.G., V.S.G. and N.K.V.; supervision, N.K.V. and Y.V. All authors have read and agreed to the published version of the manuscript.

Funding

This research received no external funding.

Institutional Review Board Statement

Not applicable.

Informed Consent Statement

Not applicable.

Data Availability Statement

RMSC IMD TCs best tracks datasets were acquired from https://rsmcnewdelhi.imd.gov.in/ (last accessed on 14 April 2022). The ERA5 data were acquired from https://cds.climate.copernicus.eu/ (last accessed on 14 April 2022). Analysed information of this study can be provided upon reasonable request.

Acknowledgments

The authors would like to acknowledge RMSC, IMD for providing the best-track data of tropical cyclones. The authors are also thankful to the ECMWF (European Centre for Medium-Range Weather Forecasts) for providing the ERA5 data. Mohan Murali Krishna Gorja (520ER1001) would like to acknowledge the National Institute of Technology, Rourkela, for the financial support to carry out his research work.

Conflicts of Interest

The authors declare that we do not have any financial interests or personal relationships that would influence the outcome reported from this manuscript.

References

  1. Gray, W.M. The formation of tropical cyclones. Meteor. Atmos. Phys. 1998, 67, 37–69. [Google Scholar] [CrossRef]
  2. Bhaskaran, P.K.; Rao, A.D.; Murty, T. Tropical cyclone-induced storm surges and wind waves in the Bay of Bengal. In Techniques for Disaster Risk Management and Mitigation, 1st ed.; Srivastava, P.K., Singh, S.K., Mohanty, U.C., Murty, T., Eds.; Wiley: New York, NY, USA, 2020; pp. 239–294. [Google Scholar]
  3. Kunze, S. Unraveling the effects of tropical cyclones on economic sectors worldwide: Direct and indirect impacts. Environ. Resour. Econ. 2021, 78, 545–569. [Google Scholar] [CrossRef]
  4. Yamada, H.; Moteki, Q.; Yoshizaki, M. The unusual track and rapid intensification of Cyclone Nargis in 2008 under a characteristic environmental flow over the Bay of Bengal. J. Meteorol. Soc. Jpn. Ser. II 2010, 88, 437–453. [Google Scholar] [CrossRef]
  5. Vissa, N.K.; Satyanarayana, A.N.V.; Bhaskaran, P.K. The intensity of tropical cyclones during pre- and post-monsoon seasons in relation to accumulated tropical cyclone heat potential over Bay of Bengal. Nat. Hazards 2013, 68, 351–371. [Google Scholar] [CrossRef]
  6. Balaguru, K.; Taraphdar, S.; Leung, L.R.; Foltz, G.R. Increase in the intensity of postmonsoon Bay of Bengal tropical cyclones. Geophys. Res. Lett. 2014, 41, 3594–3601. [Google Scholar] [CrossRef]
  7. Srinivas, C.V.; Mohan, G.M.; Naidu, C.V.; Baskaran, R.; Venkatraman, B. Impact of air-sea coupling on the simulation of tropical cyclones in the North Indian Ocean using a simple 3-D ocean model coupled to ARW. J. Geophys. Res. Atmos. 2016, 121, 9400–9421. [Google Scholar] [CrossRef]
  8. Vissa, N.K.; Satyanarayana, A.N.V.; Bhaskaran, P.K. Response of oceanic cyclogenesis metrics for NARGIS cyclone: A case study. Atmos. Sci. Lett. 2013, 14, 7–13. [Google Scholar] [CrossRef]
  9. Singh, K.; Panda, J.; Sahoo, M.; Mohapatra, M. Variability in tropical cyclone climatology over North Indian Ocean during the period 1891 to 2015. Asia-Pac. J. Atmos. Sci. 2019, 55, 269–287. [Google Scholar] [CrossRef]
  10. Akter, N.; Tsuboki, K. Recurvature and movement processes of tropical cyclones over the Bay of Bengal. Q. J. R. Meteorol. Soc. 2021, 147, 3681–3702. [Google Scholar] [CrossRef]
  11. Smith, M.; Toumi, R. A dipole of tropical cyclone outgoing long-wave radiation. Q. J. R. Meteorol. Soc. 2021, 147, 166–180. [Google Scholar] [CrossRef]
  12. Prakash, K.R.; Pant, V.; Udaya Bhaskar, T.V.S.; Chandra, N. What Made the Sustained Intensification of Tropical Cyclone Fani in the Bay of Bengal? An Investigation Using Coupled Atmosphere-Ocean Model. Atmosphere 2022, 13, 535. [Google Scholar] [CrossRef]
  13. Singh, V.K.; Roxy, M.K. A review of ocean-atmosphere interactions during tropical cyclones in the north Indian Ocean. Earth-Sci. Rev. 2022, 226, 103967. [Google Scholar] [CrossRef]
  14. Hill, K.A.; Lackmann, G.M. Influence of environmental humidity on tropical cyclone size. Mon. Weather Rev. 2009, 137, 3294–3315. [Google Scholar] [CrossRef]
  15. Gopalakrishnan, S.G.; Osuri, K.K.; Marks, F.D.; Mohanty, U.C. An inner-core analysis of the axisymmetric and asymmetric intensification of tropical cyclones: Influence of shear. Mausam 2019, 70, 667–690. [Google Scholar] [CrossRef]
  16. Kumar, S.; Panda, J.; Paul, D.; Guha, B.K. Impact of environmental variables on the North Indian Ocean tropical cyclones radial parameters. Clim. Dyn. 2022, 1–18. [Google Scholar] [CrossRef]
  17. Nekkali, Y.S.; Osuri, K.K.; Das, A.K.; Niyogi, D. Understanding the characteristics of microphysical processes in the rapid intensity changes of tropical cyclones over the Bay of Bengal. Q. J. R. Meteorol. Soc. 2022, 148, 3715–3729. [Google Scholar] [CrossRef]
  18. Holland, G.J. Tropical cyclone motion: Environmental interaction plus a beta effect. J. Atmos. Sci. 1983, 40, 328–342. [Google Scholar] [CrossRef]
  19. Chan, K.T.; Chan, J.C. Tropical cyclone recurvature: An intrinsic property? Geophys. Res. Lett. 2016, 43, 8769–8774. [Google Scholar] [CrossRef]
  20. Albert, J.; Bhaskaran, P.K. Ocean heat content and its role in tropical cyclogenesis for the Bay of Bengal basin. Clim. Dyn. 2020, 55, 3343–3362. [Google Scholar] [CrossRef]
  21. Yesubabu, V.; Kattamanchi, V.K.; Vissa, N.K.; Dasari, H.P.; Sarangam, V.B.R. Impact of ocean mixed-layer depth initialization on the simulation of tropical cyclones over the Bay of Bengal using the WRF-ARW model. Meteorol. Appl. 2020, 27, e1862. [Google Scholar] [CrossRef] [Green Version]
  22. Nellipudi, N.R.; Viswanadhapalli, Y.; Challa, V.S.; Vissa, N.K.; Langodan, S. Impact of surface roughness parameterizations on tropical cyclone simulations over the Bay of Bengal using WRF-OML model. Atmos. Res. 2021, 262, 105779. [Google Scholar] [CrossRef]
  23. Vissa, N.K.; Anandh, P.C.; Gulakaram, V.S.; Konda, G. Role and response of ocean–atmosphere interactions during Amphan (2020) super cyclone. Acta Geophys. 2021, 69, 1997–2010. [Google Scholar] [CrossRef]
  24. Paul, D.; Panda, J.; Routray, A. Ocean and atmospheric characteristics associated with the cyclogenesis and rapid intensification of NIO super cyclonic storms during 1981–2020. Nat. Hazards 2022, 114, 261–289. [Google Scholar] [CrossRef]
  25. Geetha, B.; Balachandran, S. Diabatic Heating and Convective Asymmetries During Rapid Intensity Changes of Tropical Cyclones Over North Indian Ocean. Trop. Cyclone Res. Rev. 2016, 5, 32–46. [Google Scholar]
  26. Bhalachandran, S.; Haddad, Z.S.; Hristova-Veleva, S.M.; Marks, F.D., Jr. The relative importance of factors influencing tropical cyclone rapid intensity changes. Geophys. Res. Lett. 2019, 46, 2282–2292. [Google Scholar] [CrossRef]
  27. Francis, D.; Fonseca, R.; Nelli, N. Key Factors Modulating the Threat of the Arabian Sea’s Tropical Cyclones to the Gulf Countries. J. Geophys. Res. Atmos. 2022, 127, e2022JD036528. [Google Scholar] [CrossRef]
  28. Singh, V.K.; Roxy, M.K.; Deshpande, M. Role of subtropical Rossby waves in governing the track of cyclones in the Bay of Bengal. Q. J. R. Meteorol. Soc. 2022, 148, 3774–3787. [Google Scholar] [CrossRef]
  29. Lee, C.S.; Edson, R.; Gray, W.M. Some large-scale characteristics associated with tropical cyclone development in the North Indian Ocean during FGGE. Mon. Weather Rev. 1989, 117, 407–426. [Google Scholar] [CrossRef]
  30. Ventham, J.D.; Wang, B. Large-scale flow patterns and their influence on the intensification rates of western North Pacific tropical storms. Mon. Weather Rev. 2007, 135, 1110–1127. [Google Scholar] [CrossRef]
  31. Wu, L.; Su, H.; Fovell, R.G.; Wang, B.; Shen, J.T.; Kahn, B.H.; Hristova-Veleva, S.M.; Lambrigtsen, B.H.; Fetzer, E.J.; Jiang, J.H. Relationship of environmental relative humidity with North Atlantic tropical cyclone intensity and intensification rate. Geophys. Res. Lett. 2012, 39, L2080. [Google Scholar] [CrossRef]
  32. Wu, L.; Su, H.; Fovell, R.G.; Dunkerton, T.J.; Wang, Z.; Kahn, B.H. Impact of environmental moisture on tropical cyclone intensification. Atmos. Chem. Phys. 2015, 15, 14041–14053. [Google Scholar] [CrossRef] [Green Version]
  33. Ge, X.; Li, T.; Peng, M. Effects of vertical shears and midlevel dry air on tropical cyclone developments. J. Atmos. Sci. 2013, 70, 3859–3875. [Google Scholar] [CrossRef]
  34. Chan, J.C.L. The physics of tropical cyclone motion. Annu. Rev. Fluid Mech. 2005, 37, 99–128. [Google Scholar] [CrossRef]
  35. Sanap, S.D.; Mohapatra, M.; Ali, M.M.; Priya, P.; Varaprasad, D. On the dynamics of cyclogenesis, rapid intensification and recurvature of the very severe cyclonic storm, Ockhi. J. Earth Syst. Sci. 2020, 129, 194. [Google Scholar] [CrossRef]
  36. Pal, A.; Chatterjee, S. The influence of upper level surrounding winds on tropical cyclone motion: A case study of the Bay of Bengal region. Proc. Natl. Acad. Sci. USA 2021, 87, 343–350. [Google Scholar] [CrossRef]
  37. Chan, J.C.; Gray, W.M. Tropical cyclone movement and surrounding flow relationships. Mon. Weather Rev. 1982, 110, 1354–1374. [Google Scholar] [CrossRef]
  38. Schenkel, B.A.; Hart, R.E. An examination of tropical cyclone position, intensity, and intensity life cycle within atmospheric reanalysis datasets. J. Clim. 2012, 25, 3453–3475. [Google Scholar] [CrossRef]
  39. Ditchek, S.D.; Nelsona, T.C.; Rosenmayer, M.; Corbosiero, K.L. The relationship between tropical cyclones at genesis and their maximum attained intensity. J. Clim. 2017, 30, 4897–4913. [Google Scholar] [CrossRef]
  40. Lu, R.; Tang, X. Relationship between Early-Stage Features and Lifetime Maximum Intensity of Tropical Cyclones over the Western North Pacific. Atmosphere 2021, 12, 815. [Google Scholar] [CrossRef]
  41. Singh, O.P.; Khan, T.A.; Rahman, M.S. Changes in the frequency of tropical cyclones over the North Indian Ocean. Meteorol. Atmos. Phys. 2000, 75, 11–20. [Google Scholar] [CrossRef]
  42. Singh, O.P.; Khan, T.M.A.; Rahman, M.S. Has the frequency of intense tropical cyclones increased in the north Indian Ocean? Curr. Sci. 2001, 80, 575–580. [Google Scholar]
  43. Ramsay, H. The Global Climatology of Tropical Cyclones. Oxf. Res. Encycl. Nat. Hazard Sci. 2017. [Google Scholar]
  44. Li, Z.; Yu, W.; Li, T.; Murty, V.S.N.; Tangang, F. Bimodal character of cyclone climatology in Bay of Bengal modulated by monsoon seasonal cycle. J. Clim. 2013, 26, 1033–1046. [Google Scholar] [CrossRef]
  45. Dube, S.K.; Rao, A.D.; Poulose, J.; Mohapatra, M.; Murty, T.S. Storm surge inundation in South Asia under climate change scenarios. In Monitoring and Prediction of Tropical Cyclones in the Indian Ocean and Climate Change; Mohanty, U.C., Mohapatra, M., Singh, O.P., Bandyopadhyay, B.K., Rathore, L.S., Eds.; Springer: Dordrecht, The Netherlands, 2014; pp. 355–363. [Google Scholar]
  46. Sahoo, B.; Bhaskaran, P.K. Assessment on historical cyclone tracks in the Bay of Bengal, east coast of India. Int. J. Clim. 2016, 36, 95–109. [Google Scholar] [CrossRef]
  47. Kabir, R.; Ritchie, E.A.; Stark, C. Tropical Cyclone Exposure in the North Indian Ocean. Atmosphere 2022, 13, 1421. [Google Scholar] [CrossRef]
  48. Vinodhkumar, B.; Busireddy, N.K.R.; Ankur, K.; Nadimpalli, R.; Osuri, K.K. On occurrence of rapid intensification and rainfall changes in tropical cyclones over the North Indian Ocean. Int. J. Clim. 2022, 42, 714–726. [Google Scholar] [CrossRef]
  49. Mohapatra, M.; Nayak, D.P.; Sharma, R.P.; Bandyopadhyay, B.K. Evaluation of official tropical cyclone track forecast over north Indian Ocean issued by India Meteorological Department. J. Earth Syst. Sci. 2013, 122, 589–601. [Google Scholar] [CrossRef]
  50. Murakami, H. Tropical cyclones in reanalysis data sets. Geophys. Res. Lett. 2014, 41, 2133–2141. [Google Scholar] [CrossRef]
  51. Malakar, P.; Kesarkar, A.P.; Bhate, J.N.; Singh, V.; Deshamukhya, A. Comparison of Reanalysis Data Sets to Comprehend the Evolution of Tropical Cyclones Over North Indian Ocean. Earth Space Sci. 2020, 7, e2019EA000978. [Google Scholar] [CrossRef]
  52. Priya, P.; Pattnaik, S.; Trivedi, D. Characteristics of the tropical cyclones over the North Indian Ocean Basins from the long-term datasets. Meteorol. Atmos. Phys. 2022, 134, 65. [Google Scholar] [CrossRef]
  53. Hersbach, H.; Bell, B.; Berrisford, P.; Hirahara, S.; Horányi, A.; Muñoz-Sabater, J.; Nicolas, J.; Peubey, C.; Radu, R.; Schepers, D.; et al. The ERA5 global reanalysis. Q. J. R. Meteorol. Soc. 2020, 146, 1999–2049. [Google Scholar] [CrossRef]
  54. Fahim, A.M.; Salem, A.M.; Torkey, F.A.; Ramadan, M. An efficient enhanced k-means clustering algorithm. J. Zhejiang Univ.-Sci. A 2006, 7, 1626–1633. [Google Scholar] [CrossRef]
  55. Na, S.; Xumin, L.; Yong, G. Research on k-means Clustering Algorithm: An Improved k-means Clustering Algoritm. In Proceedings of the 2010 Third International Symposium on Intelligent Information Technology and Security Informatics, Jinggangshan, China, 2–4 April 2010; pp. 63–67. [Google Scholar]
  56. Elsner, J.B. Tracking hurricanes. Bull. Am. Meteorol. Soc. 2003, 84, 353–356. [Google Scholar] [CrossRef] [Green Version]
  57. Kossin, J.P.; Camargo, S.J.; Sitkowski, M. Climate modulation of North Atlantic hurricane tracks. J. Clim. 2010, 23, 3057–3076. [Google Scholar] [CrossRef]
  58. Li, W.W.; Wang, C.; Wang, D.; Yang, L.; Deng, Y. Modulation of low-latitude west wind on abnormal track and intensity of tropical cyclone Nargis (2008) in the Bay of Bengal. Adv. Atmos. Sci. 2012, 29, 407–421. [Google Scholar] [CrossRef]
  59. Ying, Y.; Zhang, Q. A modeling study on tropical cyclone structural changes in response to ambient moisture variations. J. Meteorol. Soc. Jpn. Ser. II 2012, 90, 755–770. [Google Scholar] [CrossRef]
  60. Wang, S.; Toumi, R. Impact of dry midlevel air on the tropical cyclone outer circulation. J. Atmos. Sci. 2019, 76, 1809–1826. [Google Scholar] [CrossRef]
  61. Chen, Y.; Gao, S.; Li, X.; Shen, X. Key environmental factors for rapid intensification of the South China Sea tropical cyclones. Front. Earth Sci. 2021, 8, 609727. [Google Scholar] [CrossRef]
  62. Wang, Y.; Rao, Y.; Tan, Z.M.; Schönemann, D.A. statistical analysis of the effects of vertical wind shear on tropical cyclone intensity change over the western North Pacific. Mon. Weather Rev. 2015, 143, 3434–3453. [Google Scholar] [CrossRef]
  63. Wu, L.; Wang, C.; Wang, B. Westward shift of western North Pacific tropical cyclogenesis. Geophys. Res. Lett. 2015, 42, 1537–1542. [Google Scholar] [CrossRef]
  64. Tang, B.; Emanuel, K. Sensitivity of tropical cyclone intensity to ventilation in an axisymmetric model. J. Atmos. Sci. 2012, 69, 2394–2413. [Google Scholar] [CrossRef]
  65. Alland, J.J.; Tang, B.H.; Corbosiero, K.L.; Bryan, G.H. Combined effects of midlevel dry air and vertical wind shear on tropical cyclone development. Part I: Downdraft ventilation. J. Atmos. Sci. 2021, 78, 763–782. [Google Scholar] [CrossRef]
  66. Alland, J.J.; Tang, B.H.; Corbosiero, K.L.; Bryan, G.H. Combined effects of midlevel dry air and vertical wind shear on tropical cyclone development. Part II: Radial ventilation. J. Atmos. Sci. 2021, 78, 783–796. [Google Scholar] [CrossRef]
  67. Rafiq, L.; Blaschke, T.; Tajbar, S. Arabian Sea cyclone: Structure analysis using satellite data. Adv. Space Res. 2015, 56, 2235–2247. [Google Scholar] [CrossRef]
  68. Karnauskas, K.B.; Li, L. Predicting Atlantic seasonal hurricane activity using outgoing longwave radiation over Africa. Geophys. Res. Lett. 2016, 43, 7152–7159. [Google Scholar] [CrossRef]
  69. Subrahmanyam, B.; Murty, V.S.N.; Sharp, R.; O’Brien, J. Air-sea coupling during the tropical cyclones in the Indian Ocean: A case study using satellite observations. Pure Appl. Geophys. 2005, 162, 1643–1672. [Google Scholar] [CrossRef]
  70. Yesubabu, V.; Challa, V.; Srinivas, V.; Basha, G.; Dasari, H.P.; Langodan, S.; Ratnam, M.V.; Hoteit, I. A diagnostic study of extreme precipitation over Kerala during August 2018. Atmos. Sci. Lett. 2019, 20, e941. [Google Scholar]
  71. Chen, Y.; Sharma, S.; Zhou, X.; Yang, K.; Li, X.; Niu, X.; Hu, X.; Khadka, N. Spatial performance of multiple reanalysis precipitation datasets on the southern slope of central Himalaya. Atmos. Res. 2021, 250, 105365. [Google Scholar] [CrossRef]
  72. Prathipati, V.K.; Yesubabu, V.; Chennu, C.N.; Dasari, H.P. Study of Active and Break Spell Phenomena of Indian Summer Monsoon Using WRF Downscaled Data. Pure Appl. Geophys. 2021, 178, 4195–4219. [Google Scholar] [CrossRef]
  73. Dasari, H.P.; Viswanadhapalli, Y.; Langodan, S.; Abualnaja, Y.; Desamsetti, S.; Vankayalapati, K.; Thang, L.; Hoteit, I. High-resolution climate characteristics of the Arabian Gulf based on a validated regional reanalysis. Meteorol. Appl. 2022, 29, e2102. [Google Scholar] [CrossRef]
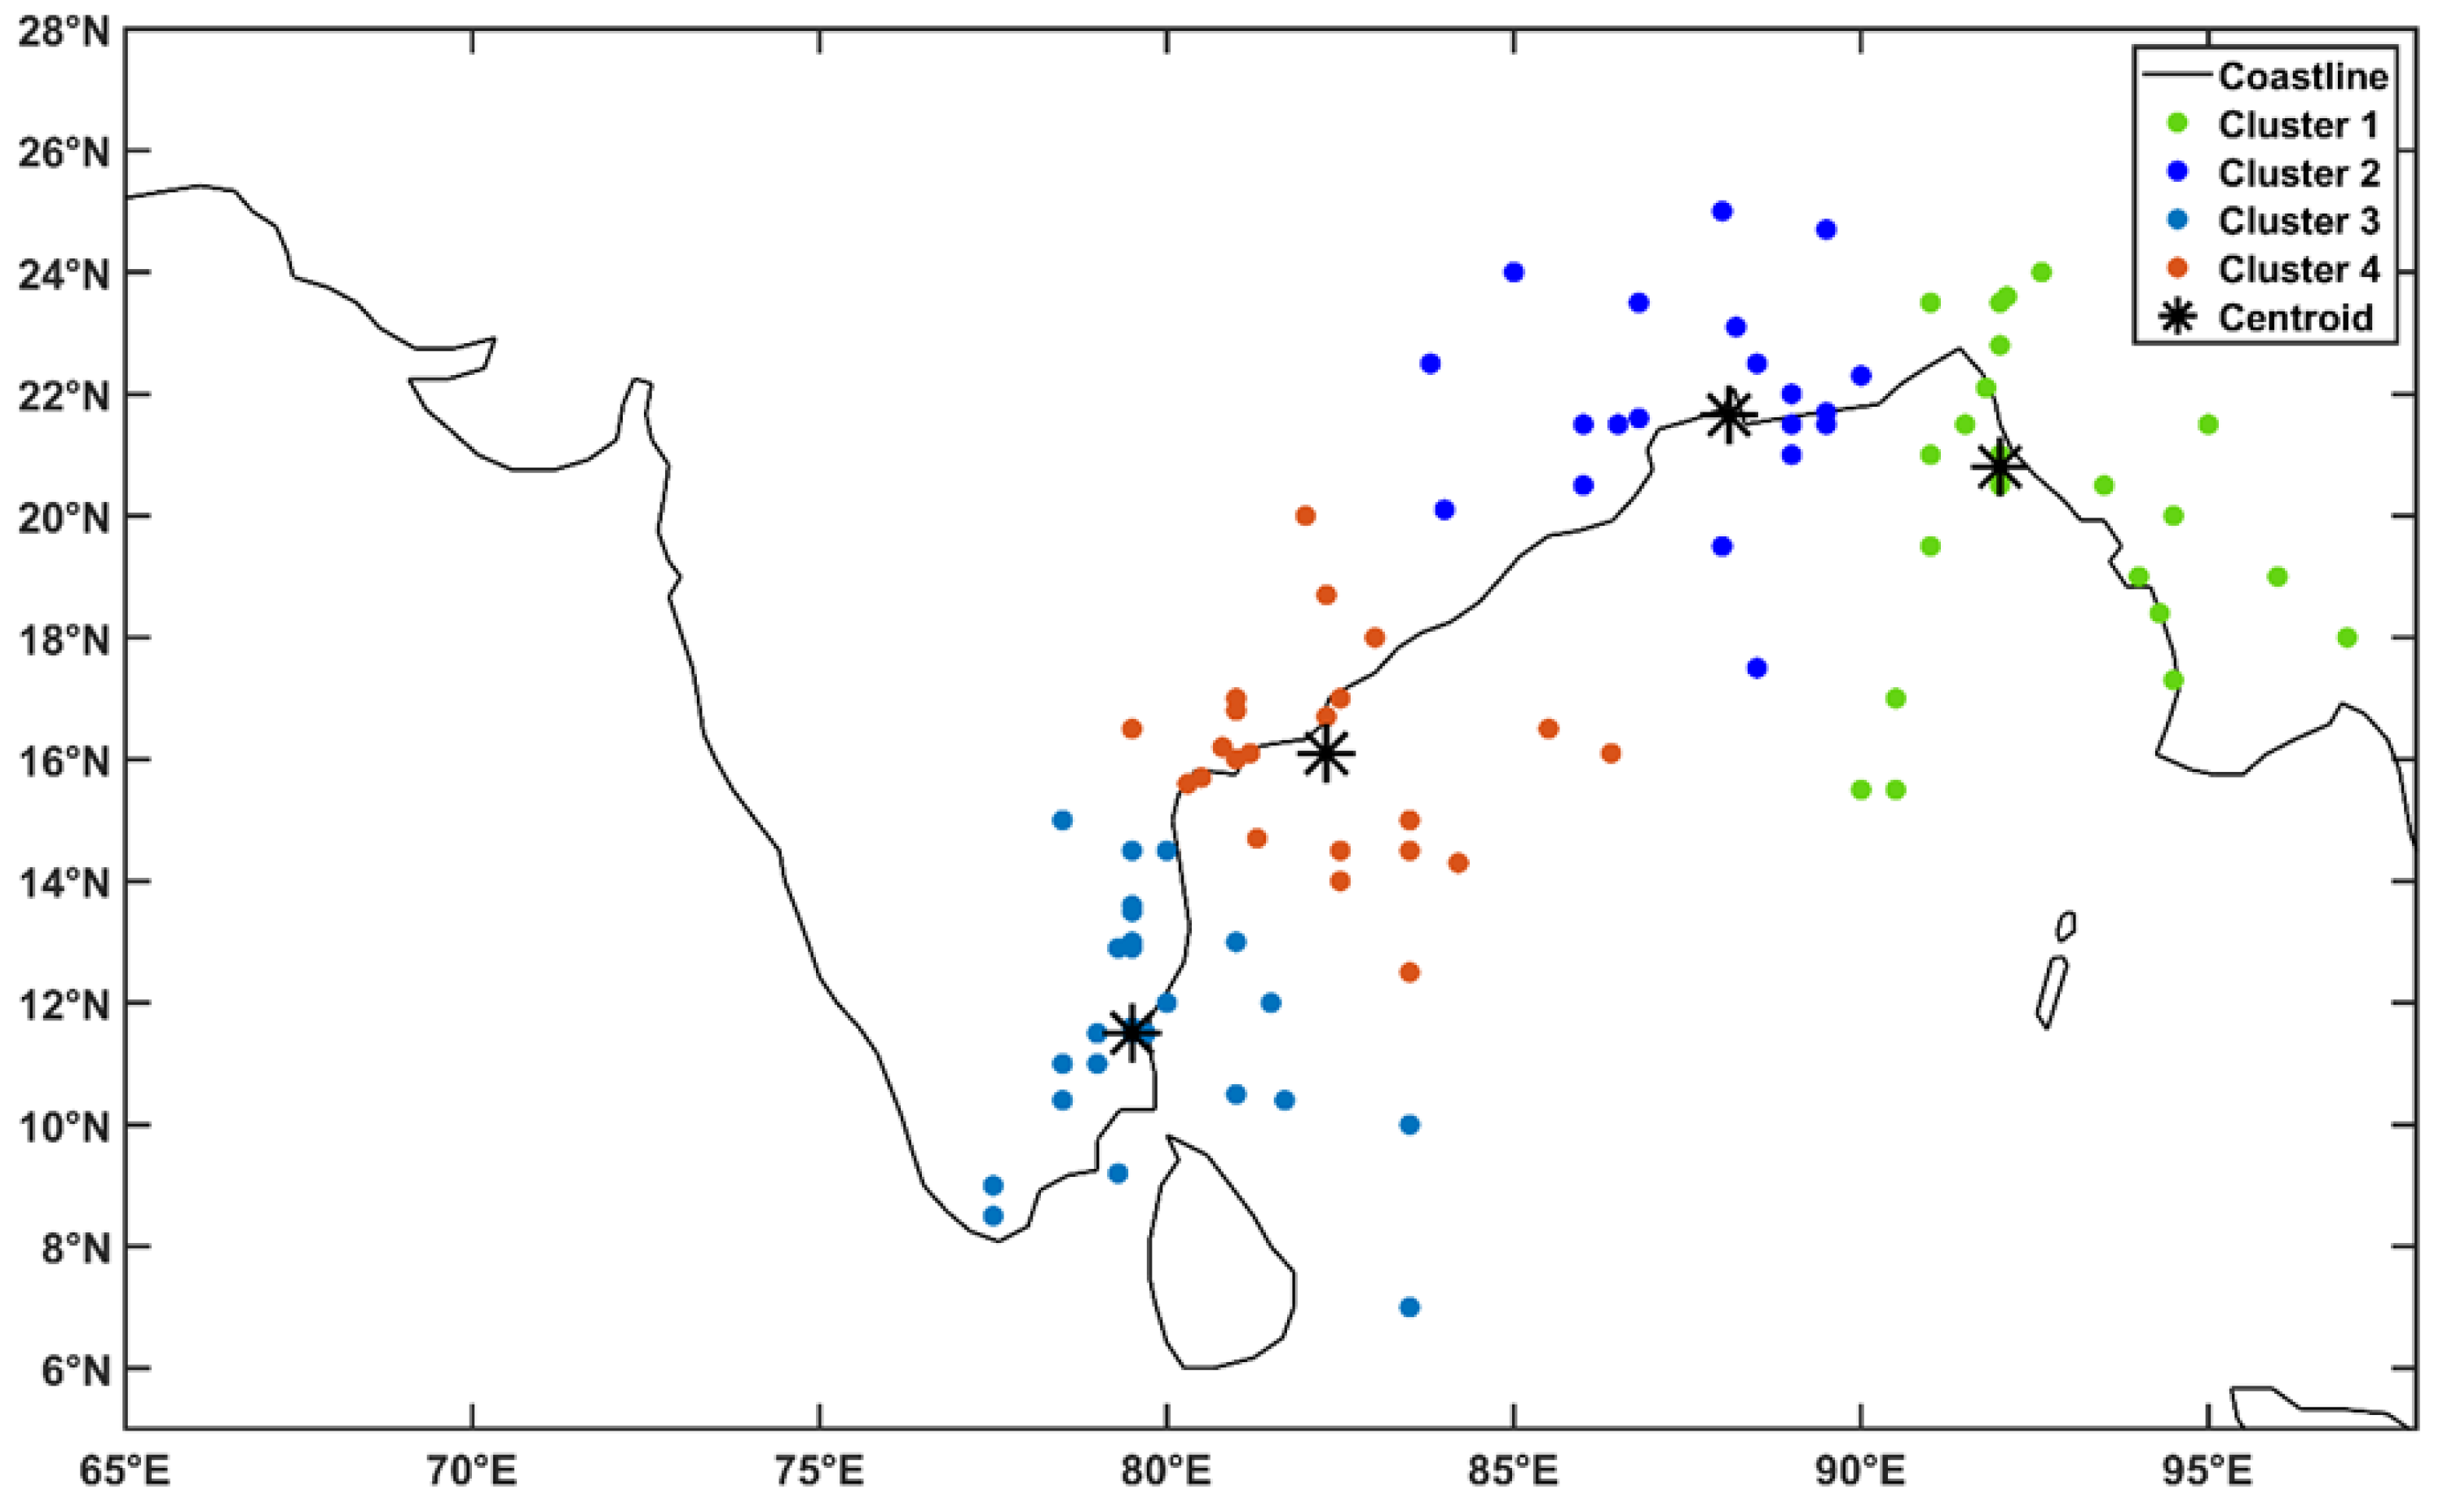
Figure 1. The tropical cyclone endpoint locations used for clustering classification (coloured dots) grouped by centroids of each cluster (represented by *).
Atmosphere 14 00333 g001
Figure 2. Tracks of TCs obtained in each cluster. Cluster-1 consists of tracks moving north–eastward, Cluster-2 having the tracks moving northward, Cluster-3 consists of tracks moving westward, and Cluster-4 consists of tracks moving in the west–northwestward directions. TC tracks are shown based on IMD intensity classification with different colours.
Atmosphere 14 00333 g002
Figure 3. The mean composites of divergence (shaded, ×10−5 s−1) and wind fields (streamlines) obtained from ERA5 data for each cluster at different levels 200 hPa (ad), 500 hPa (eh), and 950 hPa (il).
Atmosphere 14 00333 g003
Figure 4. Mean composites of relative humidity (RH, %) obtained from ERA5 data for each cluster at different levels 200 hPa (ad), 500 hPa (eh), and 950 hPa (il).
Atmosphere 14 00333 g004
Figure 5. Radial-height cross-section of azimuthally averaged divergence (shaded, ×10−5 s−1) and wind fields (streamlines) shown in each quadrant of the north-west (NW), north-east (NE), south-west (SW), and south-east (SE) from the vortex centre using ERA5 data for Cluster-1 (ad), Cluster-2 (eh), Cluster-3 (il), and Cluster-4 (mp).
Atmosphere 14 00333 g005
Figure 6. Radial-height cross-section of azimuthally averaged wind shear (shaded, m s−1) and relative humidity (contours, %) shown in each quadrant of the north-west (NW), north-east (NE), south-west (SW), and south-east (SE) from the vortex centre using ERA5 data for Cluster-1 (ad), Cluster-2 (eh), Cluster-3 (il), and Cluster-4 (mp).
Atmosphere 14 00333 g006
Figure 7. Composites of outgoing longwave radiation (OLR, Wm−2) for (a) Cluster-1, (b) Cluster-2, (c) Cluster-3, and (d) Cluster-4. The dotted contours represent percentile values. The value in the parenthesis represents the number of tropical cyclones obtained for each cluster.
Atmosphere 14 00333 g007
Figure 8. Histogram represents the dipole characteristics of outgoing longwave radiation (OLR) such as (a) dipole distance (km), (b) dipole orientation (deg), and (c) dipole magnitude (Wm−2) for 93 TCs. Lines with different colours represents the variation in dipole properties foe each cluster.
Atmosphere 14 00333 g008
Figure 9. Scatterplot represents the linear variation in dipole characteristics (a) dipole distance vs. dipole magnitude, (b) dipole distance vs. dipole orientation, and (c) dipole magnitude vs. dipole orientation. Different colours represent each category of tropical cyclones.
Atmosphere 14 00333 g009
Figure 10. The schematic diagram illustrates low-level cyclonic circulation (arrows in blue colour) associated with the confluence of north-westerlies and south-westerlies (arrows in grey colour), upper-level anti-cyclonic circulation (arrows in red colour) embedded between poleward westerlies and equatorward easterlies (arrows in grey colour), and strong updrafts throughout the troposphere around the vortex centre. An OLR dipole with low OLR co-locates with the upper-level divergence region (red circle) around the vortex centre and high OLR (beyond 750 km) co-locates with the upper-level convergence region (blue circle) in the west-northwest direction, where there is strong subsidence and advection of less moist air throughout the mid-troposphere of the northwest quadrant.
Atmosphere 14 00333 g010
Disclaimer/Publisher’s Note: The statements, opinions and data contained in all publications are solely those of the individual author(s) and contributor(s) and not of MDPI and/or the editor(s). MDPI and/or the editor(s) disclaim responsibility for any injury to people or property resulting from any ideas, methods, instructions or products referred to in the content.