Article

Intelligent Analysis Cloud Platform for Soil Moisture-Nutrients-Salinity Content Based on Quantitative Remote Sensing

1
National Engineering Research Center for Efficient Utilization of Soil and Fertilizer Resources, College of Resources and Environment, Shandong Agricultural University, Taian 271018, China
2
Shandong Institute of Territorial and Space Planning, Jinan 250014, China
3
College of Agronomy, Shandong Agricultural University, Taian 271018, China
*
Author to whom correspondence should be addressed.
Atmosphere 2023, 14(1), 23; https://doi.org/10.3390/atmos14010023
Submission received: 18 November 2022 / Revised: 19 December 2022 / Accepted: 21 December 2022 / Published: 23 December 2022

Abstract

:
Quickly obtaining accurate soil quality information is the premise for accurate agricultural production and increased crop yield. With the development of the digital information industry, smart agriculture has become a new trend in agricultural development and there is increasing demand for efficiently and intelligently acquiring good soil quality information. Scientists worldwide have developed many remote sensing quantitative inversion models, which need to be systematized and intelligent for agricultural personnel to enjoy the dividends of information technology such as 3S (remote sensing, geographic information system, and global navigation satellite system) techniques. Accordingly, to meet the need of farmers, agricultural managers, and agricultural researchers to acquire timely information on regional soil quality, in this paper, we designed a cloud platform for inversion analysis of moisture, nutrient, salinity, and other important soil quality indicators. The platform was developed using ArcGIS (The software is produced by the Environmental Systems Research Institute, Inc. of America in Redlands, CL, USA) and GeoScene (The software is produced by GeoScene Information Technology Co.,Ltd., Beijing, China) software, with Java and JavaScript as programing languages and SQL Server as the database management system with a PC client, a web client, and a mobile app. On the basis of the existing quantitative remote sensing models, the platform realizes mapping functions, intelligent inversion of soil moisture–nutrient–salinity (SMNS) content, data analysis mining, soil knowledge base, platform management, and so on. It can help different users acquire, manage, and analyze data and make decisions based on the data. In addition, the platform can customize model parameters according to regional characteristics, improving analysis accuracy and expanding the application area. Overall, the platform employs 3S techniques, Internet technology, and mobile communication technology synthetically and realizes intelligent inversion and decision analysis of significant soil quality information, such as moisture–nutrient–salinity content. This platform has been applied to the analysis of soil indicators in several areas and has produced good operational results and benefits. This study will enable rapid data analysis and provide technical support for regional agriculture production, contributing to the development of smart agriculture.

1. Introduction

Precision agriculture is the application of information technology to better manage agriculture production, and the development direction of modern agriculture [1]. Quickly obtaining accurate agricultural condition information is the basis for accurate agricultural production and increased crop yield. In the context of current global climate change, it is increasingly necessary to obtain the regional soil quality status quickly and accurately [2,3,4,5]. The soil moisture–nutrient–salinity (SMNS) content is an important component of soil quality information, which is also closely related to crop growth. Intelligently obtaining the SMNS content in a timely manner is an urgent and realistic need of agricultural production, as well as a prerequisite for the development of smart agriculture [6,7,8]. However, the traditional way of bringing a soil sample to the laboratory for testing is time consuming and labor intensive and regional analysis is difficult. Currently, remote sensing is the primary tool for quantitative regional soil analysis, for which many quantitative soil remote sensing inversion models have been constructed by scientists worldwide [9,10,11,12,13,14,15,16]. Only through systematization and intelligence can these models obtain soil quality indexes quickly and intelligently. Therefore, the design and development of information systems for intelligent analysis of SMNS based on quantitative remote sensing has become an urgent need [17,18,19,20].
Research on information systems for intelligent analysis of SMNS mainly focuses on three aspects:
  • Selecting data sources to obtain SMNS. There are usually two methods. The more common is using fixed monitoring stations or mobile monitoring stations to obtain data and using the spatial interpolation method to achieve regional soil quality information monitoring. For example, Wu et al. designed and developed an online evaluation system to remediate heavy metal pollution of soil by collecting the index information of heavy metals in soil samples and using the kriging spatial interpolation analysis method [21]. However, this method is costly, fixed stations can be easily damaged and require complex maintenance, and mobile monitoring stations require many human and material resources [22]. It is therefore not easy to complete the analysis of regional soil quality information. Another method is to obtain soil quality information through quantitative remote sensing inversion, which involves establishing the quantitative relationship and model between spectral reflectance and soil quality information. For example, Wang et al., based on MODIS/HJ1A remote sensing image data, used the temperature–vegetation dryness index (TVDI) method to invert soil moisture and then designed a soil moisture monitoring system [23]. The method has now become an essential tool for regional soil quality monitoring. The remote sensing data source is low in cost and easy to access, and the quantitative model can achieve rapid and non-destructive monitoring of regional SMNS [9,10,11,12,13,14,15,16]. Therefore, it has become a general trend in analysis systems for soil quality information to obtain soil quality data based on the quantitative remote sensing model.
  • Designing the system application platform and function, i.e., the platform environment and functions, on the basis of user requirements. For example, Zhang et al. designed and developed a water–salt dynamic monitoring Web system for saline land for agricultural managers, which realized the functions of information query of plot, statistical analysis of water and salt data, spatial analysis of water and salt, dynamic trend analysis of water and salt, and early warning [24]. Guo developed a modular desktop system for remote sensing inversion and monitoring of soil salinity using the ArcGIS Engine. It also combines remote sensing and spatial statistic principles to mine and analyze data on soil salinization spatial and temporal variation characteristics [25]. Long et al. developed a farmland drought remote sensing dynamic monitoring system based on the Android platform [26]. The research shows that regional soil quality information can be rapidly monitored and analyzed by developing the system, but the above research only designed the system application platform and functions for the needs of a single user. Different users have different needs in agricultural production: Farmers need to acquire field soil information remotely, agricultural managers need to understand the characteristics of regional soil change, and agricultural researchers need to study precision fertilization and smart agricultural production. Therefore, we must design the system application platform level and functions of the analysis systems for soil quality information in a targeted way to accomplish a rapid and intelligent analysis of regional soil quality indicators.
  • Selecting analysis index of the system, that is, which soil quality indicators are acquired, processed, analyzed, and managed by the system. The indicators in the existing studies include soil moisture, nutrients (organic matter, nitrogen, etc.), and salinity. For example, Lan et al. designed and developed a soil nitrogen spatial distribution mapping system based on ArcGIS Engine [27]. Wang et al. performed a kriging analysis of soil nutrient data and realized precise fertilization for family farms using the smartphone App combined with the Web management system [28]. It can be seen that most of the existing soil quality analysis systems only focus on a single index. Crop growth is affected by the interaction of soil water, nutrients, salt, and other factors requires in-depth analysis of soil quality information from the perspectives of multiple indicators. Therefore, it is necessary to establish a multi-index analysis system of soil quality information to provide general data for comprehensive analysis, management, mining, and application of soil quality information.
In summary, data sources to obtain SMNS and application platforms, functions, and analysis index of the system should be considered in the development of information systems for intelligent analysis of SMNS. On the one hand, remote sensing is the primary tool for quantitative regional soil analysis, for which many quantitative soil remote sensing inversion models have been constructed by scientists worldwide [9,10,11,12,13,14,15,16]; on the other hand, the existing systems and platforms are mainly researched and designed for a single index and a single client, with simple functions [24,25,26,27,28], which makes it challenging to meet the needs of different users and comprehensively and quickly analyze regional soil quality information. Therefore, it is necessary to comprehensively consider the needs of farmers, agricultural managers, and agricultural researchers to obtain and analyze regional soil quality information quickly and accurately to develop a soil quality information system based on a quantitative remote sensing model.
In recent years, on the basis of Landsat 8, Sentinel-2A, and Gaofen satellite data images, our research team has constructed some SMNS models by multiple regression, partial least squares, and support vector machine methods that can be used to quantitatively analyze regional soil quality information. Based on this, in order to realize the rapid and intelligent analysis of regional SMNS information for three kinds of users based on the existing quantitative remote sensing models, the present paper integrates 3S (remote sensing, RS; geographic information system, GIS; and global navigation satellite system (GNSS), the Internet, and mobile communication technologies on the basis of C#, Java, and JavaScript development language and ArcGIS software to develop a cloud platform for intelligent inversion of SMNS. According to the needs of the three types of users, three application platforms (the PC client, the Web client, and the mobile client) are designed to realize multi-index soil quality information inversion. The platform also supports model modification, has rich data analysis and mining functions, is light in weight, and has strong applicability. It can be widely used for the inversion and analysis of SMNS based on quantitative remote sensing in different regions and provides data and decision support for regional precision fertilization and intelligent agriculture development. The platform can realize fast, non-destructive, and intelligent inversion of regional soil quality information and analyze the spatial–temporal distribution characteristics of soil quality, providing decision-making suggestions for the development of precision agriculture.

2. Materials and Methods

2.1. Platform Design Methodology

2.1.1. Object-Oriented Programming Methods

The platform employed object-oriented design and development method. The idea of object-oriented is to abstract objects from practical problems, describe their characteristics and functions by defining attributes and operations, describe their status and relationship with other objects by defining interfaces, and finally form a dynamic object model system that is closer to the nature of the problem. The object-oriented method is a systematic approach that applies object-oriented ideas to the software design and development process and guides development activities [29].

2.1.2. System Requirement Analysis

Farmers, agricultural managers, and agricultural researchers are the main users of the SMNS information. Farmers need soil quality information and agricultural knowledge in their fields to farm in a scientific way. Agricultural managers need to conduct rapid statistics and analysis of soil quality information in large areas, so as to make reasonable plans for regional soil. At the same time, multiple users may be required to operate and share data at the same time. Agricultural researchers need to process and mine a large amount of data to study intelligent agricultural production. The research and development of a single platform regional soil quality analysis system cannot meet the different needs of farmers, agricultural managers and agricultural researchers for data acquisition. Therefore, the cloud platform for SMNS with three layers of clients (PC client, Web client and mobile APP) and five functional modules (map function, intelligent inversion of SMNS, data analysis mining, soil knowledge base, and platform management) the cloud platform for SMNS were designed using the object-oriented design method based on the characteristics of the software life cycle [30].

2.2. Platform Environment

2.2.1. GIS Software

GeoScene Pro is a GIS desktop software with powerful data management, mapping, spatial analysis and other capabilities by GeoScene Information Technology Co., Ltd. It integrates ArcMap, ArcSence, ArcGlobe three ArcGIS software functions, can realize the three-dimensional integration of synchronization [31].
ArcGIS Server is an enterprise-level GIS software platform released by Environmental Systems Research Institute, Inc. (ESRI) to provide Web-oriented spatial data services. It provides a framework for creating and configuring GIS applications and services, which can meet the needs of customers for geographic information processing [32].

2.2.2. Development Environment

This paper uses the Windows 10 operating system to develop the cloud platform, with the server operating system of Windows Server 2008, the web server of Microsoft Internet Information Server (IIS), the GeoScene Pro and the ArcGIS Server were used to develop and store the Geoprocessing (GP) services, and the database of “SQL Server+ ArcSDE for SQL Server”.
The PC client was developed in Microsoft Visual Studio 2010 in combination with the C# development language and ArcGIS Engine. The Web client was developed in the Microsoft Visual Studio Code development environment, which used front-end languages, such as JavaScript, Html, and CSS, and the “ArcGIS API for JavaScript” third-party library. The mobile app is based on the Android Studio development environment and uses the object-oriented Java language and ArcGIS API for Android for development. We used the model builder [33] in Geoscene Pro to build the processing model. Additionally, we published the processing model as a GP service through ArcGIS Enterprise and stored in ArcGIS Server. Use the GeoProcessor class to complete the call to the GP service on the client side.

2.2.3. Database Software

Soil quality involves both spatial distribution and attributes of SMNS, the system data have both spatial data and attribute data, so the technical system of “ArcSDE (Spatial Database Engine) + Geodatabase (Geospatial Data Model) + Relational Database” is adopted to store and manage the spatial data, in which the relational database uses the SQL Server to store and manage the data [34,35].

2.3. Data Acquisition and Pre-Processing

There are spatial data, attribute data and SMNS quantitative remote sensing inversion model in the platform.

2.3.1. Spatial Data

The spatial data used in this study include remote sensing image data and administrative area vector data.
  • Remote sensing image data are downloaded through Copernicus Open Access Hub (URL: https://scihub.copernicus.eu/, accessed on 15 November 2022) and Geospatial Data Cloud (URL: https://www.gscloud.cn/, accessed on 15 November 2022); processed by the Sentinel Application Platform (SNAP), ENVI, and other image processing software for atmospheric correction, radiometric calibration, and other pre-processing, and released to the spatial database.
  • The administrative area vector data are obtained through the Earth Big Data Science Project Data Sharing Service System (https://data.casearth.cn/sdo/list, accessed on 15 November 2022), processed using Geoscene Pro, and then released to the spatial database.

2.3.2. Attribute Data

The attribute data used in this study are mainly soil knowledge base data, such as soil knowledge, decision advice and news information.
  • Soil knowledge includes the classification, formation factors, types, and other related information related to the soil. It is collected from papers, books, and other materials; organized into tables according to the needs; and then stored in the database for users.
  • Decision-making advice is based on soil moisture–nutrient–salinity indicators, and the classification standards of soil indicators, advice decisions, and others are sorted into tables and stored in the database.
  • News information includes news on agricultural policies, crop planting, pest control, natural disaster warning, etc. It is organized and edited using open source KindEditor [36] and then released by the administrator from the background. Users can view it on the front-end client.

2.3.3. Quantitative Inversion Model for SMNS

Quantitative inversion models for SMNS are quantitative empirical models that use the spectral feature information of remote sensing images as independent variables and SMNS as dependent variables through statistical analysis or machine learning. The author’s research group has built many SMNS quantitative remote sensing inversion models, such as soil salinity models, soil organic models, and soil moisture models [11,12,13]. The inversion model of soil organic matter in southwest Shandong Province and the inversion model of soil salt in Kenli area were selected as the test models of the platform. The quantitative remote sensing model is programmed as a geographic processing tool in the GeoScene software through Arcpy language, and then released in the form of GP service and stored in the ArcGIS server.

2.4. Functions Design and Implementation

The main task of the platform is the intelligent and rapid acquisition and analysis of regional SMNS, so the key functions mainly include intelligent inversion of SMNS, data analysis mining, and management of quantitative inversion models.
For the functions that need to be processed geographically, in the Web client and the mobile app client, we used the model builder in Geoscene Pro to build the processing model. Then, we published the processing model as a GP service through ArcGIS Enterprise and invoked it in the client. The PC client is developed based on the ArcGIS Engine.

2.4.1. Intelligent Inversion of SMNS

The function module realizes the inversion of SMNS by calculating the raster pixel value of the remote sensing image. The built model is published as a GP service in the server, and the front-end user can call the corresponding service, and the server can carry out the corresponding inversion operation. The specific implementation is as follows:
  • The Web client and the mobile app: The existing remote sensing inversion model was created as geographic processing using the Python programing language in Geoscene Pro and published as the GP service. The client can fetch raster image files from local or cloud databases and display them. The Web client and the mobile app sides access and call the GP service to process the raster image using ArcGIS Runtime API. Images are processed at the back end and returned to the front display in the form of raster files for users to view the inversion results.
  • The PC client: This uses C# language to directly call the script file (py) written in Python language to complete the remote sensing image inversion function.
After SMNS inversion, the inversion results can be displayed symbolically with graded color using the hierarchical cartographic display sub-function and single-point or multi-point query of the inversion results can be carried out using the soil information query sub-function.

2.4.2. Data Analysis Mining

Spatial analysis is the quantitative study of geospatial phenomena. The conventional ability of spatial analysis is to manipulate spatial data into different forms and extract their underlying information. Superposition analysis is a very important spatial analysis function in GIS. It refers to the process of generating new data through a series of set operations on two data under the same spatial reference system [37].
This function mainly analyzes the spatial and temporal variation in the SMNS information obtained by inversion and obtains its spatial distribution characteristics and spatial and temporal variation characteristics. It mainly includes the following two aspects:
  • Spatial distribution analysis
A chart displayed the regional SMNS distribution and their spatial distribution characteristics. It mainly provides (1) statistical analysis, through a line chart of soil index information by region, including the lowest value, the highest value, the average value, the range, and the standard deviation of five indicators, and (2) grading analysis, where the area of each grade of the soil in the region and its proportion are assessed according to the soil index grading criteria and displayed by a bar graph to analyze the regional soil distribution.
2.
Analysis of spatial and temporal changes
On the basis of the remote sensing images of different periods, we use the function module of “intelligent inversion of SMNS” to obtain the main soil quality index information of different periods. Furthermore, we conduct a comparative analysis to analyze the spatial and temporal changes in soil quality information during the period and analyze its spatial and temporal variation characteristics.
The above two functions have the same implementation principle. The spatial analysis function in Geoscene Pro is released as a GP service through the model builder, and the Web client and the mobile app can be invoked in the same way as explained in Section 3.3.1 to complete the statistical analysis of the raster map after inversion. At the same time, the open-source chart library (Web client: jqPlot; mobile app: MPAndroidChart) is called to display the analysis result data in the form of a table in the front end. The PC client analyzes the inversion results directly through the spatial analysis function and displays them as charts.

2.4.3. Management of Quantitative Inversion Models

This function enables users to conveniently manage and customize the remote sensing inversion model for soil quality information by selecting, adding, modifying, and deleting models. The platform uploads the existing quantitative remote sensing inversion model of soil quality information to the backend server. To achieve fast and intelligent analysis of regional soil quality information, users can select and modify the existing remote sensing inversion model according to the regional reality (Figure 1).
Specific implementation and operation: The web client and the mobile app submit model information through the system. The backend administrator will construct the processing model after accepting the information, upload the GP service, and authorize the user to select and use the model. The PC client can customize the model by modifying the parameters of the model.

2.5. Application of Case

In order to verify its effectiveness, the cloud platform was used to obtain the distribution of soil organic matter in southwest Shandong and analyze the soil organic matter in each district. At the same time, the platform results are validated by comparison with the results of the interpolation analysis.
The cloud platform was used to obtain spring and autumn soil salinity in Kenli district and analyze its spatio-temporal variability and spatial distribution.

3. Results

3.1. Platform Architecture

According to the platform design methodology in Section 2.1, a SMNS intelligent analysis cloud platform is designed, which has three layers of structure: data layer, service layer, and user layer. Additionally, a three-layer application platform is designed for this platform: PC client, Web client, and Mobile app. Figure 2 shows the platform architecture.
In the three-tier application platform, the PC client adopts C/S (Client/Server) architecture, which is realized through C# programming language based on ArcGIS Engine software development. The Web client and the mobile app are based on the ArcGIS server and use a browser/server (B/S) architecture.
The three platform clients can share a set of quantitative remote sensing models, and the Web client and the mobile app can share a set of servers and databases. The backend server will operate according to the instruction after the user gives the command on the front end, which can reduce the waste of computer resources and the threshold of using hardware equipment on the client side. Meanwhile, the PC client can use the local database or access the cloud to retrieve data.

3.1.1. The Data Layer

The data layer includes a spatial database and an attribute database, which are used to store and manage spatial data and attribute data. The spatial data management technology of Arc SDE+SQL Server is used to analyze and classify the data, and the database framework is designed. The basic geographic data and attribute data based on the Geodatabase model are stored in the SQL Server database by the ArcSDE database engine.

3.1.2. The Service Layer

The services layer is used for data processing and analysis. Data access and invocation between the service layer and the data layer are completed by ADO.NET (Active Data Objects.NET) and ArcSDE.
In the service layer, ArcGIS server is used as GIS server and IIS (Internet Information Server) server is used as network server. The models of Remote sensing SMNS inversion and spatial analysis are stored in ArcGIS Server as GP services to meet the client’s demand for SMNS information acquisition and analysis.

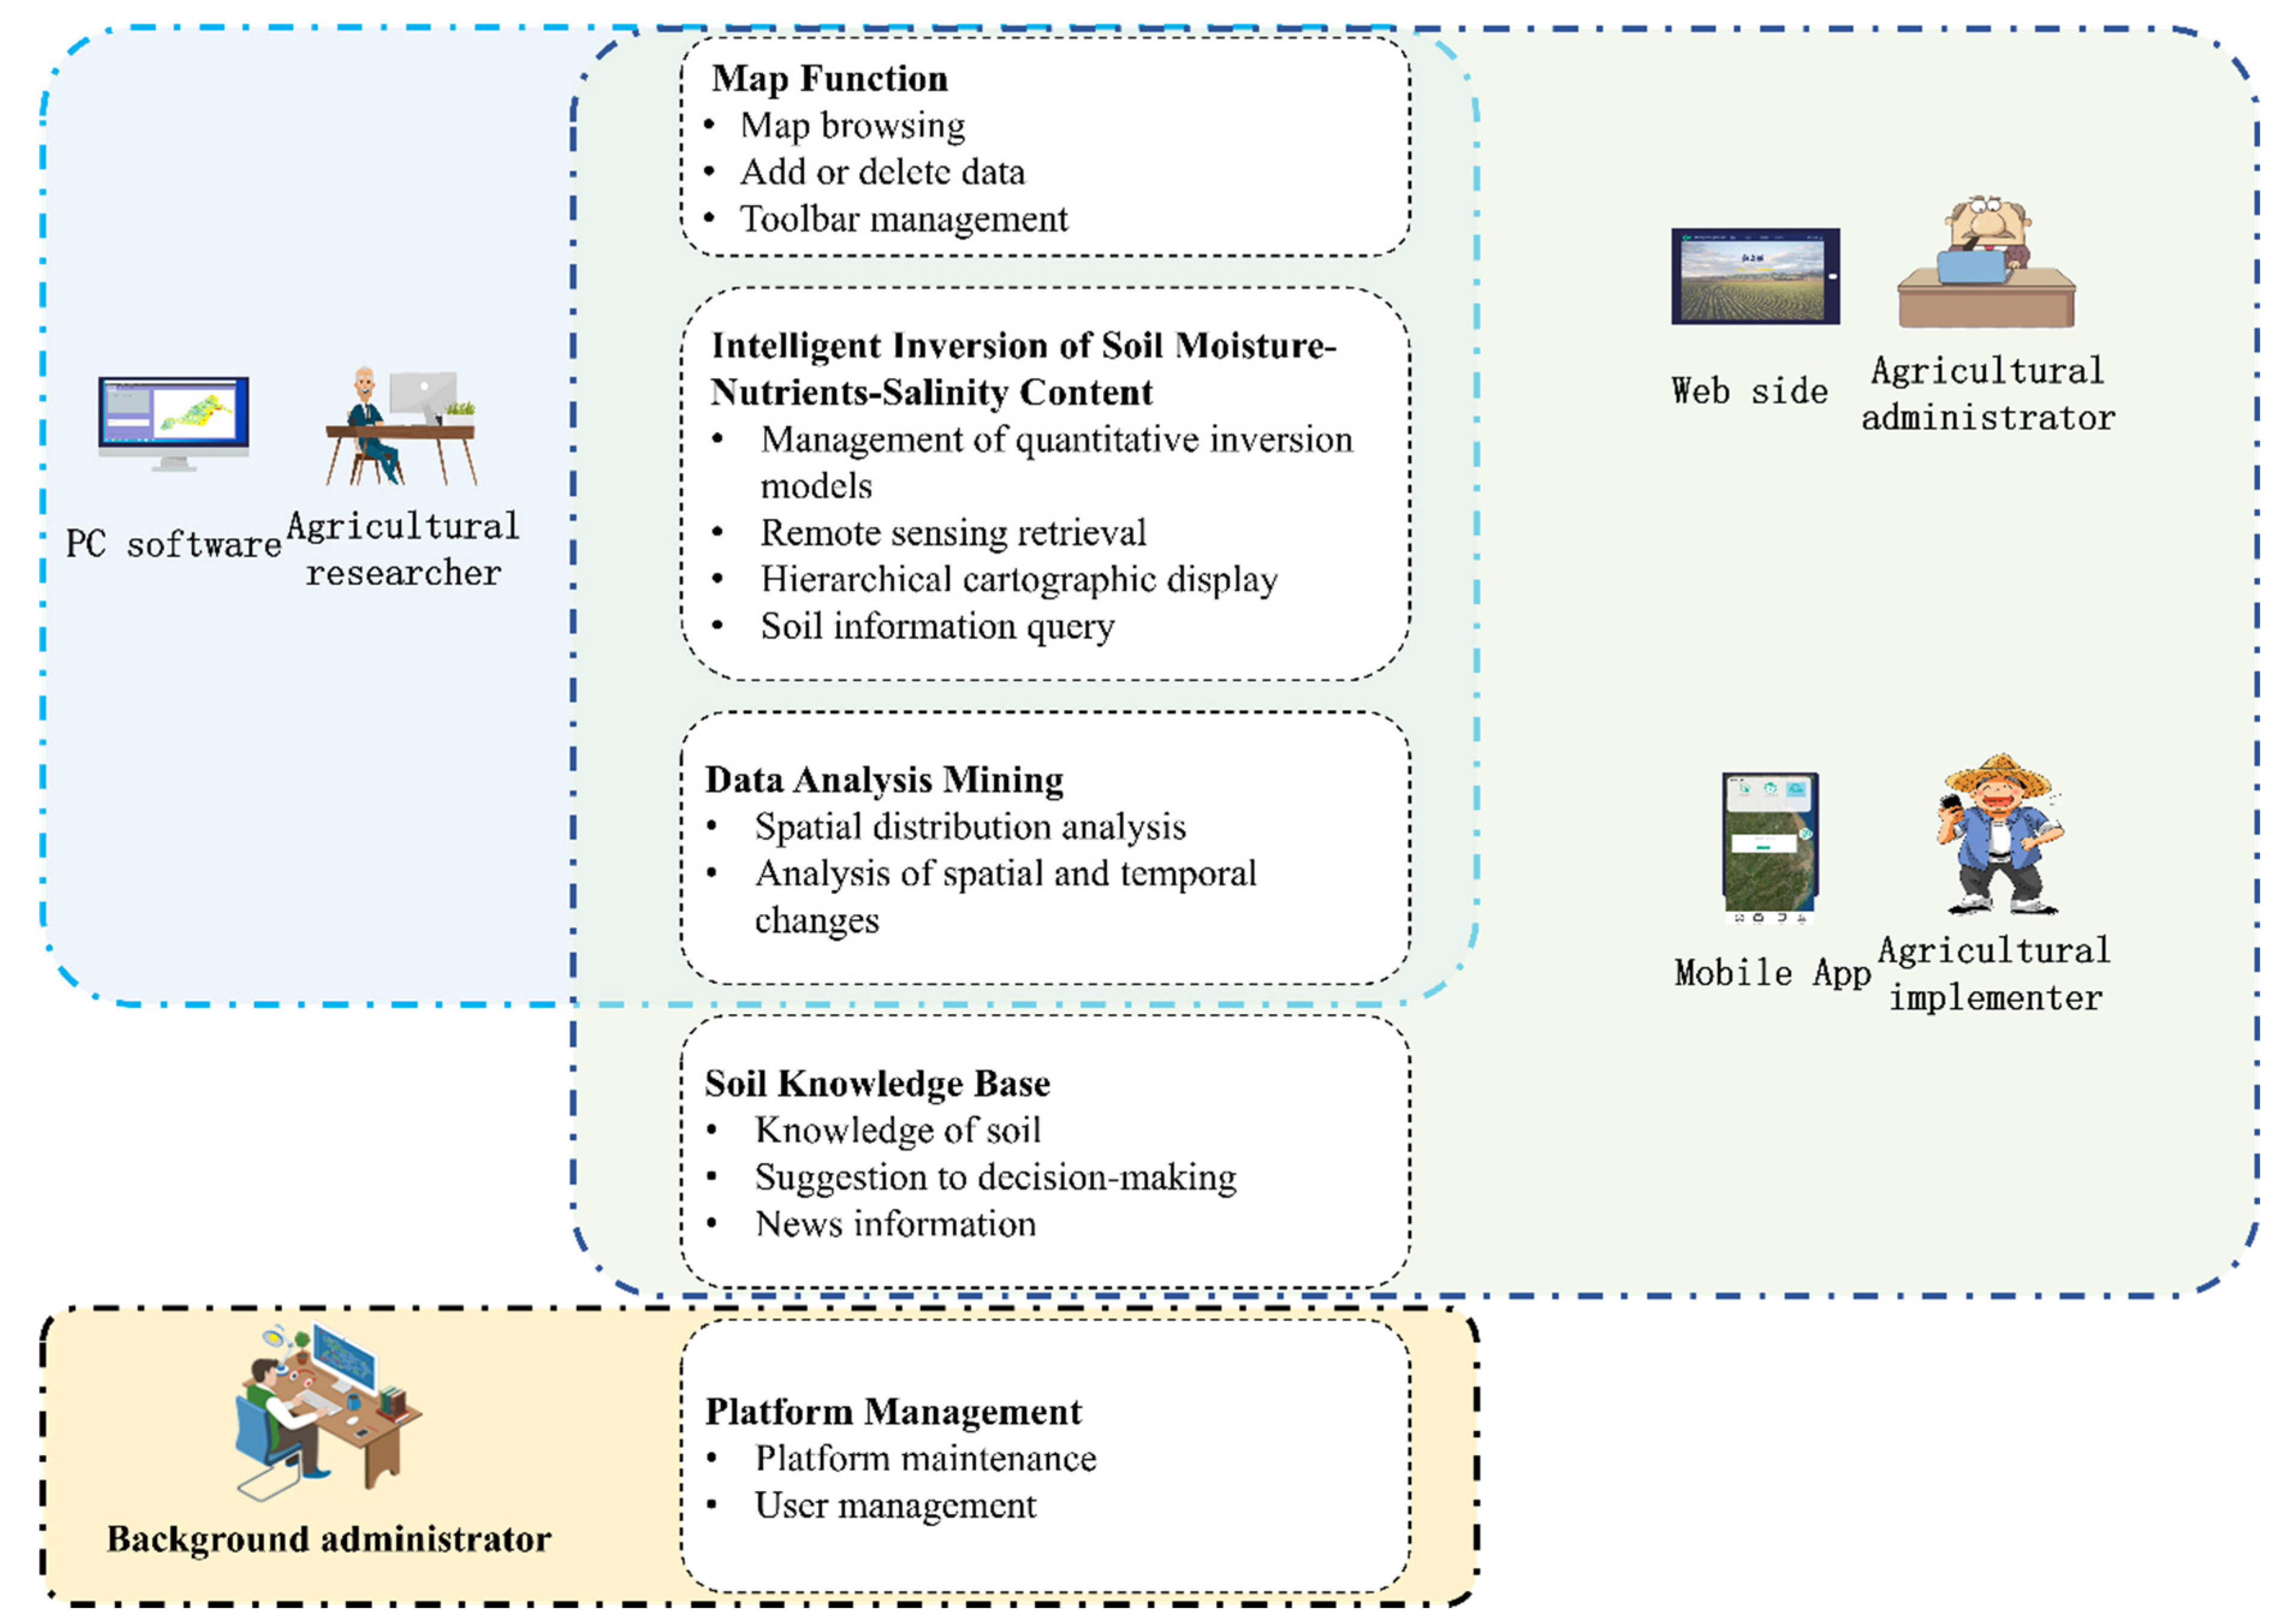
3.1.3. The User Layer

The user layer contains four types of users: Farmers, agricultural administrators, agricultural researchers, and background administrators.
The PC client has powerful data storage capability in three different clients and supports offline functions, which agricultural researchers can use. The Web client has a large interface that displays soil maps of large areas and supports distributed sharing. Additionally, users can perform operations through the browser. Therefore, the Web client can meet the needs of agricultural managers. The mobile app is portable. As such, they are designed for farmers to understand the soil quality of their plots and gain agricultural knowledge at all times.

3.2. Platform Functions

For regional soil quality information analysis, five functional modules are designed: map function, intelligent inversion of SMNS, data analysis mining, soil knowledge base, and platform management (Figure 3). For the PC client, we designed and implemented the map function. The Web client and mobile APP are aimed at agricultural managers and farmers. Therefore, we have added the function of soil knowledge base to the PC side, which can view the soil knowledge stored in the database online.

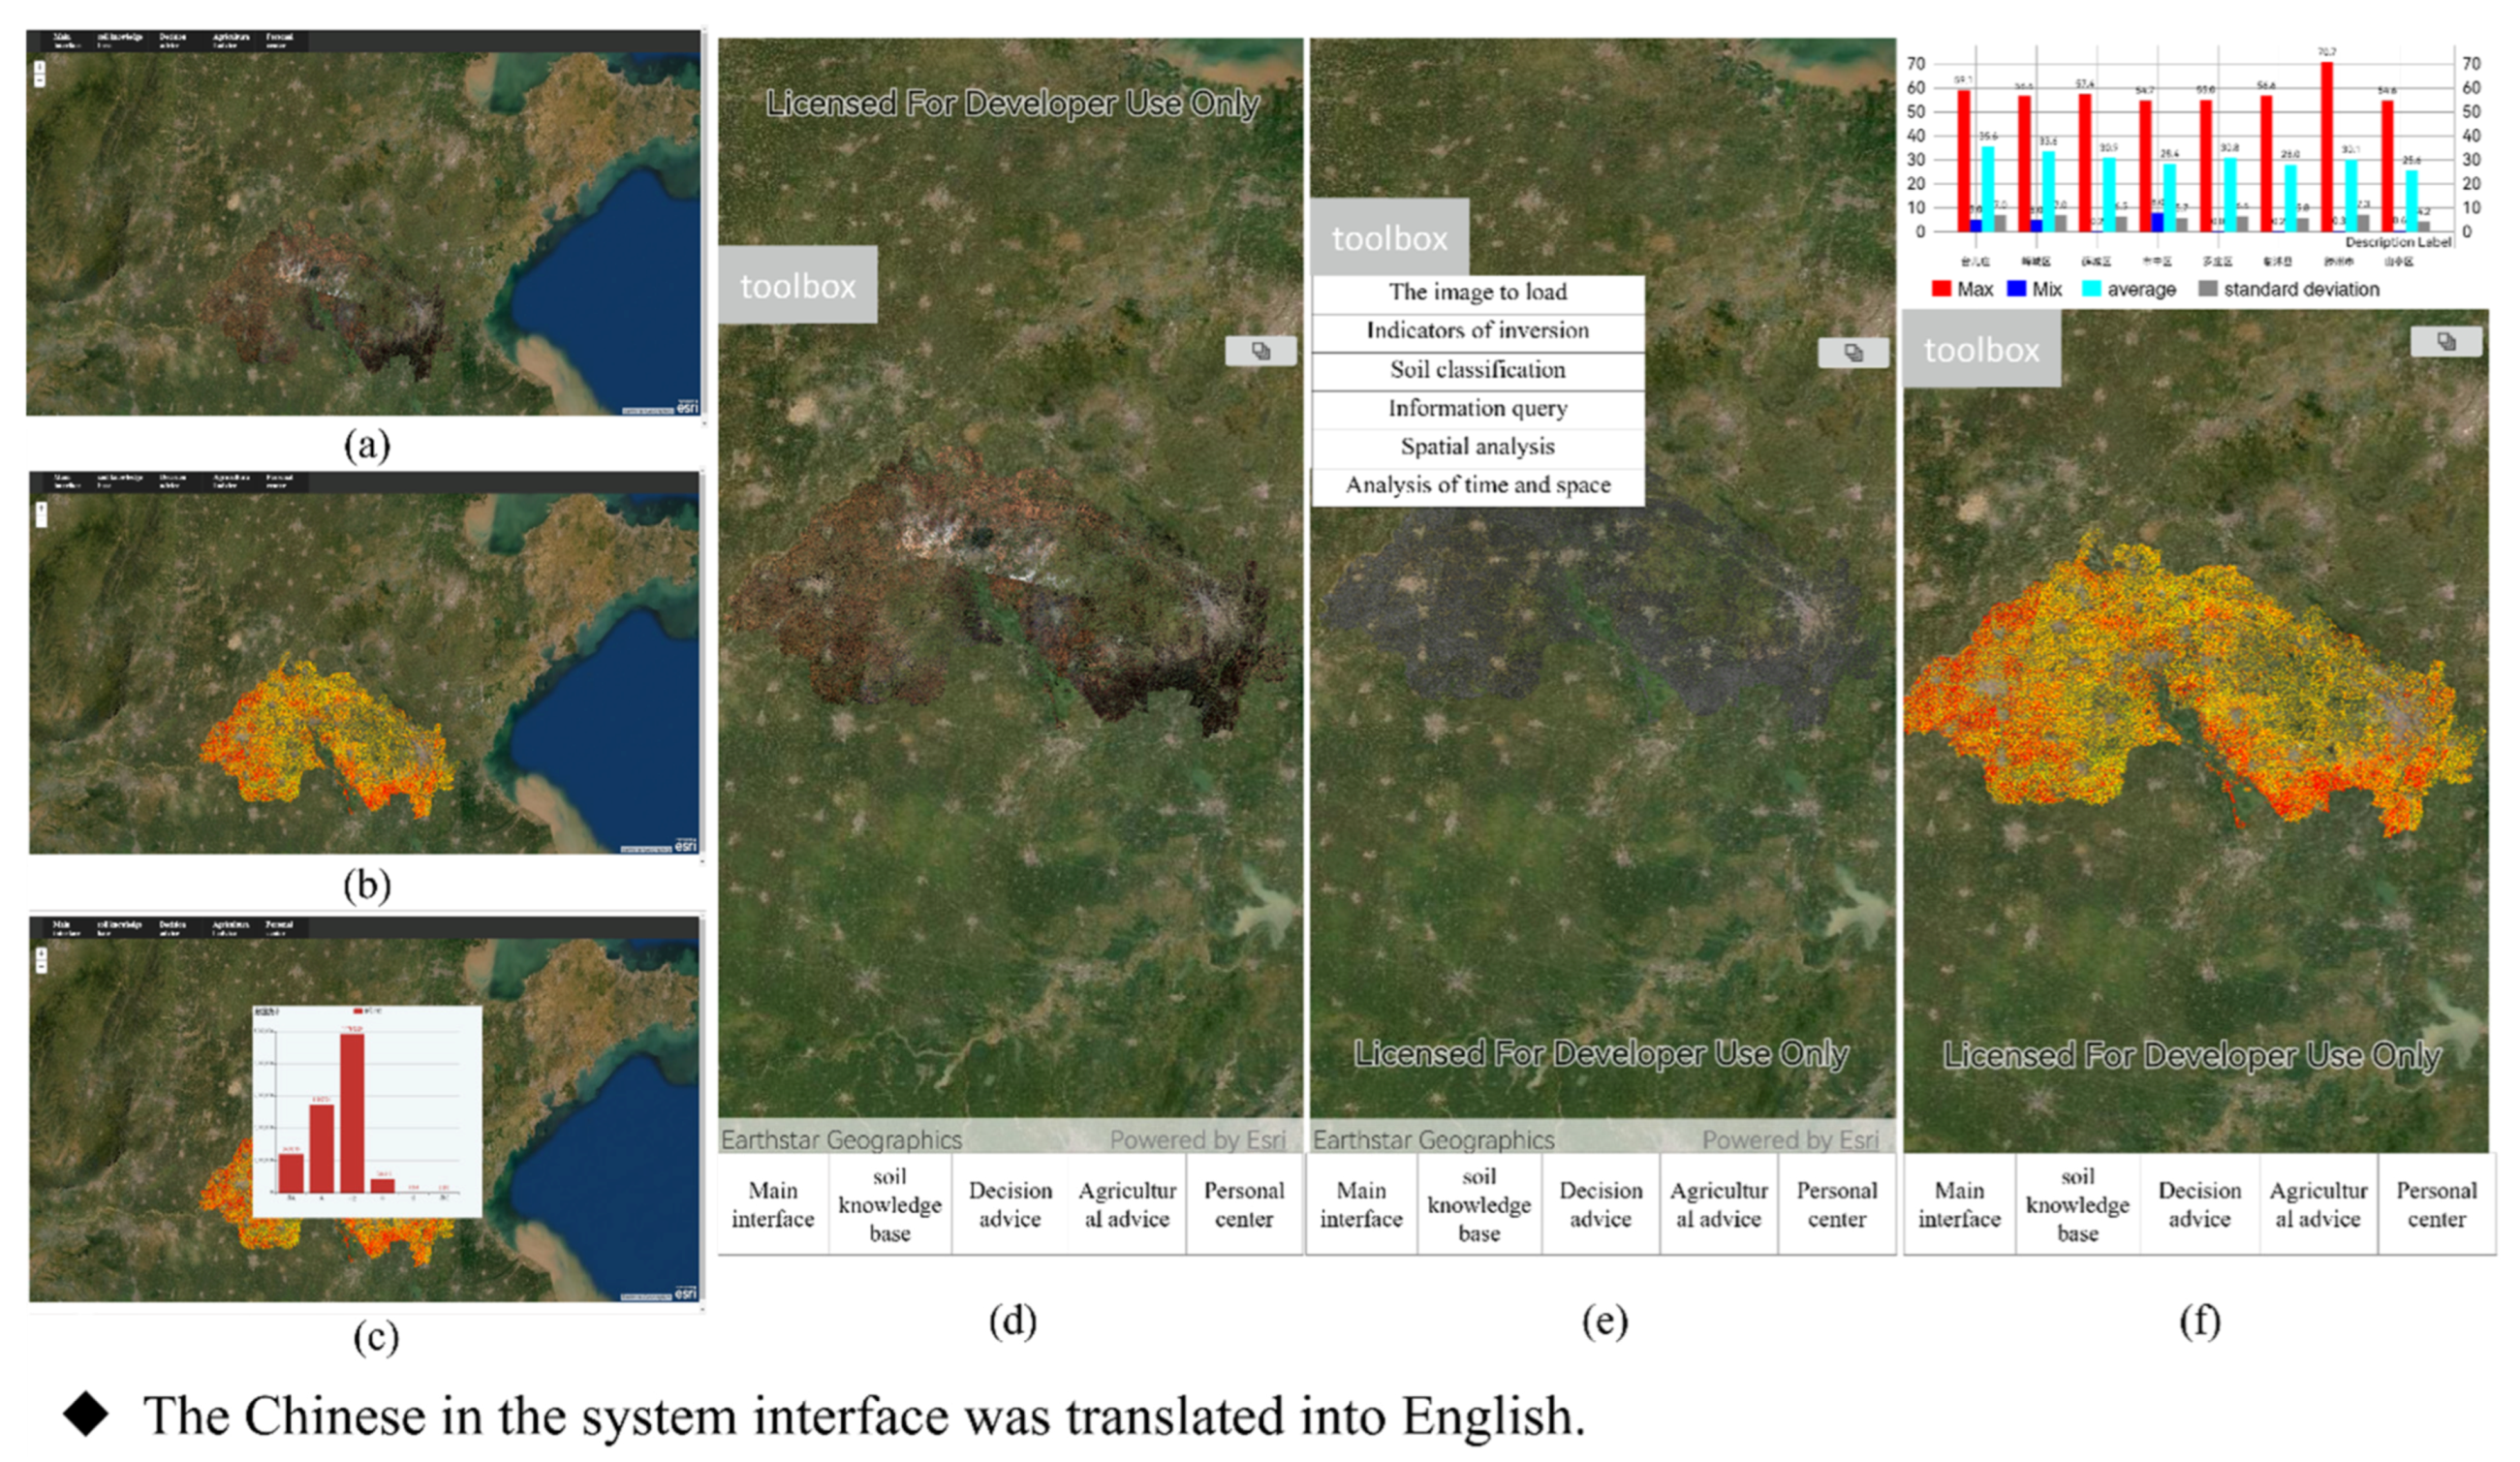
3.2.1. Map Function Module

This module is used to manage, browse and edit map data. It can provide the client with the function of browsing map and adding and deleting remote sensing images data from the database or local. It is also possible to create and vector layers data via the toolbar.

3.2.2. Intelligent Inversion of SMNS Module

The module is responsible for the acquisition and mapping of SMNS information. It includes the functions of the management of quantitative inversion models, remote sensing retrieval, hierarchical cartographic display, and soil information query. The functions of management of quantitative inversion models can add, delete, and modify SMNS models stored in the server. The function of remote sensing inversion calls the quantitative remote sensing inversion model of SMNS in ArcGIS Server, and then realizes the quantitative remote sensing inversion of soil indexes. In this process, the users can choose the appropriate model according to their own needs. The function of hierarchical cartographic display enables SMNS raster data to be displayed according to hierarchical standards. The function of soil information query.

3.2.3. Data Analysis and Mining Module

This module is used to analyze regional SMNS content information. The data analysis and mining module is used to analyze the spatio-temporal dynamics of soil quality information inversion data, including spatial distribution analysis and spatio-temporal change analysis.

3.2.4. Soil Knowledge Base Module

This module is mainly used for users to learn knowledge, including soil knowledge, decision suggestions, news, and other data. It has two parts: Decision suggestions and information. The former can provide different suggestions according to different soil, water, and fertilizer indexes to provide fertilization guidance, enable the user to take salinity control measures, etc. The latter can release agricultural information from the background so that the user can gain more agricultural knowledge.

3.2.5. Platform Management Module

This module is used to manage the whole platform and maintain user rights. It allows the administrator to manage users, the knowledge base, and the agricultural information and provide guidance and advice. Managing user information includes managing personal information and user rights. The knowledge base contains attribute field information, linking matching inversion results and related knowledge for user reference. Agricultural information includes the latest agricultural progress and crop- and soil-related news, which the administrator updates and deletes through the website.

3.3. Application Cases

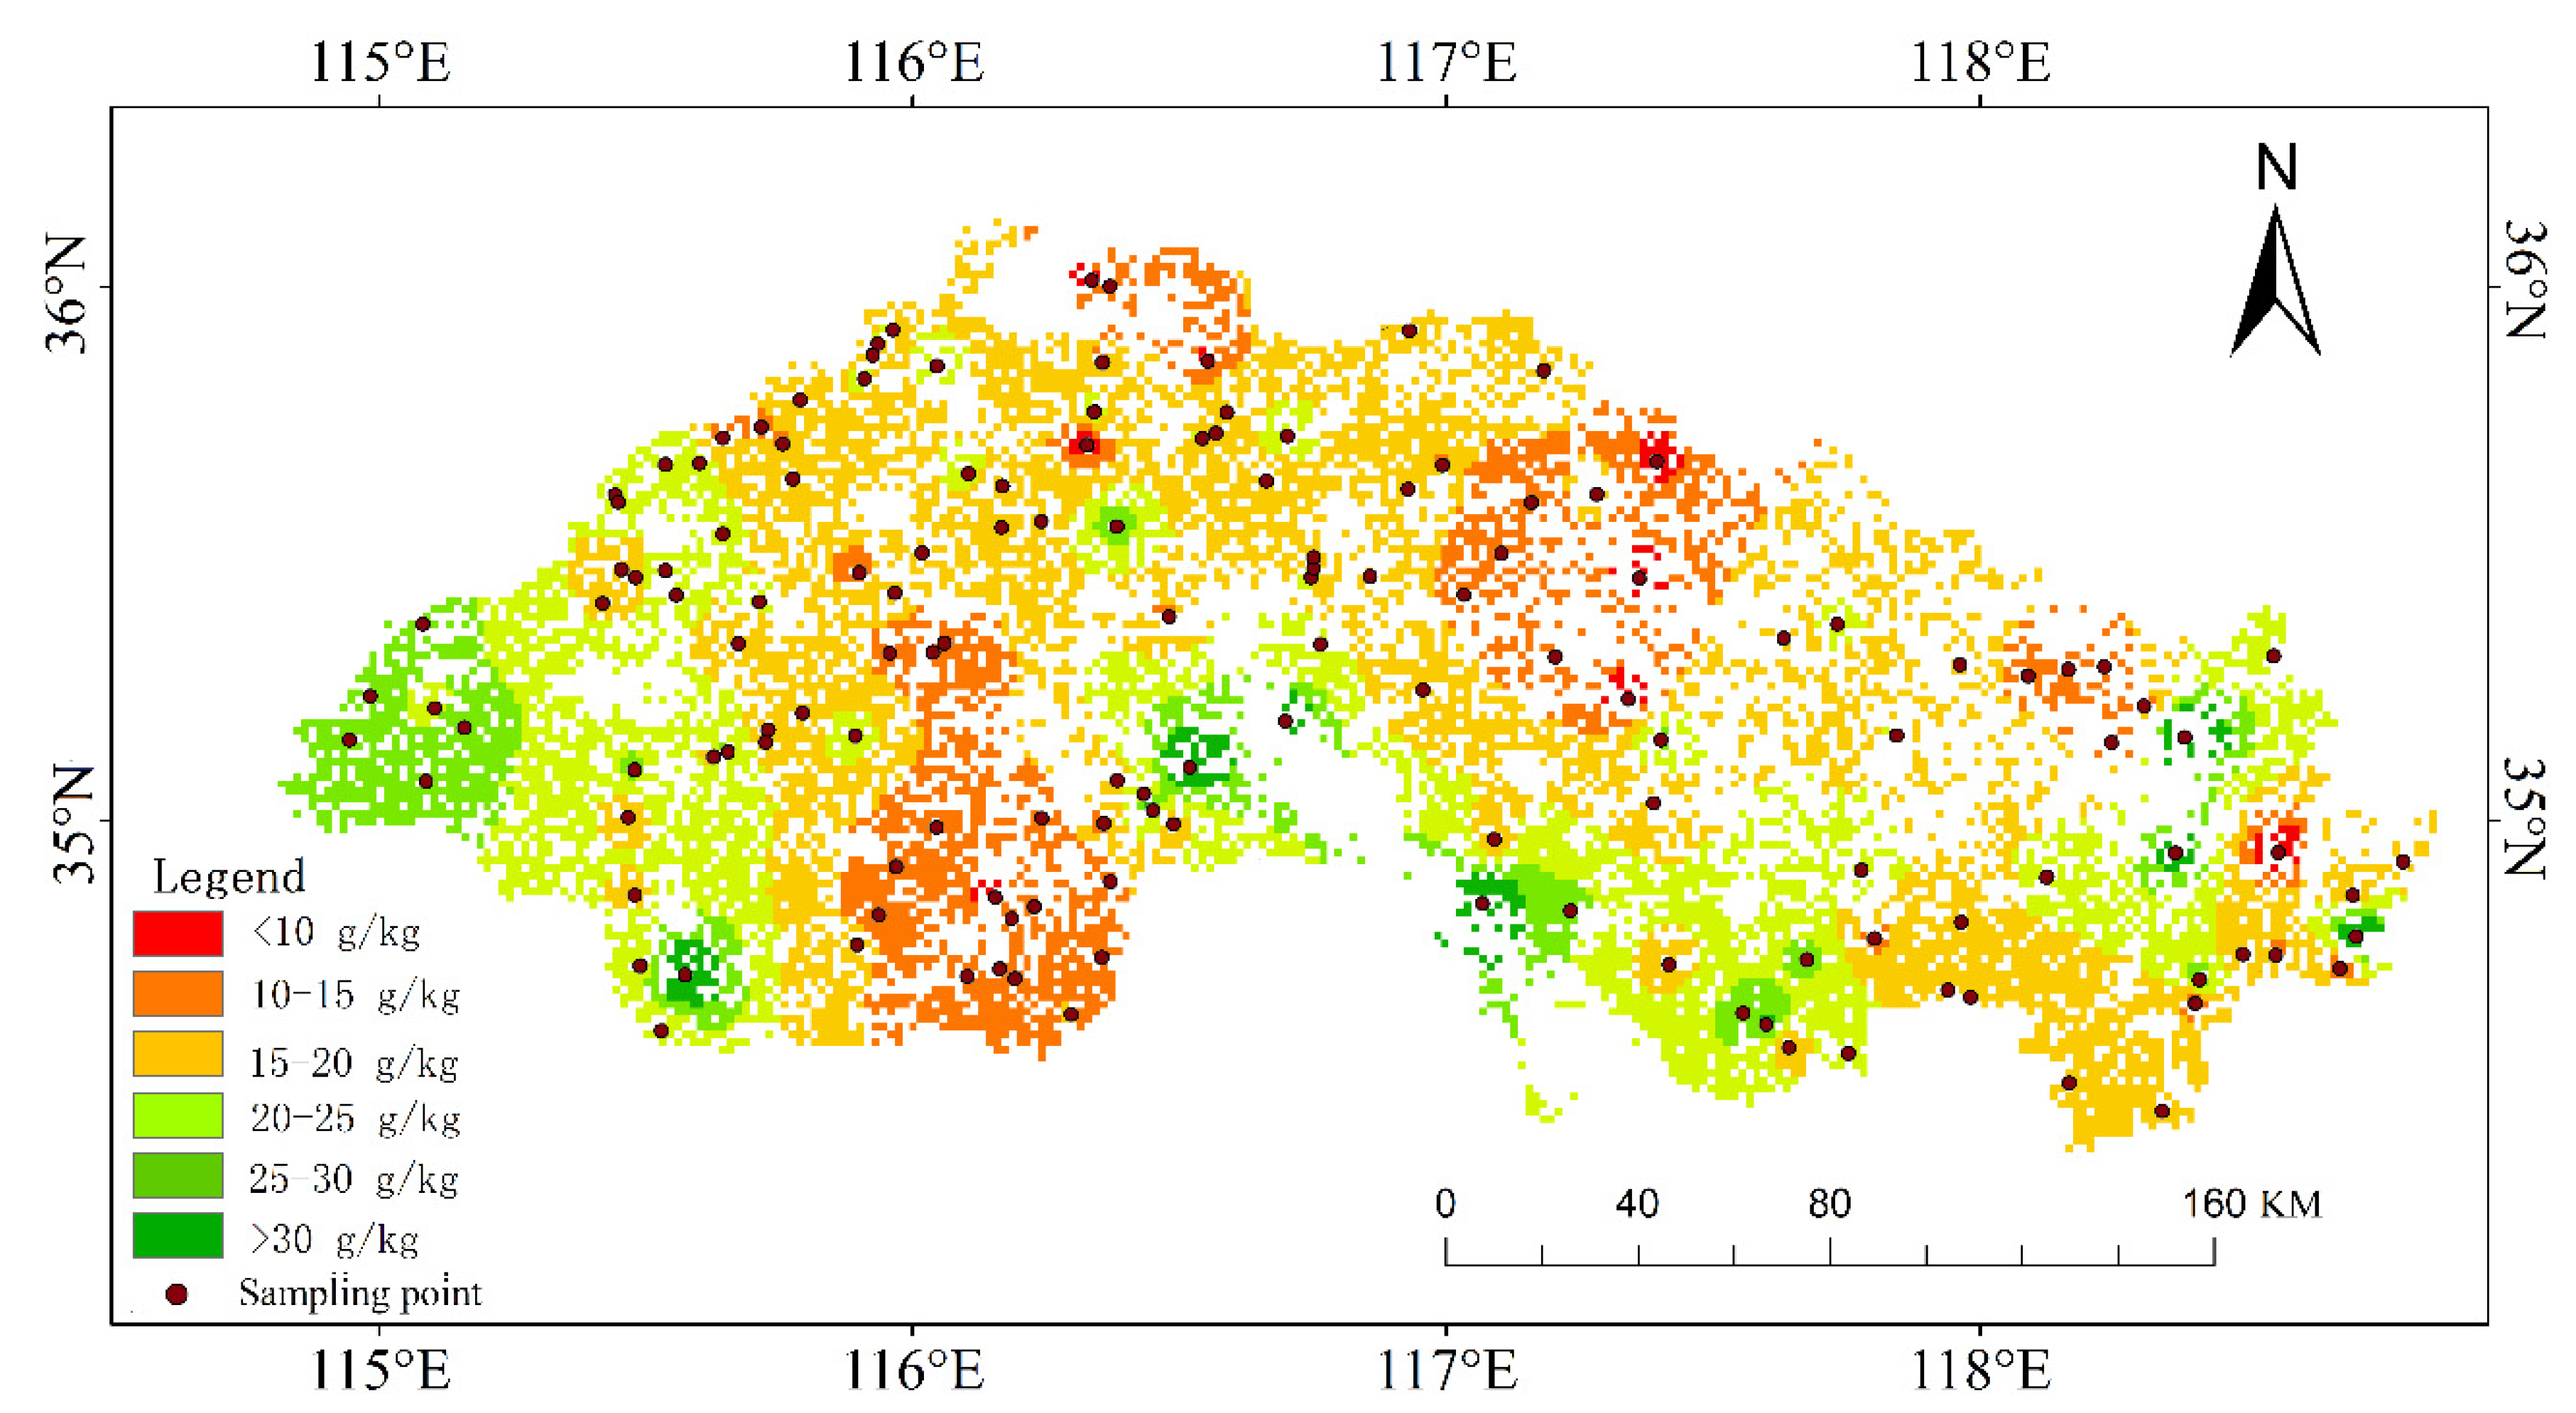
3.3.1. Intelligent Inversion and Spatial Distribution Analysis of Soil Organic Matter in Southwestern Shandong Province, China

Objective: The southwest of Shandong Province, China, is located in the Huang-Huai-hai Plain. Its agricultural production mainly involves dryland farming, interspersed with a small number of paddy fields. It is an important production area for grain crops in China, known as the “granary” [38]. Soil organic matter is an important part of soil solid matter that can provide nutrients needed by plants, and its content is also an important index to measure soil fertility [39,40]. Rapid, non-destructive, and low-cost online monitoring of soil organic matter is of great significance for accurate farmland management and planning, especially in the southwest of Shandong Province, China. Therefore, the southwest of Shandong Province was selected as an example to apply the platform to realize qualitative inversion and quickly analyze soil organic matter content in a big region.
Data source: We selected and downloaded eight images of the Sentinel-2A MSI L1C level on 27 September 2017, through the official website of the European Space Agency (ESA) (this level of image eliminates the need for orthorectification and geometric correction) [14]. Radiometric calibration, atmospheric correction, and other pre-processing operations were carried out, and then the images were uploaded to the spatial database. In order to verify the inversion effect of the platform and obtain the field data from September 27 to 4 October 2017, a total of 141 soil samples were collected within the study area by using the five-point sampling method through the handheld global positioning system (Figure 2). The sampling points were distributed evenly in the study area, and the sampling depth was 0~15 cm in the soil layer where organic matter was mainly concentrated. Potassium dichromate volumetric method was used to measure soil organic matter content to obtain organic matter sample points in the study area.
Implementation Process: The users selected the image from the client list and sent the instructions to the back end. The back end invoked the data and returned the data to the front-end loading display. The users then selected the soil organic matter inversion model of the southwestern province of Shandong from the client. The backend server performed a raster calculation and returned the result to be displayed on the front end. After that, users could select appropriate grading standards according to their needs and show the soil grading map. Finally, soil information could be analyzed and mined to analyze its spatial distribution.
The analysis process was carried out in the background of the system, and the map/table was displayed on the front-end client. At any time, users could click the raster image to query the inversion result of a specific position.
The inverse distance interpolation analysis of 141 soil organic matter samples in the test area was carried out to obtain the soil organic matter interpolation map in the study area. The results of inversion, interpolation and sample data are compared to verify the effectiveness of the platform.
Results and Verification: As shown in Figure 4 and Table 1, the overall organic content of the study area was high, ranging from 2.87 to 43.4 g/kg, with an average value of 20.12 g/kg.
Interpolation analysis (Figure 5) was carried out based on the inverse distance weighting method. The interpolated SOM content in this area was between 3.42–47.3 g/kg (average 22.17 g/kg). It mainly distributed in the range of 10–25 g/kg, accounting for 88.4% of the total, the range of 15–20 g/kg, accounted for 45.1%. To further verify the effect of inversion, the proportions of inversion map, interpolation map and sample data at all levels in the study area were compared (Table 2). As can be seen from the figure, except for the range of 10–20 g/kg, the proportion of soil organic matter content in each classification is similar. In the range of 10–20 g/kg, the inversion results are closer to the original sample data.
According to the spatial distribution, the organic matter content of the southwest and southeast of the study and the basin around Weishan Lake was higher. In comparison, the organic matter content of the mountainous eastern regions was lower, and the inversion results are more consistent with the actual situation. Based on the inversion and analysis results, agricultural managers can assist in decision making, such as actively promoting the application of more organic fertilizers and returning crop straw to the fields in areas with low organic matter content.
Advantage: The southwest of Shandong Province, China, have 26 counties, making it a large region. The existing studies mainly focus on the analysis of soil organic matter at the county level. However, to the agricultural managers, soil organic matter analysis on a large regional scale is more meaningful and can help them formulate agricultural production and management practices.

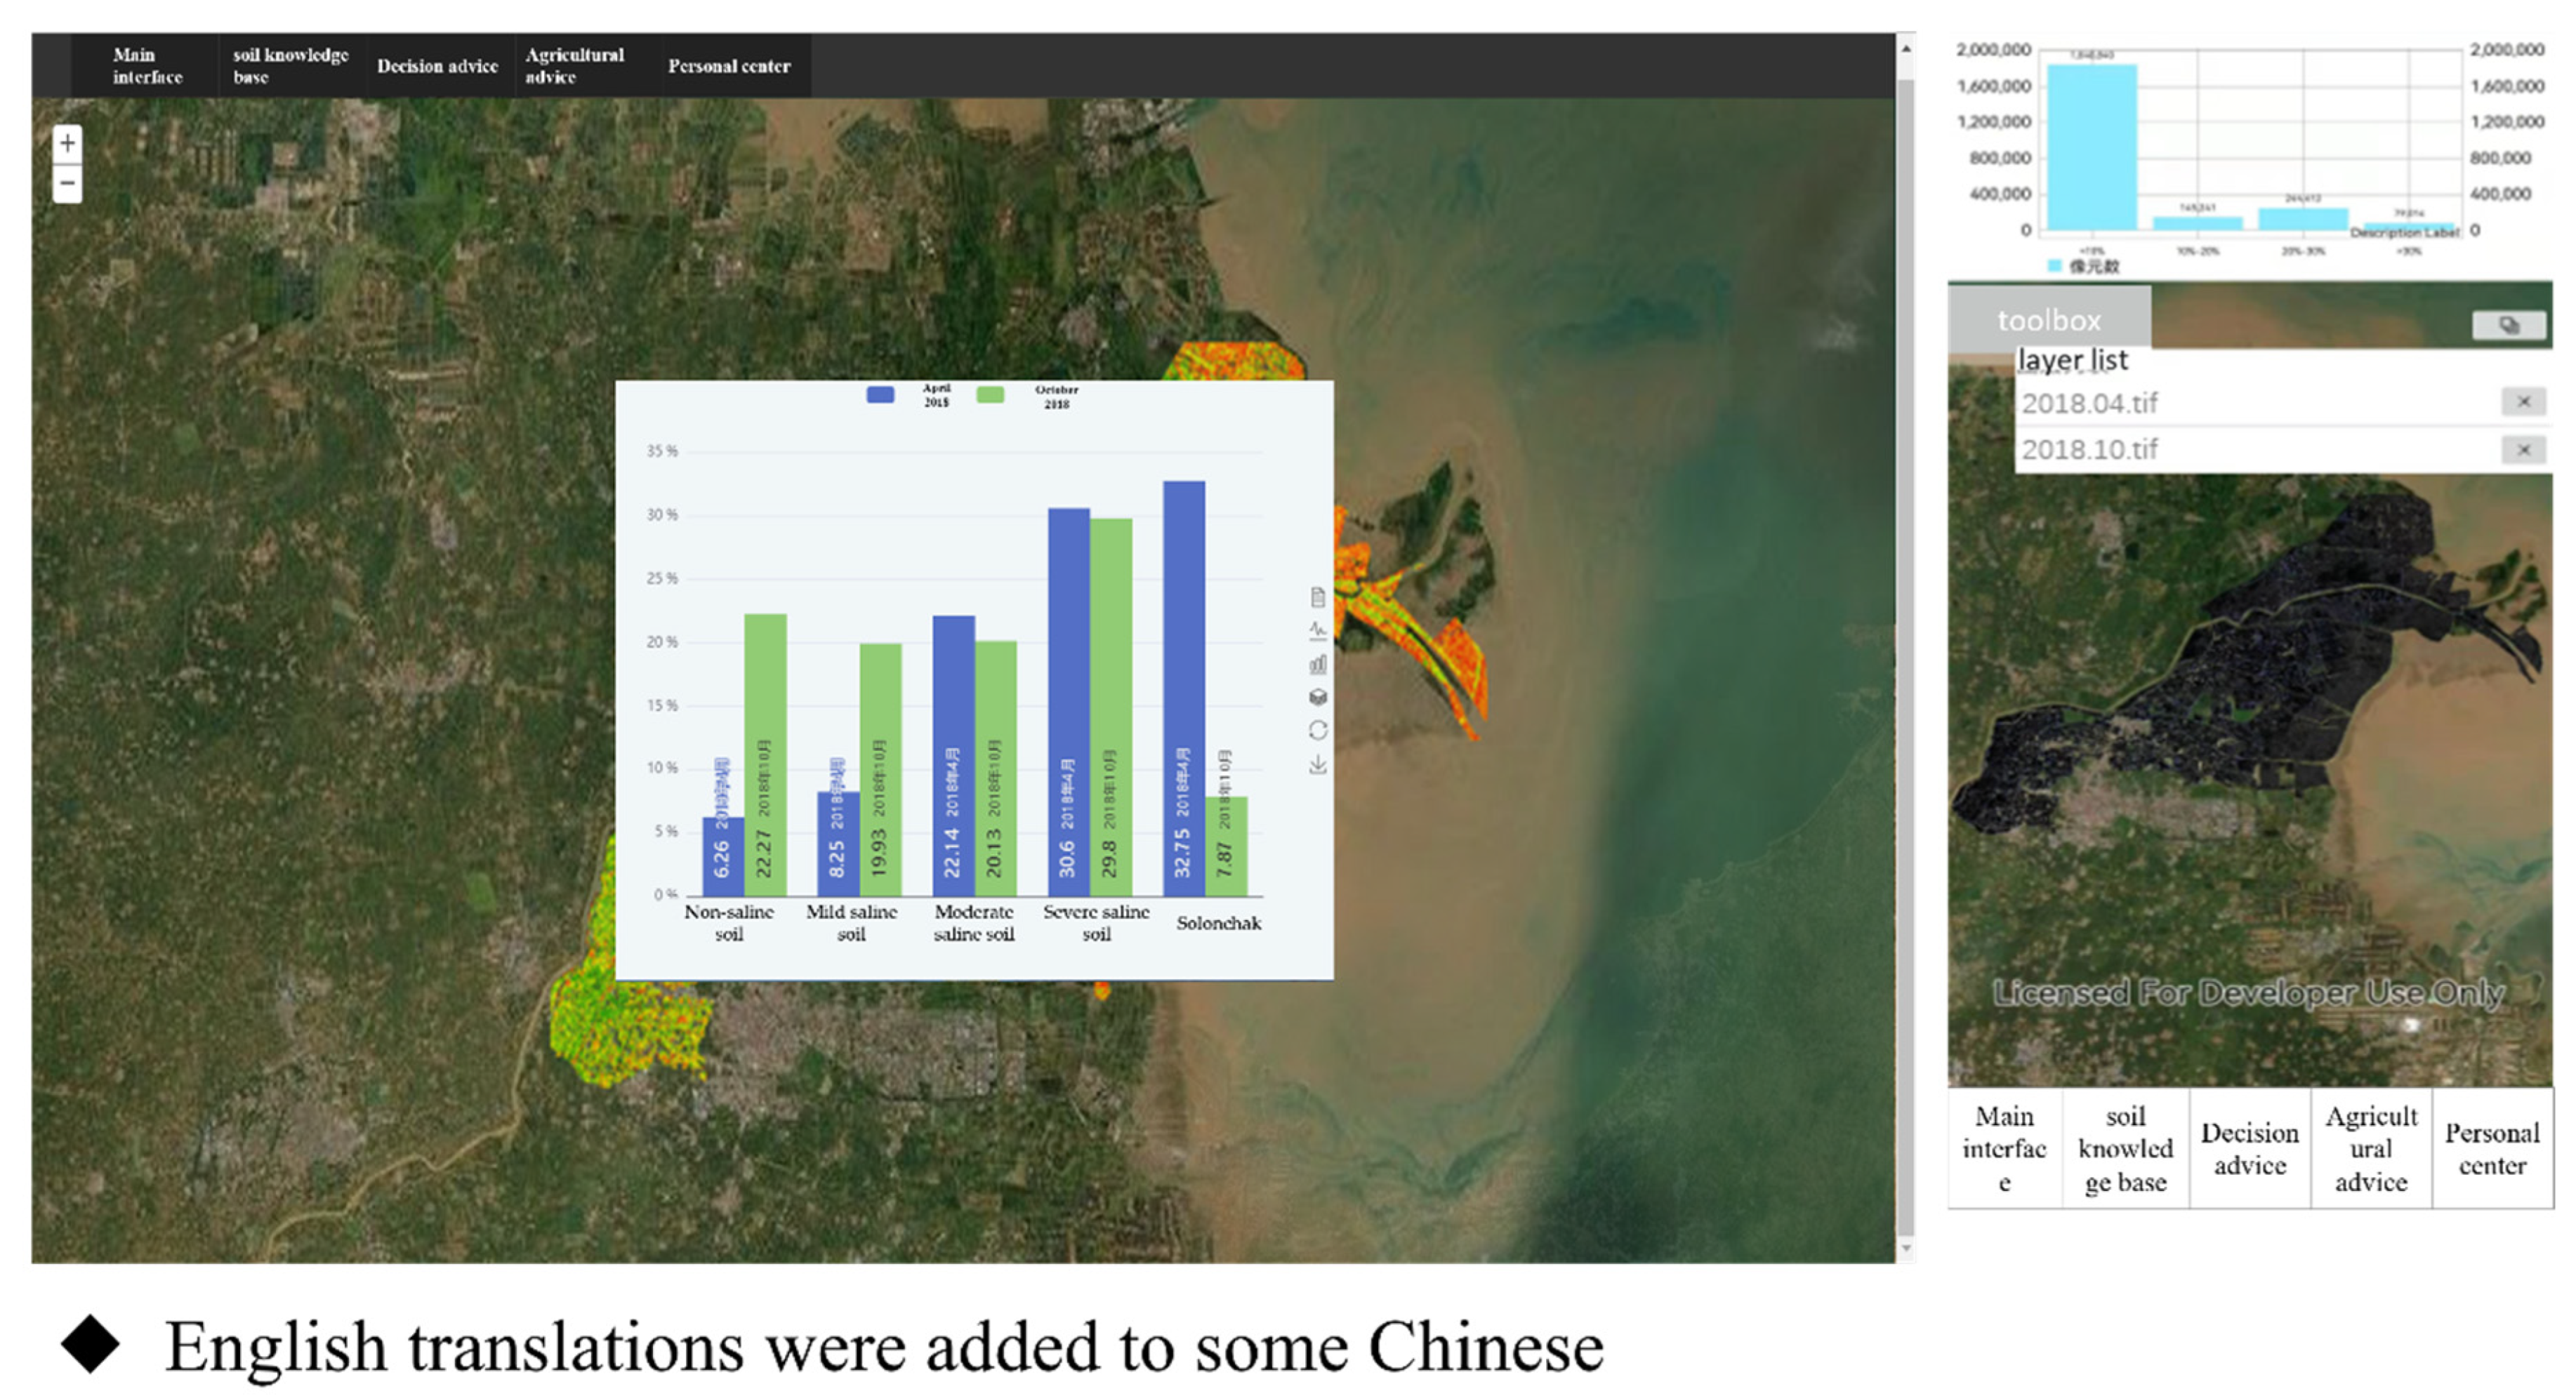
3.3.2. Inversion and Temporal-Spatial Change Analysis of Soil Salinity in Kenli District, Yellow River Delta

Objective: Soil salinization is a major land degradation problem in most arid and semi-arid agricultural areas in the world, seriously restricting regional ecological agriculture [13]. Located at the mouth of the Yellow River in China, Kenli District suffers from low yield from farmlands due to soil salinization, hindering the development of the regional social economy and leading to the degradation of the ecological environment [41,42]. Therefore, this paper took the Kenli District as an example to apply the platform to achieve the inversion and spatio-temporal analysis of soil salinity.
Data source: We selected Sentinel-2A MSI L1C level image data of 27 April 2018, and 4 October 2018 from Kenli District, Dongying City, and processed these as described in Section 3.2.1.
Implementation Process: Remote sensing images of two-time phases for salt inversion and spatial distribution analysis were acquired; the operation was the same as that described in Section 3.2.1. On the basis of the inversion results of two-time steps, the GP service of spatial and temporal variation analysis of the backend server was invoked for spatial and temporal variation analysis of soil salt between the two-time phases. The processing results were returned to the client in the form of a table.
Results: Taking April 2018 as an example, Figure 6 and Table 3 show that soil salinity was low in the southwestern part of the study area and higher in the northeastern region and the salinity values showed a trend of gradual increase from inland to coastal. Of the whole study area, 32.75% had saline soils, 52.74% had medium to heavy saline soils, 8.25% had light saline soils, and 6.26% had non-saline soils, which shows that soil salinization is common and severe in the whole study area, in line with the actual situation.
Figure 7 and Table 4 show the temporal and spatial variations. The percentage of saline soils decreased significantly in October 2018 compared to April (from 32.75% to 7.87%). The percentage of non-saline and lightly saline soils increased, showing an overall decrease in salinity. This is mainly due to rainfall, light evaporation, spring ploughing, and autumn harvesting. The rainy season ended in early October, evaporation was weak, and most of the irrigation was just before sowing, so the salinity was subjected to heavy downward movement of leaching and light upward movement of returning salts, which resulted in lower salt values in the surface soil.
Advantage: On the one hand, when the cloud platform is used to monitor the soil salt content, it only needs to import the corresponding remote sensing image into the database at a specific time point so that soil salinity data can be acquired online quickly and accurately. On the other hand, various soil salinization monitoring models are often different due to different causes. This platform provides model customization function, which can meet the monitoring needs of soil salinization in different regions.
On the whole, the platform responded promptly; data loading, model calls, analysis, and processing were performed smoothly; and the operation was accurate. The platform enables systematization and the acquisition of intelligent SMNS information for remote sensing inversion, helping farmers, agricultural managers, and agricultural researchers in auxiliary decision-making.

4. Discussion

  • The technology of analyzing soil quality information based on quantitative remote sensing inversion is mature and can objectively present accurate regional soil quality index information quickly and in real time [9,10,11,12,13,14,15,16]. Many quantitative remote sensing models for soil quality information have been developed worldwide. For example, Guo et al. constructed a quantitative remote sensing prognostic model for storing information on organic carbon and its associated soil properties (organic carbon and soil bulk density) and a collaborative validation strategy evaluated the spatial distribution of the soil map. The results are consistent with the facts [15]. Wang et al. used machine learning to construct a quantitative remote sensing inversion model of soil salinity using gray correlation analysis based on Sentinel-2A MSI data [16]. The group also carried out related research and constructed many quantitative remote sensing inversion models for soil. Wei et al. studied the remote sensing inversion model for organic matter in the southwestern part of Shandong Province based on Sentinel-2A MSI images and obtained good inversion results [12]. To construct the inversion model of soil salinity in the Kenli district, Ma et al. used a numerical regression method for spectral index fusion based on UAV and Sentinel-2A [13]. It can be seen that, with the development of remote sensing technology, inversion using remote sensing data has become the primary way to obtain regional soil quality information quickly and will be a research hotspot in the future. Therefore, in this paper, quantitative remote sensing inversion technology is selected as the SMNS content analysis method that can meet the requirements of a cloud platform for intelligent analysis of SMNS by rapidly acquiring accurate regional soil quality information. Compared with monitoring based on the combination of monitoring points and geostatistical analysis, this method is far less in terms of cost and effectively avoids the impacts of easy destruction of monitoring points.
  • In system application platform and function design.
Compared to the existing research [26,27,28,43,44], the cloud platform designed a soil quality information analysis system for three types of users, including farmers, agricultural managers and agricultural researchers. The system design has three layers of data layer, service layer, application layer design and three clients (The PC client, The Web client, The mobile APP), which can meet the needs of three types of users in different application scenarios. The application cases show that the platform has more accurate calculation results and better operation efficiency. In the aspect of functional design, the traditional GIS analysis function and RS image processing function are combined to achieve a soil quality information analysis system integrating soil quality information acquisition, regional analysis and decision. In the aspect of functional design, the traditional GIS analysis function and RS image processing function are combined to achieve a soil quality information analysis system integrating soil quality information acquisition, regional analysis and decision.
In the aspect of functional design, the traditional GIS analysis function and RS image processing function are combined to achieve a soil quality information analysis system integrating soil quality information acquisition, regional analysis and decision.
In terms of spatial distribution analysis, the platform can form regional statistical analysis tables and distribution maps of soil quality information, which can be used to evaluate regional soil quality and then formulate targeted management measures and governance measures. In terms of spatio-temporal change analysis, it can analyze the proportion of soil quantity in different grades from the perspective of time and monitor the change in soil quality in the time period to allow the user to re-evaluate and take specific and timely measures. Due to the relationship of time, our case only uses SMNS intelligent analysis cloud platform to analyze the spatio-temporal changes in data in two-time stages. However, the platform can also be used to analyze spatial and temporal changes in the target area if that is what the user requires.
The cloud platform of SMNS can meet the common needs of these three types of users for regional and quick analysis of SMNS. However, some specialized requirements need to be further developed, such as agricultural researchers’ need for in-depth data analysis and mining function.
3.
From the aspect of analysis index of the system, remote sensing has been the main tool for soil quantitative analysis till now, and scientists all over the world have established many quantitative soil remote sensing inversion models. Because SMNS is an important part of soil quality information, the system is developed and tested based on SMNS. In practical application, different soil indexes use different models and there are some differences in the models across regions. Therefore, the platform supports model modification, which is not limited to the SMNS quantitative remote sensing provided by us but can also use other quantitative remote sensing inversion models in the platform according to user requirements, which will expand the platform’s application area infinitely.

5. Conclusions

This paper combines 3S technology, Internet technology, and mobile communication technology to build a cloud platform for intelligent analysis of SMNS. The results show that:
  • Based on the quantitative remote sensing inversion model, the SMNC cloud platform enables fast collection and analysis of regional soil quality information. Taking the spatial distribution analysis of soil organic matter in southwest Shandong province as an example, the results of cloud platform inversion are basically consistent with the measured sample points and interpolation analysis, and the results in the range of 10–20 g/kg are significantly higher than the interpolation analysis.
  • The three-layer client design can simultaneously meet the needs of farmers, agricultural managers, and agricultural researchers for soil quality analysis.
  • The cloud platform with the function of model customization, which can modify or add models according to user requirements to expand the application domain and value.
  • The cases show that the platform has a friendly interface and runs smoothly. In the case of organic matter inversion in southwest Shandong Province, this platform can accurately obtain organic matter content in southwest Shandong Province by using remote sensing inversion model. The regional analysis function can effectively feedback the distribution of regional soil organic matter to users, and effectively improve the efficiency of regional soil quality acquisition. In the case of analysis of temporal and spatial changes of soil salinity in Kenli area, this platform can compare soil salinity data at different times through spatial analysis function on the basis of obtaining soil salinity by inversion, which can provide important data support for the treatment of soil salinization.
This research enriches the theoretical and technical methods for constructing intelligent analysis platforms or systems for soil quality indicators and provides references for related research. At the same time, it can promote the intelligence, systematization, and practicality of quantitative soil remote sensing, which is beneficial for extending agricultural production technology to the last mile.

Author Contributions

Conceptualization, T.Z. and H.C.; methodology, T.Z.; software, T.Z. and A.W.; validation, T.Z., R.W. and P.L.; formal analysis, T.Z.; investigation, T.Z.; resources, H.C.; data curation, T.Z. and A.W.; writing—original draft preparation, T.Z.; writing—review and editing, H.C. and P.L.; visualization, A.W.; supervision, H.C., Y.Z. and P.L.; project administration, H.C.; funding acquisition, H.C. All authors have read and agreed to the published version of the manuscript.

Funding

This work was financially supported by the Shandong Provincial Natural Science Foundation [ZR2019MD039]; and the Focus on research and development plan in Shandong province [LJNY202103].

Institutional Review Board Statement

Not applicable.

Informed Consent Statement

Not applicable.

Data Availability Statement

Not applicable.

Conflicts of Interest

The authors declare no conflict of interest.

References

  1. Passinato, J.H.; Amado, T.J.C.; Kassam, A.; Acosta, J.A.A.; Amaral, L.D.P. Soil Health Check-Up of Conservation Agriculture Farming Systems in Brazil. Agronomy 2021, 11, 2410. [Google Scholar] [CrossRef]
  2. Webb, N.P.; Marshall, N.A.; Stringer, L.C.; Reed, M.S.; Chappell, A.; Herrick, J.E. Land degradation and climate change: Building climate resilience in agriculture. Front. Ecol. Environ. 2017, 15, 450–459. [Google Scholar] [CrossRef] [Green Version]
  3. Guo, Y.; Fu, Y.; Hao, F.; Zhang, X.; Wen, W.; Jin, X.; Bryant, C.; Senthilnath, K. Integrated phenology and climate in rice yields prediction using machine learning methods. Ecol. Indic. 2021, 120, 106935. [Google Scholar] [CrossRef]
  4. Guo, Y.; Fu, Y.; Chen, S.; Bryant, C.; Li, X.; Senthilnath, j.; Sun, H.; Wang, S.; Wu, Z.; Beurs, K. Integrating spectral and textural information for identifying the tasseling date of summer maize using UAV based RGB images. Int. J. Appl. Earth Obs. Geoinf. 2021, 102, 102435. [Google Scholar] [CrossRef]
  5. Fróna, D.; Szenderák, J.; Harangi-Rákos, M. Economic effects of climate change on global agricultural production. Nat. Conserv. 2021, 44, 117–139. [Google Scholar] [CrossRef]
  6. Sofo, A.; Zanella, A.; Ponge, J. Soil quality and fertility in sustainable agriculture, with a contribution to the biological classification of agricultural soils. Soil Use Manag. 2021, 38, 1085–1112. [Google Scholar] [CrossRef]
  7. Tahat, M.M.; Alananbeh, K.M.; Othman, Y.A.; Leskovar, D.I. Soil Health and Sustainable Agriculture. Sustainability 2020, 12, 4859. [Google Scholar] [CrossRef]
  8. Lichtfouse, E.; Navarrete, M.; Debaeke, P.; Souchère, V.; Alberola, C.; Ménassieu, J. Agronomy for sustainable agriculture. A review. Agron. Sustain. Dev. 2009, 29, 1–6. [Google Scholar] [CrossRef]
  9. Ainiwaer, M.; Ding, J.; Kasim, N.; Wang, J.; Wang, J. Regional scale soil moisture content estimation based on multi-source remote sensing parameters. Int. J. Remote Sens. 2020, 41, 3346–3367. [Google Scholar] [CrossRef]
  10. Liu, H.; Zhang, M.; Yang, H.; Zhang, X.; Meng, X.; Li, H.; Tang, H. Invertion of cultivated soil organic matter content combining multi-spectral remote sensing and random forest algorithm. Trans. Chin. Soc. Agric. Eng. 2020, 36, 134–140. [Google Scholar] [CrossRef]
  11. Chen, H.; Ma, Y.; Zhu, A.; Wang, Z.; Zhao, G.; Wei, Y. Soil salinity inversion based on differentiated fusion of satellite image and ground spectra. Int. J. Appl. Earth Obs. Geoinf. 2020, 101, 102360. [Google Scholar] [CrossRef]
  12. Wei, Y.; Ping, Z.; Zhao, G.; Chen, H.; Wang, L. Comparison of Sentinel 2A MSI and Landsat 8 OLI for Soil Organic Matter Inversion in Southwestern Shandong Province, China; Geocarto International: London, UK, 2021. [Google Scholar] [CrossRef]
  13. Ma, Y.; Chen, H.; Zhao, G.; Wang, Z.; Wang, D. Spectral Index Fusion for Salinized Soil Salinity Inversion Using Sentinel-2A and UAV Images in a Coastal Area. IEEE Access 2020, 8, 159595–159608. [Google Scholar] [CrossRef]
  14. Davis, E.; Wang, C.; Dow, K. Comparing Sentinel-2 MSI and Landsat 8 OLI in soil salinity detection: A case study of agricultural lands in coastal North Carolina. Int. J. Remote Sens. 2019, 40, 6134–6153. [Google Scholar] [CrossRef]
  15. Guo, L.; Fu, P.; Shi, T.; Chen, Y.; Wang, S. Exploring influence factors in mapping soil organic carbon on low-relief agricultural lands using time series of remote sensing data. Soil Tillage Res. 2021, 210, 104982. [Google Scholar] [CrossRef]
  16. Wang, Z.; Zhang, F.; Zhang, X.; Chan, N.W.; Kung, H.; Ariken, M.; Zhou, X.; Wang, Y. Regional suitability prediction of soil salinization based on remote-sensing derivatives and optimal spectral index. Sci. Total Environ. 2021, 775, 145807. [Google Scholar] [CrossRef]
  17. Pei, T.; Xu, J.; Liu, Y.; Huang, X.; Gong, J. Current and future roles of GIScience and remote sensing in natural resource and environmental research. Geogr. Sustain. 2021, 38, 207–215. [Google Scholar] [CrossRef]
  18. Ban, Y.; Marullo, S.; Eklundh, L. European Remote Sensing: Progress, challenges, and opportunities. Int. J. Remote Sens. 2017, 38, 1759–1764. [Google Scholar] [CrossRef] [Green Version]
  19. Mutanga, O.; Dube, T.; Ahmed, F. Progress in remote sensing: Vegetation monitoring in South Africa. South Afr. Geogr. J. 2016, 98, 461–471. [Google Scholar] [CrossRef]
  20. Lü, G.; Batty, M.; Strobl, J.; Lin, H.; Chen, M. Reflections and speculations on the progress in Geographic Information Systems (GIS): A geographic perspective. Int. J. Geogr. Inf. Sci. 2018, 33, 346–367. [Google Scholar] [CrossRef]
  21. Wu, B.; Zhao, X.; Zhou, X.; Feng, K.; Luan, J. Design and Implementation of Soil Heavy Metal Pollution Remediation Evaluation System Based on WebGIS. Surv. Mapp. Spat. Geogr. Inf. 2021, 44, 131–135, 139. [Google Scholar] [CrossRef]
  22. Liao, C.; Zeng, W.; Zhang, Y.; Li, Y.; Lin, C.; Liu, Q. Contrastive Analysis of Multi-scale PM2.5 Concentration Spatial Distribution Simulation of Spatial Interpolation and Remote Sensing Inversion. Environ. Sci. Technol. 2017, 40, 145–150. [Google Scholar] [CrossRef]
  23. Wang, D.; Wang, J.; Zhu, Y.; Luo, K.; Hou, Z.; Sun, K. Design and Implementation of Soil Moisture Monitor System of Yunnan Province. J. Irrig. Drain. 2016, 35, 83–89. [Google Scholar] [CrossRef]
  24. Zhang, Z.; Gao, M.; Zhu, C. Dynamic monitoring system of water and salt in saline alkali land based on WebGIS. Soils 2019, 51, 413–417. [Google Scholar] [CrossRef]
  25. Guo, P. Remote Sensing Inversion and Monitoring System of Soil Salinization; Shandong Agricultural University: Taian, China, 2019; pp. 1–23. [Google Scholar] [CrossRef]
  26. Long, Z.; Zhang, T.; Xu, W.; Qin, Q. Development of farmland drought remote sensing dynamic monitoring system based on Android. Remote Sens. Land Resour. 2021, 33, 256–261. [Google Scholar] [CrossRef]
  27. Lan, H.; Yang, W.; Li, M.; Zhou, P. Soil Nitrogen Spatial Distribution Mapping System Based on ArcGIS Engine. Trans. Chin. Soc. Agric. Mach. 2019, 50, 221–227. [Google Scholar] [CrossRef]
  28. Wang, J.; Yang, Z.; Yang, X.; Yang, X. Design of precision fertilization system for family farm based on Mobile GIS. China Agric. Inform. 2019, 31, 62–71. [Google Scholar] [CrossRef]
  29. Jamie, S.; Murray, W. Recognising object-oriented software design quality: A practitioner-based questionnaire survey. Softw. Qual. J. 2017, 26, 321–365. [Google Scholar] [CrossRef] [Green Version]
  30. Parr, M.; Schmidt, A. Life Cycle Management of Analytical Methods. J. Pharm. Biomed. Anal. 2017, 147, 506–517. [Google Scholar] [CrossRef]
  31. Alexander, F.; Brett, C.; Trent, P. Quantifying merging fire behaviour phenomena using unmanned aerial vehicle technology. Int. J. 2017, 54, 284–285. [Google Scholar] [CrossRef]
  32. Kim, D.; Cho, H.; Onof, C.; Choi, M. Let-It-Rain: A web application for stochastic point rainfall generation at ngagged basins and its applicability in runoff and flood modeling. Stoch. Environ. Res. Risk Assess. 2017, 31, 1023–1043. [Google Scholar] [CrossRef] [Green Version]
  33. Zhu, J.; Tan, Y.; Wang, X.; Wu, P. BIM/GIS integration for web GIS-based bridge management. Ann. GIS 2021, 27, 99–109. [Google Scholar] [CrossRef] [Green Version]
  34. Kuper, P. Design of a Generic Mobile GIS for Professional Users. Int. J. Geo-Inf. 2018, 7, 422. [Google Scholar] [CrossRef] [Green Version]
  35. Li, S.; Pu, G.; Cheng, C.; Chen, B. Method for managing and querying geo-spatial data using a grid-code-array spatial index. Earth Sci. Inform. 2019, 12, 173–181. [Google Scholar] [CrossRef]
  36. Wang, R. Usage analysis of HTML online text editor in Java Web Development - Taking kindeditor as an example. J. Hubei Univ. Sci. Technol. 2013, 33, 21–23. [Google Scholar] [CrossRef]
  37. Alan, T. Spatial Analysis and Modeling: Advances and Evolution. Geogr. Anal. 2020, 53, 647–664. [Google Scholar] [CrossRef]
  38. Dong, Z.; Qian, B. Field investigation on effects of wheat-straw/corn-stalk mulch on ecological environment of upland crop farmland. J. Zhejiang Univ. Sci. A 2002, 2, 79–85. [Google Scholar] [CrossRef]
  39. Shen, Y.L.; Yu, S. The Effects of different agricultural management measures on CH4 emission from paddy fields in southwest Shandong Province. IOP Conf. Ser. Earth Environ. Sci. 2021, 792, 012051. [Google Scholar] [CrossRef]
  40. Hoffland, E.; Kuyper, W.T.; Comans, R.N.J.; Creamer, R.E. Eco-functionality of organic matter in soils. Plant Soil 2020, 455, 1–22. [Google Scholar] [CrossRef]
  41. Prudnikova, E.; Savin, I. Some Peculiarities of Arable Soil Organic Matter Detection Using Optical Remote Sensing Data. Remote Sens. 2021, 13, 2313. [Google Scholar] [CrossRef]
  42. Huang, J.; Zhao, G.; Xi, X.; Cui, K.; Gao, P. Extraction of soil salinization information by combining spectral and texture data in the Yellow River Delta: A case study in Kenli District. Shandong Province. J. Agric. Resour. Environ. 2022, 39, 594–601. [Google Scholar] [CrossRef]
  43. Han, W.; Yang, Z.; Di, L. Cropscape: A Web service based application for exploring and disseminating US conterminous geospatial cropland data products for decision support. Comput. Electron. Agric. 2012, 84, 111–123. [Google Scholar] [CrossRef]
  44. Xing, H.; Chen, J.; Wu, H.; Hou, D. A web service-oriented geoprocessing system for supporting intelligent land cover change detection. Int. J. Geo-Inf. 2019, 8, 50. [Google Scholar] [CrossRef]
Figure 1. Operation interface of the management function of the quantitative inversion model. (a) The Web client model is modified; (b) The Web client model selection; (c) The PC client model management; (d) Mobile App side model management.
Atmosphere 14 00023 g001
Figure 2. General architecture diagram of the platform.
Atmosphere 14 00023 g002
Figure 3. System function module diagram.
Atmosphere 14 00023 g003
Figure 4. Intelligent inversion and spatial distribution of soil organic matter in southwestern Shandong Province, China. (a) The Web client loads the image; (b) The Web client hierarchical mapping; (c) The Web client spatial analysis; (d) The Mobile APP loads the image; (e) The Mobile app inversion results; (f) The Mobile APP hierarchical analysis.
Atmosphere 14 00023 g004
Figure 5. Interpolation analysis of soil organic matter in southwest Shandong Province.
Atmosphere 14 00023 g005
Figure 6. Intelligent inversion and spatial distribution of soil salinity in Kenli District, Yellow River Delta. (a) The Web client loads the image; (b) The Web client inverse grading; (c) The Web client spatial analysis; (d) The Mobile APP loads the image; (e) The Mobile app inversion and query; (f) The Mobile APP hierarchical analysis.
Atmosphere 14 00023 g006
Figure 7. Analysis of the spatial and temporal variation of soil salinity in the Kenli area of the Yellow River Delta.
Atmosphere 14 00023 g007
Table 1. Statistical results of soil organic matter classification in Southwest Shandong, China.
GradeSoil Organic Range
(g/kg)
Number of PixelsProportion Rate
(%)
First grade>301,031,5073.6
Second grade25~302,843,61510.2
Third Grade20~256,189,04622.2
Fourth Grade15~205,631,47420.2
Fifth Grade10~1512,071,42843.3
Sixth Grade≤10139,3920.5
Table 2. Comparison of sample data, interpolation results, and inversion results.
GradeSampling Point (%)Inversion Map (%)Interpolation Map (%)
≥302.83.61.5
25–3013.510.29.3
20–2524.822.227.8
15–2026.320.245.1
10–1530.543.315.5
<102.10.50.8
Table 3. Statistical results of soil salinity classification in Kenli District, Yellow River Delta.
GradeSoil Salinization Range (g/kg)Number of PixelsProportion Rate
(%)
Non-saline soil<2.0228,5516.26
Mild saline soil2.0~4.0301,0808.25
Moderate saline soil4.0~6.0808,34722.14
Severe saline soil6.0~10.01,116,93130.60
Solonchak≥10.01,195,63932.75
Table 4. Spatial-temporal variation of salinization in Kenli District, Yellow River Delta in 2018.
Grade2018-042018-10Change
Non-saline soil6.26%22.27%16.01%
Mild saline soil8.25%19.93%11.68%
Moderate saline soil22.14%20.13%−2.01%
Severe saline soil30.60%29.80%−0.80%
Solonchak32.75%7.87%−24.88%
Disclaimer/Publisher’s Note: The statements, opinions and data contained in all publications are solely those of the individual author(s) and contributor(s) and not of MDPI and/or the editor(s). MDPI and/or the editor(s) disclaim responsibility for any injury to people or property resulting from any ideas, methods, instructions or products referred to in the content.

