Article

Anthropogenic NOx Emission Estimations over East China for 2015 and 2019 Using OMI Satellite Observations and the New Inverse Modeling System CIF-CHIMERE

1
Université Paris Cité and Univ Paris Est Créteil, CNRS, LISA, F-75013 Paris, France
2
Univ Paris Est Créteil and Université Paris Cité, CNRS, LISA, F-94010 Créteil, France
3
Laboratoire des Sciences du Climat et de l’Environnement, LSCE-IPSL (CEA-CNRS-UVSQ), Université Paris-Saclay, F-91191 Gif-sur-Yvette, France
4
École Polytechnique, IP, ENS, PSL Université, SU, CNRS, F-91128 Palaiseau, France
5
European Commission, Joint Research Center, 21027 Ispra, Italy
*
Authors to whom correspondence should be addressed.
Atmosphere 2023, 14(1), 154; https://doi.org/10.3390/atmos14010154
Submission received: 10 October 2022 / Revised: 18 December 2022 / Accepted: 9 January 2023 / Published: 10 January 2023
(This article belongs to the Special Issue Satellite-Based Air Quality Monitoring)

Abstract

:
The Chinese government introduced regulations to control emissions and reduce the level of NOx pollutants for the first time with the 12th Five-Year Plan in 2011. Since then, the changes in NOx emissions have been assessed using various approaches to evaluate the impact of the regulations. Complementary to the previous studies, this study estimates anthropogenic NOx emissions in 2015 and 2019 over Eastern China using as a reference the Hemispheric Transport of Air Pollution (HTAP) v2.2 emission inventory for 2010 and the new variational inversion system the Community Inversion Framework (CIF) interfaced with the CHIMERE regional chemistry transport model and OMI satellite observations. We also compared the estimated NOx emissions with the independent Multi-resolution Emission Inventory for China (MEIC) v1.3, from 2015. The inversions show a slight global decrease in NOx emissions (in 2015 and 2019 compared to 2010), mainly limited to the most urbanized and industrialized locations. In the locations such as Baotou, Pearl River Delta, and Wuhan, the estimations in 2015 compared to 2010 are consistent with the target reduction (10%) of the 12th Five-Year Plan. Comparisons between our emission estimates and MEIC emissions in 2015 suggest that our estimates likely underestimate the emission reductions between 2010 and 2015 in the most polluted locations of Eastern China. However, our estimates suggest that the MEIC inventory overestimates emissions in regions where MEIC indicates an increase of the emissions compared to 2010.

1. Introduction

Nitrogen oxides (NOx = NO2 + NO) are a family of highly reactive trace gases that cause air quality deterioration in the troposphere. They play a key role in the formation of ozone (O3) through photochemistry [1] and the formation of secondary organic aerosols [2]. Most tropospheric NOx are emitted as NO and rapidly converted to NO2 by various reactions [3]. Anthropogenic activities such as fossil fuel combustion are dominant NOx emission sources, especially in industrialized regions [4]. On the other hand, natural and biogenic sources can be a major source of NOx, such as soil NOx emissions in agricultural areas [5].
Over the past few decades, NOx emission levels in China increased due to growth in industrial activities and weak pollution regulations [6,7,8]. The control of NOx emissions was added to the regulations in March 2011 with the 12th Five-Year Plan (2011–2015) to reduce the annual Chinese NOx emissions nationwide by 10% compared to 2010 [9]. Studies have shown that the Chinese government met its emission reduction target due to these regulations in this period and even exceeded the plan’s target e.g., [10,11]. This plan is followed by a 13th Five-Year Plan (2016–2020) with a target of reducing Chinese NOx emissions nationwide by 15% in 2020, compared to 2015 [12].
Chemistry transport models (CTMs) have been widely used to study the efficiency of environmental regulations, assess their impacts, and make future predictions through different scenarios [11,13,14,15,16]. Emission inventories are one of the main inputs of CTMs, and their spatial and temporal accuracies are essential for simulations and forecasts. One common way to build an emission inventory is the bottom-up approach. This approach quantifies emissions based on the local distribution of activities, emission factors, and annual self-declarations by emitters. Numerous studies estimated China’s NOx emissions using these activity rates and species’ emission factors [17,18]. For example, Li et al. [19] calculated the annual anthropogenic Chinese NOx emissions for 2008 as 26.55 Tg using the Multiresolution Emission Inventory for China (MEIC) v1.0 and 20.66 Tg using Hemispheric Transport of Air Pollution (HTAP) v2.2 bottom-up emission inventories. For 2010, Li et al. [19] and Zheng et al. [20] estimated annual NOx emissions as 26.5 Tg and 29.1 Tg, respectively, using two different versions of MEIC bottom-up inventory (v1.3 and v1.0, respectively). However, even though the information comes firsthand, significant uncertainties remain. Using Monte Carlo simulations, Zhao et al. [21] predicted Chinese annual NOx emissions’ uncertainties to be 35% of estimated emissions in 2010. Crippa et al. [22] estimate NOx emission uncertainties in 2012 as 56.2% for top emitting regions in China. It is worth noting that the uncertainties are given on an annual and national basis. They might be larger when considering grid points or smaller timescales. Moreover, the collection of data to build bottom-up inventories is time-consuming; then, updating these inventories may take several years [23].
On the other hand, using inverse modeling techniques, which constrain emissions by atmospheric observations, brings complementary information and, in some regions such as China, captures current emission trends better than traditional bottom-up inventories [16]. In addition, unlike bottom-up inventories, these top-down inventories provide broad spatial coverage and have a fast update ability, as emissions can be estimated when observations are ready to interpret. Nevertheless, top-down inventories have some limitations and uncertainties related to the performances of CTMs on transport and chemical processes [24] and the observations themselves (e.g., limited sensitivity to the surface and cloud coverage for satellite observations) [25]. Thus, different inversion techniques have been developed to estimate NOx emissions. For example, earlier studies used a mass balance approach to constrain NOx emissions on various spatial scales [26,27,28,29,30]. Most of the studies assume a linear relationship between NOx prior emissions and NO2 columns, and do not consider horizontal emission transport. With the increase in computational capacity, advanced inversion techniques such as the Kalman filter [31] and variational data assimilations [32] have been developed to take into account the transport of emissions and nonlinearities in chemical reactions. Van der A et al. [33] derived anthropogenic NOx emissions on a 25 × 25 km2 provincial level using the DECSO v4 algorithm [23,34,35], which estimates emissions using Kalman filter, the regional CHIMERE v2013 CTM [36], MEIC v1.0 inventory for 2010 [20,37,38] and Ozone Monitoring Instrument (OMI) NO2 observations using the DOMINO v.2 algorithm [39] for the period 2005–2015 in Eastern China. They found an increasing trend in total NOx emissions until 2012, except for 2009. Even though the total NOx emission peak occurs in 2012, different peaks occur between 2011 and 2014 on a provincial level. Qu et al. [40] co-assimilated anthropogenic and biomass burning NOx, SO2, and CO emissions from bottom-up inventory HTAP v2.2 2010 [41] in China using a sector-based variational algorithm and GEOS-Chem Adjoint model [42] for January 2005–2012. Unlike Van der A et al. [33], their inversion captures the NOx emissions peak for 2011. Moreover, they found that all estimated NOx emission top-down inventories (sector-based and species-based) are smaller than HTAP v2.2 bottom-up inventory by 21–26% in January 2010. Zheng et al. [20] quantified anthropogenic NOx emissions using a combination of MEIC v1.3 bottom-up inventory [38] and index decomposition analysis. They compared their bottom-up emission estimates with other studies, which include OMI observations and top-down emission estimates between 2010 and 2015 for China and Eastern China. According to their study, all top-down NOx emission inventories calculated by inverse modeling using OMI NO2 columns show smaller relative differences between these two years than bottom-up estimations and OMI observations [20] (p. 14106, Table 2).
The previous studies show a significant range of uncertainties regarding the NOx emissions from bottom-up and top-down approaches and a significant spread in the emissions derived from different approaches [23]. The changes in the emissions such as the emission reduction targets of governmental mitigation strategies, which the inventories need to assess, are usually smaller than the uncertainties on the emissions and then an important challenge for the inventories. A variety of tools to estimate emissions is essential to assess the emissions and their related uncertainties better. Our study proposes the use of a new inverse modeling system, the Community Inversion Framework (CIF) [43], interfaced with the CHIMERE chemistry-transport model [36] and its adjoint [44] and OMI satellite observations to estimate Chinese NOx emissions in 2015 and 2019. The objectives of this study are twofold: (i) testing the new CIF-CHIMERE over China and evaluating if the derived emissions and concentrations simulated using them are closer to independent inventory and measured concentrations, respectively; (ii) evaluating if the NOx emission regulations planned in the two last Five-Year Plans are visible in the emissions derived with the new CIF-CHIMERE system. We choose to focus on the last year (2015) of the 12th Five-Year Plan. We do not consider the last year of the 13th Five-Year Plan, 2020 as it was perturbed by the COVID pandemic. We analyze the NOx emission estimates at the scale of Eastern China and at the scale of the most urbanized and industrialized Chinese locations. We evaluate the estimated NOx emissions by comparing with the independent inventory MEIC v1.3 and surface NO2 observations from the Chinese air quality network. Section 2 describes the methodology and tools used in this study. Results and discussions are presented in Section 3.

2. Materials and Methods

2.1. Inversion-Related Tools and Data

2.1.1. Inverse Modeling and the CIF System

The atmospheric inverse modeling approach applied to emission estimates aims at constraining a prior knowledge of emissions with atmospheric observations (concentrations or columns). A chemical transport model combined with an observation operator is used to map the emissions into the observation space. The emissions are usually constrained at the model grid point and at a temporal resolution better than annual. Due to the high dimension of the problem, sophisticated approaches [45] are necessary. The evaluation of the estimated or posterior emissions can only be performed indirectly by comparing concentrations simulated using these posterior emissions (named in the following Conc_Post) to independent measured concentrations. This step is often named “experiment run”. To evaluate if the inversion succeeds to better assess the emissions compared to our prior knowledge used, it is also necessary to perform a “control run” to simulate the concentrations using the prior emissions (named Conc_Prior in the following) and quantify if the Conc_Post are closer to the measured concentrations than the Conc_Prior. Figure 1 summarizes the different steps needed to perform atmospheric inversions and to evaluate them.
As the dimension of the problem to solve is high, we use a variational approach based on a Bayesian framework and normal distributions of the errors and uncertainties. The system aims to find an optimal solution of the control vector x by minimizing the cost function J (Equation (1)).
J x = 1 2 x x b T B 1 x x b + 1 2 H x y o T R 1 H x y o
where x b is a prior estimate of the control vector, B is the prior error covariance matrix, H x is the observation operator matrix which links control variables to atmospheric measurements at specified locations and time using a CTM (CHIMERE in this study), y o is the observation vector (OMI NO2 columns in this study), and R is the covariance matrix of the observation errors. In our case, the control variables are not emissions, but rather daily multiplicative factors applied to NOx emissions. During a given day, the corresponding multiplicative factor is used to scale homogeneously the hourly emission values, retaining the relative variations of the diurnal profile. This, the relationship between control variables and emission can be stated as follows:
ENOx (time, altitude, latitude, longitude) = x (day, altitude, latitude, longitude) ×ENOx, ref (time, altitude, latitude, longitude) with ENOx, ref the reference emissions from the inventory. Thus, the values of xb are all set to 1 and the control covariance matrix B is expressed in relative terms and not in emission covariances. The dimension of x and x b   is 24 × 16 × 64 × 60 and corresponds to the hours in a day, the level of altitude and the number of latitudinal and longitudinal grid cells in the domain, respectively. The dimension of y is 1D (e.g., 780) and determined by the selection of the observations (selection criteria explained in the Section 2.1.3).
We use the CIF inversion system interfaced with the CHIMERE CTM and its adjoint and the OMI NO2 columns to perform the inversion experiments. The CIF is an open-source unified system designed to allow the use of different atmospheric inversion approaches, atmospheric transport models, and observations with large flexibility [43]. It is designed to estimate the fluxes of various greenhouse gases and reactive species both at the global and regional scales. As we consider reactive species, the inversion problem is non-linear. We then use the M1QN3 limited-memory quasi-Newton minimization algorithm [46] to minimize the cost function J (Equation (1)). It is worth noting that computing the uncertainties on the posterior emissions is very challenging when using variational approaches due to the dimensionality of the problem and constraints on time and computing sources [43,44,47]. These uncertainties are then not estimated here.

2.1.2. HTAP v2.2 Emission Inventory

The Hemispheric Transport Atmospheric Pollution (HTAP) inventory, version 2.2 [41] is used to prescribe anthropogenic emissions of pollutants to the CHIMERE model. For the country of China, HTAP v2.2 is constructed using regional emission inventories in collaboration with the MICS Asia Scientific Community (MICS-Asia) and REAS experts with a horizontal resolution of 0.25° × 0.25° converted to 0.1° × 0.1° [48]. Emissions are estimated from seven main sectors of anthropogenic activities: air, ships, energy, industry, transport, residential, and agriculture. The HTAP v2.2 emissions correspond to the year 2010 and used as the prior in the inversion runs (Figure 1), whatever the considered year. In this study, emissions will be called Prior when they are used as a prior in the inversion. In parallel, they are also used as a reference for the emissions of the year 2010, the starting point to evaluate the 12th and the 13th Five-Year Plans. In this study, they are called HTAP v2.2 when they are used as a reference in the simulations. In addition, the biogenic NOx emissions are given by the Model of Emissions of Gases and Aerosols from Nature version 2.1 (MEGAN v2.1) model [49].
In this study, we set prior uncertainties B by taking diagonal terms as 70% for the anthropogenic NOx emissions [50] and 100% for the biogenic NOx emissions. We use horizontal correlations that decay exponentially with the correlation length scale derived from the model (CHIMERE) resolution. Noting that, in this study, NOx emissions are expressed as nitrogen oxides (NO2 and NO) in kilotons (hereinafter, kt NOx or Tg NOx is referred to as kt or Tg).

2.1.3. OMI Satellite Observations

The Ozone Monitoring Instrument (OMI) is a nadir-viewing ultraviolet-visible spectrometer on National Aeronautics and Space Administration’s (NASA) Earth Observing System (EOS) Aura polar satellite, launched in July 2004 [51]. The instrument is a result of the contribution of the Netherlands’ Institute for Air and Space Development and the Finnish Meteorological Institute to the EOS Aura mission. It has been providing daily data since 9th August 2004 by making full global measurements of the solar radiation backscattered from the Earth’s atmosphere and surface, along with measurements of the solar irradiance with a spatial resolution of 24 × 13 km2 at nadir (across × along-track) with a local overpass time 13:40 LT [52].
This study uses OMI NO2 tropospheric columns from the European Quality Assurance for Essential Climate Variables (QA4ECV) project’s NO2 ECV precursor version 1.1 product [53]. This QA4ECV retrieval consists of an improved spectral fitting method and data assimilation scheme using the TM5-MP model in 1° × 1° degree horizontal resolution to estimate stratospheric background NO2 and to reinforce the air mass factor [54,55]. OMI tropospheric NO2 column data is defined as the vertical integrations of the NO2 molecules between the surface and the tropopause [56]. The data set is collected from the Tropospheric Emission Monitoring Internet Service (TEMIS, [57]). We first select OMI observation data of which, (i) the processing error flag equals 0 for a pixel, (ii) the solar zenith angle is lower than 80°, (iii) the snow ice flag is lower than 10 or equal to 255, (iv) the ratio of tropospheric air mass factor (AMF) over geometric AMF is higher than 0.2 to avoid situations in which the retrieval is based on very low (relative) tropospheric AMFs, and (v) the cloud fraction is lower than 0.5. Second, we filter out these selected daily OMI observation data with a maximum of 100% error.

2.1.4. The Regional CHIMERE CTM

CHIMERE is a state-of-the-art three-dimensional regional CTM that simulates hourly atmospheric concentrations of a number of pollutants of interest over a given domain [58]. External forcings are required to run a simulation, such as meteorological fields, primary pollutant emissions (anthropogenic and biogenic emissions), and initial and boundary conditions.
In this study, we use CHIMERE v2013 [36] with the following inputs to simulate NO2 concentrations. Boundary conditions are given by a climatology from the global model LMDZ-INCA [59]. Meteorological conditions come from the European Centre for Medium-Range Weather Forecasts (ECMWF) and are interpolated hourly. Biogenic emissions are estimated from the MEGAN v2.1 model [49]. Finally, anthropogenic emissions are those from the HTAP v2.2 bottom-up inventory [41].
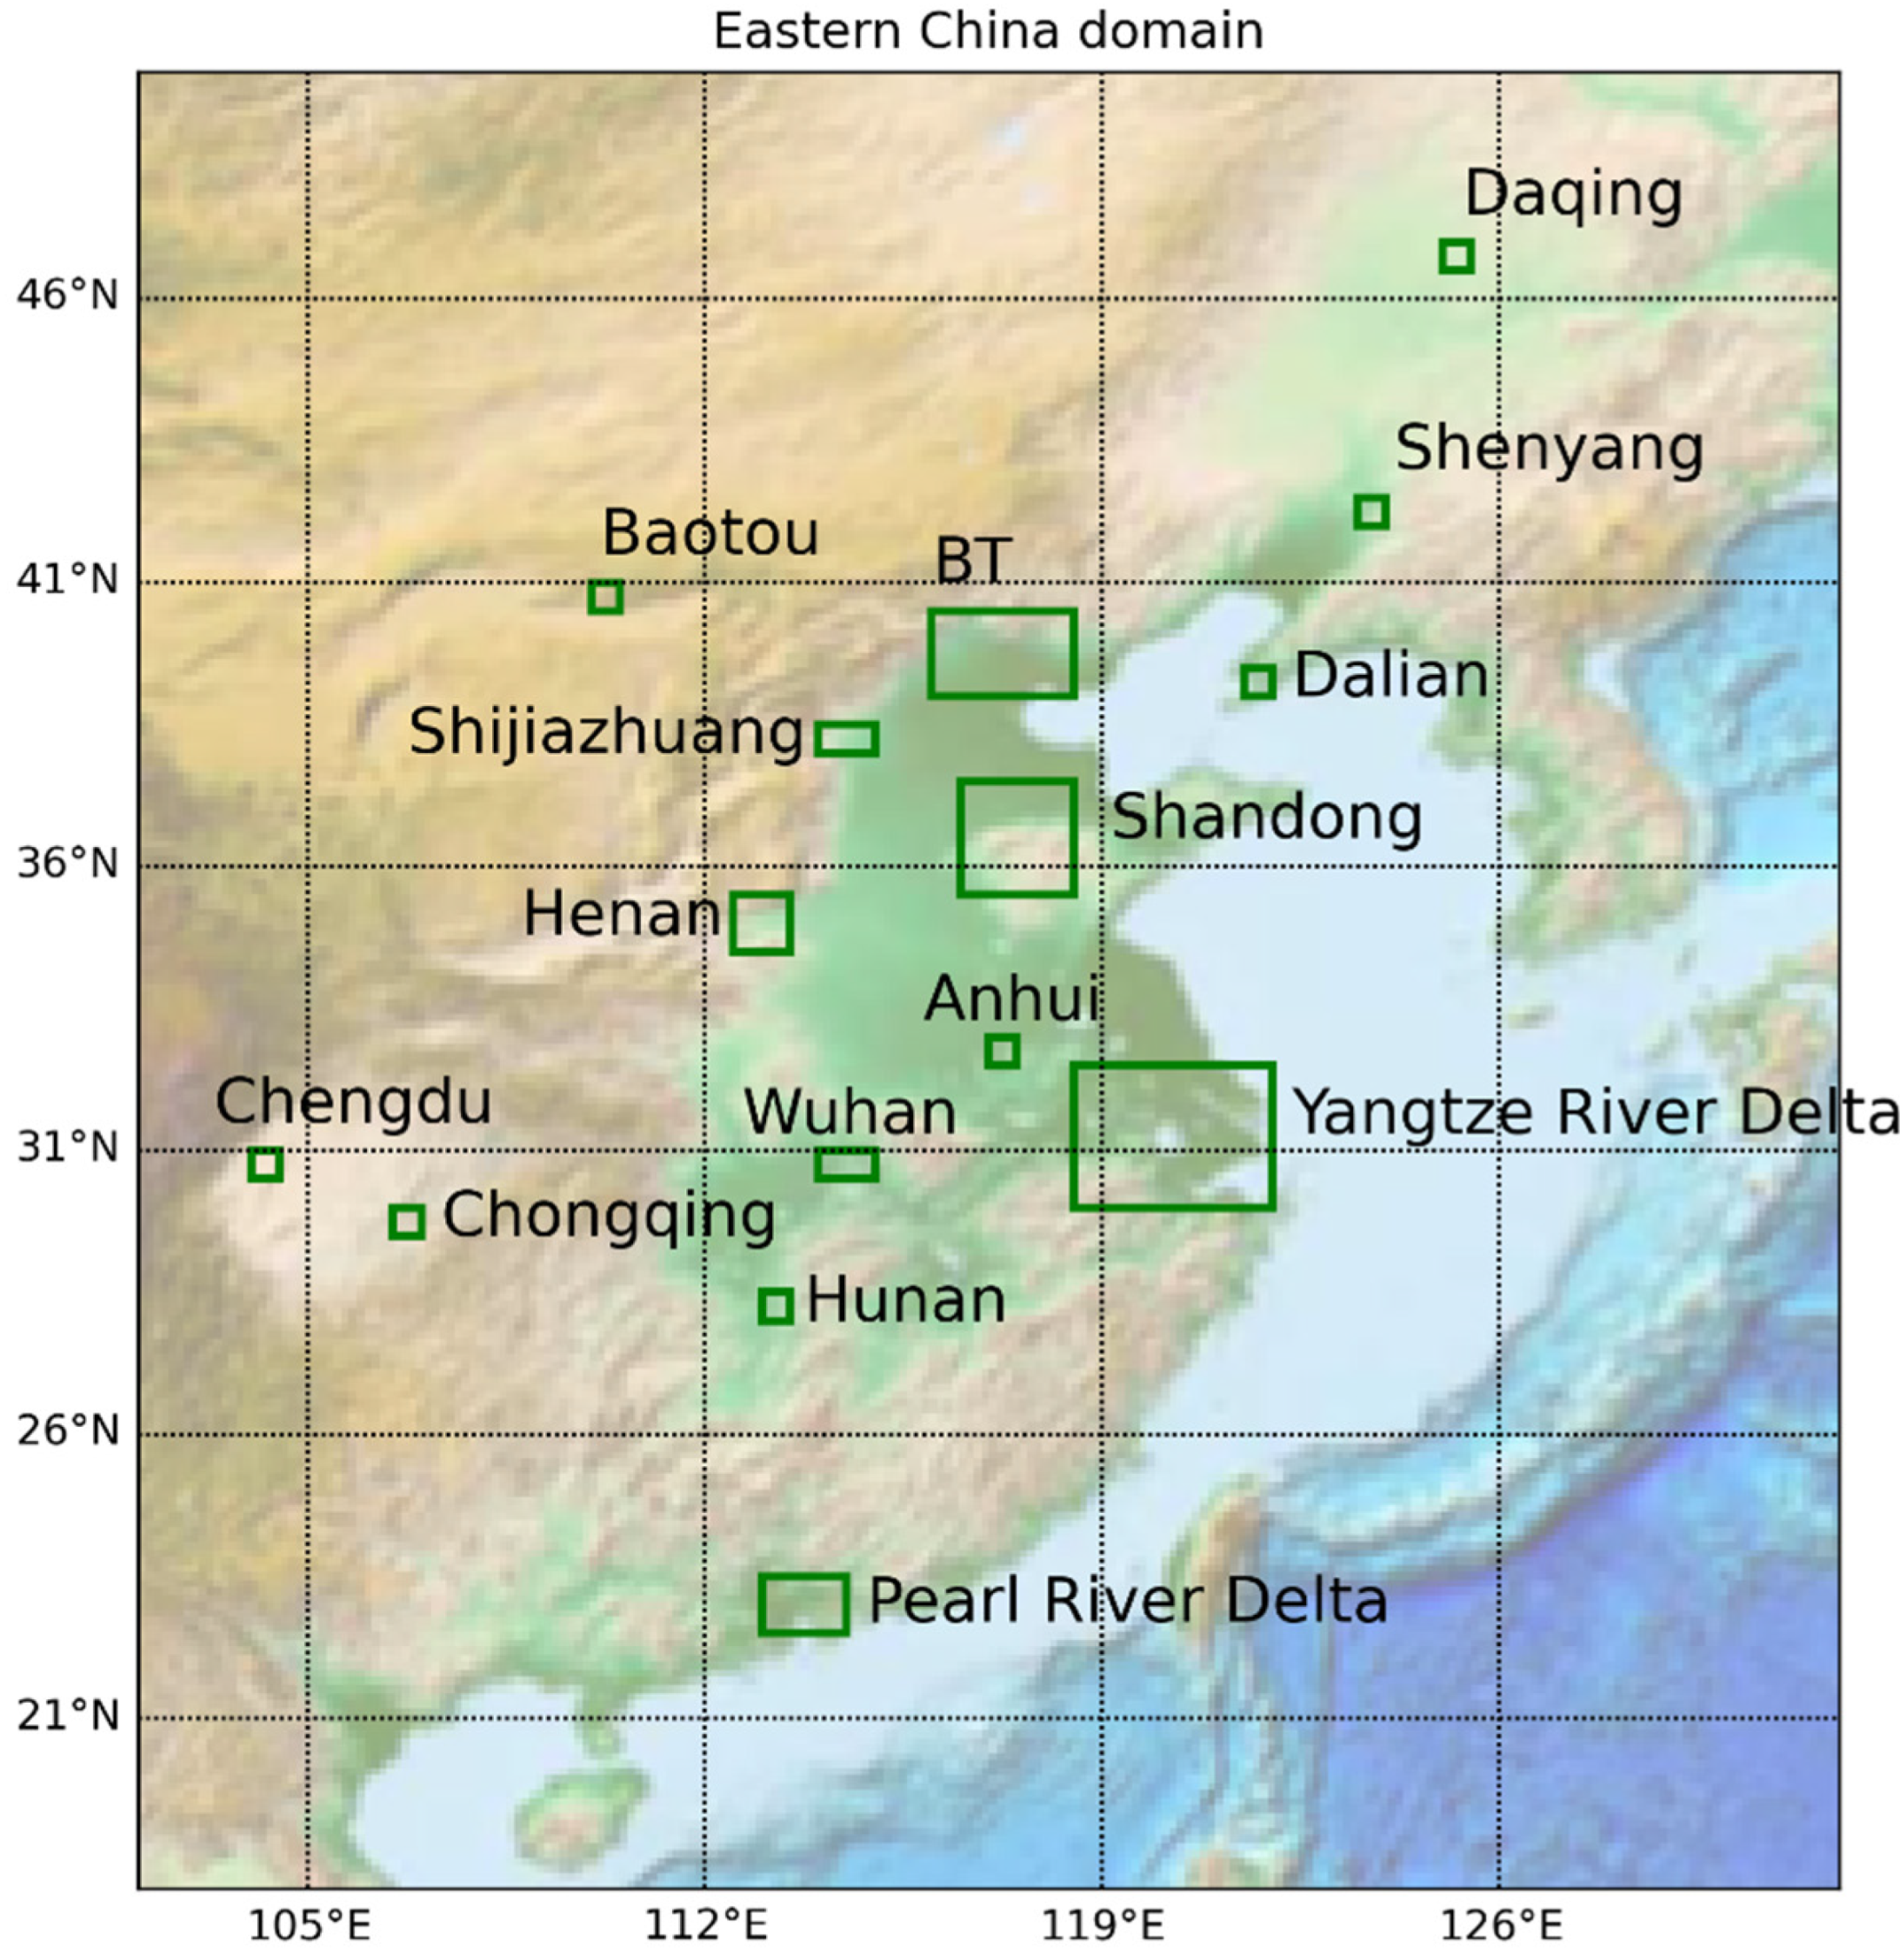
Our study configuration is based on a 0.5° × 0.5° horizontal resolution with 17 vertical layers from surface to 200 hPa and 8 layers within the first three kilometers. It includes 65 (longitude) × 61 (latitude) grid cells that correspond to 18° N–50° N; 102° E–132° E and covers eastern and southern China, seas and Korean Peninsula (Figure 2).
The gaseous chemical scheme used in CHIMERE is MELCHIOR-2 [37]. The aerosol module of CHIMERE is not considered in the simulations and inversions, as the adjoint of this module is not available [44].
For the comparison between the observations and the model during the inversion process (Figure 1), super-observations at the model resolution (0.5° × 0.5°) are considered. As the number of OMI observations lying in the model grid-cell is generally small and will not allow one to decrease observation errors by averaging, we choose to use the median of corresponding OMI NO2 columns. The averaging kernel A and the observation errors associated with the median columns are considered too. The observation errors are used to fill the R matrix.
To compare with OMI super-observations, simulated NO2 concentrations in the same grid cells as the super observations are selected. The hourly-simulated concentrations are interpolated in time and OMI’s pressure levels. OMI averaging kernels are applied to these NO2 vertical profiles using Equation (2) [56].
y = i = 1 n y i s A i
where; y is the model equivalent of the satellite data, n is the number of levels of the satellite observations, y i s is the simulated concentration interpolated at the i -th level, A i is the averaging kernel of the i -th level. Finally, modelled NO2 tropospheric columns are calculated and compared to OMI NO2 columns (the 2nd term of the cost function J, Equation (1)).

2.1.5. Inversion Experiments

This study performs CIF-CHIMERE inversions with a daily assimilation window for 2015 and 2019. The inversion is considered convergent when the gradient norm of the J function is reduced by more than 95% [44]. By this criterion, there are 267 and 296 convergent days per year, respectively. Due to the variability of the daily spatial coverage of OMI observations, we consider monthly averaged corrections to build the final posterior emission inventories. Examples of monthly corrections are shown in Figure S1 in the Supplementary Material. The main configurations of the inversion runs made for 2015 and 2019 are summarized in Table 1.

2.2. Evaluation Data and Method

2.2.1. MEIC Bottom-Up Emission Inventory

MEIC (Multi-resolution Emission Inventory for China) is a bottom-up emission inventory developed and maintained at Tsinghua University since 1990 [38]. It is designed to track anthropogenic emissions over mainland China in various spatial resolutions. In this inventory, NOx emissions are mainly presented in five sectors: energy, transportation, industry, agriculture, and residential. More details about inventory construction and sectors can be found in Li et al. [37] and Zheng et al. [20].
In this study, we use MEIC v1.3 from 2015 [20,60] as an independent inventory to evaluate the estimated posterior emissions for the same year (Emis_Post15). It should be noted that this version of MEIC contains the impacts of the implementation of China’s Air Pollution Prevention and Control Action Plan. The MEIC inventory is also named MEIC15 in the following.

2.2.2. CNEMC Ground-Based Observations

The China National Environmental Monitoring Centre (CNEMC) network, operating under the China Ministry of Ecology and Environment (MEE), has provided nationwide hourly in-situ concentrations of pollutants such as SO2, O3, NO2, CO, PM2.5, and PM10 since 2014. These measurements are carried out using a commercial chemiluminescence analyzer equipped with a molybdenum converter.
This study considers surface NO2 concentration measurements from 648 stations in 2015 and 626 stations in 2019, located in Eastern China.

2.2.3. Evaluation and Analysis Methodology

The emission estimates (Emis_Post15 and Emis_Post19) are evaluated indirectly by comparing the NO2 concentrations simulated in the experiment runs defined in Table 1 with the surface measurements. The simulated and observed daily concentrations are calculated from the hourly simulated and observed concentrations, and compared. The simulated concentrations are bilinearly interpolated at the location of the stations. The normalized mean biases (NMB), the root-mean-square error (RMSE), and the Pearson correlation coefficient (r) are the metrics used for the evaluation (Supplementary Material: Statistical Indicators). The measured concentrations are taken as the reference. As already mentioned, it is also necessary to perform a control run based on the prior emissions to evaluate if the inversions help to better assess the emissions compared to the prior (for simplicity, we will use the term of improvement in the following). In addition, calculating the ratios of the statistical indicators between the experiment run and the control run for the same year allows one to quantify the improvement brought by the inversions (Supplementary Materials: Ratios). Indeed, when the ratios of the mean bias and of the RMSE are smaller than one and/or the correlation ratio is higher than one, we can consider that the new emission estimates are improved compared to the prior knowledge of these emissions. In addition, we also performed a run for 2015 where the emissions from HTAP v2.2 are replaced with the NOx emissions from MEIC version 1.3. This allows an evaluation of the emission estimates against an independent inventory.
It is worth noting that, for the comparison between models and surface stations, Lamsal et al. [61] recommended to apply a correction factor to the measured NO2 concentrations. Indeed, due to the measurement analyzer which catalyzes NO2 into NO, other reactive oxidize nitrogen compounds (NOz) such as peroxyacetyl nitrate (PAN), and nitric acid (HNO3) can be also converted to NO, to a certain extent, which results in an overestimation of ambient NO2 concentrations [61]. For this reason, Lamsal et al. [61] suggested using the following correction factor (CF) formula to alleviate and avoid this overestimation of NO2.
CF = NO 2 NO 2 + AN + 0.95 PAN + 0.35 HNO 3
We use CHIMEREv2013 to simulate NO2, the sum of all alkyl nitrates (AN), PAN, and HNO3 at a resolution of 0.5° × 0.5° for 2015 and 2019, respectively. Calculated CFs are bilinearly interpolated according to the location of the stations (latitude, longitude) before being applied to the hourly measured ground-based NO2 concentrations.
To avoid representativeness issues during the comparison of simulated concentrations at the coarse model resolution and the surface measurements, we first classify the stations according to their environment type. The types of the stations follow the classification in Lachatre et al. [62] using the method of Flemming [63]. Flemming et al. [63] use ozone and its diurnal variability to evaluate whether stations represent rural, suburban, urban, or traffic environments. In our analyses, we include stations in rural, suburban and urban environments and exclude stations in the traffic environment, as they are near sources and are not comparable to the coarse model resolution.
In addition to the evaluation of the emission estimates using surface measurements, we also analyze the emissions Emis_Post15 and Emis_Post19 in terms of annual, monthly, and regional emission budget. The emission budgets are calculated as the sum of emissions in each grid cell of the region/domain and over the time period considered. Comparison with the independent MEIC inventory for 2015 on an annual and monthly basis over Eastern China and selected urbanized locations are also performed and analyzed in Section 3.

3. Results and Discussion

3.1. Evaluation of the CIF-CHIMERE System and NOx Emission Estimates with Ground-Based Measurements

The emission estimates evaluation is not direct and is based on the experiment and control runs described in Section 2. Then, we compared simulated surface NO2 concentrations using prior (Conc_Prior), posterior (Conc_Post), and MEIC (Conc_MEIC) NOx emissions for 2015 and 2019 with NO2 ground-based measurements over Eastern China. Although the global north/south gradient observed by the ground-based measurements is rather well captured by the simulations using prior and MEIC inventories (Figure 3b,c), the model tends to overestimate concentrations in the North China Plain (NCP) and underestimate them in the western, northeastern, and southern regions except in the Pearl River Delta (PRD) (Figure 3d) for 2015. It is worth noting that this behavior is similar in simulations using posterior emissions (not shown). In 2019, we observe the same north/south pattern with an underestimation in the south (except in the PRD) and an overestimation in the NCP region (Figure S2).
The statistics of the comparison between the simulations and the surface measurement are reported in Table 2.
For 2015, the annual mean of surface NO2 concentrations calculated from hourly concentrations at the stations is 27.4 µg/m3 over East China. The annual mean value of NO2 Conc_Prior15 and NO2 Conc_Post15 are higher than the stations’ mean value, whereas NO2 Conc_MEIC15 is smaller, suggesting that while NO2 Conc_Prior15 and NO2 Conc_Post15 tend to overestimate measured surface concentrations, NO2 Conc_MEIC15 underestimates them. Note that the annual mean value of NO2 Conc_Post15 is slightly closer to the stations (~4.7%) than NO2 Conc_Prior15 (~6.6%) and NO2 Conc_MEIC15 (~−7%). In 2019, the annual mean value of NO2 Conc_Post19 (29.5 µg/m3) is also slightly closer to the stations (24.8 µg/m3) than NO2 Conc_Prior19 is (30.3 µg/m3).
The other statistical indicators in Table 2 show also that they are globally slightly better for NO2 Conc_Post than for NO2 Conc_Prior for the two years and for NO2 Conc_MEIC for 2015. The larger impact of the use of the posterior emissions to simulate NO2 concentrations is visible on the NMB, which decrease by about 30% and 15% compared to the prior in 2015 and 2019, respectively.
These first results suggest that the CIF-CHIMERE system constrained with OMI NO2 observations behaves as expected, bringing the simulated NO2 concentrations closer to the truth—given by the surface measurements—when the emissions estimates are used in a CTM. However, it is worth noting that the improvement remains small.
To complete this global evaluation of Chinese annual means, we also evaluated the statistics, station by station, to see how homogeneous they are over the domain and if spatial features appear. As described in Section 2, we calculated the ratios of the experiment and control run statistical indicators (r ratios, mean bias ratios, and RMSE ratios) at each station (Figure 4 for 2019, Figure S3 for 2015 and Ratios in the Supplementary Material). The r ratios are mainly larger than one for most stations both in 2015 and 2019, showing a better agreement with the surface measurements in terms of temporal correlation when the Emis_Post is used to simulate NO2 concentrations. The improvement is more significant in the south of the domain, especially in the highly urbanized locations of the PRD and the Yangtze River Delta (YRD). The improvement is relatively small, but it might be explained by the fact the correlation coefficient is calculated on hourly concentrations, whereas the emissions are corrected on a monthly basis (Section 2). Concerning the mean bias and the RMSE, the situation is more contrasted with ratios smaller than one (showing an improvement), mainly above the most urbanized area of the PRD, Wuhan, and YRD. This is particularly the case in 2019. In these regions, the reduction of the mean bias of the simulated NO2 concentrations compared to the surface measurements can reach up to 30–40% when the posterior emission estimates are used.
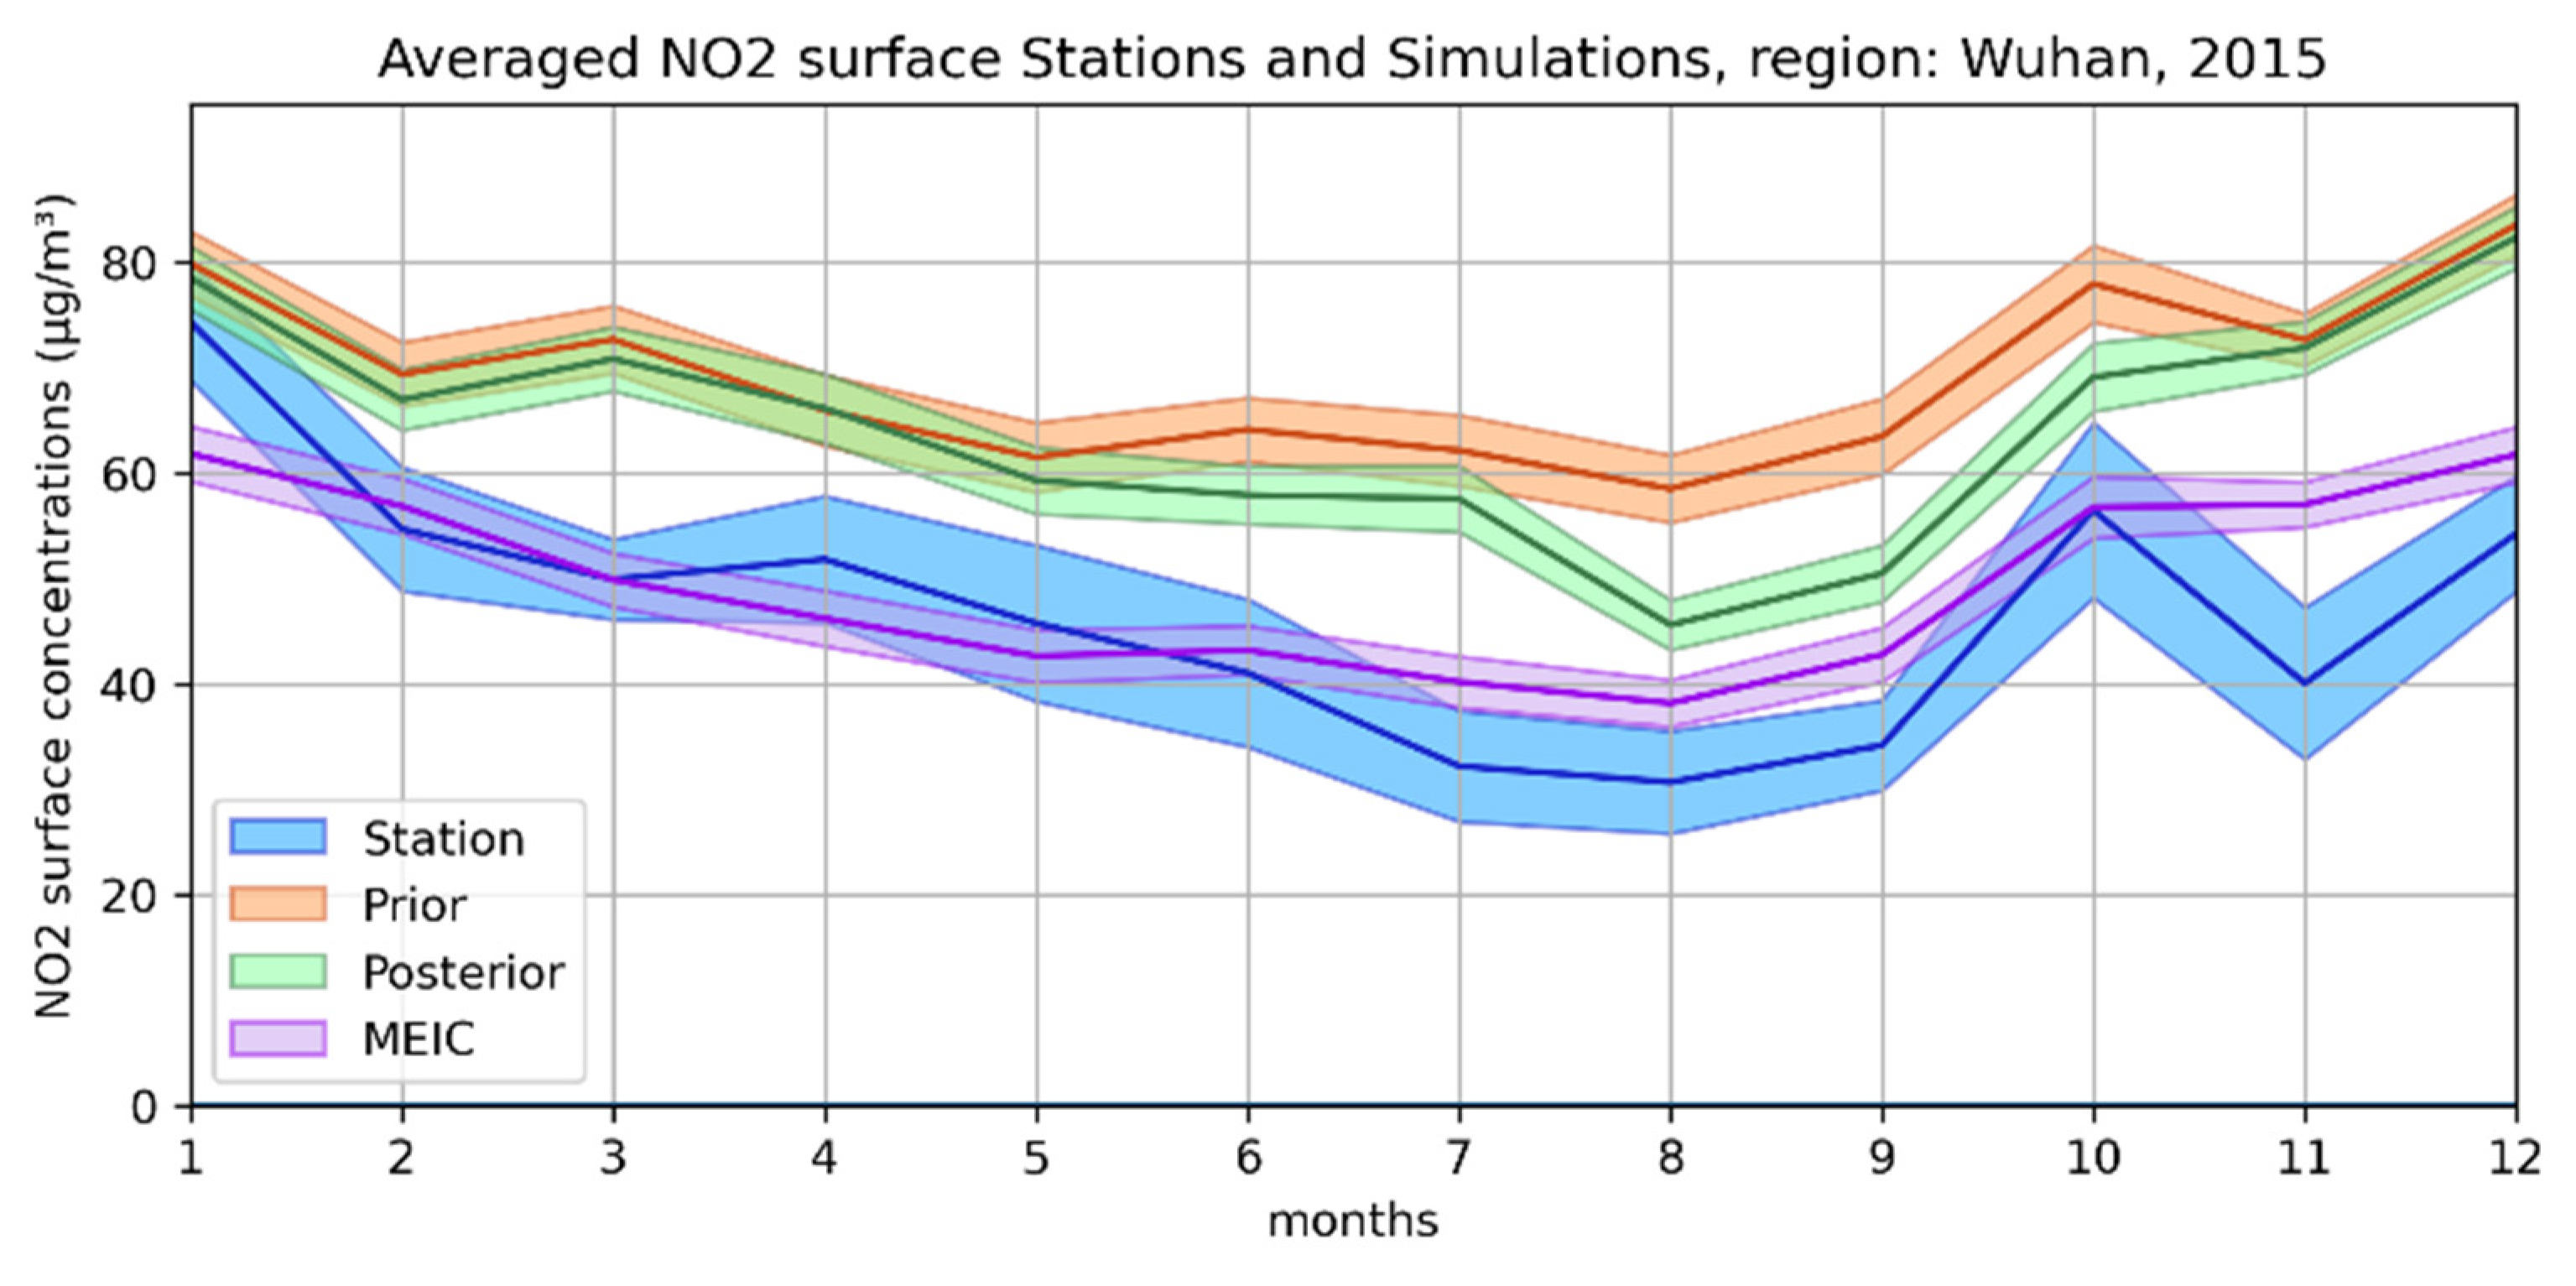
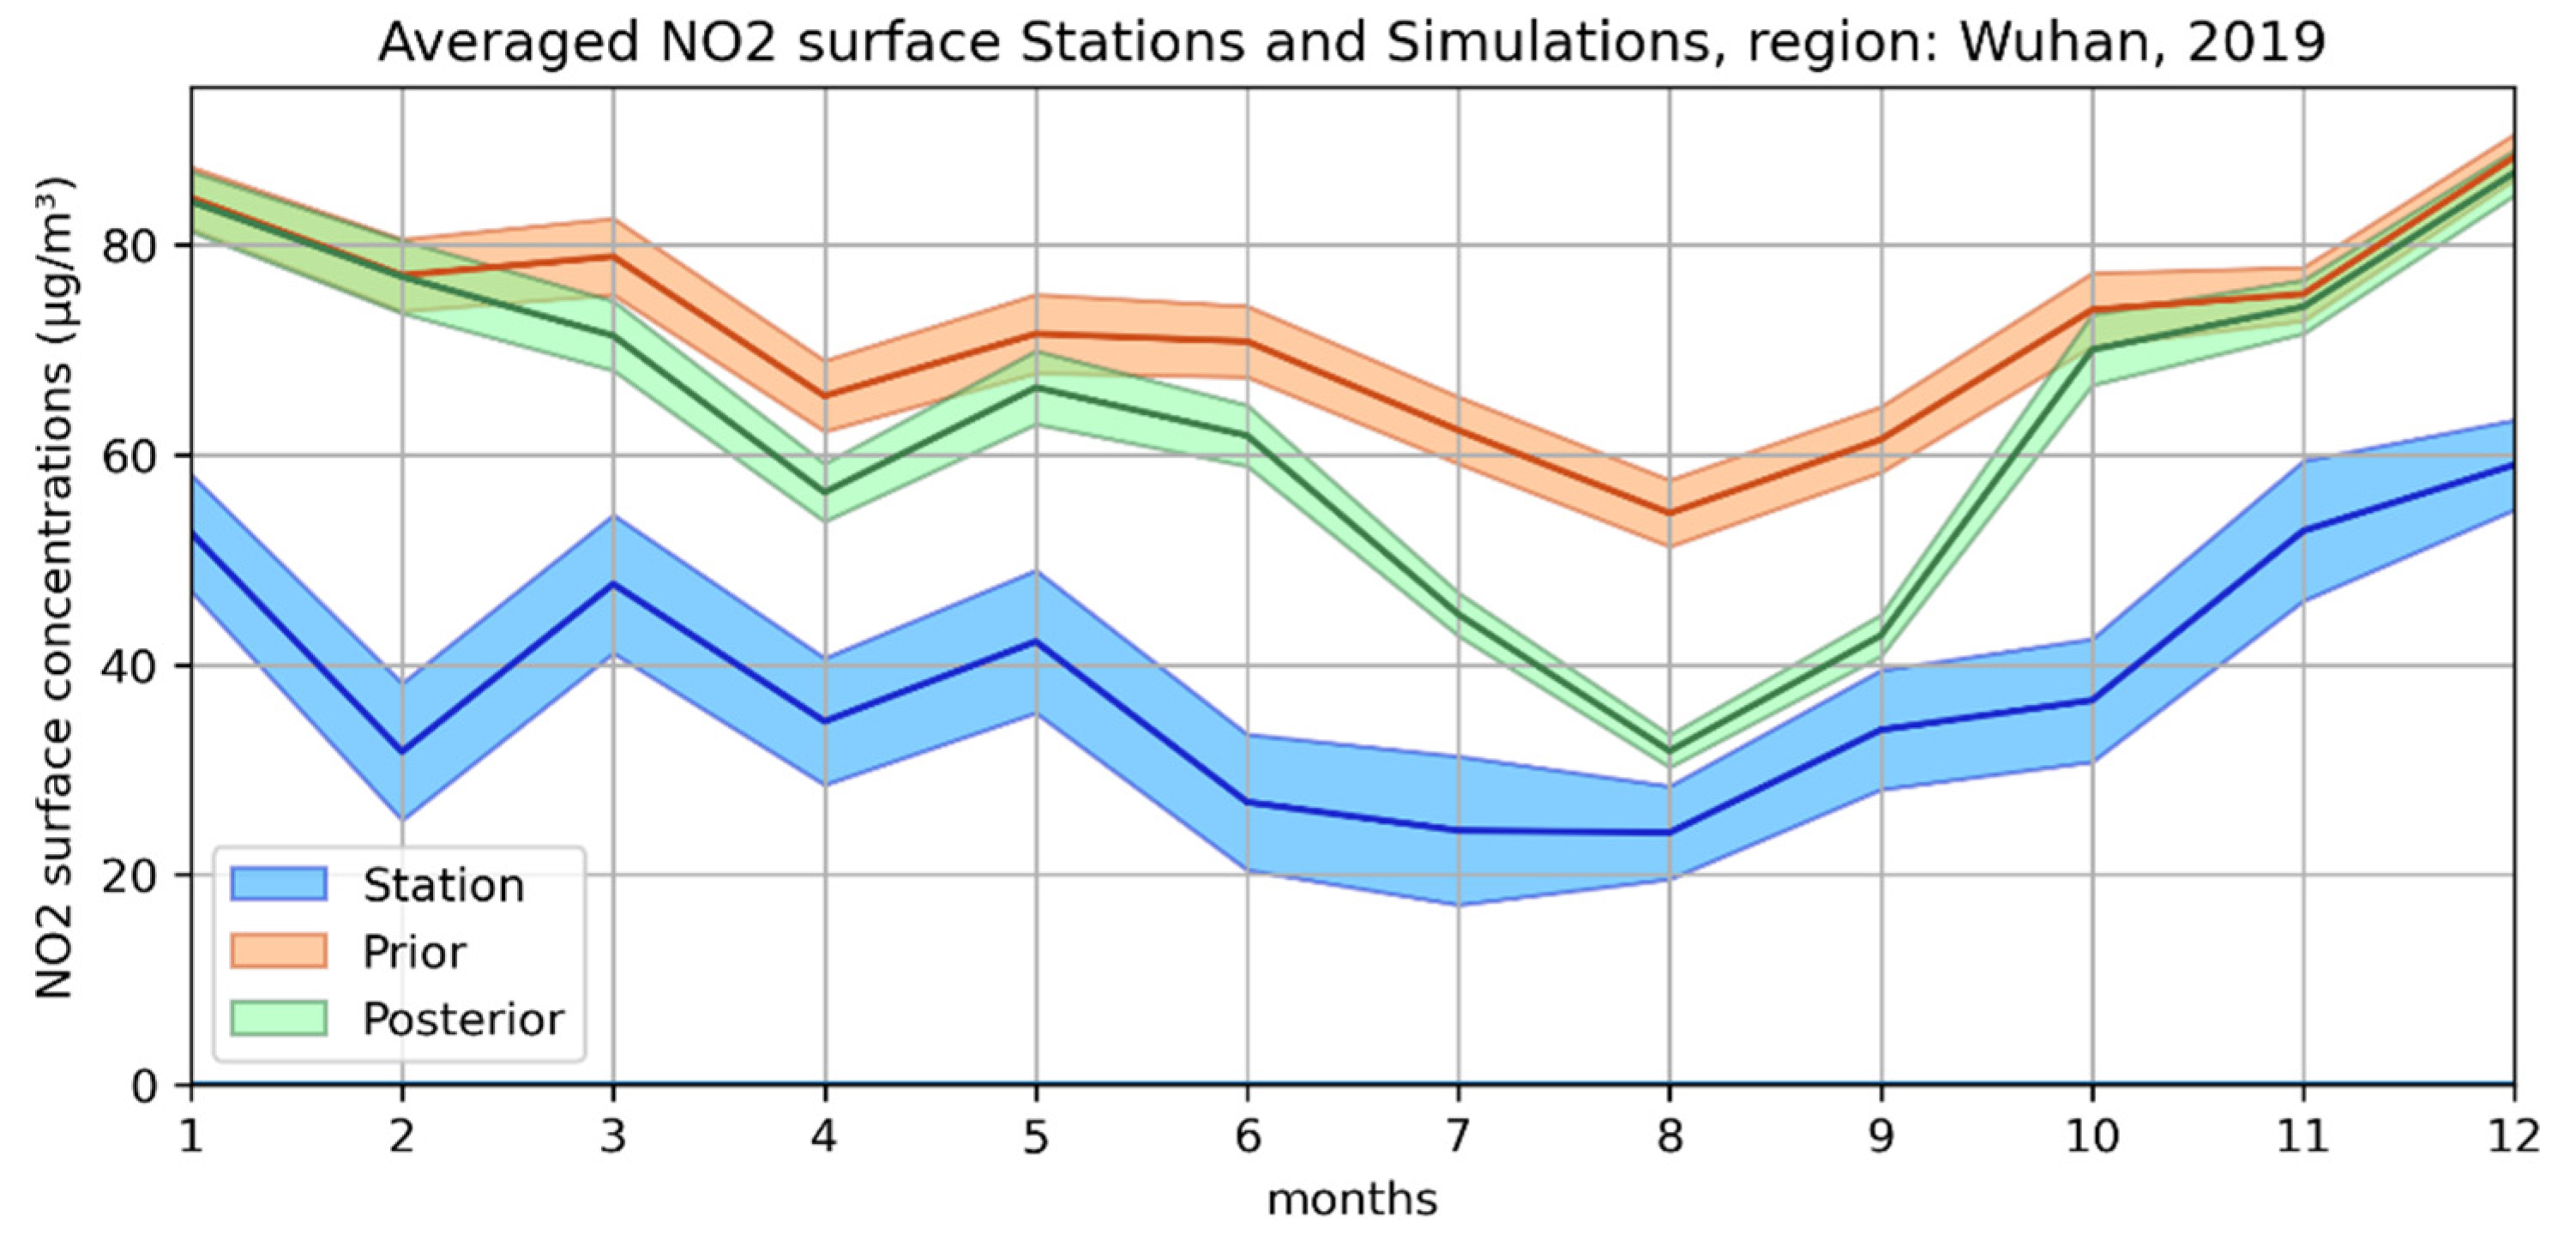
As a result of these analyses, the inversions using OMI observations and CIF-CHIMERE seem to correct NOx emissions towards the truth as the NO2 concentrations simulated using these emissions are closer to the surface measurements. The improvements compared to the surface measurements remain small over the whole domain, but are much more significant in large urbanized regions suggesting that the OMI NO2 observations allow a better constrain on polluted regions than on background regions. Figure 5 show an example of the comparison of monthly averaged NO2 surface concentrations from simulations and stations for 2015 and 2019 for Wuhan, where the emission corrections are the largest.
The stations selected for this comparison correspond to grid cells in Wuhan with minimum 60 kT emissions (Figures S4 and S5). In both years, simulations using prior NOx emission inventory overestimate NO2 surface concentrations compared to the stations. Using posterior NOx emission inventory decreases the differences between simulated NO2 surface concentrations and measurements, especially from May to October 2015 and March to October 2019. In both years, the highest decrease is in the summer months (−22% in August 2015 and −42% in August 2019).

3.2. Analysis of the Estimated Chinese Annual Anthropogenic NOx Emissions in 2015 and 2019

The annual NOx emission budget over East China and the larger domain of Figure 2 are reported in Table 3 for several inventories. In 2015, the MEIC inventory gives NOx emissions 12.8% smaller than our estimation for East China. Liu et al. [64] estimates NOx emissions for 2015 using the DECSO algorithm [34] also combining CHIMERE v2013b and OMI but a different version (DOMINO v2 [39]), with a finer resolution (0.25° × 0.25°). According to this study, their annual anthropogenic NOx budget estimation (21.5 Tg) is calculated over the entire domain of Figure 2, also including, e.g., the Korean Peninsula, a part of Japan, and is 5.2% larger than our calculations (Table 3).
The different emission inventories are in rather good agreement, especially when comparing to the typical emission uncertainties (30–50%). This is particularly the case for two based on top-down approaches involving OMI observations and the CHIMERE model.
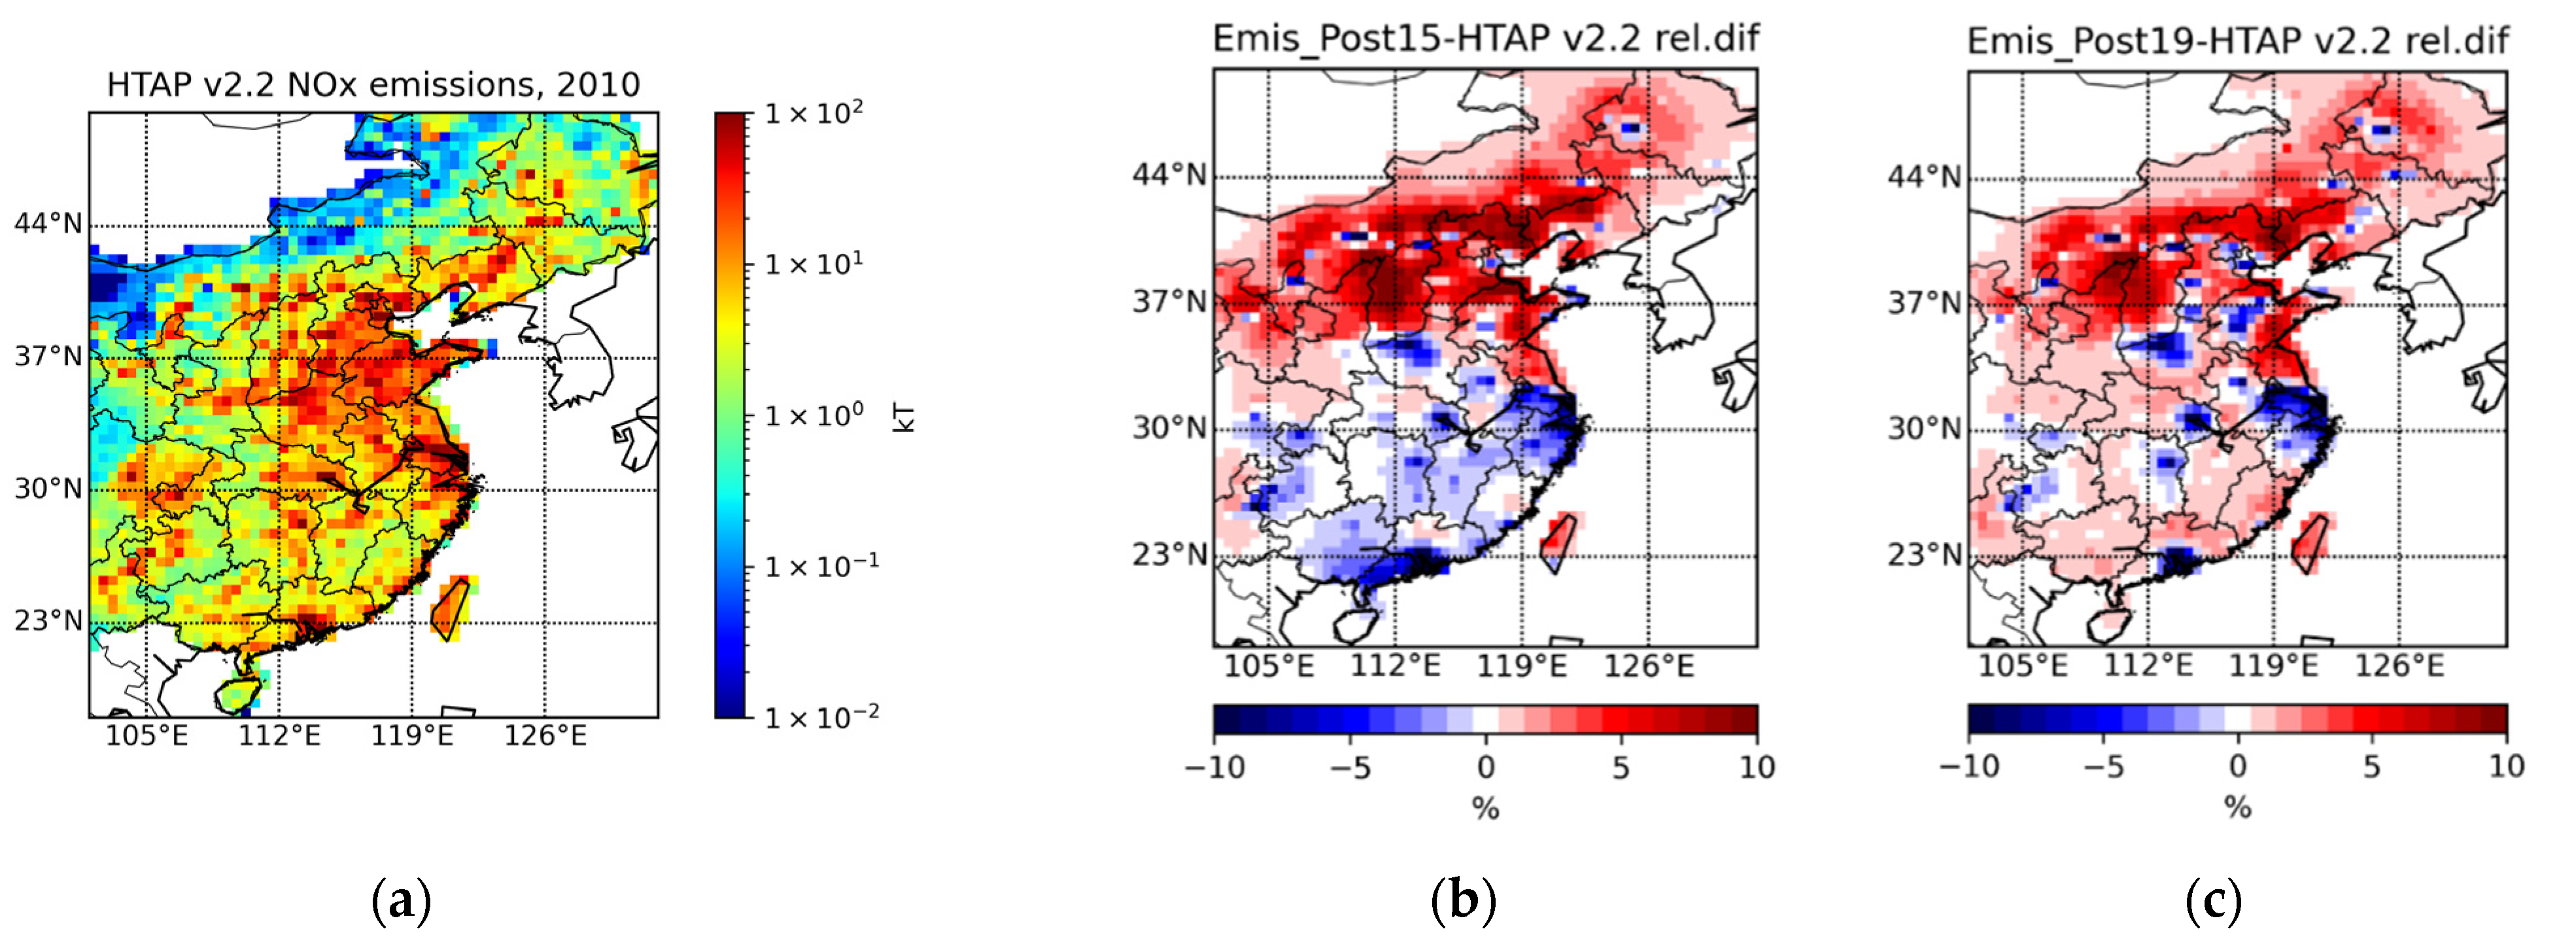
The global annual NOx emission budget over East China does not show significant changes from 2010 to 2019. However, significant spatial differences between HTAP v2.2 for 2010 and Emis_Post15 and Emis_Post19 inventories are visible as shown in Figure 6.
In 2015 and 2019, a global increase compared to 2010 is estimated in the northern part of China and a decrease in the south and large urbanized and industrialized locations. When the emissions are reduced compared to 2010, this reduction remains moderate and varies from region to region. For some locations, such as PRD, the reduction can reach up to −12% in 2015, which is in fairly good agreement with the 12th Five Year Plan’s nationwide target of a 10% reduction for 2015 compared to 2010 [9]. In 2019, the estimated reduction is more confined around urbanized locations than in 2015, especially in the south.
To evaluate how important these reductions in NOx emissions are between 2015 and 2019, we analyzed the relative differences between the posterior emissions for 2019 and 2015 (Figure S6). The differences between these two years range from ±8% at the pixel scale. In the south, the emissions tend to slightly increase in 2019 compared to 2015; on the contrary, in the north and the locations such as Wuhan, YRD, and NCP, the emission reduction continues between 2015 and 2019 showing that the regulation effects are still ongoing. However, the reductions are smaller than 5%, below the expected levels in the 13th Five-Year Plan in which the emissions should decrease by 15% compared to 2015 [12]. It is important to note that the changes in emissions inferred from our inversions as well as the target reductions of the 12th and 13th Five-Year Plans are smaller than the commonly assessed uncertainties on the emissions (30–50%).

3.3. Analysis of the Estimated Annual Anthropogenic NOx Emissions at Selected Urbanized and Industrialized Locations

3.3.1. Evaluation of the Estimated Annual Anthropogenic NOx Emissions in 2015 and 2019

As discussed in Section 3.1, the inversions seem more relevant in polluted regions. We analyze emission changes focusing on the most urbanized and industrialized locations. For this, we select only the locations with a minimum of NOx emissions of 60 kt for 2010, which should represent the most urbanized and industrialized locations, where we expect stronger emissions control (Figure S4). According to this selection, we have detected 15 locations reported from the north to the south, in Table 4. They are also reported in Figure 2.
In 8 out of 15 locations (Daqing, Beijing–Tianjin (BT), Shandong, Henan, Anhui, YRD, Wuhan, and Hunan), there is a decrease in NOx annual emission budget between 2010, 2015, and 2019 (Table S1). The highest decrease is observed in Baotou in 2015, with a 14.8% decrease, and in Wuhan in 2019, with a 14.9% decrease. Four locations (Baotou, Chengdu, Chongqing, and PRD) show a reduction in 2015 compared to 2010 but an increase in 2019 compared to 2015. At two locations, Shenyang and Shijiazhuang, NOx emissions increase in 2015 but decrease in 2019 compared to 2010. Dalian is the only location where estimated NOx emissions for 2015 and 2019 are higher than HTAP v2.2 emissions in 2010, but a decrease is observed between 2015 and 2019. Finally, there are no locations that show a monotonic increase between 2010, 2015 and 2019.
The annual emission budgets derived from the independent MEIC inventory for each location are also reported in Table 4 for comparison. The estimated posterior NOx emissions for 2015 are closer to MEIC emissions at all locations, except for Shijiazhuang, Chengdu, and Hunan. Note that the correction of the emissions (Emis_Post-HTAP v2.2) is relatively small in Shijiazhuang, with only 0.75% corrections. In Chengdu and Hunan, MEIC NOx emissions are higher than HTAP v2.2 emissions, whereas the inversion tends to decrease them. These results also suggest that the corrections made to the emissions during the inversion are consistent.

3.3.2. Monthly Evaluation of the Anthropogenic NOx Emissions

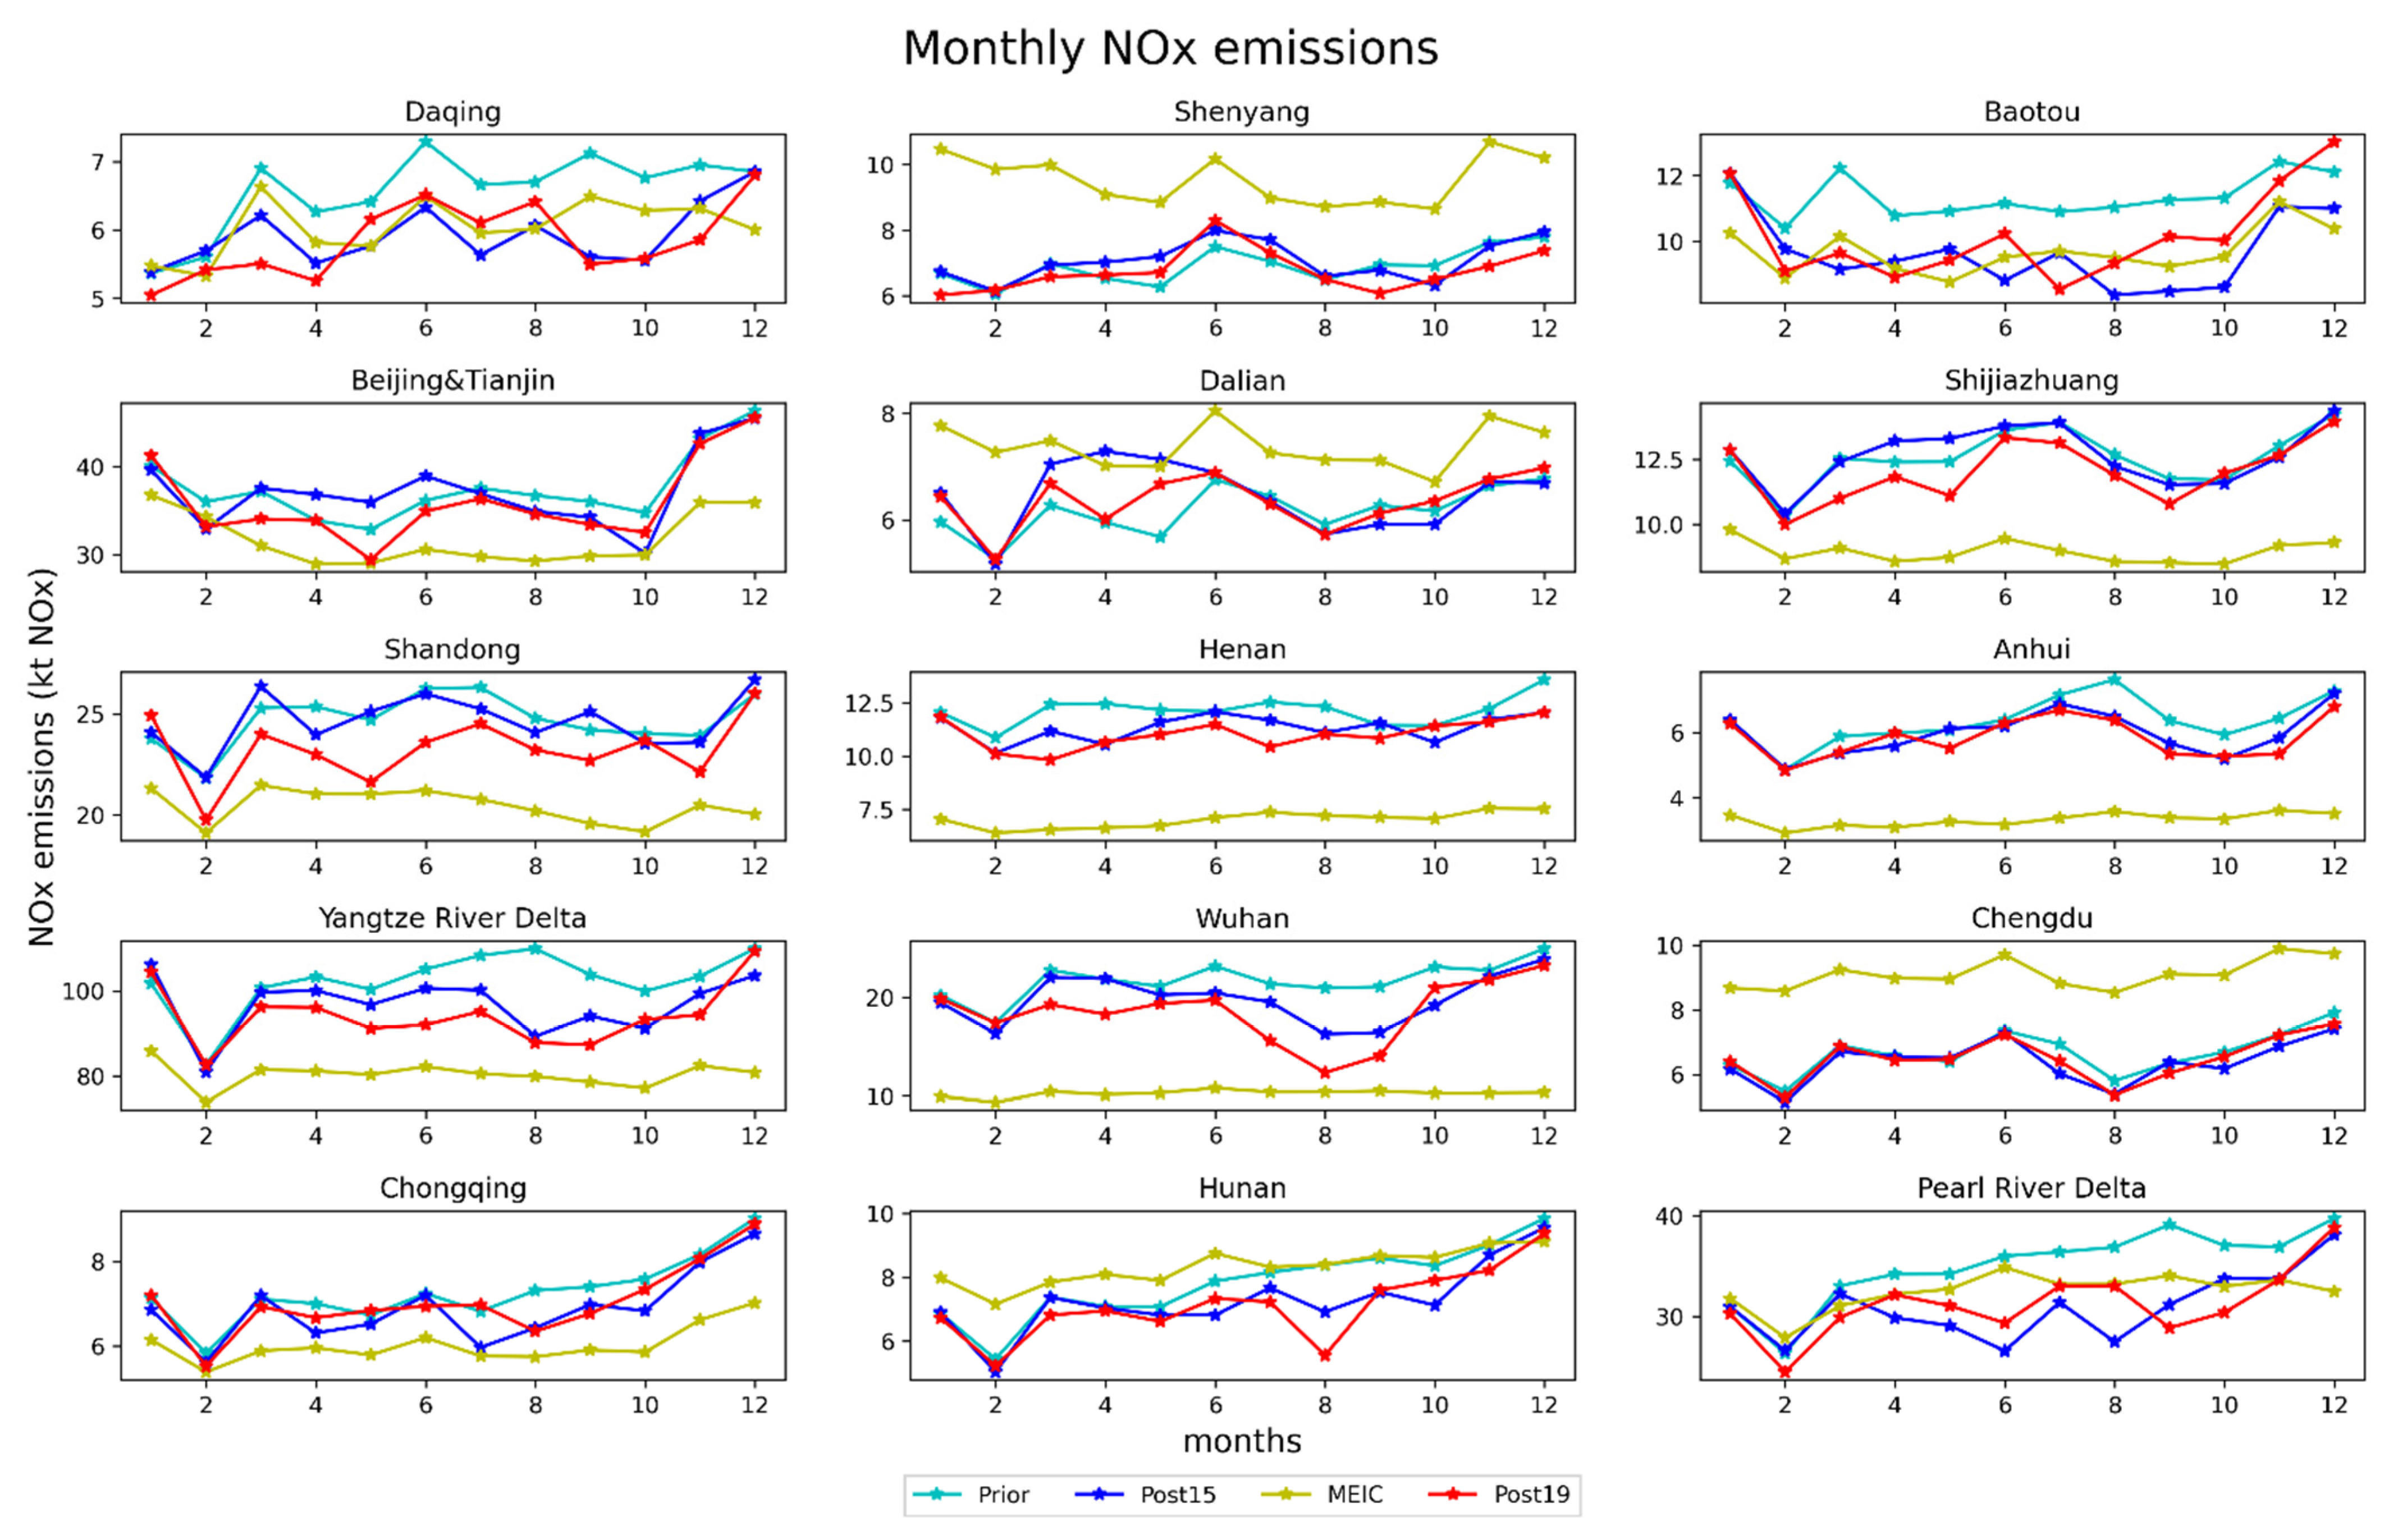
Figure 7 shows the time series of monthly anthropogenic NOx emissions for the different emission inventories considered in this study. In terms of seasonal variations, NOx emissions are larger during wintertime, especially in December, at all the locations. However, a drop is observed for most of the locations in February, likely related to the Chinese New Year. This temporal evolution is consistent with the study of Ding et al. [23], in which a 10% reduction in February is estimated because of the Spring Festival and a peak is observed in December.
For the winter months, very few emissions changes between the years (2010, 2015 and 2019) are observed. These very small changes may be explained either because prior emissions do not need to be corrected or because the emissions remained stable between the years or because few or no observations are available to constrain the inverse modeling system (2010 being also used as prior emissions). For example, the latter is the case in Daqing for January and December 2015, where no OMI observation data are available over the location.
At Daqing, Baotou, Henan, YRD, and PRD, posterior emissions decrease compared to 2010 throughout both years, with the largest reduction in YRD and PRD during summertime, 20% and 26%, respectively.
At Wuhan, Chongqing, Hunan, and Anhui, there are no significant changes in the NOx emissions between 2010, 2015 and 2019 in the first half of the year, but a decrease compared to 2010 occurs mainly in the second half of the years, with the highest reduction observed in Wuhan (22% in 2015 and 41% in 2019) in August.
In the northern locations, particularly around the Yellow Sea, such as Dalian, BT, and Shijiazhuang, the 2015 emissions are increased during spring compared to 2010. The emissions decrease between 2015 and 2019 and come back to the 2010 levels for Dalian and BT and below the 2010 levels for Shijiazhuang.
In the southern locations (below 33° N), such as Anhui, YRD, Wuhan, Chongqing, Hunan, and PRD, 2015 and 2019, emissions are reduced compared to 2010, especially during the summer months. It is worth noting that the summer months correspond to the months where we have more days with OMI observations.
Concerning the MEIC inventory for 2015, MEIC shows lower emissions than the 2010 HTAP inventory over the year 2015 in almost all locations, except in Shenyang, Dalian, Chengdu, and Hunan where MEIC shows larger emissions in 2015 compared to 2010 (HTAP). Note that, as already noticed on the global analysis, the Emis_Post15 emission estimations tend to get closer to the MEIC inventory.

3.3.3. Comparison with In-Situ Stations

The NO2 surface concentrations simulated using Emis_Post for 2015 and 2019 as well as the ones simulated using MEIC15 are compared with ground-based measurements at each of the 15 selected locations. The statistics of the comparison are displayed in Tables S2 and S3. As for Section 3.1, the comparison results of the concentrations simulated in the control runs and the surface measurements are also reported in Tables S2 and S3. In 2015, the Emis_Post15 emissions allow the improvement of the simulated NO2 surface concentrations compared to these simulated in the control runs for nine locations in terms of NMB, RMSE and/or r. In 2019, this number increases to 13 locations but the NMB tends to be larger than in 2015. This is consistent with the results discussed in Section 3.1, showing that the CIF-CHIMERE system constrained by OMI observations performs as expected.
By comparison, the use of MEIC15 emissions to simulate NO2 concentrations in 2015 gives better statistics for eight locations compared to the emission estimated in this study for 2015. The better performances when using MEIC emissions correspond to locations where the MEIC emissions are significantly smaller than the Emis_Post15 and HTAP v2.2 (Beijing-Tianjin, Shijiazhuang, Shandong, Henan, Anhui, YRD, and Wuhan). This point out that the posterior emission corrections derived from OMI observations and the CIF-CHIMERE are likely underestimated. This might be partly explained by the limited daily spatial coverage of OMI measurements, which does not allow sufficient corrections of the emissions. TROPOMI satellite instrument observations with their better spatial resolution and coverage should help resolving this issue. On the contrary, when MEIC15 emissions are larger than Emis_Post15 or HTAP v2.2, a degradation of the statistics is observed compared to Conc_Post15 (Dalian, Chengdu, Hunan, PRD), suggesting that MEIC overestimate emissions at these locations. These results illustrate the complementariness of bottom-up and top-down approaches to assess NOx emissions and the need of robust ground-based measurement network to evaluate the emissions inventories.

4. Conclusions

This study estimates anthropogenic NOx emissions over Eastern China for 2015 and 2019 using the new inverse modeling system CIF-CHIMERE and OMI NO2 satellite observations. One of the objectives was to evaluate if this new inversion system constrained by OMI observations can infer emissions closer to the truth. As true emissions are unknown, ground-based measurements of NO2 surface concentrations are considered as the reference to evaluate the emission estimates indirectly. The analyses performed in this study show that using the NOx emissions estimates to simulate NO2 surface concentrations improves the comparison with ground-based measurements, as is expected when atmospheric inversion approaches are applied. The results also suggest that the OMI observations provide a better constraint to the NOx emissions in the polluted areas compared to the background areas.
The annual anthropogenic NOx emission budgets estimated in this study for East China are in fairly good agreement with the annual emission budgets derived from independent inventories such as MEIC (~13%) and DECSO (~5%) when considering the uncertainties on NOx emissions (30–50%). Nevertheless, the analysis at the finer spatial scale of the most populated and urbanized locations of East China shows situations more contrasted. In terms of the evolution of the emissions between 2010, 2015, and 2019, according to our emissions’ estimates, some locations such as Baotou, PRD, and Wuhan show a reduction of emissions between 2010 and 2015 close to the target reduction defined in the 12th Five-Year Plan. The evolution of the emissions between 2015 and 2019 is rather small. Our estimates show very slightly increased emissions, mainly in the southern locations, and a small decrease (<5%) in the NCP or locations such as Wuhan and the YRD. The comparison of our emission estimates with MEIC emissions in 2015 stresses that our estimates likely underestimate the emission reductions between 2010 and 2015 in the most polluted locations of East China. In parallel, our emission estimates, when used to simulate NO2 surface concentrations, lead to a better agreement with surface measurements in regions where MEIC indicates an increase of the emissions compared to 2010—our estimates often suggest reduced or stable emissions. These results illustrate the benefit of having a variety of inventories derived from different approaches and of using their complementariness to assess NOx emissions better. They also stress the need for a robust ground-based measurement network to evaluate the emission inventories.

Supplementary Materials

The following supporting information can be downloaded at: https://www.mdpi.com/article/10.3390/atmos14010154/s1, Figure S1: Monthly Corrections of NOx emissions for August 2015. Figure S2: Spatial distribution of annual mean surface NO2 concentrations: (a) Stations; (b) CHIMERE using prior emissions (Conc_Prior19), (c) Mean bias calculated by the mean differences between Conc_Prior19 and stations for 2019. Figure S3: Ratios of the Conc_Prior and Conc_Post’s statistical indicators: Correlation Coefficient, Mean Bias and RMSE, respectively, for (a–c) 2015. Figure S4: HTAP v2.2 NOx Emissions after applying the 60 kt threshold (2010) to determine the selection of the locations. The remaining 0.5° × 0.5° grid cells correspond to the selected locations considered in the Figure 2. Figure S5: Ground-Based Stations according to the selected locations. Figure S6: Relative differences of NO2 Conc_Prior for 2019 and 2015. Table S1: Relative Differences of annual NOx emission budgets at the 15 selected locations. Tables S2 and S3: NO2 Annual Mean surface concentrations and statistics of the 15 selected locations for (top) 2015 and, (bottom) 2019. Equations (S1)–(S3): Statistical Indicators: Pearson’s Correlation Coefficient, NMB and RMSE formulas. Equations (S4)–(S6): r ratios, MB ratios and RMSE ratios.

Author Contributions

Conceptualization, D.S., G.D. and A.C.; methodology, D.S., G.D. and A.C.; software, D.S., A.C., A.F.-C., G.B., I.P. and A.B.; formal analysis, D.S.; investigation, D.S., G.D. and A.C.; resources, A.C., G.S. and B.B.; data curation, D.S., A.C., G.S., A.F.-C., A.B. and B.B.; writing—original draft preparation, D.S. and G.D.; writing—review and editing, D.S., G.D., A.C., G.S., A.F.-C., G.B., I.P., A.B. and B.B.; visualization, D.S.; supervision, G.D.; project administration, G.D.; funding acquisition, G.D. All authors have read and agreed to the published version of the manuscript.

Funding

D.S. was supported by the National Center for Spatial Studies (CNES) PhD program and the French National Research Agency (ANR) project, grant ANR-19-CE01-0007. This research was funded by CNES, grant ARGOS/TOSCA.

Data Availability Statement

The CHIMERE regional chemistry transport model [36] and its technical documentation is available via the GNU General Public License with registration and can be found here: www.lmd.polytechnique.fr/chimere/ (accessed on 6 October 2022). The anthropogenic emission inventory HTAP v2.2. used as the prior for 2010 is found here: https://edgar.jrc.ec.europa.eu/dataset_htap_v2 (accessed on 6 October 2022). The estimated posterior NOx emission data generated for this study are available on request from the corresponding authors. The tropospheric NO2 column data from the OMI sensor are found on the TEMIS portal: www.temis.nl (accessed on 6 October 2022). The MEIC v1.3 data is available on here: http://meicmodel.org/ (accessed on 6 October 2022). Chinese in-situ NO2 concentrations are found here: http://www.cnemc.cn/en/ (accessed on 6 October 2022).

Acknowledgments

We greatly acknowledge the free use of the tropospheric NO2 column data from the OMI sensor from TEMIS portal and the MEIC emission data from Tsinghua University. We also thank China’s National Environmental Monitoring Centre for in-situ measurements.

Conflicts of Interest

The authors declare no conflict of interest.

References

  1. Seinfeld, J.H.; Pandis, S.N. Atmospheric Chemistry and Physics: From Air Pollution to Climate Change; John Wiley & Sons: Hoboken, NJ, USA, 2016. [Google Scholar]
  2. Ng, N.L.; Chhabra, P.S.; Chan, A.W.H.; Surratt, J.D.; Kroll, J.H.; Kwan, A.J.; McCabe, D.C.; Wennberg, P.O.; Sorooshian, A.; Murphy, S.M.; et al. Effect of NOx level on secondary organic aerosol (SOA) formation from the photooxidation of terpenes. Atmos. Chem. Phys. 2007, 7, 5159–5174. [Google Scholar] [CrossRef] [Green Version]
  3. Atkinson, R. Atmospheric chemistry of VOCs and NOx. Atmos. Environ. 2000, 34, 2063–2101. [Google Scholar] [CrossRef]
  4. Houghton, J.T.; Ding, Y.; Griggs, D.J.; Noguer, M.; van der Linden, P.J.; Dai, X.; Maskell, K.; Johnson, C.A. (Eds.) IPCC, 2001: Climate Change 2001: The Scientific Basis. Contribution of Working Group I to the Third Assessment Report of the Intergovernmental Panel on Climate Change; Cambridge University Press: Cambridge, UK; New York, NY, USA, 2001. [Google Scholar]
  5. Almaraz, M.; Bai, E.; Wang, C.; Trousdell, J.; Conley, S.; Faloona, I.; Houlton, B.Z. Agriculture is a major source of NOx pollution in California. Sci. Adv. 2018, 4, eaao3477. [Google Scholar] [CrossRef] [PubMed] [Green Version]
  6. Granier, C.; Bessagnet, B.; Bond, T.; D’Angiola, A.; Denier van der Gon, H.; Frost, G.J.; Heil, A.; Kaiser, J.W.; Kinne, S.; Klimont, Z.; et al. Evolution of anthropogenic and biomass burning emissions of air pollutants at global and regional scales during the 1980–2010 period. Clim. Change 2011, 109, 163–190. [Google Scholar] [CrossRef]
  7. Shaw, S.; Van Heyst, B. Nitrogen Oxide (NOx) emissions as an indicator for sustainability. Environ. Sustain. Indic. 2022, 15, 100–188. [Google Scholar] [CrossRef]
  8. Jin, Y.; Andersson, H.; Zhang, S. Air Pollution Control Policies in China: A Retrospective and Prospects. Int. J. Environ. Res. Public. Health 2016, 13, 1219. [Google Scholar] [CrossRef] [Green Version]
  9. de Foy, B.; Lu, Z.; Streets, D.G. Satellite NO2 retrievals suggest China has exceeded its NOx reduction goals from the twelfth Five-Year Plan. Sci. Rep. 2016, 6, 35912. [Google Scholar] [CrossRef] [Green Version]
  10. CAA (Clean Air Asia). China Air 2016—Air Pollution Prevention and Control Progress in Chinese Cities. 2016. Available online: http://www.allaboutair.cn/a/cbw/bg/2016/0822/472.html (accessed on 4 October 2022).
  11. Anger, A.; Dessens, O.; Xi, F.; Barker, T.; Wu, R. China’s air pollution reduction efforts may result in an increase in surface ozone levels in highly polluted areas. Ambio 2016, 45, 254–265. [Google Scholar] [CrossRef] [Green Version]
  12. Notice of the State Council on Printing and Distributing the “13th Five-Year” Ecological and Environmental Protection Plan_Government Information Disclosure Column. Available online: http://www.gov.cn/zhengce/content/2016-12/05/content_5143290.htm (accessed on 25 November 2022).
  13. Colette, A.; Granier, C.; Hodnebrog, Ø.; Jakobs, H.; Maurizi, A.; Nyiri, A.; Rao, S.; Amann, M.; Bessagnet, B.; d’Angiola, A.; et al. Future air quality in Europe: A multi-model assessment of projected exposure to ozone. Atmos. Chem. Phys. 2012, 12, 10613–10630. [Google Scholar] [CrossRef] [Green Version]
  14. Zhao, Y.; Zhang, J.; Nielsen, C.P. The effects of energy paths and emission controls and standards on future trends in China’s emissions of primary air pollutants. Atmos. Chem. Phys. 2014, 14, 8849–8868. [Google Scholar] [CrossRef]
  15. Permadi, D.A.; Kim Oanh, N.T.; Vautard, R. Integrated emission inventory and modeling to assess distribution of particulate matter mass and black carbon composition in Southeast Asia. Atmos. Chem. Phys. 2018, 18, 2725–2747. [Google Scholar] [CrossRef] [Green Version]
  16. Elguindi, N.; Granier, C.; Stavrakou, T.; Darras, S.; Bauwens, M.; Cao, H.; Chen, C.; Denier van der Gon, H.A.C.; Dubovik, O.; Fu, T.M.; et al. Intercomparison of Magnitudes and Trends in Anthropogenic Surface Emissions From Bottom-Up Inventories, Top-Down Estimates, and Emission Scenarios. Earths Future 2020, 8, e2020EF001520. [Google Scholar] [CrossRef]
  17. Xia, Y.; Zhao, Y.; Nielsen, C.P. Benefits of China’s efforts in gaseous pollutant control indicated by the bottom-up emissions and satellite observations 2000–2014. Atmos. Environ. 2016, 136, 43–53. [Google Scholar] [CrossRef]
  18. Shi, Y.; Xia, Y.; Lu, B.; Liu, N.; Zhang, L.; Li, S.; Li, W. Emission inventory and trends of NOx for China, 2000–2020. J. Zhejiang Univ. Sci. A 2014, 15, 454–464. [Google Scholar] [CrossRef] [Green Version]
  19. Li, M.; Zhang, Q.; Kurokawa, J.; Woo, J.-H.; He, K.; Lu, Z.; Ohara, T.; Song, Y.; Streets, D.G.; Carmichael, G.R.; et al. MIX: A mosaic Asian anthropogenic emission inventory under the international collaboration framework of the MICS-Asia and HTAP. Atmos. Chem. Phys. 2017, 17, 935–963. [Google Scholar] [CrossRef] [Green Version]
  20. Zheng, B.; Tong, D.; Li, M.; Liu, F.; Hong, C.; Geng, G.; Li, H.; Li, X.; Peng, L.; Qi, J.; et al. Trends in China’s anthropogenic emissions since 2010 as the consequence of clean air actions. Atmos. Chem. Phys. 2018, 18, 14095–14111. [Google Scholar] [CrossRef] [Green Version]
  21. Zhao, Y.; Zhang, J.; Nielsen, C.P. The effects of recent control policies on trends in emissions of anthropogenic atmospheric pollutants and CO2 in China. Atmos. Chem. Phys. 2013, 13, 487–508. [Google Scholar] [CrossRef] [Green Version]
  22. Crippa, M.; Guizzardi, D.; Muntean, M.; Schaaf, E.; Dentener, F.; van Aardenne, J.A.; Monni, S.; Doering, U.; Olivier, J.G.J.; Pagliari, V.; et al. Gridded emissions of air pollutants for the period 1970–2012 within EDGAR v4.3.2. Earth Syst. Sci. Data 2018, 10, 1987–2013. [Google Scholar] [CrossRef] [Green Version]
  23. Ding, J.; Miyazaki, K.; van der A, R.J.; Mijling, B.; Kurokawa, J.; Cho, S.; Janssens-Maenhout, G.; Zhang, Q.; Liu, F.; Levelt, P.F. Intercomparison of NOx emission inventories over East Asia. Atmos. Chem. Phys. 2017, 17, 10125–10141. [Google Scholar] [CrossRef] [Green Version]
  24. de Foy, B.; Wilkins, J.L.; Lu, Z.; Streets, D.G.; Duncan, B.N. Model evaluation of methods for estimating surface emissions and chemical lifetimes from satellite data. Atmos. Environ. 2014, 98, 66–77. [Google Scholar] [CrossRef]
  25. Boersma, K.F.; Vinken, G.C.M.; Eskes, H.J. Representativeness errors in comparing chemistry transport and chemistry climate models with satellite UV–Vis tropospheric column retrievals. Geosci. Model Dev. 2016, 9, 875–898. [Google Scholar] [CrossRef] [Green Version]
  26. Leue, C.; Wenig, M.; Wagner, T.; Klimm, O.; Platt, U.; Jähne, B. Quantitative analysis of NOx emissions from Global Ozone Monitoring Experiment satellite image sequences. J. Geophys. Res. Atmos. 2001, 106, 5493–5505. [Google Scholar] [CrossRef] [Green Version]
  27. Cooper, M.; Martin, R.V.; Padmanabhan, A.; Henze, D.K. Comparing mass balance and adjoint methods for inverse modeling of nitrogen dioxide columns for global nitrogen oxide emissions. J. Geophys. Res. Atmos. 2017, 122, 4718–4734. [Google Scholar] [CrossRef]
  28. Han, K.M.; Kim, H.S.; Song, C.H. An Estimation of Top-Down NOx Emissions from OMI Sensor Over East Asia. Remote Sens. 2020, 12, 2004. [Google Scholar] [CrossRef]
  29. Itahashi, S.; Yumimoto, K.; Kurokawa, J.; Morino, Y.; Nagashima, T.; Miyazaki, K.; Maki, T.; Ohara, T. Inverse estimation of NOx emissions over China and India 2005–2016: Contrasting recent trends and future perspectives. Environ. Res. Lett. 2019, 14, 124020. [Google Scholar] [CrossRef] [Green Version]
  30. Martin, R.V. Global inventory of nitrogen oxide emissions constrained by space-based observations of NO2 columns. J. Geophys. Res. 2003, 108, 4537. [Google Scholar] [CrossRef] [Green Version]
  31. Napelenok, S.L.; Pinder, R.W.; Gilliland, A.B.; Martin, R.V. A method for evaluating spatially-resolved NOx emissions using Kalman filter inversion, direct sensitivities, and space-based NO2 observations. Atmos. Chem. Phys. 2008, 8, 5603–5614. [Google Scholar] [CrossRef] [Green Version]
  32. Kurokawa, J.; Yumimoto, K.; Uno, I.; Ohara, T. Adjoint inverse modeling of NOx emissions over eastern China using satellite observations of NO2 vertical column densities. Atmos. Environ. 2009, 43, 1878–1887. [Google Scholar] [CrossRef]
  33. van der A, R.J.; Mijling, B.; Ding, J.; Koukouli, M.E.; Liu, F.; Li, Q.; Mao, H.; Theys, N. Cleaning up the air: Effectiveness of air quality policy for SO2 and NOx emissions in China. Atmos. Chem. Phys. 2017, 17, 1775–1789. [Google Scholar] [CrossRef] [Green Version]
  34. Mijling, B.; van der A, R.J. Using daily satellite observations to estimate emissions of short-lived air pollutants on a mesoscopic scale. J. Geophys. Res. Atmos. 2012, 117, D17. [Google Scholar] [CrossRef]
  35. Ding, J.; van der A, R.J.; Mijling, B.; Levelt, P.F.; Hao, N. NOx emission estimates during the 2014 Youth Olympic Games in Nanjing. Atmos. Chem. Phys. 2015, 15, 9399–9412. [Google Scholar] [CrossRef] [Green Version]
  36. Menut, L.; Bessagnet, B.; Khvorostyanov, D.; Beekmann, M.; Blond, N.; Colette, A.; Coll, I.; Curci, G.; Foret, G.; Hodzic, A.; et al. CHIMERE 2013: A model for regional atmospheric composition modelling. Geosci. Model Dev. 2013, 6, 981–1028. [Google Scholar] [CrossRef] [Green Version]
  37. Li, M.; Liu, H.; Geng, G.; Hong, C.; Liu, F.; Song, Y.; Tong, D.; Zheng, B.; Cui, H.; Man, H.; et al. Anthropogenic emission inventories in China: A review. Natl. Sci. Rev. 2017, 4, 834–866. [Google Scholar] [CrossRef]
  38. MEIC. Available online: http://meicmodel.org/?page_id=541&lang=en (accessed on 27 September 2022).
  39. Boersma, K.F.; Eskes, H.J.; Dirksen, R.J.; van der A, R.J.; Veefkind, J.P.; Stammes, P.; Huijnen, V.; Kleipool, Q.L.; Sneep, M.; Claas, J.; et al. An improved tropospheric NO2 column retrieval algorithm for the Ozone Monitoring Instrument. Atmos. Meas. Tech. 2011, 4, 1905–1928. [Google Scholar] [CrossRef] [Green Version]
  40. Qu, Z.; Henze, D.K.; Worden, H.M.; Jiang, Z.; Gaubert, B.; Theys, N.; Wang, W. Sector-Based Top-Down Estimates of NOx, SO2, and CO Emissions in East Asia. Geophys. Res. Lett. 2022, 49, e2021GL096009. [Google Scholar] [CrossRef] [PubMed]
  41. Janssens-Maenhout, G.; Crippa, M.; Guizzardi, D.; Dentener, F.; Muntean, M.; Pouliot, G.; Keating, T.; Zhang, Q.; Kurokawa, J.; Wankmüller, R.; et al. HTAP_v2.2: A mosaic of regional and global emission grid maps for 2008 and 2010 to study hemispheric transport of air pollution. Atmos. Chem. Phys. 2015, 15, 11411–11432. [Google Scholar] [CrossRef] [Green Version]
  42. Henze, D.K.; Hakami, A.; Seinfeld, J.H. Development of the adjoint of GEOS-Chem. Atmos Chem Phys 2007, 7, 2413–2433. [Google Scholar] [CrossRef] [Green Version]
  43. Berchet, A.; Sollum, E.; Thompson, R.L.; Pison, I.; Thanwerdas, J.; Broquet, G.; Chevallier, F.; Aalto, T.; Berchet, A.; Bergamaschi, P.; et al. The Community Inversion Framework v1.0: A unified system for atmospheric inversion studies. Geosci. Model Dev. 2021, 14, 5331–5354. [Google Scholar] [CrossRef]
  44. Fortems-Cheiney, A.; Pison, I.; Broquet, G.; Dufour, G.; Berchet, A.; Potier, E.; Coman, A.; Siour, G.; Costantino, L. Variational regional inverse modeling of reactive species emissions with PYVAR-CHIMERE-v2019. Geosci. Model Dev. 2021, 14, 2939–2957. [Google Scholar] [CrossRef]
  45. Bocquet, M.; Elbern, H.; Eskes, H.; Hirtl, M.; Žabkar, R.; Carmichael, G.R.; Flemming, J.; Inness, A.; Pagowski, M.; Pérez Camaño, J.L.; et al. Data assimilation in atmospheric chemistry models: Current status and future prospects for coupled chemistry meteorology models. Atmos. Chem. Phys. 2015, 15, 5325–5358. [Google Scholar] [CrossRef]
  46. Gilbert, J.C.; Lemaréchal, C. Some numerical experiments with variable-storage quasi-Newton algorithms. Math. Program. 1989, 45, 407–435. [Google Scholar] [CrossRef] [Green Version]
  47. Rayner, P.J.; Michalak, A.M.; Chevallier, F. Fundamentals of data assimilation applied to biogeochemistry. Atmos. Chem. Phys. 2019, 19, 13911–13932. [Google Scholar] [CrossRef] [Green Version]
  48. Galmarini, S.; Koffi, B.; Solazzo, E.; Keating, T.; Hogrefe, C.; Schulz, M.; Benedictow, A.; Griesfeller, J.J.; Janssens-Maenhout, G.; Carmichael, G.; et al. Technical note: Coordination and harmonization of the multi-scale, multi-model activities HTAP2, AQMEII3, and MICS-Asia3: Simulations, emission inventories, boundary conditions, and model output formats. Atmos. Chem. Phys. 2017, 17, 1543–1555. [Google Scholar] [CrossRef] [PubMed] [Green Version]
  49. Guenther, A.B.; Jiang, X.; Heald, C.L.; Sakulyanontvittaya, T.; Duhl, T.; Emmons, L.K.; Wang, X. The Model of Emissions of Gases and Aerosols from Nature version 2.1 (MEGAN2.1): An extended and updated framework for modeling biogenic emissions. Geosci. Model Dev. 2012, 5, 1471–1492. [Google Scholar] [CrossRef] [Green Version]
  50. Müller, J.-F.; Stavrakou, T. Inversion of CO and NOx emissions using the adjoint of the IMAGES model. Atmos. Chem. Phys. 2005, 5, 1157–1186. [Google Scholar] [CrossRef] [Green Version]
  51. Schoeberl, M.R.; Douglass, A.R.; Hilsenrath, E.; Bhartia, P.K.; Beer, R.; Waters, J.W.; Gunson, M.R.; Froidevaux, L.; Gille, J.C.; Barnett, J.J.; et al. Overview of the EOS aura mission. IEEE Trans. Geosci. Remote Sens. 2006, 44, 1066–1074. [Google Scholar] [CrossRef] [Green Version]
  52. Levelt, P.F.; van den Oord, G.H.J.; Dobber, M.R.; Malkki, A.; Huib, V.; de Vries, J.; Stammes, P.; Lundell, J.O.V.; Saari, H. The ozone monitoring instrument. IEEE Trans. Geosci. Remote Sens. 2006, 44, 1093–1101. [Google Scholar] [CrossRef]
  53. Boersma, K.F.; Eskes, H.J.; Richter, A.; De Smedt, I.; Lorente, A.; Beirle, S.; van Geffen, J.H.G.M.; Zara, M.; Peters, E.; Van Roozendael, M.; et al. Improving algorithms and uncertainty estimates for satellite NO2 retrievals: Results from the quality assurance for the essential climate variables (QA4ECV) project. Atmos. Meas. Tech. 2018, 11, 6651–6678. [Google Scholar] [CrossRef] [Green Version]
  54. Zara, M.; Boersma, K.F.; De Smedt, I.; Richter, A.; Peters, E.; van Geffen, J.H.G.M.; Beirle, S.; Wagner, T.; Van Roozendael, M.; Marchenko, S.; et al. Improved slant column density retrieval of nitrogen dioxide and formaldehyde for OMI and GOME-2A from QA4ECV: Intercomparison, uncertainty characterisation, and trends. Atmos. Meas. Tech. 2018, 11, 4033–4058. [Google Scholar] [CrossRef] [Green Version]
  55. Lorente, A.; Folkert Boersma, K.; Yu, H.; Dörner, S.; Hilboll, A.; Richter, A.; Liu, M.; Lamsal, L.N.; Barkley, M.; De Smedt, I.; et al. Structural uncertainty in air mass factor calculation for NO2 and HCHO satellite retrievals. Atmos. Meas. Tech. 2017, 10, 759–782. [Google Scholar] [CrossRef]
  56. Boersma, K.F.; Eskes, H.; Richter, A.; De Smedt, I.; Lorente, A.; Beirle, S.; Van Geffen, J.; Peters, E.; Van Roozendael, M.; Wagner, T. QA4ECV NO2 Tropospheric and Stratospheric Column Data from OMI 2017. Available online: www.qa4ecv.eu/ecv/no2-pre/data (accessed on 9 January 2023).
  57. TEMIS—Regional Tropospheric NO2 Columns from OMI—Archive. Available online: https://www.temis.nl/airpollution/no2col/no2regioomi_qa.php (accessed on 26 September 2022).
  58. CHIMERE Chemistry-Transport Model. Available online: https://www.lmd.polytechnique.fr/chimere/ (accessed on 26 September 2022).
  59. Hauglustaine, D.A.; Hourdin, F.; Jourdain, L.; Filiberti, M.-A.; Walters, S.; Lamarque, J.-F.; Holland, E.A. Interactive chemistry in the Laboratoire de Météorologie Dynamique general circulation model: Description and background tropospheric chemistry evaluation: INTERACTIVE CHEMISTRY IN LMDZ. J. Geophys. Res. Atmos. 2004, 109, D04314. [Google Scholar] [CrossRef]
  60. Zheng, B.; Zhang, Q.; Geng, G.; Chen, C.; Shi, Q.; Cui, M.; Lei, Y.; He, K. Changes in China’s anthropogenic emissions and air quality during the COVID-19 pandemic in 2020. Earth Syst. Sci. Data 2021, 13, 2895–2907. [Google Scholar] [CrossRef]
  61. Lamsal, L.N.; Martin, R.V.; van Donkelaar, A.; Steinbacher, M.; Celarier, E.A.; Bucsela, E.; Dunlea, E.J.; Pinto, J.P. Ground-level nitrogen dioxide concentrations inferred from the satellite-borne Ozone Monitoring Instrument. J. Geophys. Res. 2008, 113, D16308. [Google Scholar] [CrossRef] [Green Version]
  62. Lachatre, M.; Foret, G.; Laurent, B.; Siour, G.; Cuesta, J.; Dufour, G.; Meng, F.; Tang, W.; Zhang, Q.; Beekmann, M. Air Quality Degradation by Mineral Dust over Beijing, Chengdu and Shanghai Chinese Megacities. Atmosphere 2020, 11, 708. [Google Scholar] [CrossRef]
  63. Flemming, J.; Stern, R.; Yamartino, R. A new air quality regime classification scheme for O, NO, SO and PM10 observations sites. Atmos. Environ. 2005, 39, 6121–6129. [Google Scholar] [CrossRef]
  64. Liu, F.; van der A, R.J.; Eskes, H.; Ding, J.; Mijling, B. Evaluation of modeling NO2 concentrations driven by satellite-derived and bottom-up emission inventories using in situ measurements over China. Atmos. Chem. Phys. 2018, 18, 4171–4186. [Google Scholar] [CrossRef]
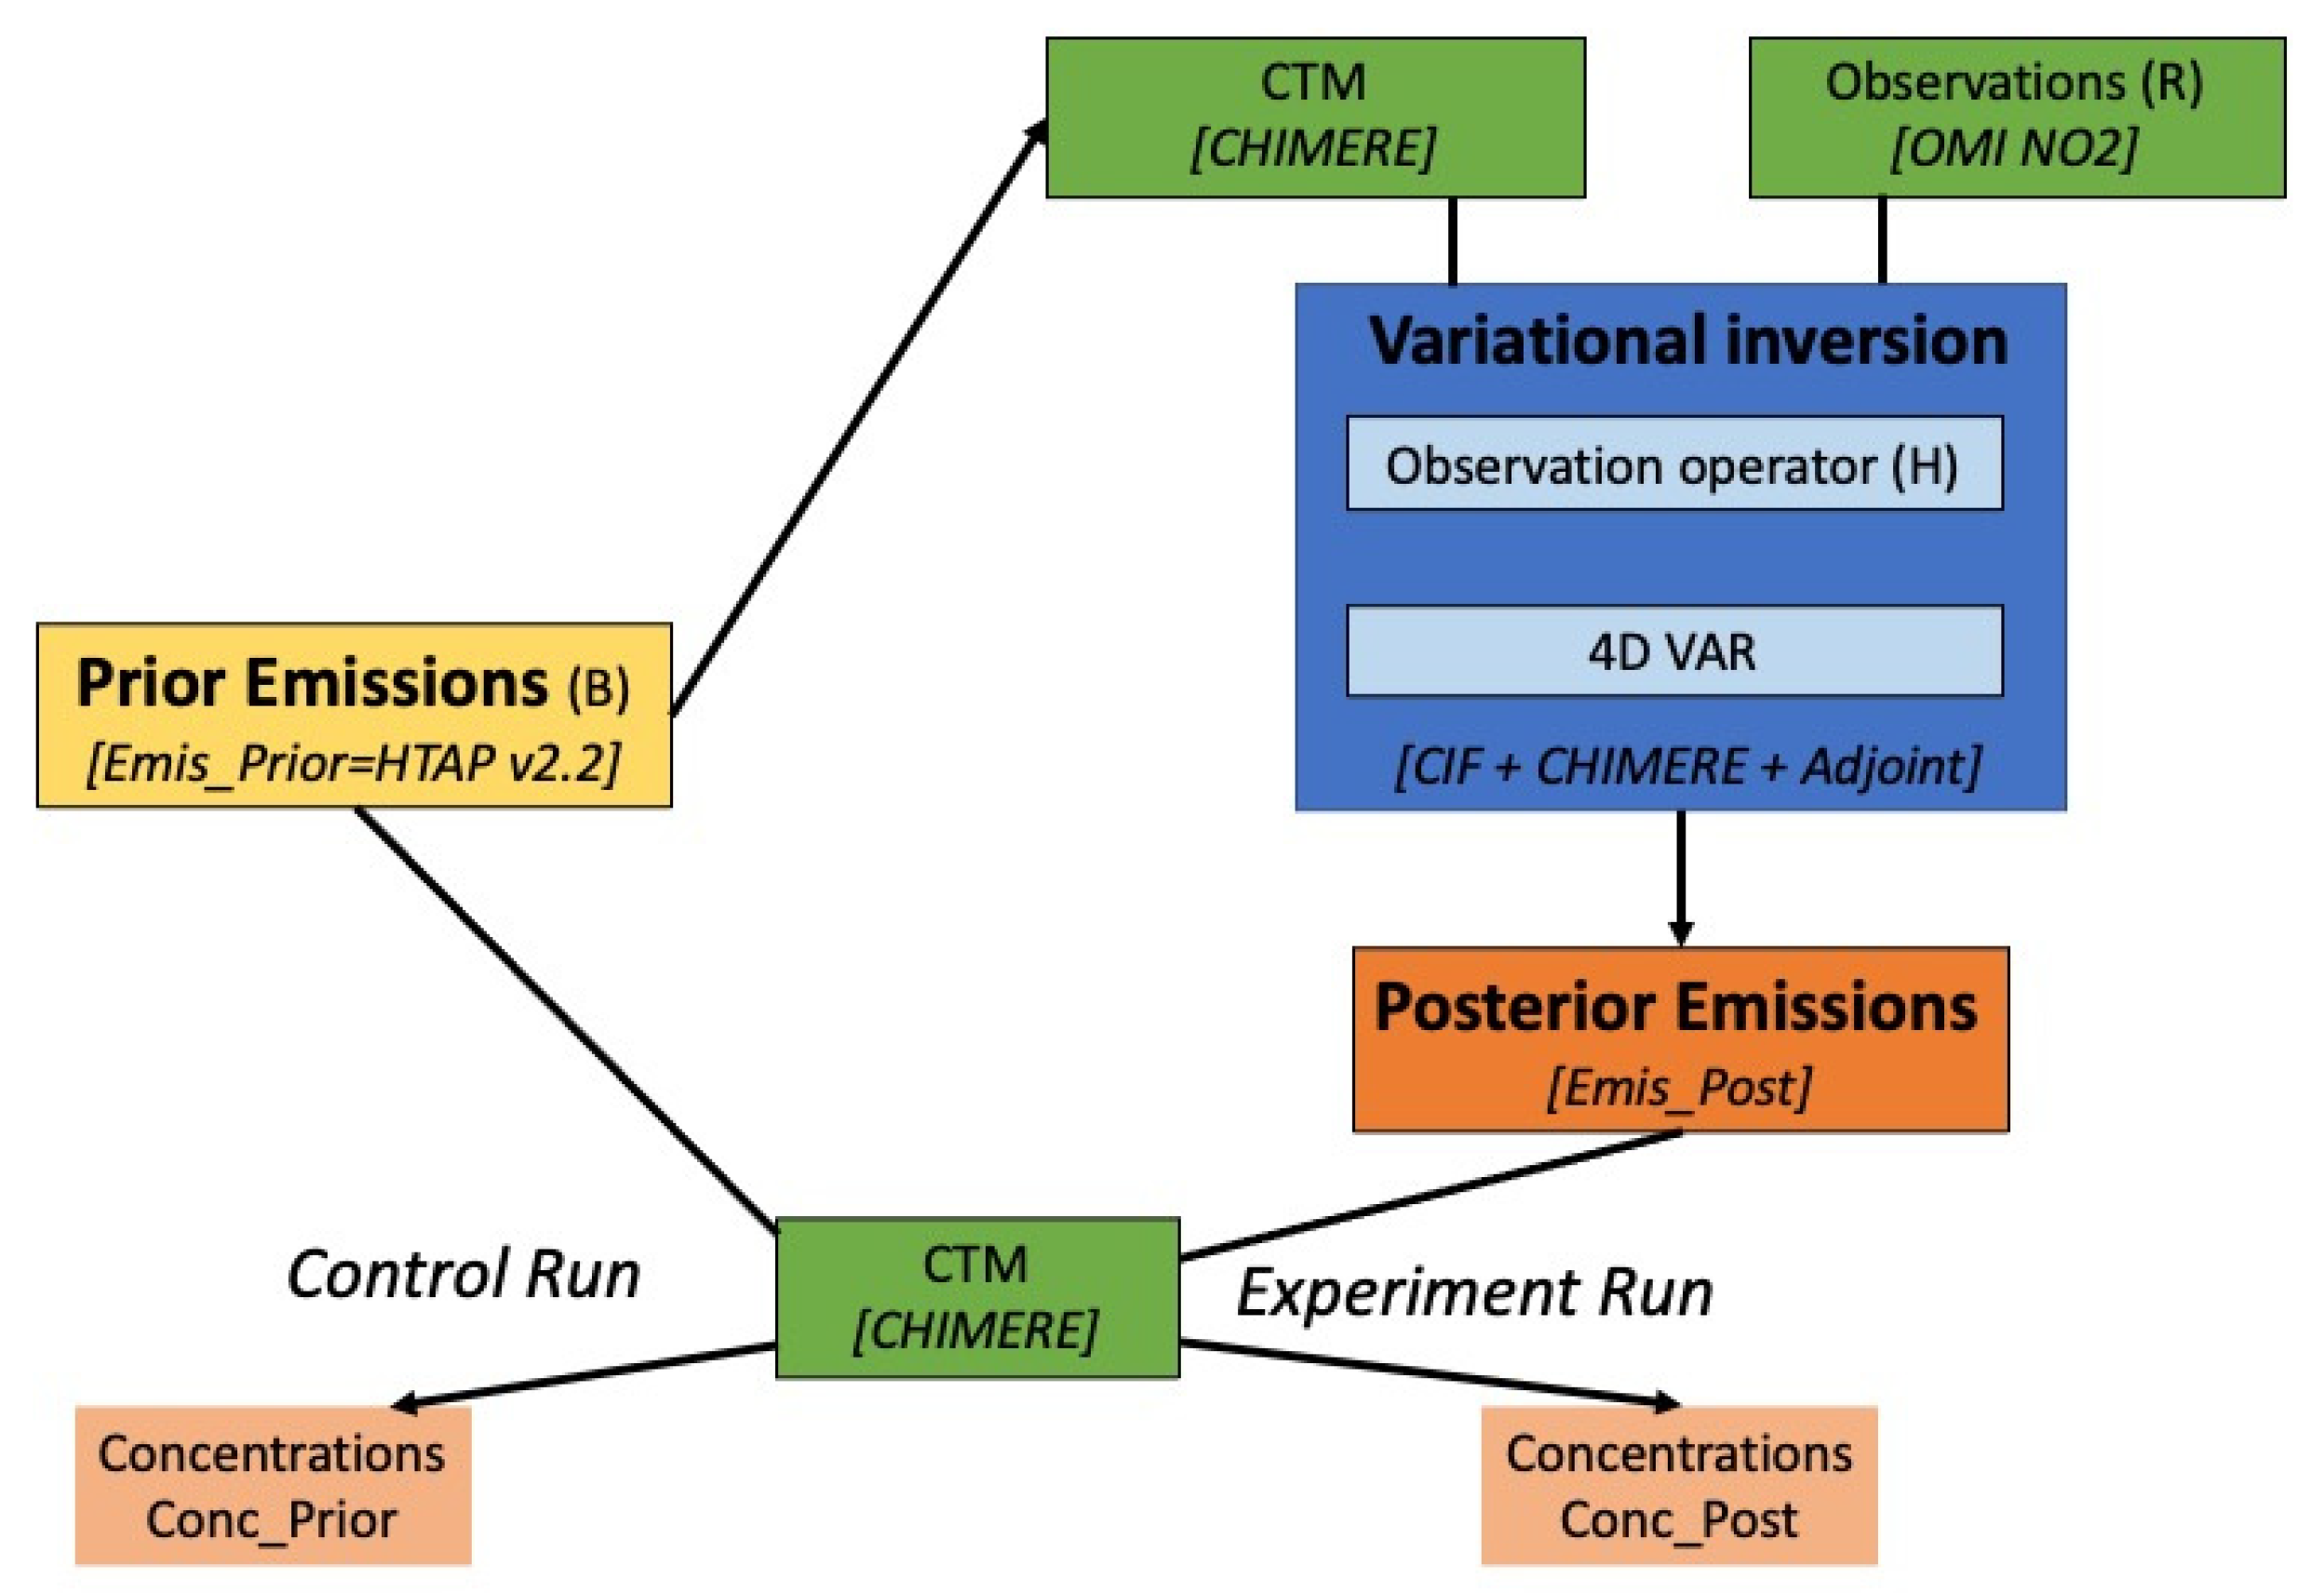
Figure 1. Schematic view of the atmospheric inversion and evaluation in this study.
Atmosphere 14 00154 g001
Figure 2. The study domain. Selected locations presenting the most urbanized and industrialized regions (see Section 3.3) are indicated by the rectangles.
Atmosphere 14 00154 g002
Figure 3. Spatial distribution of annual mean surface NO2 concentrations: (a) Stations; (b) CHIMERE using prior emissions (Conc_Prior15); (c) CHIMERE using MEIC emissions (Conc_MEIC15), and (d) Mean bias calculated by the mean differences between Conc_Prior15 and stations for 2015.
Atmosphere 14 00154 g003
Figure 4. Ratios of the Conc_Prior19 and Conc_Post19 statistical indicators: correlation coefficient, mean bias and RMSE, respectively (ac), for 2019.
Atmosphere 14 00154 g004
Figure 5. Monthly averaged NO2 surface concentrations from stations and simulations for Wuhan in (top) 2015 and, (bottom) 2019.
Atmosphere 14 00154 g005aAtmosphere 14 00154 g005b
Figure 6. (a) NOx emissions at 0.5° × 0.5° resolution for 2010 from the HTAP v2.2 inventory in kt; Relative differences of NOx emissions for between 2010 and (b) 2015 and (c) 2019, respectively.
Atmosphere 14 00154 g006
Figure 7. NOx monthly budget comparisons at the selected locations.
Atmosphere 14 00154 g007
Table 1. Summary of the inversions and simulations performed in this study. The output column gives the short names, which will be used in the following.
TypeTarget YearEmission InventoryObjectiveOutput
Inversion2015HTAP v2.2 2010Estimate monthly anthropogenic NOx Emissions Emis_Post15
Inversion2019HTAP v2.2 2010Estimate monthly anthropogenic NOx EmissionsEmis_Post19
Control2015HTAP v2.2 2010Simulate hourly NO2 ConcentrationsConc_Prior15
Control2019HTAP v2.2 2010Simulate hourly NO2 ConcentrationsConc_Prior19
Experiment2015Emis_Post15Simulate hourly NO2 ConcentrationsConc_Post15
Experiment2019Emis_Post19Simulate hourly NO2 ConcentrationsConc_Post19
Evaluation2015MEIC v1.3 for NOx + HTAP v2.2 for other speciesSimulate hourly NO2 ConcentrationsConc_MEIC15
Table 2. Annual statistics for the comparison between simulated and measured NO2 hourly surface concentrations for 2015 and 2019. Mean = annual mean, SD = standard deviation, RMSE = root mean square error are in µg/m3. r = Pearson correlation coefficient. NMB = normalized mean bias in % (r, NMB and RMSE formulas are given as statistical indicators in the Supplementary Material), (SDs are calculated using annual means of the concentrations).
StationConc_PriorConc_PostConc_MEIC
YearMeanSDMeanSDrNMBRMSEMeanSDrNMBRMSEMeanSDrNMBRMSE
201527.411.629.218.60.63722.128.818.10.64521.625.515.80.62−720.6
201924.89.830.319.20.672221.929.518.20.681920.8
Table 3. The annual NOx emission budget (in Tg) over East China and the entire domain in the Figure 2 with respect to different inventories.
InventoryEast ChinaDomain—Figure 2
HTAP 201018.620.5
Emis_Post15 (this study)18.520.4
Emis_Post19 (this study)18.420.3
MEIC15 16.4-
DECSO15 [64]-21.5
Table 4. Definition of the locations and their annual NOx budgets concerning the different emission inventories and years.
LocationLatitude & LongitudeHTAP v2.2
(kt)
Emis_Post15
(kt)
MEIC15
(kt)
Emis_Post19
(kt)
Daqing46–47° N, 124–125.5° E78.97172.570.1
Shenyang41–44° N, 123–125° E82.884.9114.581.1
Baotou40–42° N, 108–111° E136.3116.2116.4122.3
Beijing-Tianjin38–41° N, 115–118.5° E450.8447.3381.2431.7
Dalian38–41° N, 120–122° E74.277.488.476.3
Shijiazhuang37–39° N, 113–115° E151.1152.2107.2144.5
Shandong35–38° N, 115–119° E296.6295.8245.4279.2
Henan34–37° N, 112–114° E145.513684.2132.2
Anhui32–33° N, 116–118° E76.471.839.870.1
Yangtze River Delta29–32° N, 118–122° E1229.41162.1963.81129.8
Wuhan29–32° N, 113–116° E260.7237.8123.2222
Chengdu30–32° N, 103–105° E79.976.7109.277.9
Chongqing29–30° N, 106–107° E87.482.672.384.5
Hunan27–28° N, 112–113° E94.187.599.985.6
Pearl River Delta22–24° N, 112–115° E420.8370.9390375
Disclaimer/Publisher’s Note: The statements, opinions and data contained in all publications are solely those of the individual author(s) and contributor(s) and not of MDPI and/or the editor(s). MDPI and/or the editor(s) disclaim responsibility for any injury to people or property resulting from any ideas, methods, instructions or products referred to in the content.