Article

Optimization Design of Velocity Distribution in the Airways of the Fluidized Bed Based on CFD and Taguchi Algorithm

School of Mechanical Engineering, Hefei University of Technology, Hefei 230009, China
*
Author to whom correspondence should be addressed.
Atmosphere 2022, 13(9), 1513; https://doi.org/10.3390/atmos13091513
Submission received: 20 August 2022 / Revised: 6 September 2022 / Accepted: 8 September 2022 / Published: 16 September 2022
(This article belongs to the Special Issue CFD Modeling in Gas-Liquid Separators)

Abstract

:
A vital component that is frequently employed in the industrial powder conveying sector is the fluidized bed. In the light of powder unloading with a fluidized bed as the research object, an orthogonal experiment with two factors and four levels was established for the structural parameters of the fluidized bed. In the case of different noise factors, 16 schemes are designed and all schemes via computational fluid dynamics numerical simulation. The Taguchi method and regression analysis are used to analyze the response. Finally, the accuracy of the optimization results is tested. The results show that gas velocity decreases sharply at the airway’s entrance and, then, gas flows to the second half of the airway and velocity decreases steadily and uniformly. Airway arc length L exerts a greater effect on the signal-to-noise ratio (SNR) than airway height H. The parameter combination of 180 mm L and 17 mm H for obtaining the optimal velocity distribution uniformity is determined. The test results indicate that the overall fluidization effect of the fluidized bed with the optimal parameters is better. The linked research findings can be used as a guide when designing a fluidized bed system for transporting comparable powder.

1. Introduction

A fluidized bed is a type of equipment for fluidizing powder that is widely used in the industrial powder transportation industry. Fluidization occurs when compressed gas passes through a fluidized bed and the specks of the fluidized bed powder are separated from one another and suspended in the air. This phenomenon imbues the powder with the characteristics of general fluid. Many studies have been conducted on the parameters of a fluidized bed, such as determining drag correlations, bed expansion ratio, bed depth, and flow distribution. For example, Ernst-Ulrich Hartge tested different turbulence formulas and solid-phase turbulence methods in a hydrodynamic model of a circulating fluidized bed riser to verify the drag correlation of the riser [1]. T. A. B. Rashid successfully simulated the flow of a bubbling fluidized bed by combining the Eulerian–Eulerian multiphase model with kinetic theory of granular flow [2]. Subsequently, this author calculated the bed expansion ratio at various apparent air velocities using the Tang model. S. K. Gupta developed a fluidized motion conveying system for transporting granular materials to study operational parameter influences on material mass flow flux and bed depth [3]. H. Liu studied the influences of the structure and dimensions of flow channel bifurcation on flow distribution uniformity [4]. Y. L. Chen investigated how a light-emitting diode (LED) water-cooling system’s performance was affected by the fluid velocity distribution in the channels [5]. The bigger the aspect ratio of the microchannels, the better the internal fluid velocity homogeneity and the better the heat dissipation performance of the LED chip surface, the study discovered under the same inlet flow. In the field of powder transportation, a fluidized bed is mostly used in integrated commercial applications and few reports on the basic aspects of fluid velocity distribution uniformity have been presented.
The uniformity of fluid velocity distribution at the airway’s entrance is a key performance index that affects the fluidized quality of fluidized beds. It is also a key factor for improving the unloading efficiency and reducing the residual rate of fluidized bed powder. Therefore, in the subject of particle transport, a thorough investigation into the homogeneity of fluid velocity distribution in a fluidized bed is essential.
Geometric features, such as airway height (H) and airway arc length (L), are among the most important variables that influence the consistency of fluid velocity distribution in a fluidized bed. This structural design is a typical multifactor and multilevel combination scheme. Therefore, optimizing these parameters to obtain the optimal combination scheme is an important aspect of this topic. Among existing optimization methods, the commonly used ones include the Taguchi method and an orthogonal algorithm [6,7]. For example, M. Deb adopted the Taguchi analysis principle based on fuzzy logic to study the multi-objective optimization scheme for the soot-NOx-BTHE characteristics of an existing hydrogen-fuel dual-fuel direct-injection engine [8]. A. R. A. Arkadan used the Taguchi orthogonal array method to reduce the accurate characterization of the performance of a wave-activated device that corresponded to a sea wave profile and the computation time required for the design and optimization of the environment [9]. C. H. Lin adopted modified particle swarm optimization and the Taguchi method of finite element analysis to optimize a six-phase copper rotor induction motor with a scroll compressor to achieve the minimum manufacturing cost, starting current, efficiency, and power factor [10]. In a bottom–bottom configuration, M. Sobhani used the Taguchi method to identify the best conditions for the natural convection heat transfer parameters of Al2O3 nanofluids in a partially heated cavity [11]. These conditions included the maximum Rayleigh number, cold length, volume concentration, and minimum heat length. S. Toghyani used the Taguchi approach to optimize a proton exchange membrane fuel cell’s working parameters and lower the necessary input voltage [12]. The contribution ratio of the effective parameters was determined on the basis of signal-to-noise ratio (SNR) and analysis of variance (ANOVA). The results showed that the electrolytic cell’s voltage was significantly influenced by the anode exchange current density, with a contribution rate of 67.15 percent. The contribution rates of the membrane water content and anode pressure, which had a negligible impact, were 1.1% and 0.42%, respectively. A. Zhokh used the standard and time-fractional diffusion equation to analyze the diffusion concentration distribution of gas in a porous material [13]. This researcher found that the relaxation time of gas molecules transported in the porous material was within a range of 10−8–10−6 s. The preceding applications of the Taguchi method provide a scientific base for the analysis of velocity distribution uniformity in a fluidized bed.
The rapid development of computer technology and computational fluid dynamics has provided great convenience for the calculation and simulation of fluids and CFD has become an important tool for researchers to analyze the flow field. A large number of experiments have proven that this method can accurately predict fluid flow characteristics [14]. By using CFD to create a model to simulate the pneumatic transportation of tiny particles across different geometrical pipe configurations, Z. Miao was able to confirm that the particle size distributions in horizontal and vertical pneumatic conveyance were very different from one another [15]. N. Behera used CFD with alumina as the conveying material to perform an aerodynamic dense-phase conveying test [16]. On the basis of this test, it was examined how crucial characteristics, such as the solid volume proportion and gas/solid velocity, varied over the pipeline’s various portions. N. Bicer used CFD to simulate the 3D turbulent flow field on the shell side and optimized the design of a shell-and-tube heat exchanger without affecting thermal performance or reducing pressure loss on the shell side [17]. K. Zhang used the CFD-discrete element method to study individual bubbles in a 3D initial fluidized bed and discovered that increasing particle diameter and gas injection velocity can magnify bubbles’ detrimental effects on interphase resistance [18]. Yan, H. simulated the hydrodynamic performance of the bionic hydrofoil with the help of CFD, deeply investigated the effect of hydrofoil structure on its lift-drag performance and vortex distribution, and successfully simulated the hydrodynamic performance of the hydrofoil on the propulsion pump [19].In summary, various research methods, such as determining drag correlations, bed expansion ratio, bed depth, and flow distribution, have been used to study the characteristics of fluidized beds. When it comes to powder unloading, however, the research on the uniformity of the inlet velocity of the fluidized bed, especially the effect of the geometric structure on the uniformity of the inlet velocity, is rarely reported. Therefore, the Taguchi method and the noise factor served as the foundation for the construction of 16 different fluidized bed system types and their SNR and variance were obtained. Analysis was conducted on the relationship between geometrical factors and the homogeneity of the gas velocity distribution in a fluidized bed. The ideal strategy and the contribution rate of each geometric parameter were discovered. The relevant research results presented in this paper can provide theoretical support and technical methods for the structural optimization design of fluidized beds, which are used in the field of powder unloading.

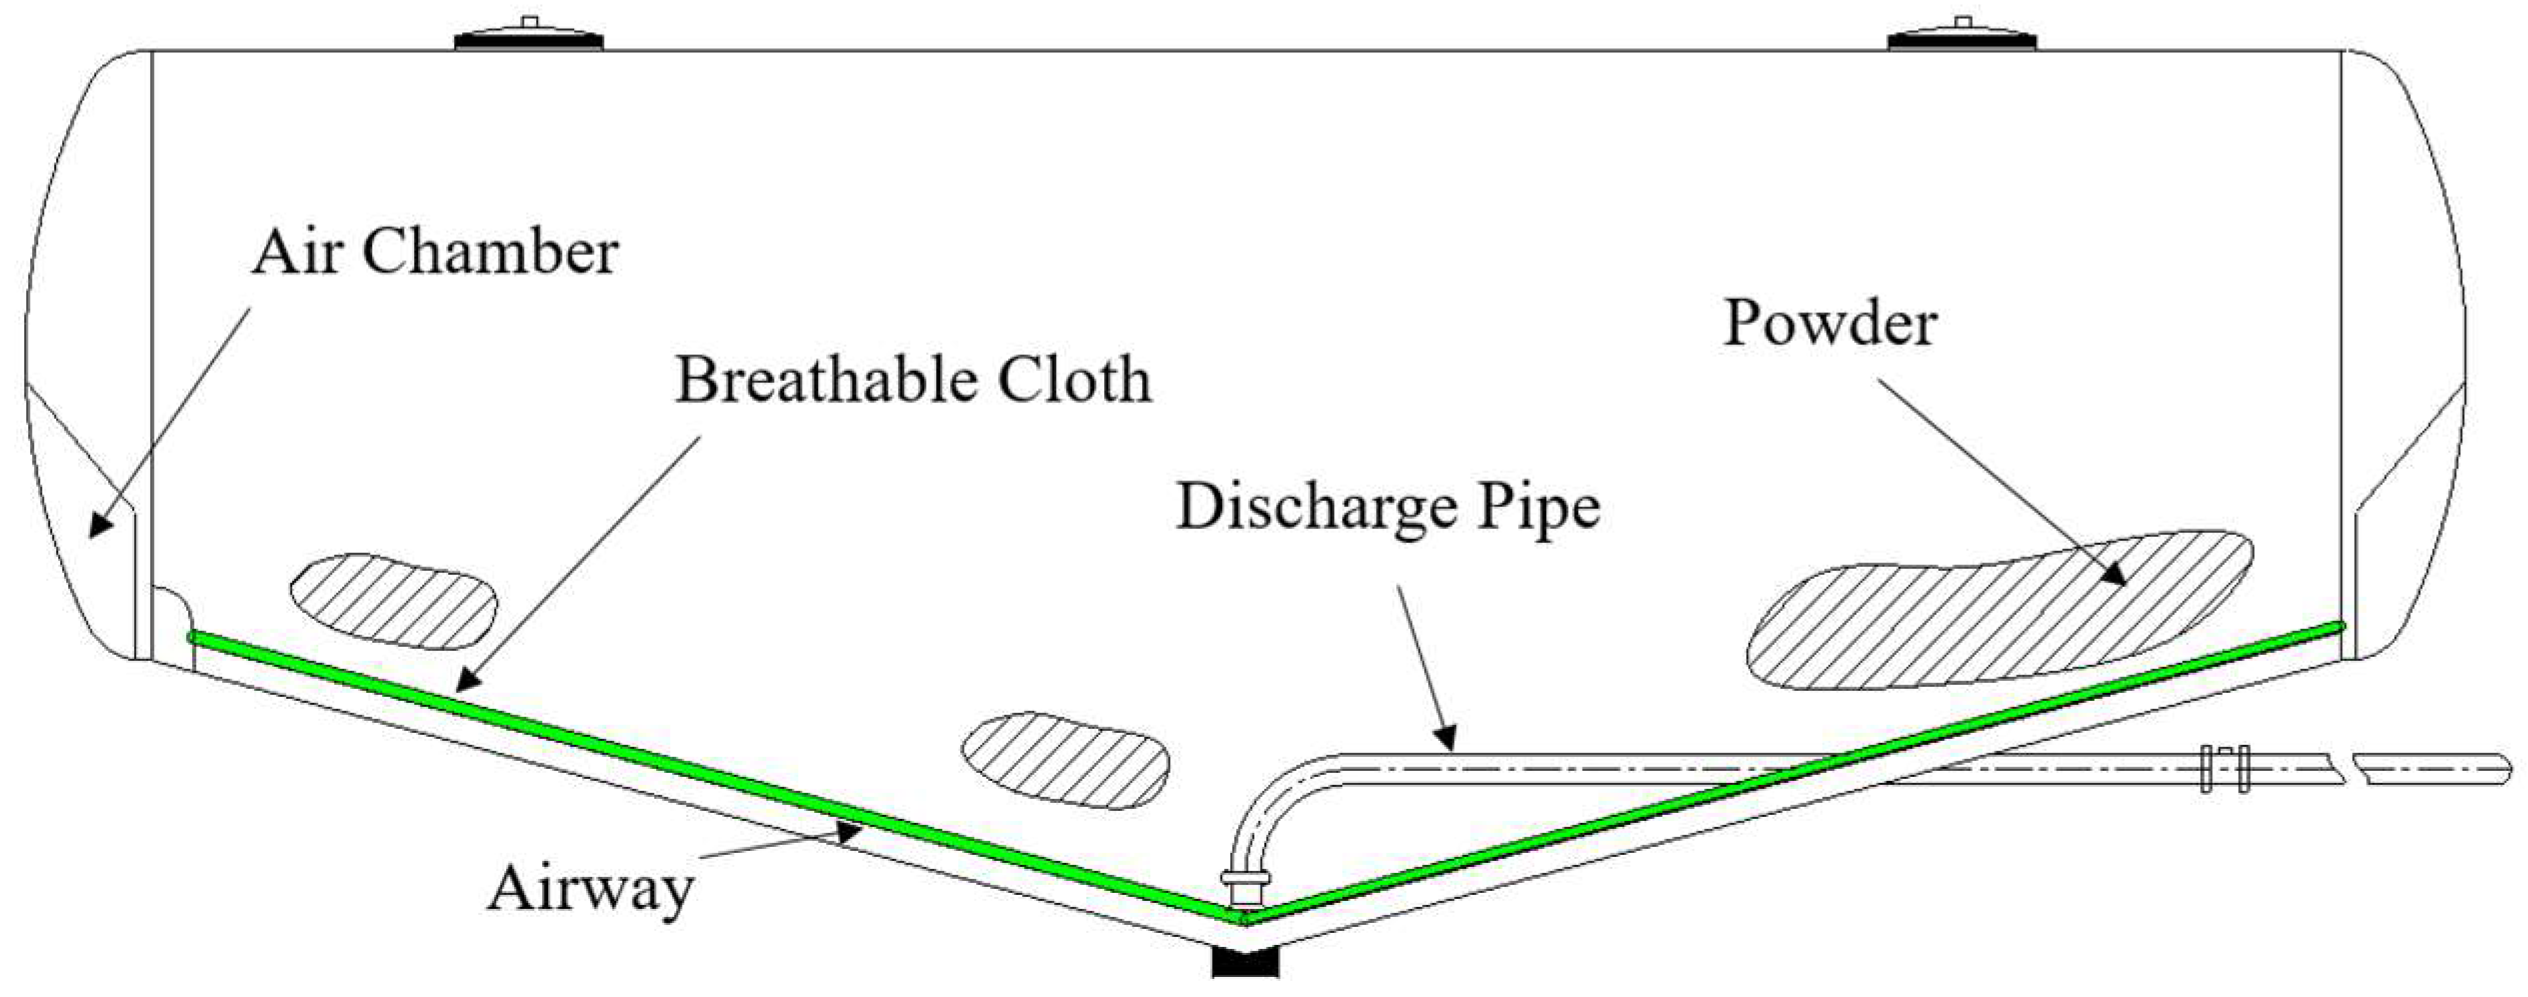
2. Fluidized Bed Physical Model and Operating Concept

Powder transportation fluidized bed or by external motor car engine-driven air compressor produce compressed gas, tanks with inlet pipe to the head of two head air plenum, air indoor gas flows through the airway form, even with a breathable cloth out of the air into the powder layer, make the powder fluidization, when the air pressure within the tank reaches a certain pressure, open the discharge valve, fluidization powder through the internal discharge pipe flow to the external discharge. The physical model of the fluidized bed is shown in Figure 1.
The airways of the fluidized bed are evenly distributed on the arc of the air plenum of the powder tank truck. The powder unloading fluidization system is primarily influenced by the fluid’s velocity at the inlet. Distinct fluids at the inlet have different velocity distributions. As a result, the velocity distribution uniformity of the fluid is defined as the amount of variation between the fluid’s velocity at each measurement site and the average velocity at the inlet. Meanwhile, the homogeneity of fluid velocity distribution Vu is defined as:
V u = 1 n i = 1 n ( u i u ¯ ) 2 u 0 ¯ ,
where u i represents the average fluid velocity at each small port’s inlet, u ¯ represents the average fluid velocity of the whole port’s inlet, the number of fluidized bed airways is denoted by the prefix n, while the average velocity at the gas plenum’s entrance is denoted by the prefix u 0 ¯ .

3. Taguchi Technique and CFD Numerical Simulation Experimental Design

3.1. Multiple Linear Regression Analysis

One of the most popular statistical techniques for analyzing the effects of variables on system performance is the Taguchi method [20]. The Taguchi method focuses on the impact of changes in the controlling factors (i.e., design parameters that have an impact on test performance and can be controlled) and noise factors (i.e., design parameters that can affect test results but cannot be controlled) on system efficiency as opposed to conventional optimization techniques, which aim to improve a system’s average performance [21].
The experimental design of the Taguchi method is generally divided into the following steps [22].
(1)
Determining the analysis object
In this work, the following objects should be studied through numerical analysis. The first object is how the fluidized bed’s geometric structure characteristics affect how evenly the air velocity distribution is distributed throughout the fluidized bed. The second object is to identify the best parameter combination by analyzing the contribution rates of various parameters.
(2)
Selecting the noise factor
In this work, one uncontrollable factor that impacts the uniformity of velocity distribution in the fluidized bed is the mass flow rate at the gas plenum’s entrance. When air enters the air plenum through the air compressor, changing the total amount of air in the air plenum, the inlet flow rate inevitably changes. Therefore, the inlet flow rate is selected as the noise factor. This rate is determined on the basis of the selected outlet pressure, i.e., 0.060 kg/s and 0.045 kg/s.
(3)
Determining response characteristics
In this study, the velocity distribution uniformity (Vu) of fluidized bed fluid is selected as the response of the Taguchi algorithm. Using numerical CFD simulation, the average fluid velocity (ui) at each small port’s entrance is determined and Equation (1) is used to determine the Vu value for each scheme.
(4)
Determining the factors and their levels
The primary variables that affect the characteristics of fluidized bed fluidization are the geometric parameters of the fluidized bed’s airway. To analyze the geometric parameters of the fluidized bed’s airway that influence fluidization properties, the two key geometric parameters adopted as control factors, i.e., the height (H) and the arc length (L) of the airway, are shown in Figure 2a, should be determined. Each factor’s four horizontal values, evenly spaced apart and within the proper ranges, were chosen. Table 1 lists the chosen factors and their values at the respective levels. The various contribution degrees of each factor to the response can be obtained by analyzing the combination of different level values of these factors. In this manner, determining the optimal combination of geometric parameters is easy.
(5)
Selecting the appropriate orthogonal array
The problem in this study can be viewed as a two-factor, four-level optimization problem. Further, the Taguchi method provides an L16 orthogonal array table that can interact between the two factors, comprehensively and evenly, considering the influences of each factor and level. Table 2 displays the orthogonal array of the two factors and four levels after assignment.

3.2. Numerical Simulation

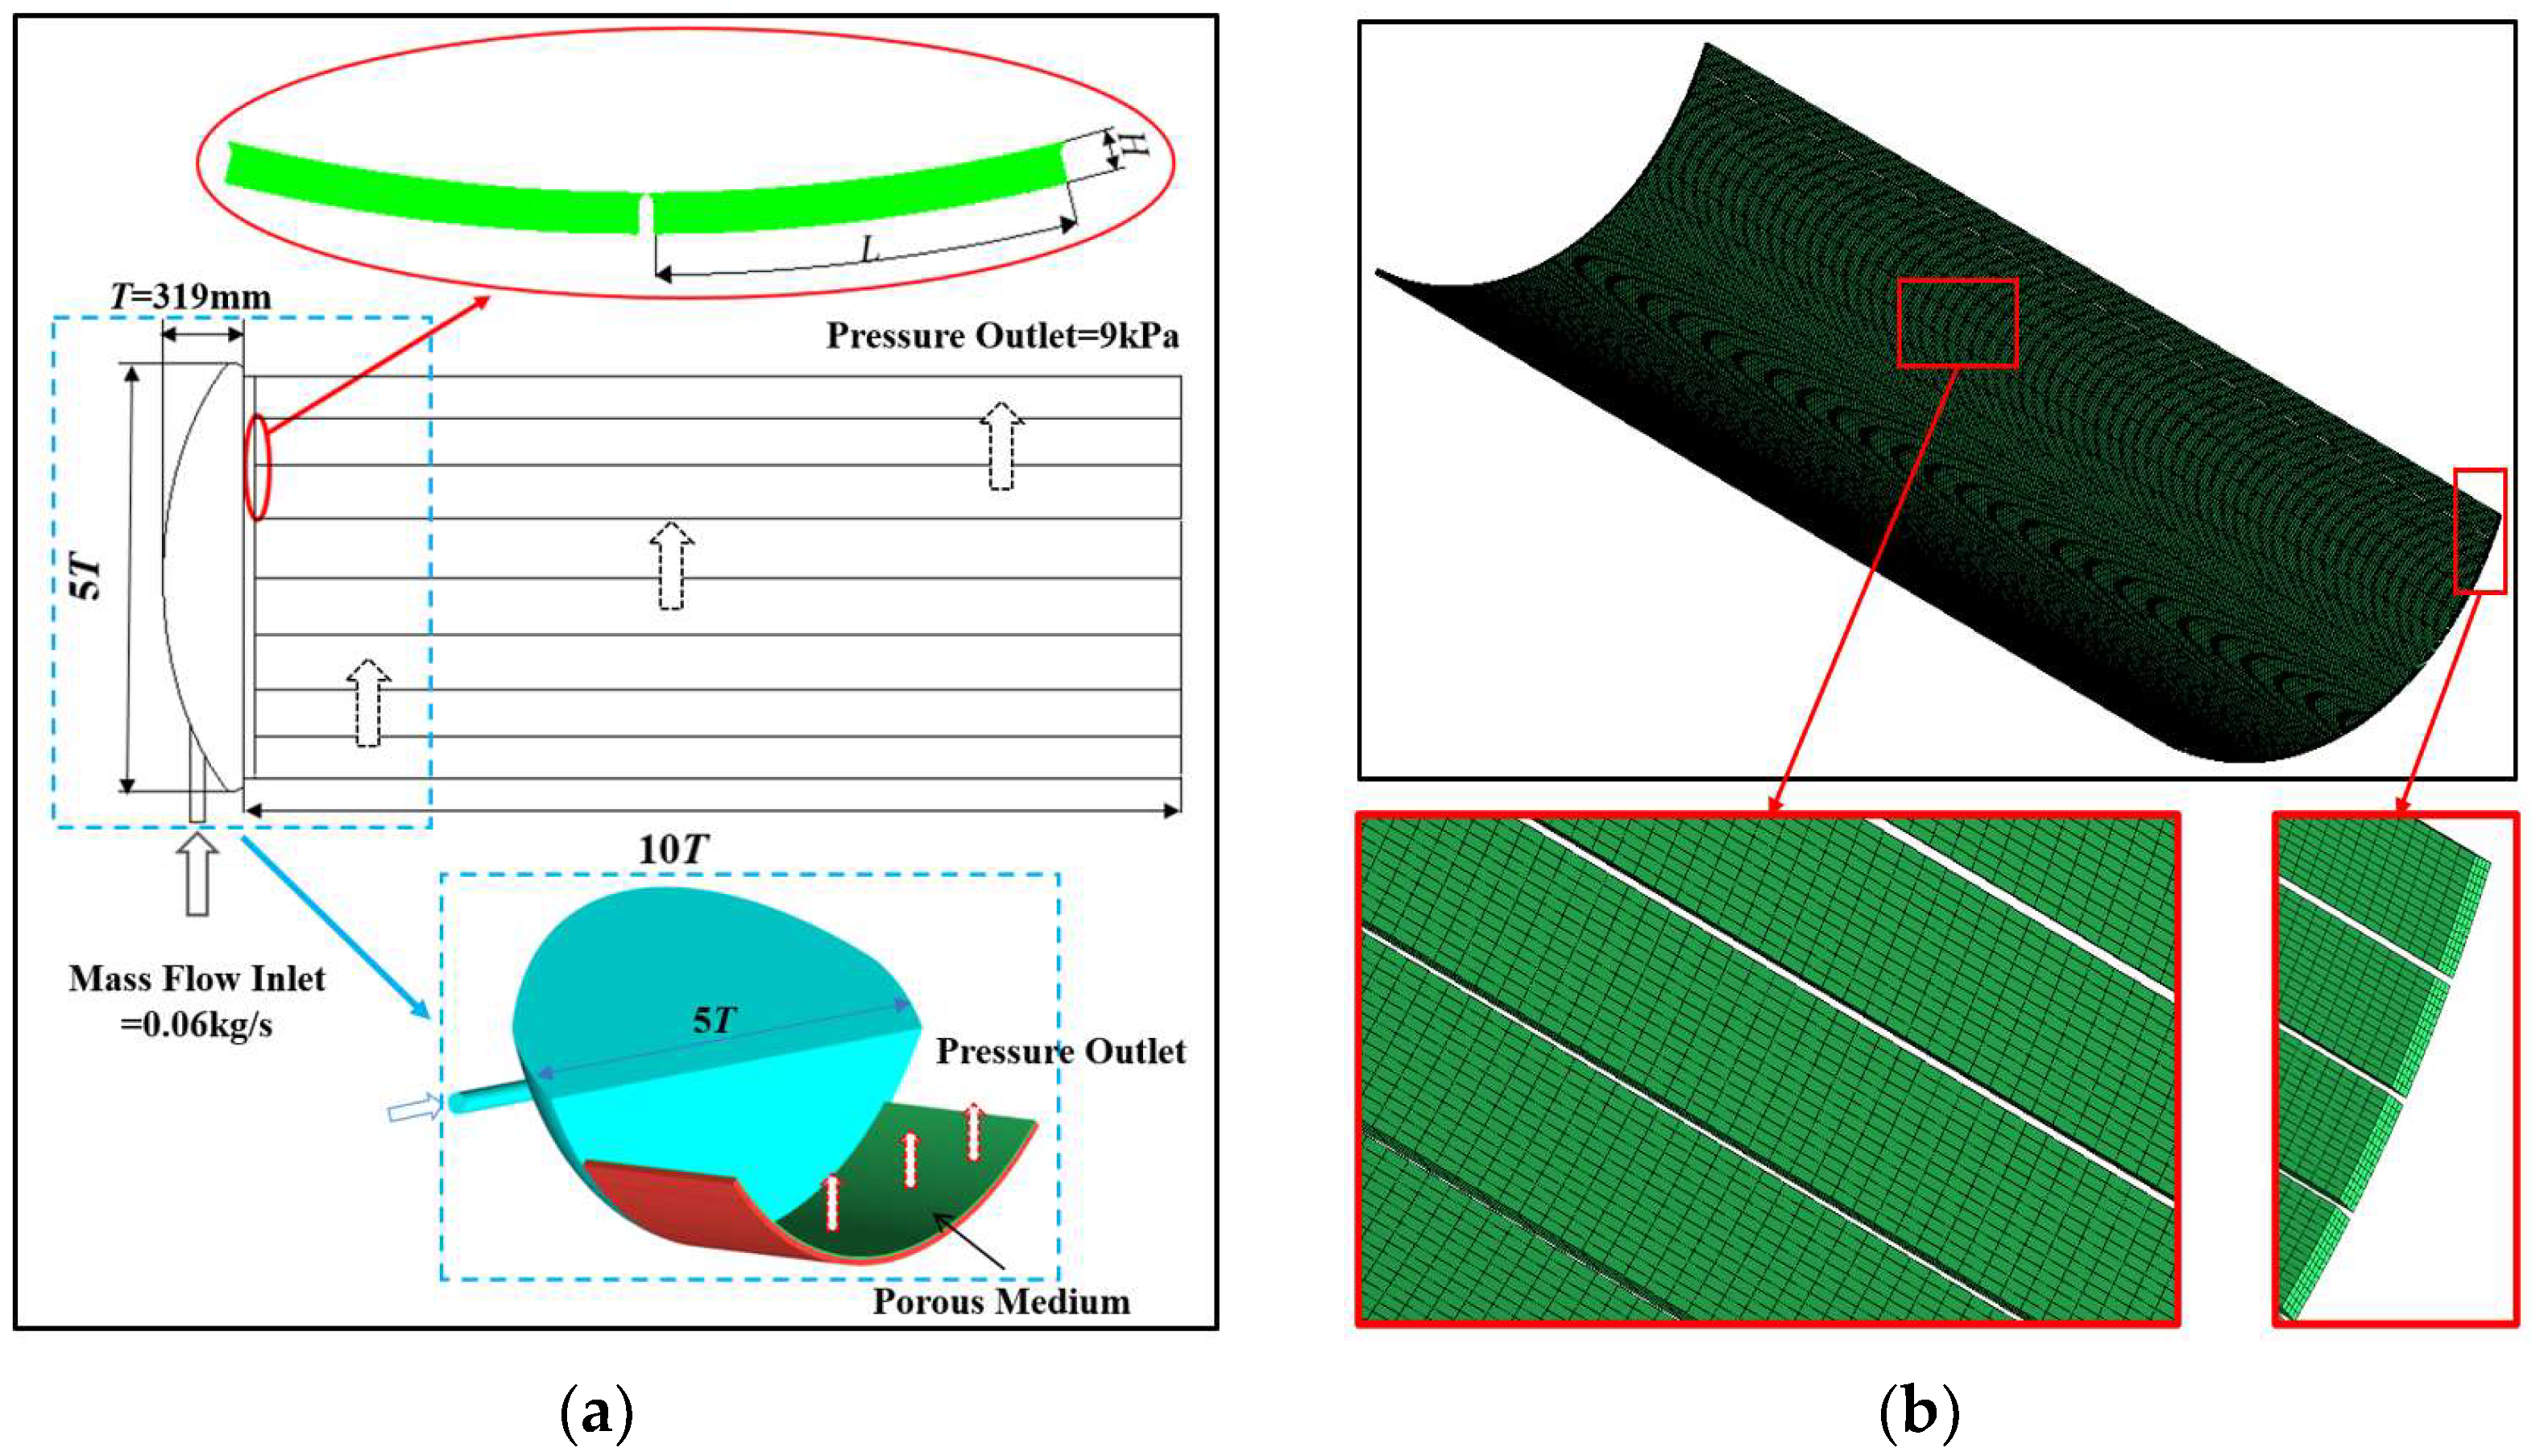
3.2.1. Calculating the Region and Boundary Conditions

To examine the effects of various geometric parameters and noise factors on the velocity distribution uniformity of the air at the fluidized bed’s inlet and the fluidized bed’s fluid flow properties of compressed air, the flow of compressed air in 16 fluidized beds was numerically calculated using the Taguchi method. Figure 2a shows the two factors in Taguchi’s design and the boundary conditions for the numerical simulation and Figure 2b shows the mesh of the airway. The length of the air plenum is T = 319 mm, its width is 5T, and the length of the airway is 10T. The inlet boundary condition is the mass flow inlet and the outlet is configured as a static pressure outlet with a 9 kPa pressure.
A porous medium layer is set in the simulation calculation area of the breathable cloth to make the simulation results more accurate with respect to engineering practice. In the simulation, the porous medium layer can provide a certain amount of resistance at the entrance of the airway, meaning gas entering the airway should not be set by simulation at the entrance of the airway export position all out, leading to airway after half of no gas flow in the past. It makes the simulation a more realistic situation, improving the authenticity and accuracy of simulation results.

3.2.2. Governing Equation

The fluidized bed for powder unloading is a practical problem in the engineering field. The RNG k-ε turbulence model is a widely used and highly accurate turbulence model for solving practical engineering problems. The governing equation of this model is [23]:
Continuity equation:
ρ t + ( ρ U ) = 0 ,
Momentum equation:
ρ U t + ( ρ U × U ) ( μ e f f U ) = p + ( μ e f f U ) T + B ,
Equation of turbulent pulsating kinetic energy:
( ρ k ) t + ( ρ U k ) = [ ( μ + μ t σ k ) k ] + P k ρ ε ,
Turbulence dissipation equation:
( ρ k ) t + ( ρ U ε ) = [ ( μ + μ t σ ε ) ε ] + ε k [ C ε 1 P k C ε 2 ρ ε ] ,
where vortex viscosity coefficient and generation terms are, respectively,
μ t = C μ ρ k 2 ε P k = μ t U ( U + U T ) 2 3 U ( 3 μ t U + ρ k ) + P k b ,
Cε1, Cε2, Cμ, σk, σε are all constants, C ε 1 = 1.42 η ( 1 η / η 0 ) / ( 1 + β η 3 ) , Cε2 = 1.68, Cμ = 0.085, σk = σε = 0.7179, η0 = 4.38, β = 0.012. (Among them η = S k / ε , S = ( 2 D i j ¯ D i j ¯ ) 1 / 2 .)
In this paper, the porous medium is used to simulate the breathable cloth between the fluidized bed airways and the tank area on the upper part of the airway. The porous zone is simplified as a fluid zone with a resistance source and a momentum source component called S is added to the momentum equation to work on the fluid and create a pressure gradient. The viscous loss term and the inertia loss term make up the momentum source term. The resistance properties for simple, isotropic porous media are uniform in all directions [24].
S i = ( μ α u i + c 1 2 ρ | u | u i ) ,
where ui is the average Reynolds velocity component and α and c represent the permeability of the fluid and the inertial loss resistance, respectively.

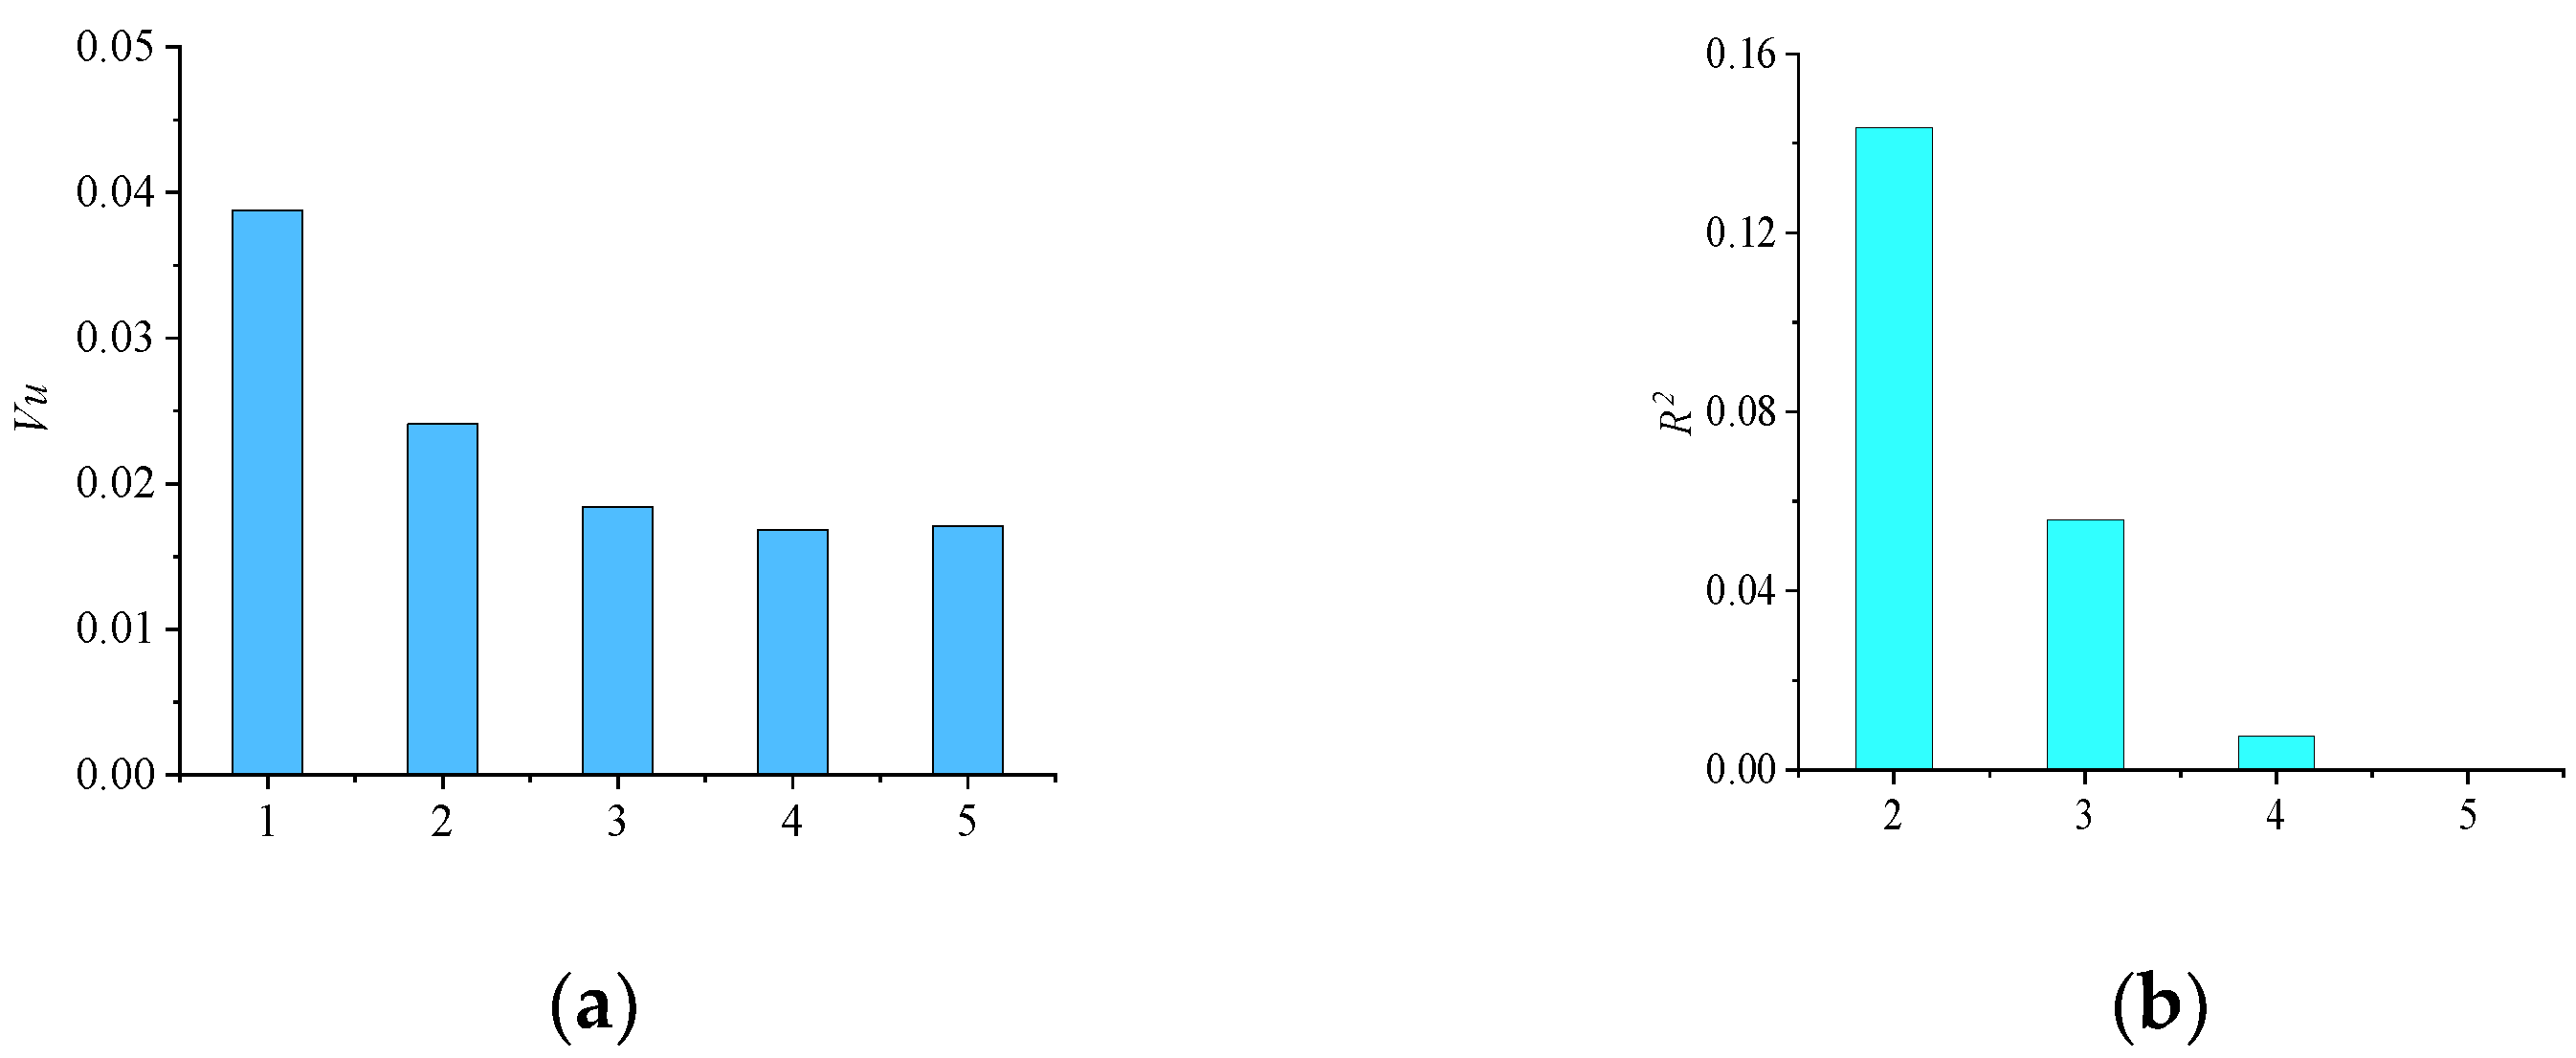
3.2.3. Mesh Partitioning and Grid Independence Validation

The calculation area in this study was divided using ICEM software. In order to understand the effect of the number of grids on the calculation results, Scheme 1 with an inlet flow of 0.060 kg/s, a cycle arc length of 180 mm, and a height of 17 mm was chosen as a sample to verify grid independence. For the other test schemes, the exact same mesh division technique was used.
The formula R2 = (xixi−1)2/xi−12 × 100% is defined. xi represents the homogeneity of velocity distribution in Scheme 1. All calculation results are provided in Table 3. As shown in Figure 3, when Grid 3 with approximately 3.9 million grids increases by approximately 1.4 million grids to Grid 4, Vu only decreases by 0.016, R2 = 0.756%. When the number of grids is increased by approximately 5 million to Grid 5, Vu only changes by 0.003 and R2 = 0.032%. However, the required calculation time is considerably increased due to the large number of grids.

4. Analysis of Results

With the help of the commercial software Ansys Fluent, we use the SIMPLE algorithm based on the coupling of pressure with velocity to carry out a steady-state calculation. When the energy residual is less than 10−6 and the residuals of all other variables are less than 10−3, the calculation is converged. Gas flow and velocity dispersion in the fluidized bed were determined using the aforementioned numerical simulation technique. Equation (1) was used to calculate the velocity distribution uniformity of the fluid at the airway’s inlet of each scheme, as indicated in Table 4.

4.1. Analysis of the Taguchi Method Results
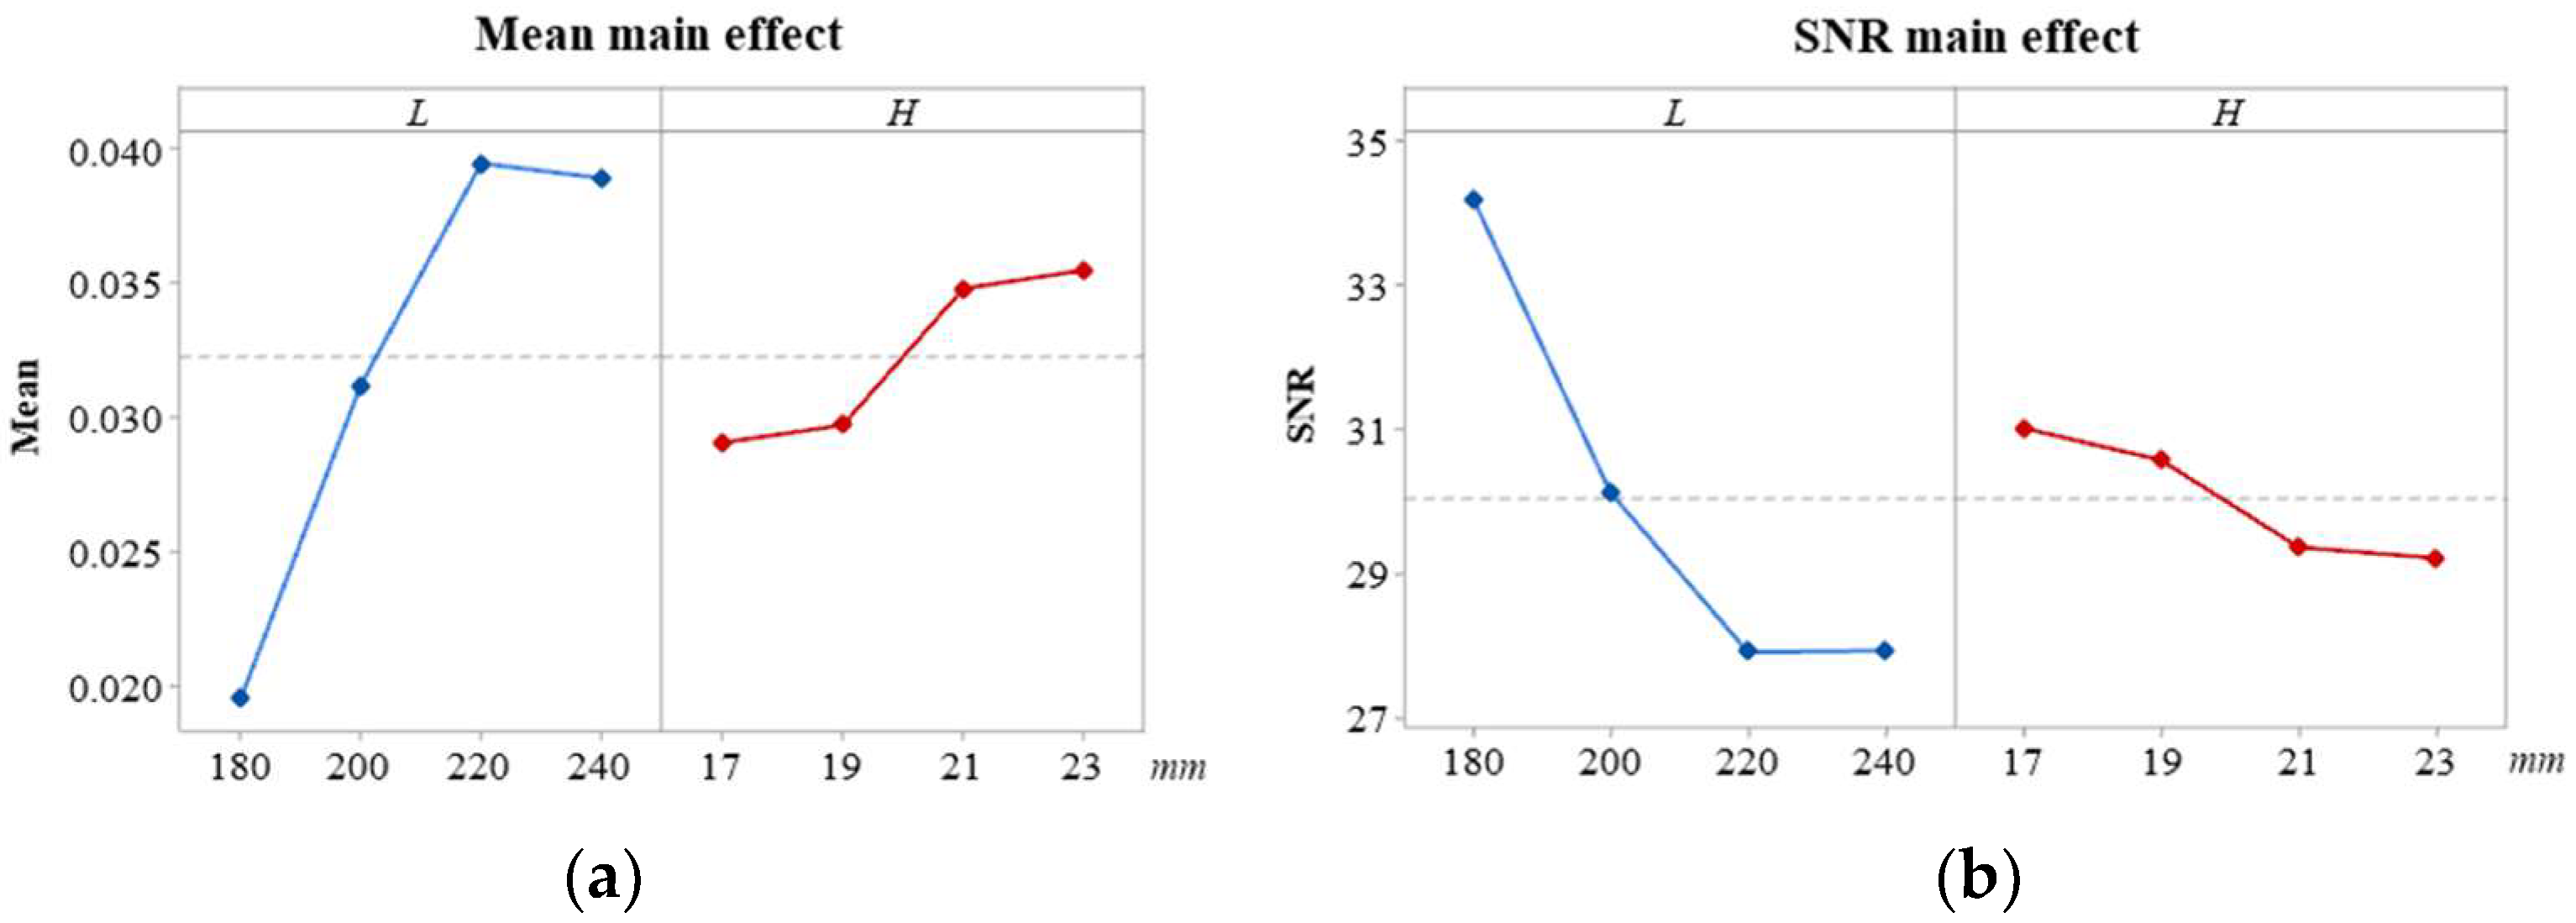
4.1.1. SNR Analysis

In the Taguchi method, the loss function to be calculated is converted into the SNR function, which can be used to calculate the difference between the measured or calculated value and the expected value [25]. SNR stands for the goal value to standard deviation ratio; it is a parameter for measuring robustness. This ratio is evaluated using three different methods: the higher the better (HTB), the lower the better (STB), and NTB means that the factor has no discernible impact on the result, as shown in Equations (8)–(10).
HTB :   S N = 10 log ( 1 n 1 y 2 ) ,
STB :   S N = 10 log ( 1 n y 2 ) ,
NTB :   S N = 10 log y ¯ 2 s y 2 ,
The STB method is used for evaluation to obtain the best response characteristics, i.e., the velocity distribution uniformity of the fluid is minimum.
With the help of Minitab software, Taguchi analysis was performed on the obtained data. The SNR responses at each level of the two factors (H and L) calculated using the Taguchi method are provided in Table 5 and delta represent the distinction between each factor’s average minimum SNR response and average maximum SNR response. The findings indicate that L (delta = 6.28, rank = 1) exerts a greater effect on SNR than H (delta = 1.80, rank = 2). Table 6 lists the mean responses for each level of the two factors (H and L), where delta denotes the difference between the mean response values of each factor’s maximum and minimum values. The findings indicate that L (delta = 0.0199, rank = 1) has a stronger influence on the mean value than H (delta = 0.00640, rank = 2).

4.1.2. SNR Analysis

The selection of the optimal geometric parameters of the fluidized bed is realized on the basis of the analysis results of the mean and SNR responses. The variation trend of the influence of each parameter on quality characteristics and the selection of the optimal level are achieved by analyzing the numerical simulation and SNR results of different combinations of factors at various levels and presenting them in the form of a main-effect diagram.
The main effect diagrams of the mean and SNR of H and L are presented in Figure 4. This article analyzes the quality characteristics of fluidized bed at the entrance of airway flow velocity distribution uniformity, the STB method is adopted to assess the SNR. Therefore, the minimum point in the mean main-effect diagram corresponds to the best case and either the quality of the STB response or the HTB need to keep maximum SNR, so the SNR of the maximum points in the primary-effect diagram corresponds to the best condition, to determine the optimal parameter combination for L is 180 mm and H is 17 mm.
A main effect occurs when different levels of control factors exert varying influences on quality characteristics; the main effect will be more evident the steeper the curve is sloped. The main effect is determined to exist in H and L by comparing the mean values of the two factors at various levels and the main-effect diagrams of SNR in Figure 4. Between H and L, the main effect value of L is higher, exerting a greater effect on mass characteristics. Meanwhile, the main-effect value of H is smaller and H’s main effect value is smaller, exerting a smaller effect on mass characteristics. Therefore, the choice of L requires greater consideration.

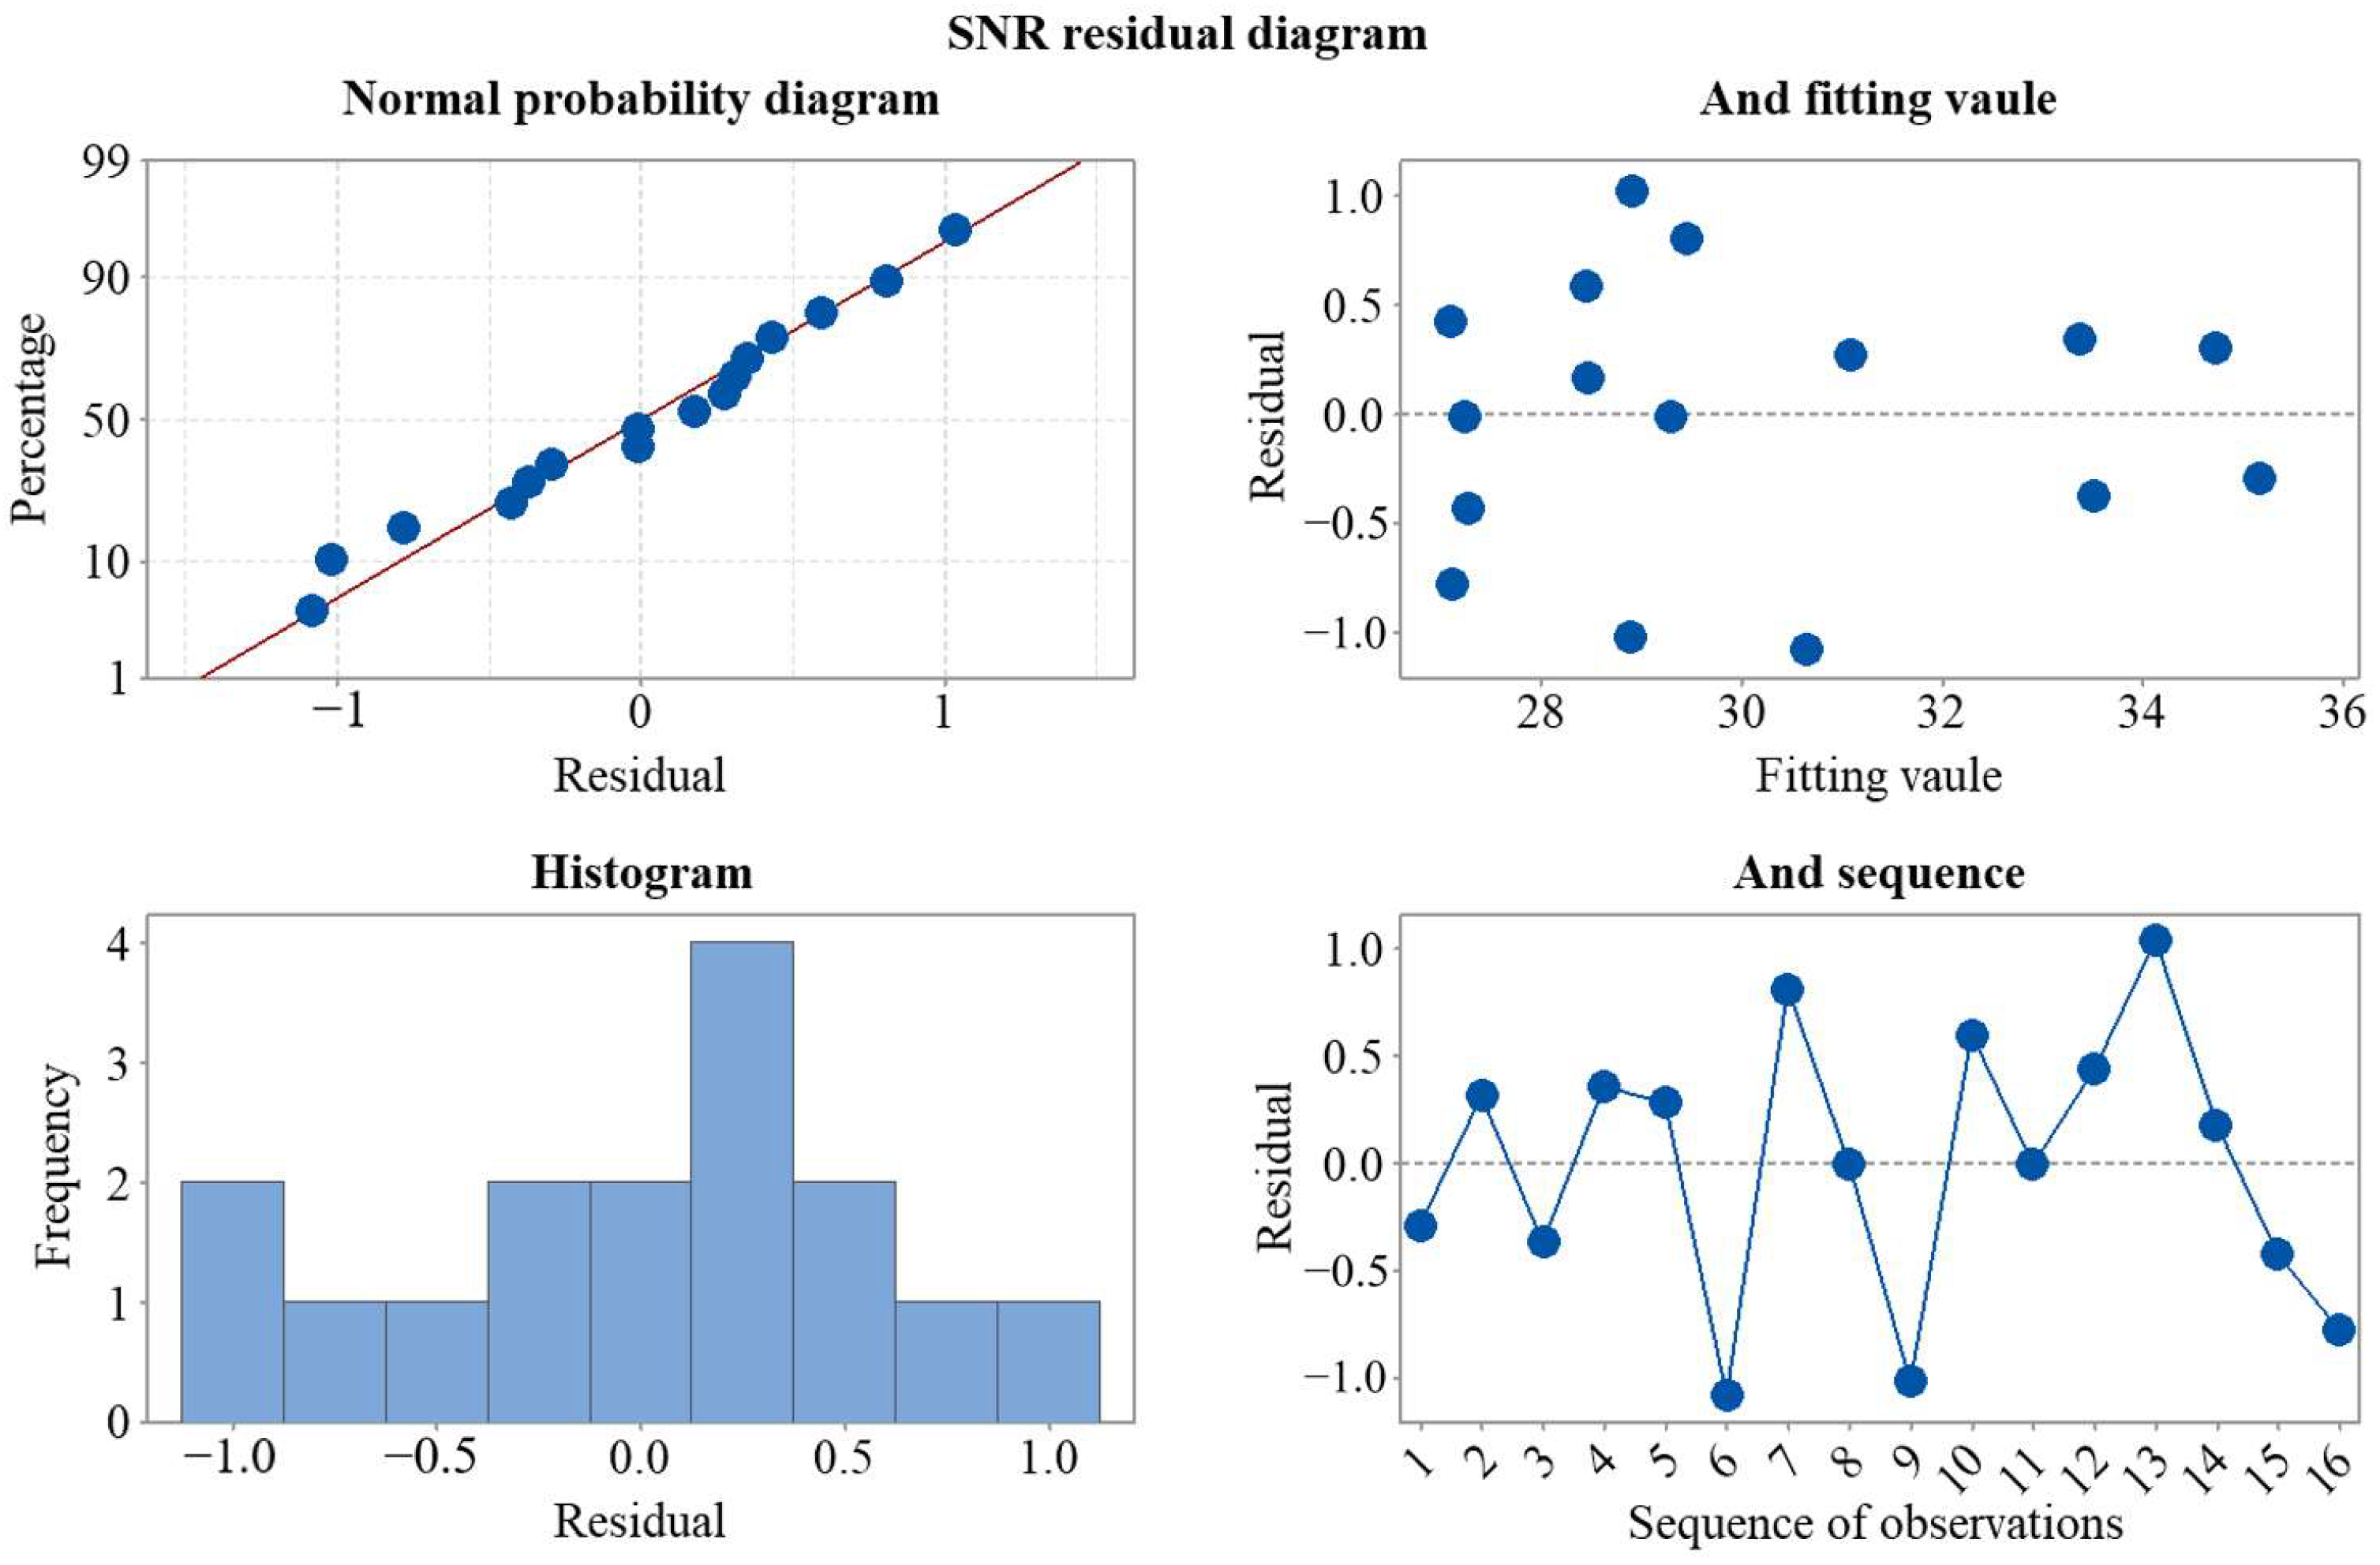
4.1.3. SNR Residual Diagram Analysis

A residual diagram can be applied to determine if a model is correct and compliant with the aforementioned assumptions. This diagram is composed of a normal probability diagram, a fitting value diagram, a histogram, and a sequence diagram of residual error. The residual diagram of SNR is presented in Figure 5. The normal probability plot of the residual can verify whether the SNR residual meets the normal distribution. The SNR data points closely encircle a straight line in the residual’s normal probability plot; thus, SNR conforms to the normal distribution. The residual’s fitting value graph can be used to determine whether the residual displays a random distribution. The fitting value graph’s points are randomly positioned on either side of the zero value; hence, the model demonstrates reliable random distribution. As shown in the histogram of the residual, it shows a trend of normal distribution and there are no columns away from the overall position and, thus, no abnormal data point exists. The graph and sequence of residuals show that the residuals in the graph are randomly distributed about the centerline and the residuals do not exhibit any particular trend; hence, the residuals demonstrate good independence.

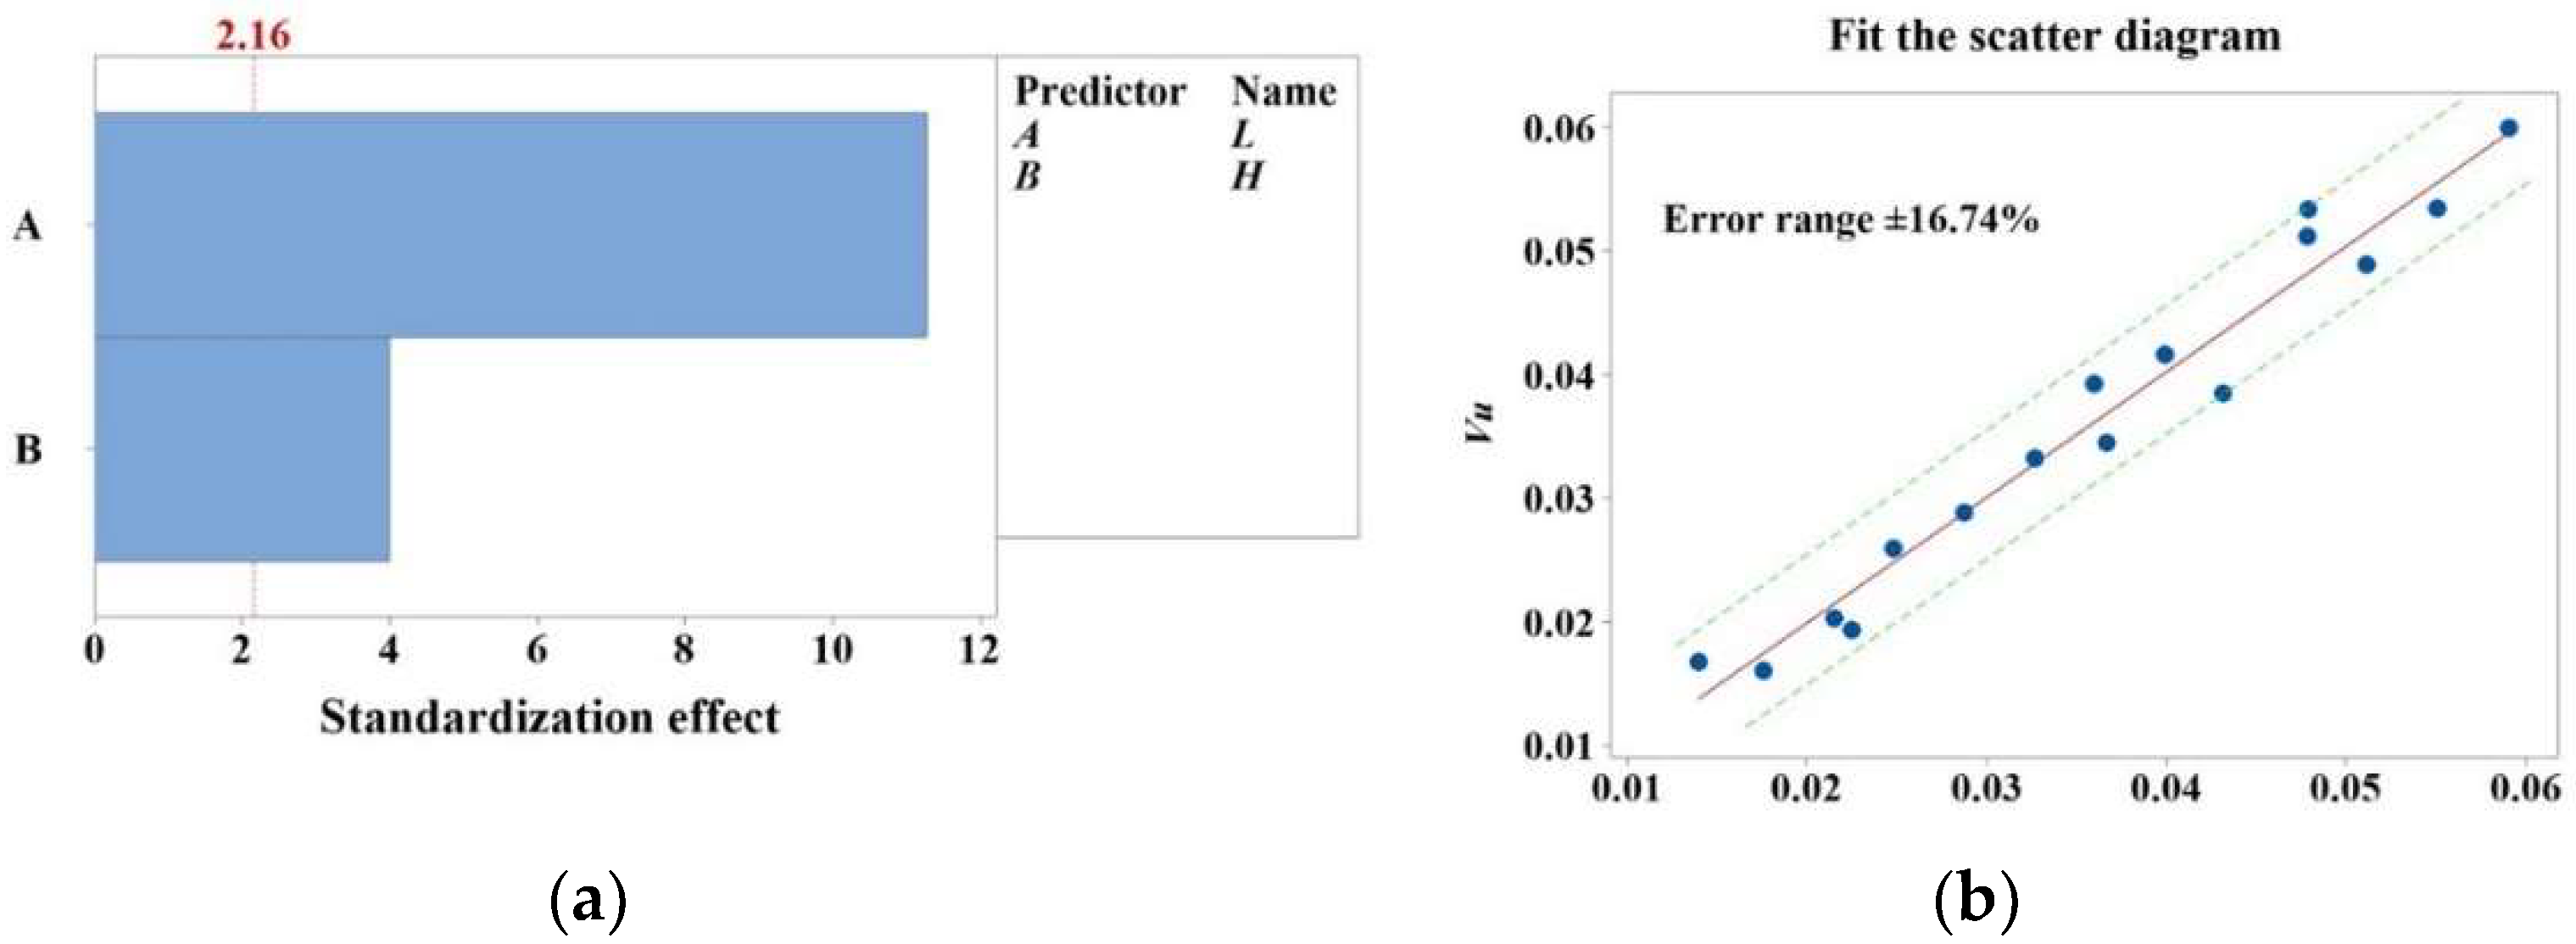
4.2. Multiple Linear Regression Analysis

In this study, velocity distribution uniformity of a fluidized bed with two factors and four levels is obtained via numerical simulation. To consider the influences of the coupling effects of multiple factors on velocity distribution uniformity at the fluidized bed’s inlet, the multiple linear regression technique was adopted to build a correlation formula between the structural parameters and velocity uniformity. The predicted correlation formula is presented as follows:
V u = 0.1209 + 0.00056 L + 0.001983 H ,
where Vu, L, and H represent the uniformity of velocity distribution, airway arc length, and airway height, respectively. The absolute value of the coefficients of each parameter in Equation (11) is drawn in descending order. As demonstrated in Figure 6a, the reference line is established at a level of significance of 0.05. According to the illustration, the height and arc length of airways exhibit statistically significant effects, with airway arc length exerting a greater effect than airway height.
From the parameter coefficient of the correlation formula, the uniformity of velocity distribution decreases with a reduction in airway arc length and airway height. Therefore, the smaller L and H should be selected to obtain smaller velocity distribution uniformity. This finding is in line with the Taguchi method’s analysis findings. The correlation degree obtained by using the predicted correlation formula is shown in Figure 6b by comparing the velocity distribution uniformity obtained via numerical simulation with that obtained via the predicted correlation formula. In accordance with the figure analysis, the maximum error between the calculated and numerical simulation results does not exceed 16.74%. Therefore, under the action of multifactor coupling, the prediction of the velocity distribution uniformity of the fluid in the fluidized bed exhibits a small error and a high correlation.

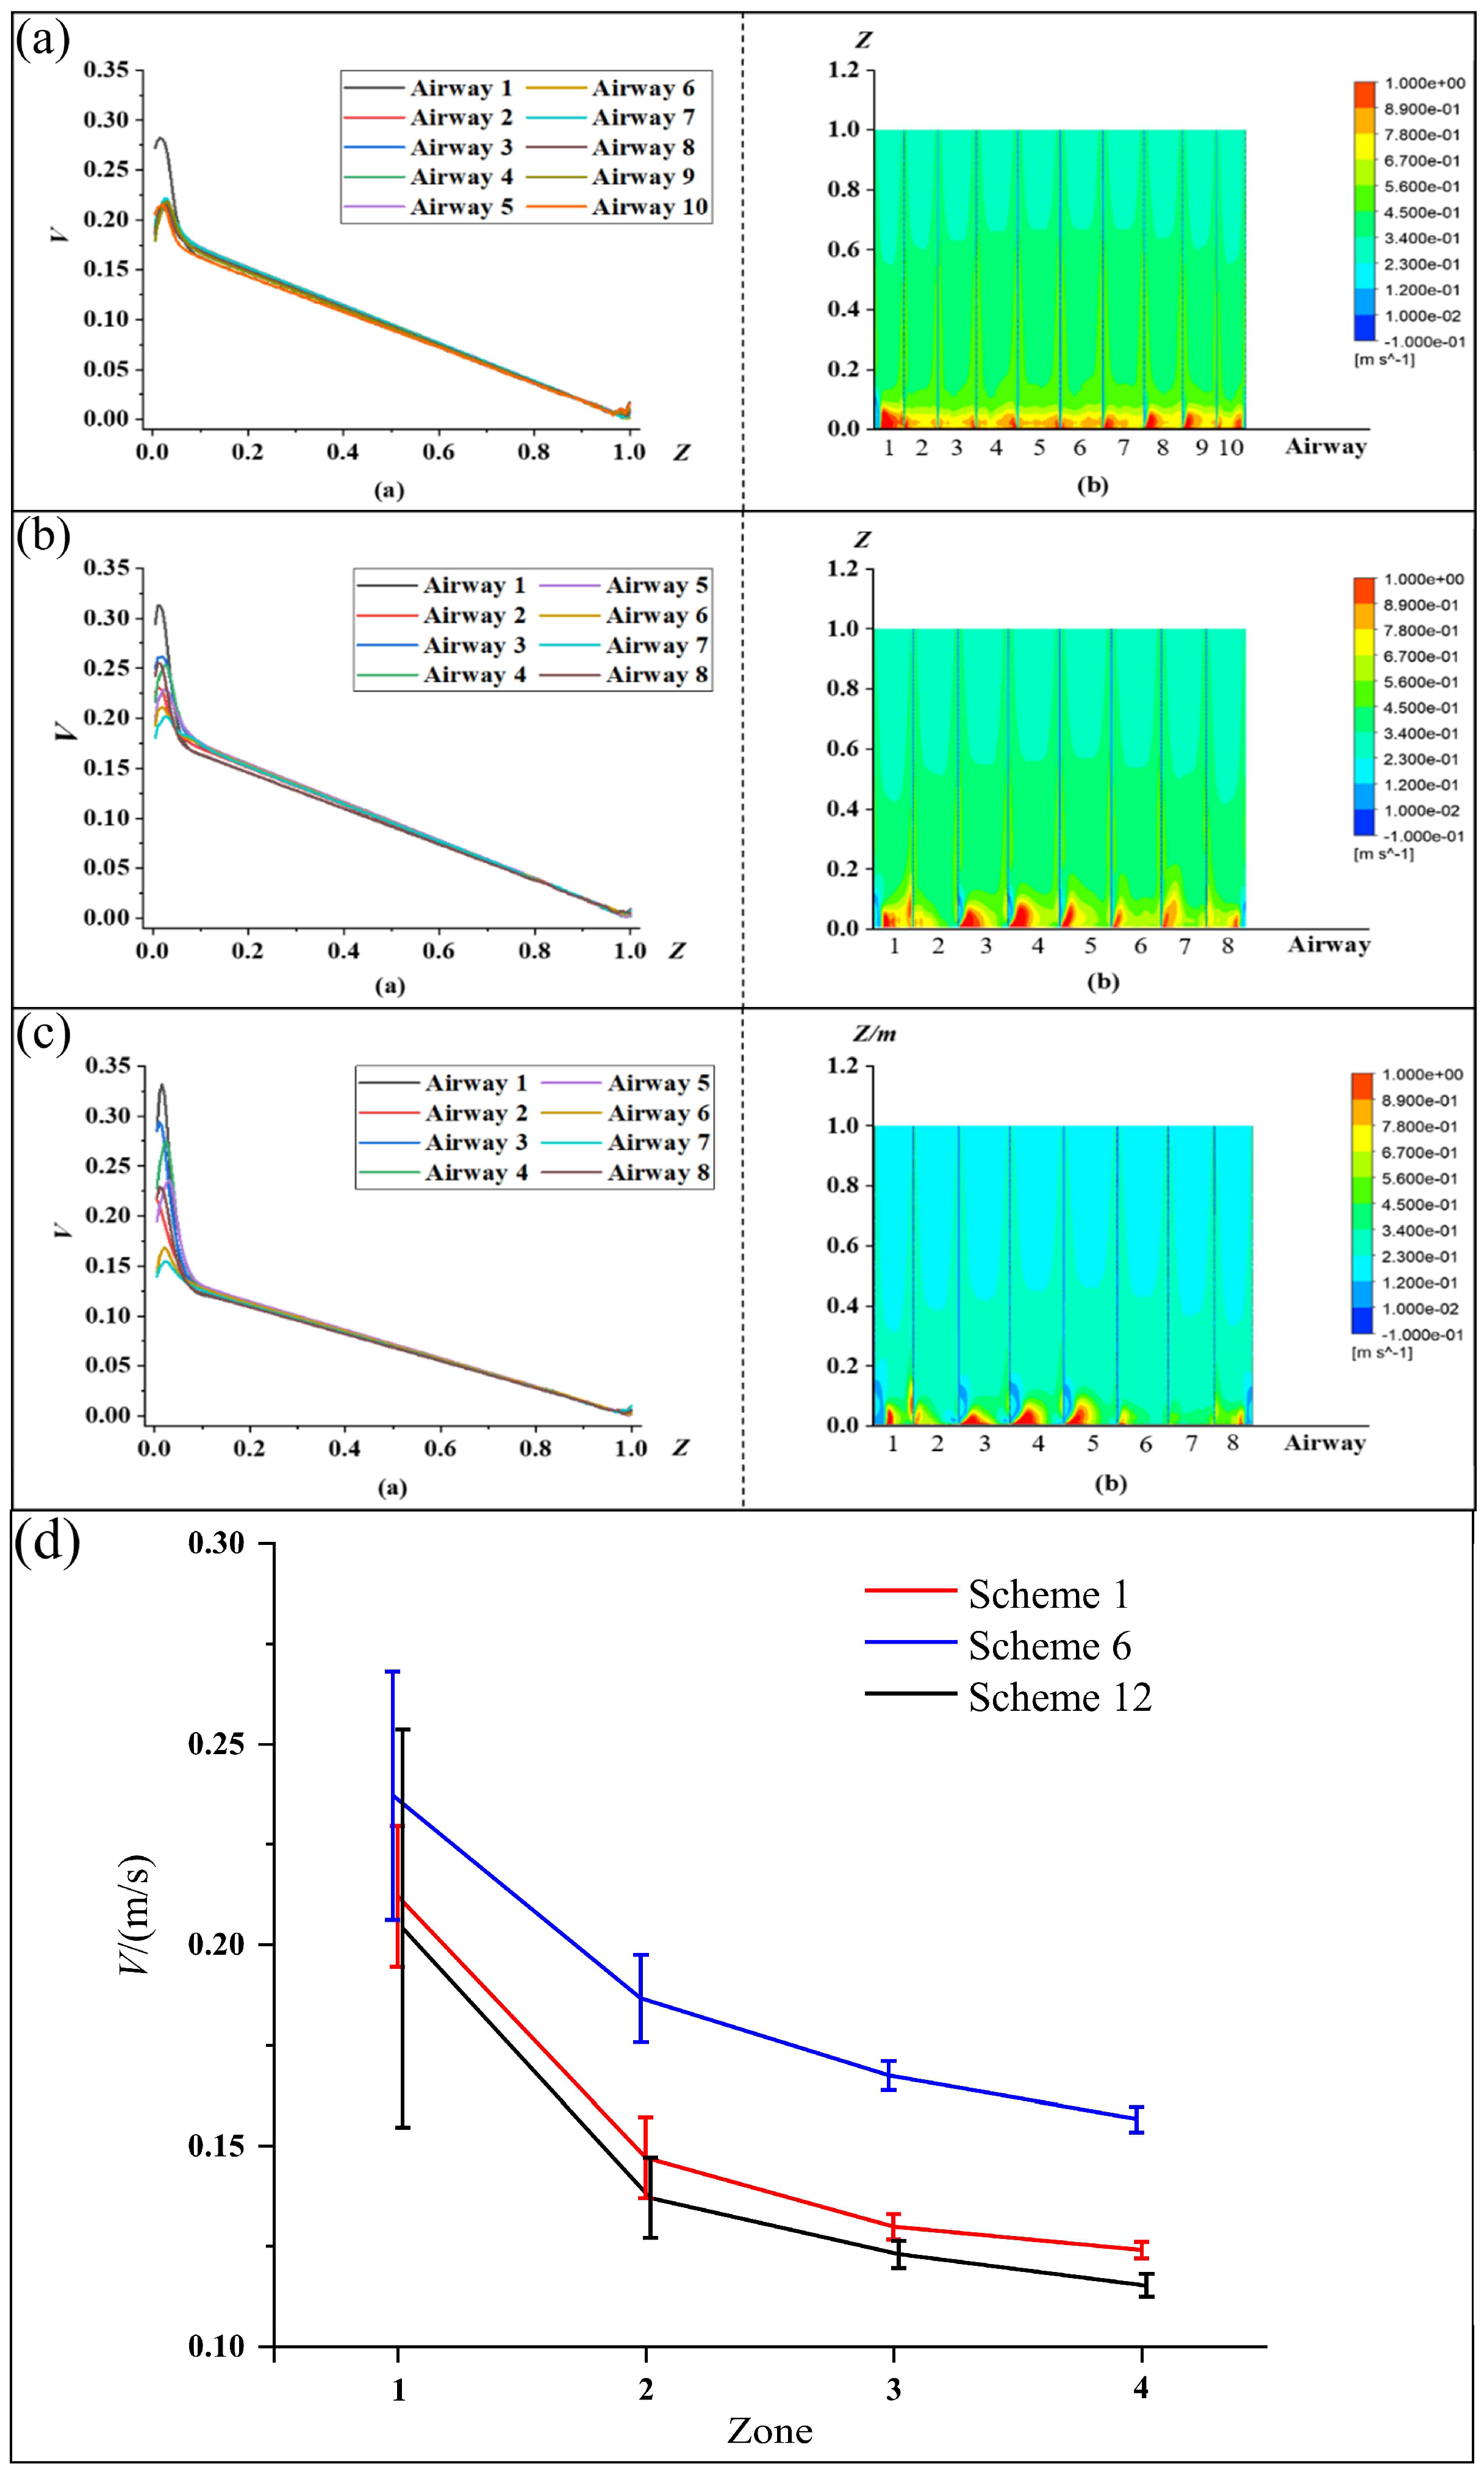
4.3. Analysis of Airway Velocity Uniformity

The numerical simulation analysis and SNR results of the Taguchi algorithm show that Scheme 1 (L = 180 mm, H = 17 mm) is the scheme with the best homogeneity of velocity distribution at the airway’s inlet and the best theoretical gentrifying effect. Scheme 12 (L = 220 mm, H = 23 mm) exhibits the worst velocity distribution uniformity and its fluidization effect is the worst. To further analyze the reasons for the differences between the schemes, the flow fields under three typical structural schemes (Scheme 1, the best scheme, Scheme 12, the worst scheme, and Scheme 6, the intermediate scheme) are selected for comparative analysis in this section and their structure-specific parameter levels can be obtained from Table 4. The gas velocity results of each airway along the Z-axis direction (the direction of airflow in the airway) simulated via CFD in Schemes 1, 6, and 12 are derived. The gas velocity attenuation curve in the airway is shown in Figure 7a–c. It can be found that as the values of L and H levels increase, the inlet cross-sectional area of individual airways gradually increases, changing the local velocity distribution at the airway inlet, which, in turn, affects the uniformity of the velocity distribution at the airway inlet.
Through the observation of the curves near the zero point of each scheme, it can be seen that Scheme 1 with the smallest L and H has the smallest velocity fluctuation at the inlet of the airway. From the corresponding velocity field, it can be seen that the velocity value at each inlet of Scheme 1 is relatively uniform and there is no unnecessary loss when the gas enters the inlet. With the increase in L and H, it can be found that the inlet velocity fluctuation in Scheme 6 also increases and the velocity uniformity between the gas passages is poor. As L and H continue to increase, there is a significant difference in the velocity at the airway inlet of Scheme 12. Therefore, at the airway inlet of Scheme 1, the homogeneity of gas velocity distribution is the best, whereas that of Scheme 12 is the worst.
Along the Z-axis direction of the program attenuation curves, the speed of the gas into the airway at the entrance of the airway can be observed, a velocity attenuation in the first place, the gas velocity attenuation range of Scheme 1 is small, scheme of 12 attenuation sharpest, Scheme 6 attenuation amplitude in the middle level, and then along the Z axis direction for uniform stability of gas flow velocity attenuation. To more intuitively compare the difference in uniformity of velocity distribution among the three schemes, we divided the range 0 < Z < 0.2 into four equal zones and calculated the average value and standard deviation of the inlet velocity in the airway in each of the four zones, as shown in Figure 7d. It can be seen from the figure that the average velocity gradually decays as the gas flows in the airway. It can be seen from the figure that the average velocity of the gas gradually decreases as it flows in the airway. On the other hand, the standard deviation of the three schemes also decreases as the mean velocity decreases, with Scheme 1 having the smallest standard deviation of the gas flow velocity in all four intervals, with values decreasing by 43.2%, 7.7%, 11.1%, 37.5%, and 64.5%, 0.1%, 3.5%, and 29.1% relative to Schemes 6 and 12, respectively.

4.4. Analysis of Test Effect

To check that the simulation’s results are accurate, the fluidized bed model of a powder tank truck is scaled down to perform the actual powder unloading test. The scaled model is shown in Figure 8a. Figure 8b shows the airway section in the experimental device and Figure 8c shows the airway section with breathable cloth. Test process: First, the discharge valve is closed before the start of the test and powder is loaded into the powder tank car through the charging port. Powder thickness is spread equally on the breathable cloth to observe the more evident fluidization state. Each test protocol uses the same weight, the same type of powder, and test parameters to reduce the error caused by additional factors. Then, gas is compressed to the air plenum at both ends of the model by an air compressor with an output power of 100 MPa, compressed gas flow through the air plenum to the airway, where on the breathable fabric of powder under the action of compressed gas began to flow, the pressure inside the tank reaches the required pressure, slowly opens the discharge valve, with the fluidization powder together with the gas flow to the discharge port. Finally, the remaining amount of powder on the fluidized bed’s breathable cloth is selected to compare the fluidization effect of each scheme.
Figure 9a,b present the test results of Schemes 1 and 12, respectively. The experimental results showed that in the model using Scheme 12, a large amount of powder remained in the corners of the fluidized bed after unloading, forming a dead zone of fluidization, while the model using Scheme 1 had a significantly reduced amount of powder residue and a significantly smaller dead zone after unloading. The residual powder was weighed and the powder residual rate was about 0.23% for Scheme 1 and 0.34% for Scheme 12. In addition, the overall fluidization effect of Scheme 1 was better. The experimental results are consistent with those obtained by the Taguchi method, which can also prove the correctness of the numerical simulation method in this paper.

5. Conclusions

In this paper, the structure of the fluidized bed that is used for powder unloading is studied and optimized. On the basis of the Taguchi method, two factors and four levels of orthogonal test were established for the structural parameters of fluidized bed and there are 16 different varieties of fluidized bed structures that were designed. Then, CFD is used to numerically simulate 16 different types of fluidized beds. The calculated velocity distribution uniformity is chosen as the response. With the help of the Taguchi method and the multiple regression analysis of velocity distribution uniformity, the following conclusions are drawn:
(1)
The Taguchi method’s outcomes demonstrate that airway arc length (delta = 6.28, rank = 1) exerts a greater effect on SNR than airway height (delta = 1.80, rank = 2). The parameter combination of 180 mm L and 17 mm H for obtaining the optimal velocity distribution uniformity is determined.
(2)
Multiple regression analysis indicates that L and H are positively correlated with the uniformity of velocity distribution. L and H exert statistically significant effects. The effect of L is the greatest, whereas that of H is the minimum.
(3)
The gas velocity attenuation trends of the 16 schemes are basically the same. At the airway’s entrance, the relative velocity will decay once with a large range and the subsequent gas velocity will decelerate at a uniform rate in the airway until the attenuation at the end of the airway reaches zero. The velocity curve and velocity field diagram show that the velocity fluctuation at each airway’s entrance in Scheme 1 is small and its velocity distribution uniformity is the least.
(4)
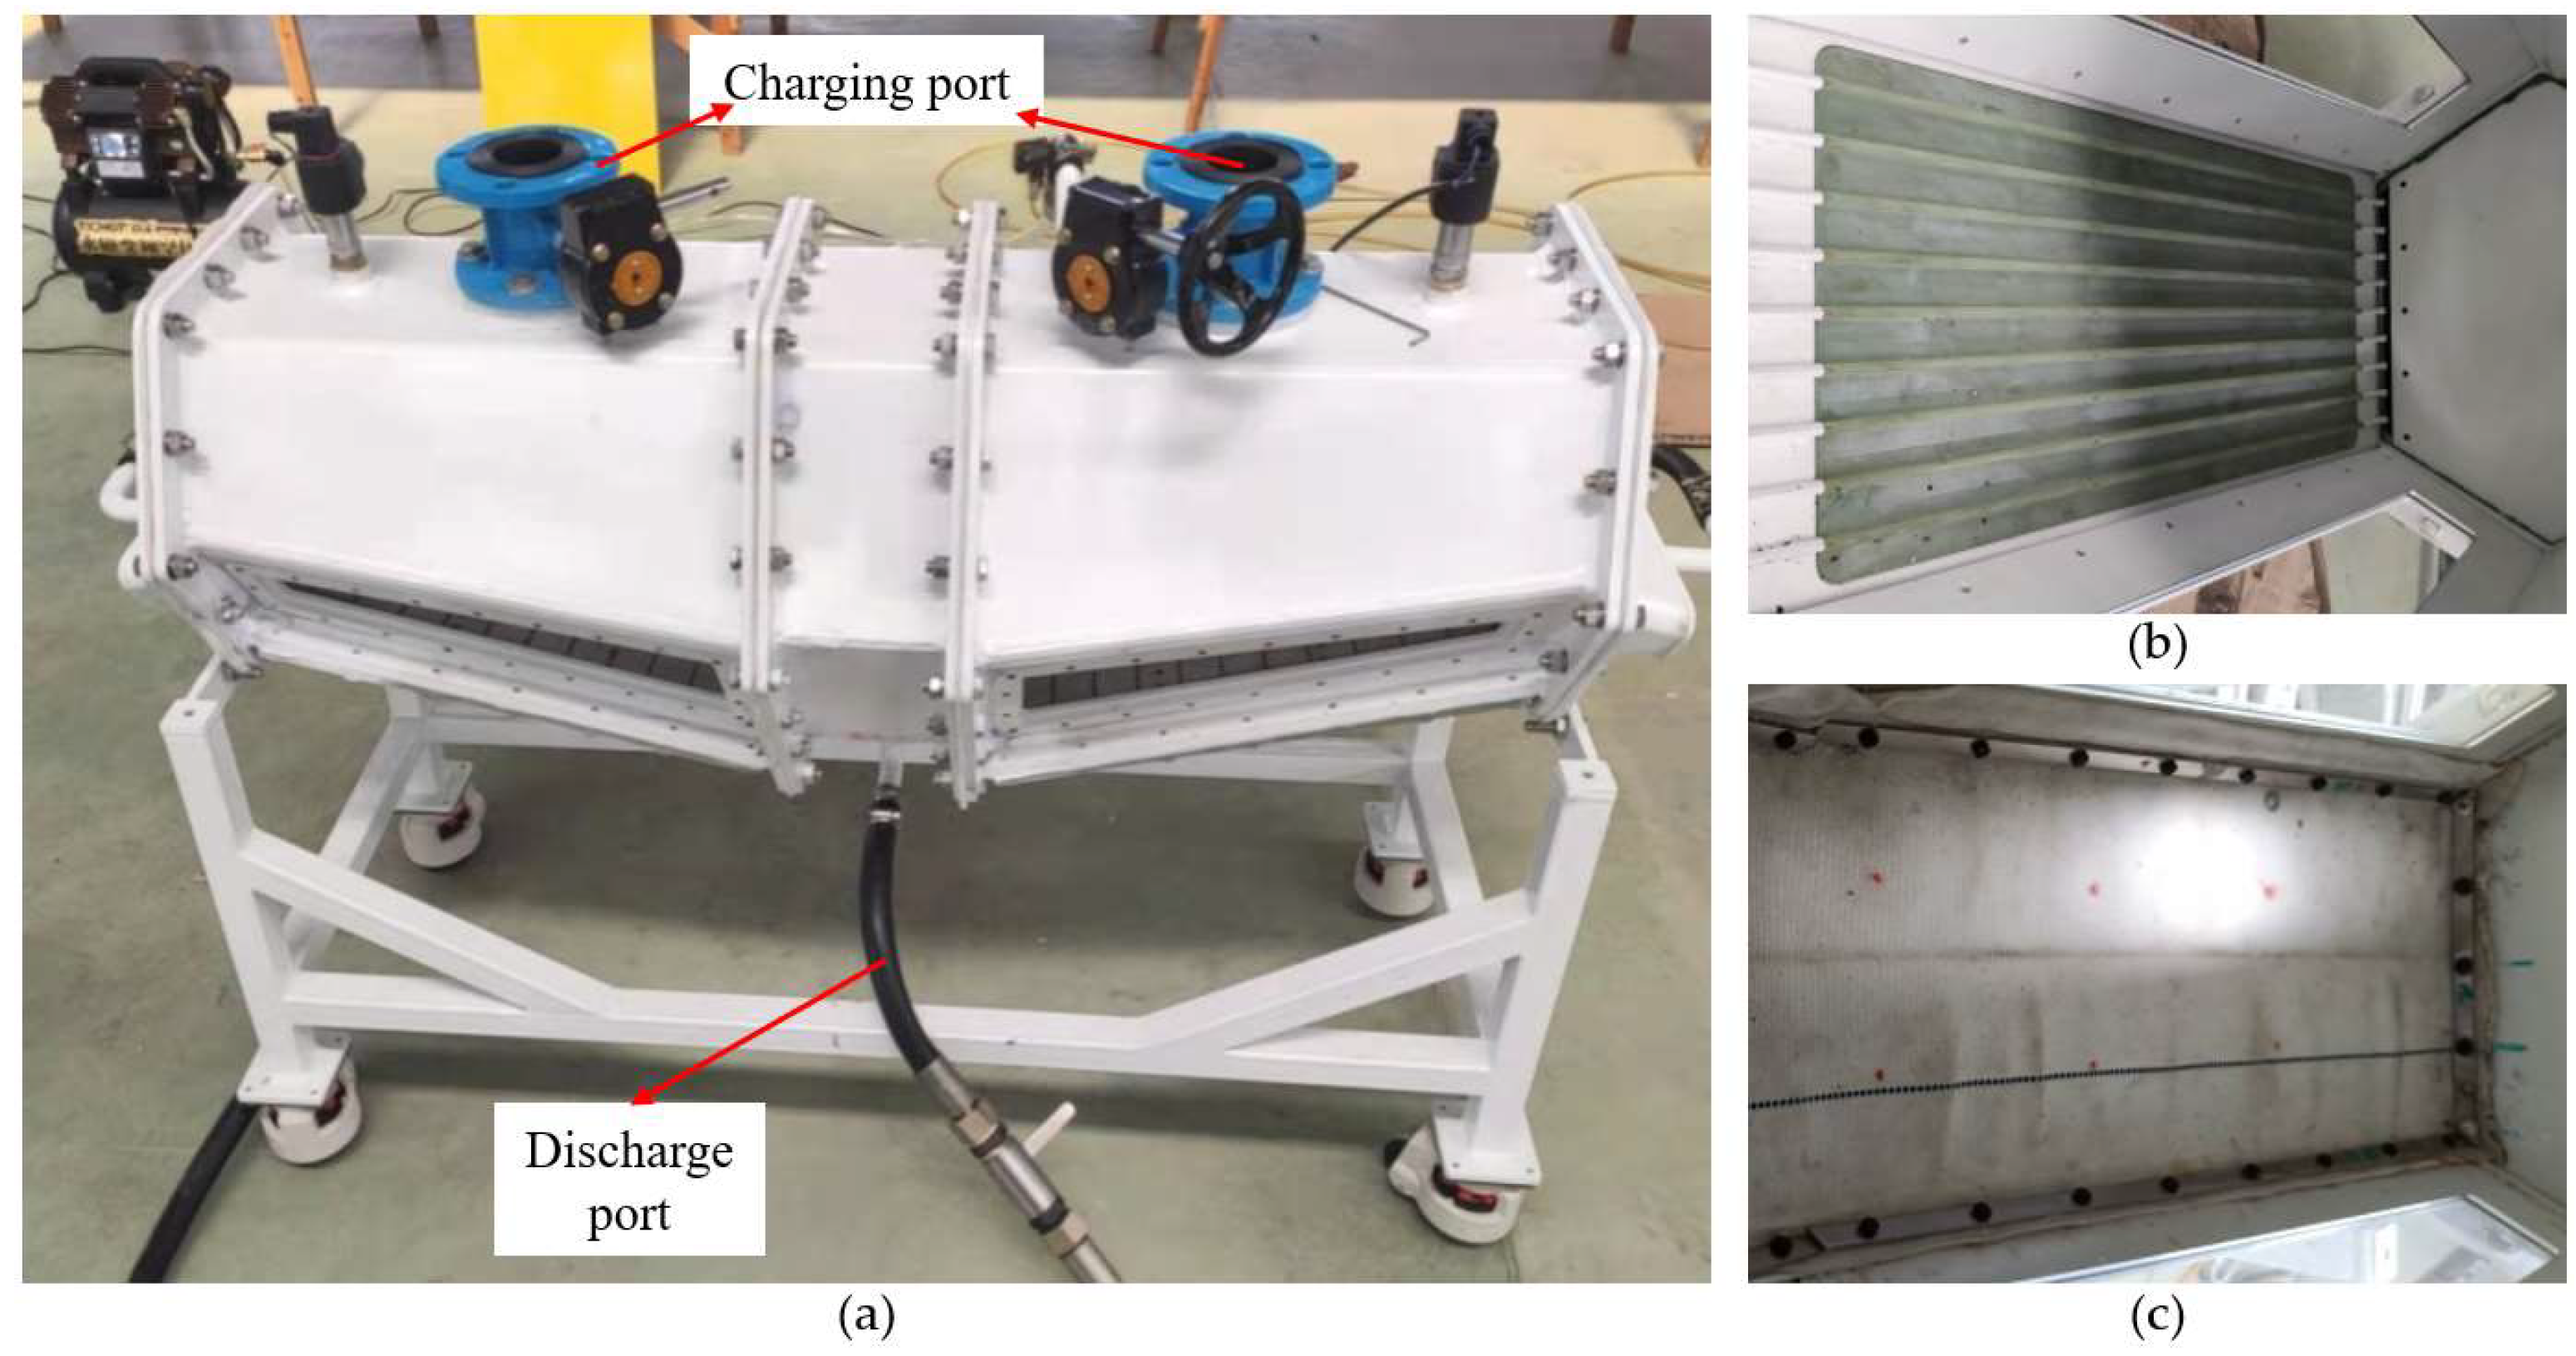
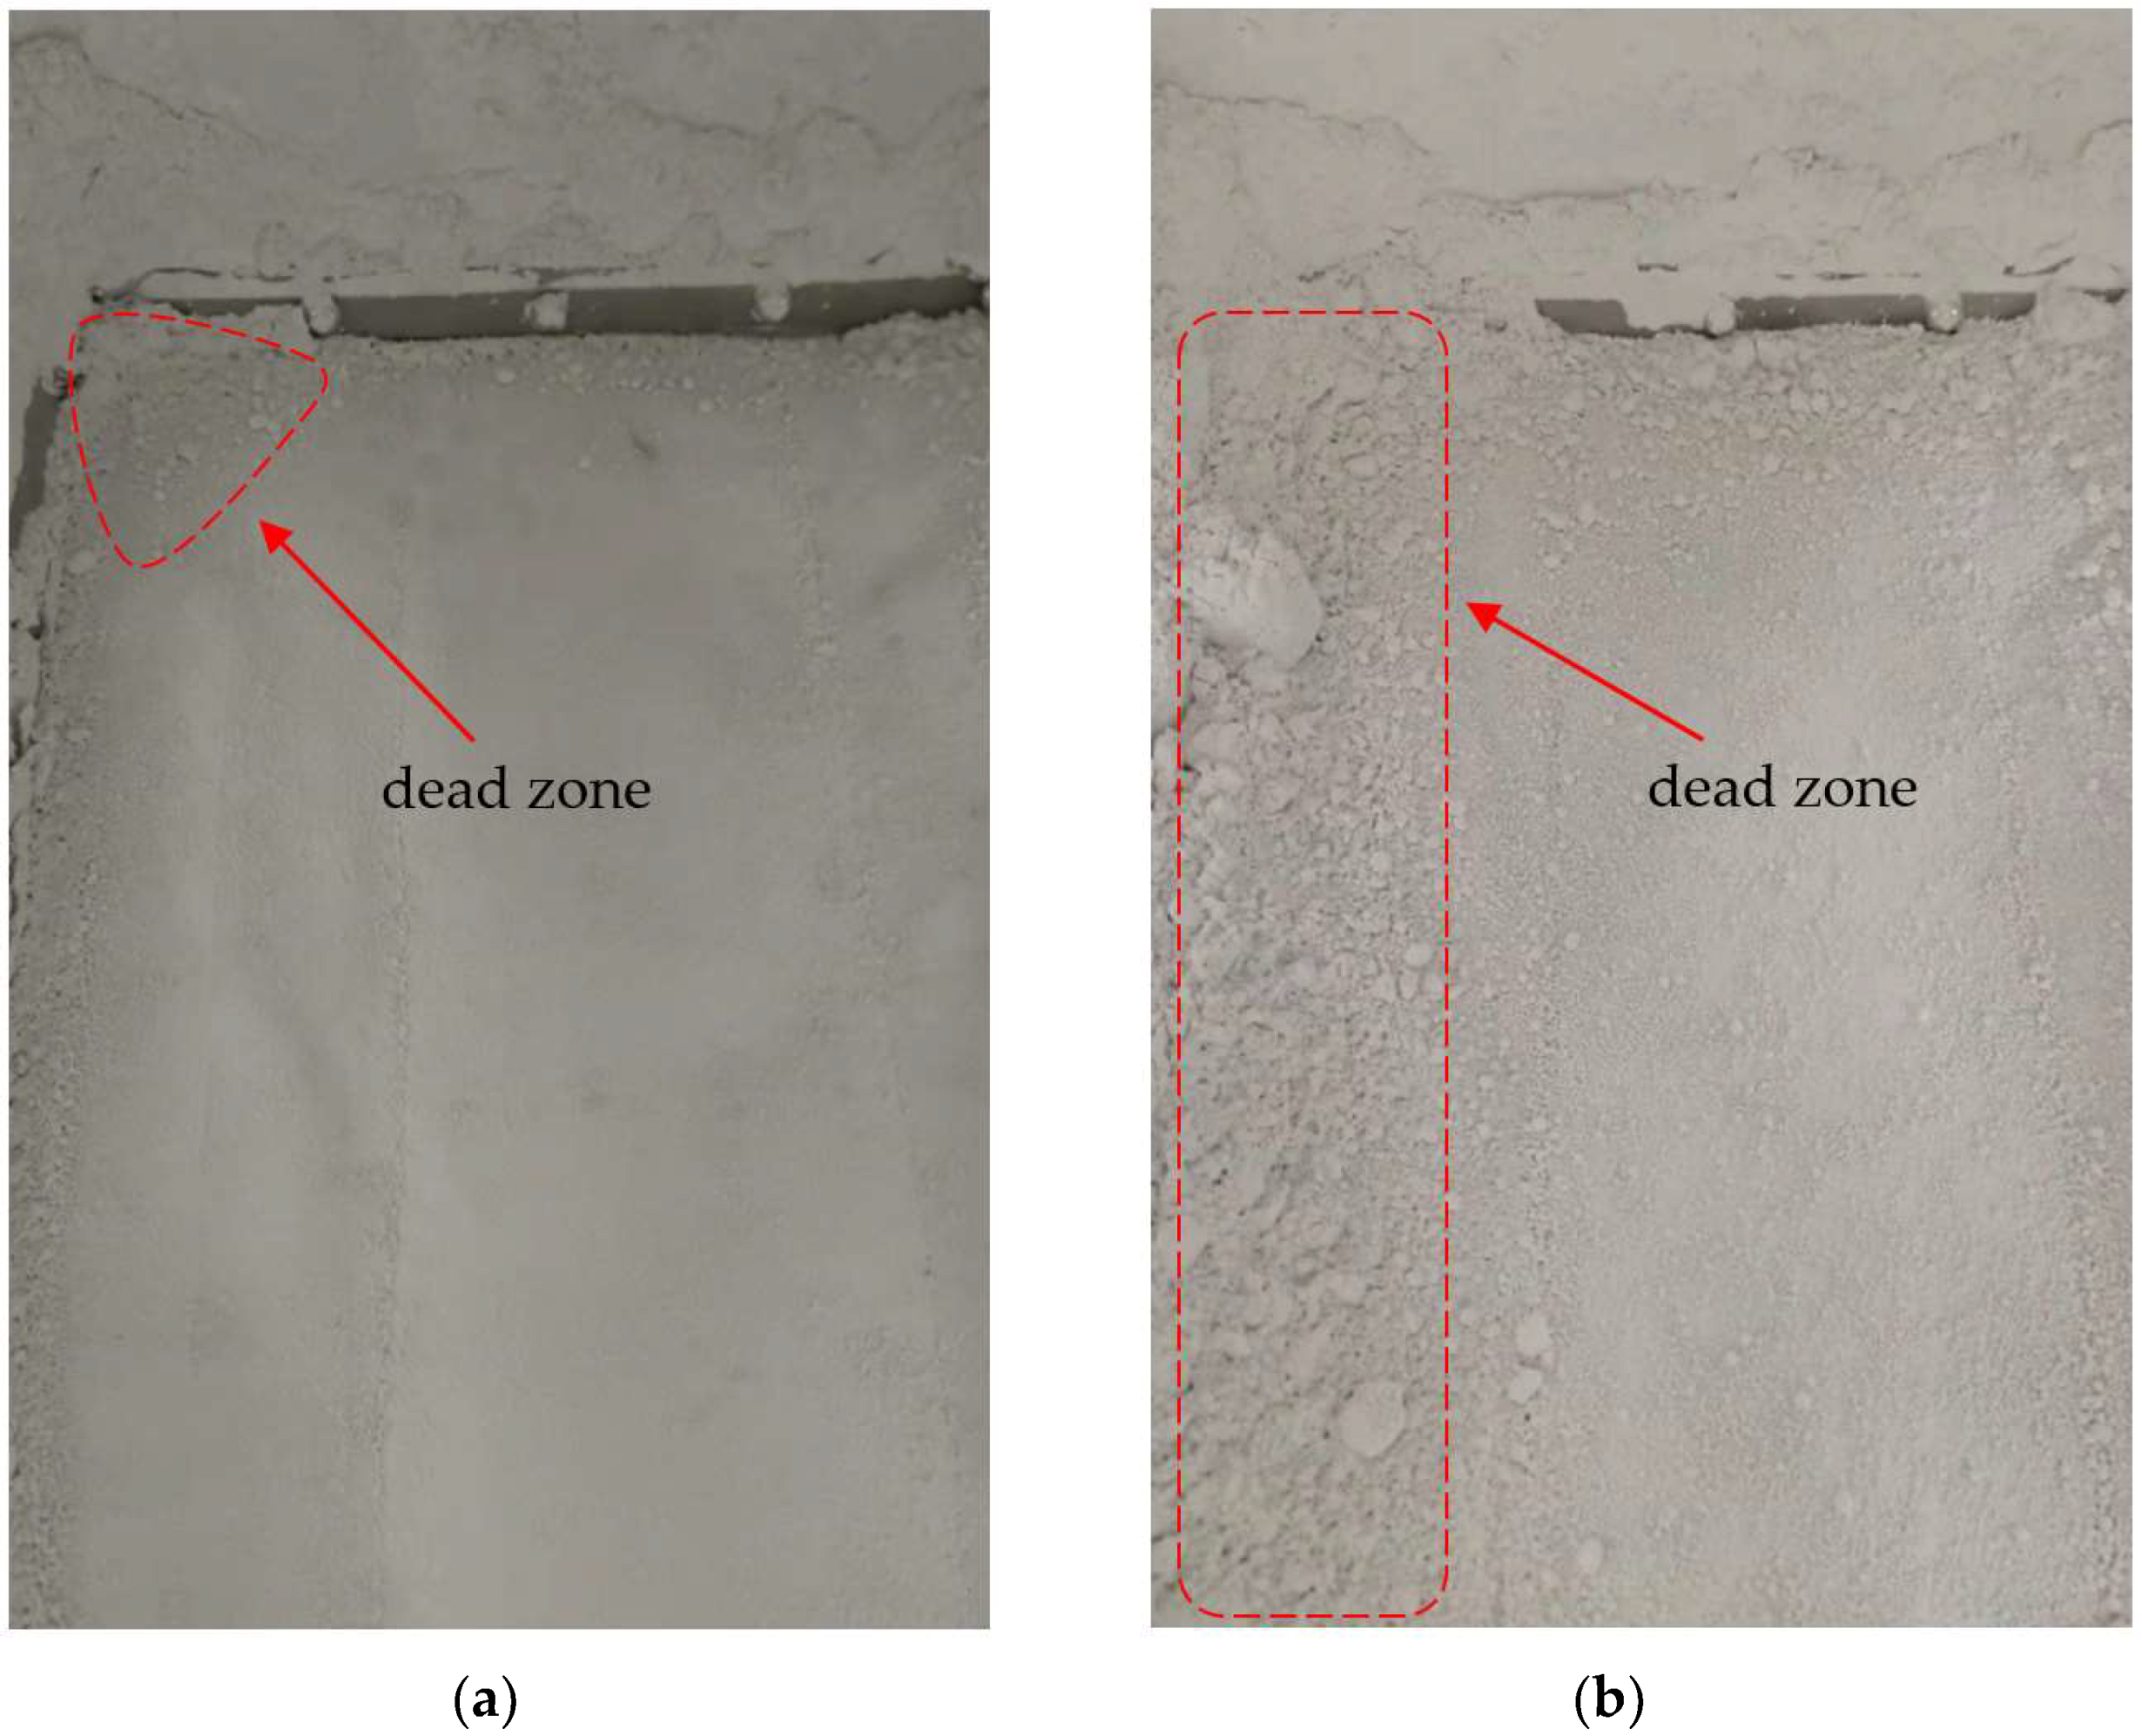
The experimental results indicate that the overall fluidization effect of Scheme 1 is the best and the amount of powder remaining on the breathable cloth is the least. These findings are in line with the Taguchi method’s optimum outcomes.

Author Contributions

Data curation, H.Y., S.L. and F.W.; Formal analysis, S.L. and J.L.; Funding acquisition, H.Y.; Investigation, T.X.; Methodology, H.Y.; Project administration, Y.Z.; Resources, H.Y., T.X. and Y.Z.; Software, S.L., F.W. and W.X.; Supervision, Y.Z.; Validation, W.X. and J.L.; Visualization, F.W.; Writing—original draft, S.L.; Writing—review and editing, H.Y. All authors have read and agreed to the published version of the manuscript.

Funding

This work was supported by the Fundamental Research Funds for the Central Universities (NO: JZ2021HGTB0090, JZ2022HGTB0272), the University Synergy Innovation Program of Anhui Province under Grant No.GXXT-2019-004, Anhui Provincial Key Research and Development Program (Grant No.2022a05020001), and the financial support provided by the National Natural Science Foundation of China (51806053).

Institutional Review Board Statement

Not applicable.

Informed Consent Statement

Not applicable.

Data Availability Statement

The data presented in this study are available on request from the corresponding author.

Acknowledgments

We would like to express our sincere thanks to the editors and reviewers who have contributed valuable comments to improve the quality of the paper.

Conflicts of Interest

The authors declare no conflict of interest.

References

  1. Hartge, E.-U.; Ratschow, L.; Wischnewski, R.; Werther, J. CFD-simulation of a circulating fluidized bed riser. Particuology 2009, 7, 283–296. [Google Scholar] [CrossRef]
  2. Rashid, T.A.B.; Zhu, L.-T.; Luo, Z.-H. Comparative analysis of numerically derived drag models for development of bed expansion ratio correlation in a bubbling fluidized bed. Adv. Powder Technol. 2020, 31, 2723–2732. [Google Scholar] [CrossRef]
  3. Gupta, S.K.; Agarwal, V.K.; Singh, S.N.; Seshadri, V.; Mills, D. Parameters Affecting Fluidized Motion Conveying of Fly Ash. Part. Sci. Technol. 2009, 27, 469–487. [Google Scholar] [CrossRef]
  4. Liu, H.; Li, P.; Lew, J.V. CFD study on flow distribution uniformity in fuel distributors having multiple structural bifurcations of flow channels. Int. J. Hydrog. Energy 2010, 35, 9186–9198. [Google Scholar] [CrossRef]
  5. Chen, Y.; Hou, T.; Zhou, X. Qualitative analysis of coupling effect of fluid velocity distribution in microchannels on the performance of the LED water cooling system. Int. J. Numer. Methods Heat Fluid Flow 2019, 29, 3893–3907. [Google Scholar] [CrossRef]
  6. Joseph, V.R.; Delaney, J.D. Analysis of Optimization Experiments. J. Qual. Technol. 2017, 40, 282–298. [Google Scholar] [CrossRef]
  7. Maazinejad, B.; Mohammadnia, O.; Ali, G.A.M.; Makhlouf, A.S.H.; Nadagouda, M.N.; Sillanpää, M.; Asiri, A.M.; Agarwal, S.; Gupta, V.K.; Sadegh, H. Taguchi L9 (34) orthogonal array study based on methylene blue removal by single-walled carbon nanotubes-amine: Adsorption optimization using the experimental design method, kinetics, equilibrium and thermodynamics. J. Mol. Liq. 2020, 298, 112001. [Google Scholar] [CrossRef]
  8. Deb, M.; Majumder, A.; Banerjee, R.; Sastry, G.R.K.; Bose, P.K. A Taguchi-fuzzy based multi-objective optimization study on the soot-NOx-BTHE characteristics of an existing CI engine under dual fuel operation with hydrogen. Int. J. Hydrogen Energy 2014, 39, 20276–20293. [Google Scholar] [CrossRef]
  9. Arkadan, A.-R.A.; Al-Aawar, N.; Hariri, A.O. EM-Taguchi Module for Characterization of WAD. IEEE Trans. Magn. 2015, 51, 8202304. [Google Scholar] [CrossRef]
  10. Lin, C.-H.; Hwang, C.-C. Multiobjective Optimization Design for a Six-Phase Copper Rotor Induction Motor Mounted With a Scroll Compressor. IEEE Trans. Magn. 2016, 52, 9401604. [Google Scholar] [CrossRef]
  11. Sobhani, M.; Ajam, H. Taguchi optimization for natural convection heat transfer of Al2O3 nanofluid in a partially heated cavity using LBM. J. Therm. Anal. Calorim. 2019, 138, 889–904. [Google Scholar] [CrossRef]
  12. Toghyani, S.; Fakhradini, S.; Afshari, E.; Baniasadi, E.; Abdollahzadeh Jamalabadi, M.Y.; Safdari Shadloo, M. Optimization of operating parameters of a polymer exchange membrane electrolyzer. Int. J. Hydrogen Energy 2019, 44, 6403–6414. [Google Scholar] [CrossRef]
  13. Zhokh, A.A.; Strizhak, P.E. Investigation of the Time-Dependent Transitions Between the Time-Fractional and Standard Diffusion in a Hierarchical Porous Material. Transp. Porous Media 2020, 133, 497–508. [Google Scholar] [CrossRef]
  14. Bilirgen, H.; Levy, E.; Yilmaz, A. Prediction of pneumatic conveying flow phenomena using commercial CFD software. Powder Technol. 1998, 95, 37–41. [Google Scholar] [CrossRef]
  15. Miao, Z.; Kuang, S.; Zughbi, H.; Yu, A. CFD simulation of dilute-phase pneumatic conveying of powders. Powder Technol. 2019, 349, 70–83. [Google Scholar] [CrossRef]
  16. Behera, N.; Agarwal, V.K.; Jones, M.G.; Williams, K.C. CFD modeling and analysis of dense phase pneumatic conveying of fine particles including particle size distribution. Powder Technol. 2013, 244, 30–37. [Google Scholar] [CrossRef]
  17. Biçer, N.; Engin, T.; Yaşar, H.; Büyükkaya, E.; Aydın, A.; Topuz, A. Design optimization of a shell-and-tube heat exchanger with novel three-zonal baffle by using CFD and taguchi method. Int. J. Therm. Sci. 2020, 155, 106417. [Google Scholar] [CrossRef]
  18. Zhang, K.; Wang, S.; Tang, Y.; He, Y.; Zhao, Y. Evaluation of drag force around bubble in an incipiently fluidized bed via a coupled CFD-DEM approach. Powder Technol. 2020, 370, 80–87. [Google Scholar] [CrossRef]
  19. Yan, H.; Su, X.; Zhang, H.; Hang, J.; Zhou, L.; Liu, Z.; Wang, Z. Design approach and hydrodynamic characteristics of a novel bionic airfoil. Ocean Eng. 2020, 216, 108076. [Google Scholar] [CrossRef]
  20. Canbolat, A.S.; Bademlioglu, A.H.; Arslanoglu, N.; Kaynakli, O. Performance optimization of absorption refrigeration systems using Taguchi, ANOVA and Grey Relational Analysis methods. J. Clean. Prod. 2019, 229, 874–885. [Google Scholar] [CrossRef]
  21. Chen, Q.; Zeng, M.; Zhang, J.; Wang, Q. Optimal design of bi-layer interconnector for SOFC based on CFD-Taguchi method. Int. J. Hydrogen Energy 2010, 35, 4292–4300. [Google Scholar] [CrossRef]
  22. Shaji, S.; Radhakrishnan, V. Analysis of process parameters in surface grinding with graphite as lubricant based on the Taguchi method. J. Mater. Process. Technol. 2003, 141, 51–59. [Google Scholar] [CrossRef]
  23. Rodríguez Collado, L.; Collado Contreras, M.; Rodríguez Malaver, E.; Patiño, L. Numerical analysis of air behavior in an air conditioning distribution system using k-ε turbulence, rng k-ε and reynolds tensions methods. Ingeniare. Rev. Chil. De Ing. 2008, 16, 1585–1596. [Google Scholar] [CrossRef]
  24. Zhan, J.M.; Fan, Q.; Hu, W.Q.; Gong, Y.J. Hybrid realizable k-ε/ laminar method in the application of 3D heaving OWCs. Renew. Energy 2020, 155, 691–702. [Google Scholar] [CrossRef]
  25. Ustaoglu, A.; Kursuncu, B.; Alptekin, M.; Gok, M.S. Performance optimization and parametric evaluation of the cascade vapor compression refrigeration cycle using Taguchi and ANOVA methods. Appl. Therm. Eng. 2020, 180, 115816. [Google Scholar] [CrossRef]
Figure 1. Physical model of fluidized bed for powder tank truck.
Atmosphere 13 01513 g001
Figure 2. CFD computational domain and grid diagram. (a) CFD computational domain; (b) Airway grid.
Atmosphere 13 01513 g002
Figure 3. Grid independence validation. (a) Vu; (b) R2.
Atmosphere 13 01513 g003
Figure 4. (a) Mean main effect; (b) SNR main effect.
Atmosphere 13 01513 g004
Figure 5. SNR residual diagram.
Atmosphere 13 01513 g005
Figure 6. (a) Pareto chart for two factors at α = 0.05; (b) Scatter plot.
Atmosphere 13 01513 g006
Figure 7. Gas velocity analysis of the fluidized bed airway. (ac) Gas velocity attenuation curve and velocity field diagram of Scheme 1, Scheme 6, and Scheme 12; (d) Standard deviation of velocity distribution for the three schemes.
Atmosphere 13 01513 g007
Figure 8. Unloading experimental device. (a) Scaled model; (b) Airway display; (c) Breathable cloth.
Atmosphere 13 01513 g008
Figure 9. Effects of the two schemes for powder unloading. (a) Scheme 1; (b) Scheme 12.
Atmosphere 13 01513 g009
Table 1. Selection factors and levels.
FactorsSymbolLevels of the Factors
Level-ILevel-IILevel-IIILevel-IV
Airway arc length (mm) L180200220240
Airway height (mm) H17192123
Table 2. L16 orthogonal array table.
Trial No.Qm = 0.060 kg/sQm = 0.045 kg/s
LHLH
L1180 (I)17 (I)180 (I)17 (I)
L2180 (I)19 (II)180 (I)19 (II)
L3180 (I)21 (III)180 (I)21 (III)
L4180 (I)23 (IV)180 (I)23 (IV)
L5200 (II)17 (I)200 (II)17 (I)
L6200 (II)19 (II)200 (II)19 (II)
L7200 (II)21 (III)200 (II)21 (III)
L8200 (II)23 (IV)200 (II)23 (IV)
L9220 (III)17 (I)220 (III)17 (I)
L10220 (III)19 (II)220 (III)19 (II)
L11220 (III)21 (III)220 (III)21 (III)
L12220 (III)23 (IV)220 (III)23 (IV)
L13240 (IV)17 (I)240 (IV)17 (I)
L14240 (IV)19 (II)240 (IV)19 (II)
L15240 (IV)21 (III)240 (IV)21 (III)
L16240 (IV)23 (IV)240 (IV)23 (IV)
Table 3. Grid independence validation.
Grid No.Grid NumberVuR2
Air PlenumAirwayTransition AreaPorous Layer
16044901109460409024828040.0388
27752981382760514146332040.024114.35%
312774011788570631268036040.01845.594%
420976022159920806619940040.01680.756%
53098873511839018743422460040.01710.032%
Table 4. Uniformity of velocity distribution.
Trial No.Factors and LevelsVu
L (mm)H (mm)Qm = 0.060 kg/sQm = 0.045 kg/s
1180170.01679260.0191996
2180190.01602410.0192341
3180210.02032090.0235524
4180230.01934480.0217724
5200170.02591470.0280378
6200190.02884940.0370717
7200210.03319270.0279729
8200230.03452420.0341140
9220170.03924670.0415833
10220190.04162650.0275919
11220210.05340730.0305375
12220230.05117400.0303374
13240170.03848840.0233300
14240190.04889280.0185115
15240210.05345160.0359072
16240230.05994890.0325685
Table 5. SNR response table (STB).
LevelLH
134.2031.02
230.1230.57
327.9129.37
427.9429.22
Delta6.281.80
Rank12
Table 6. Mean response table.
LevelLH
10.01950.0290
20.03120.0297
30.03940.0347
40.03890.0354
Delta0.01990.0064
Rank12
Publisher’s Note: MDPI stays neutral with regard to jurisdictional claims in published maps and institutional affiliations.

