3.1. Characteristics of Air Quality Class Changes
In
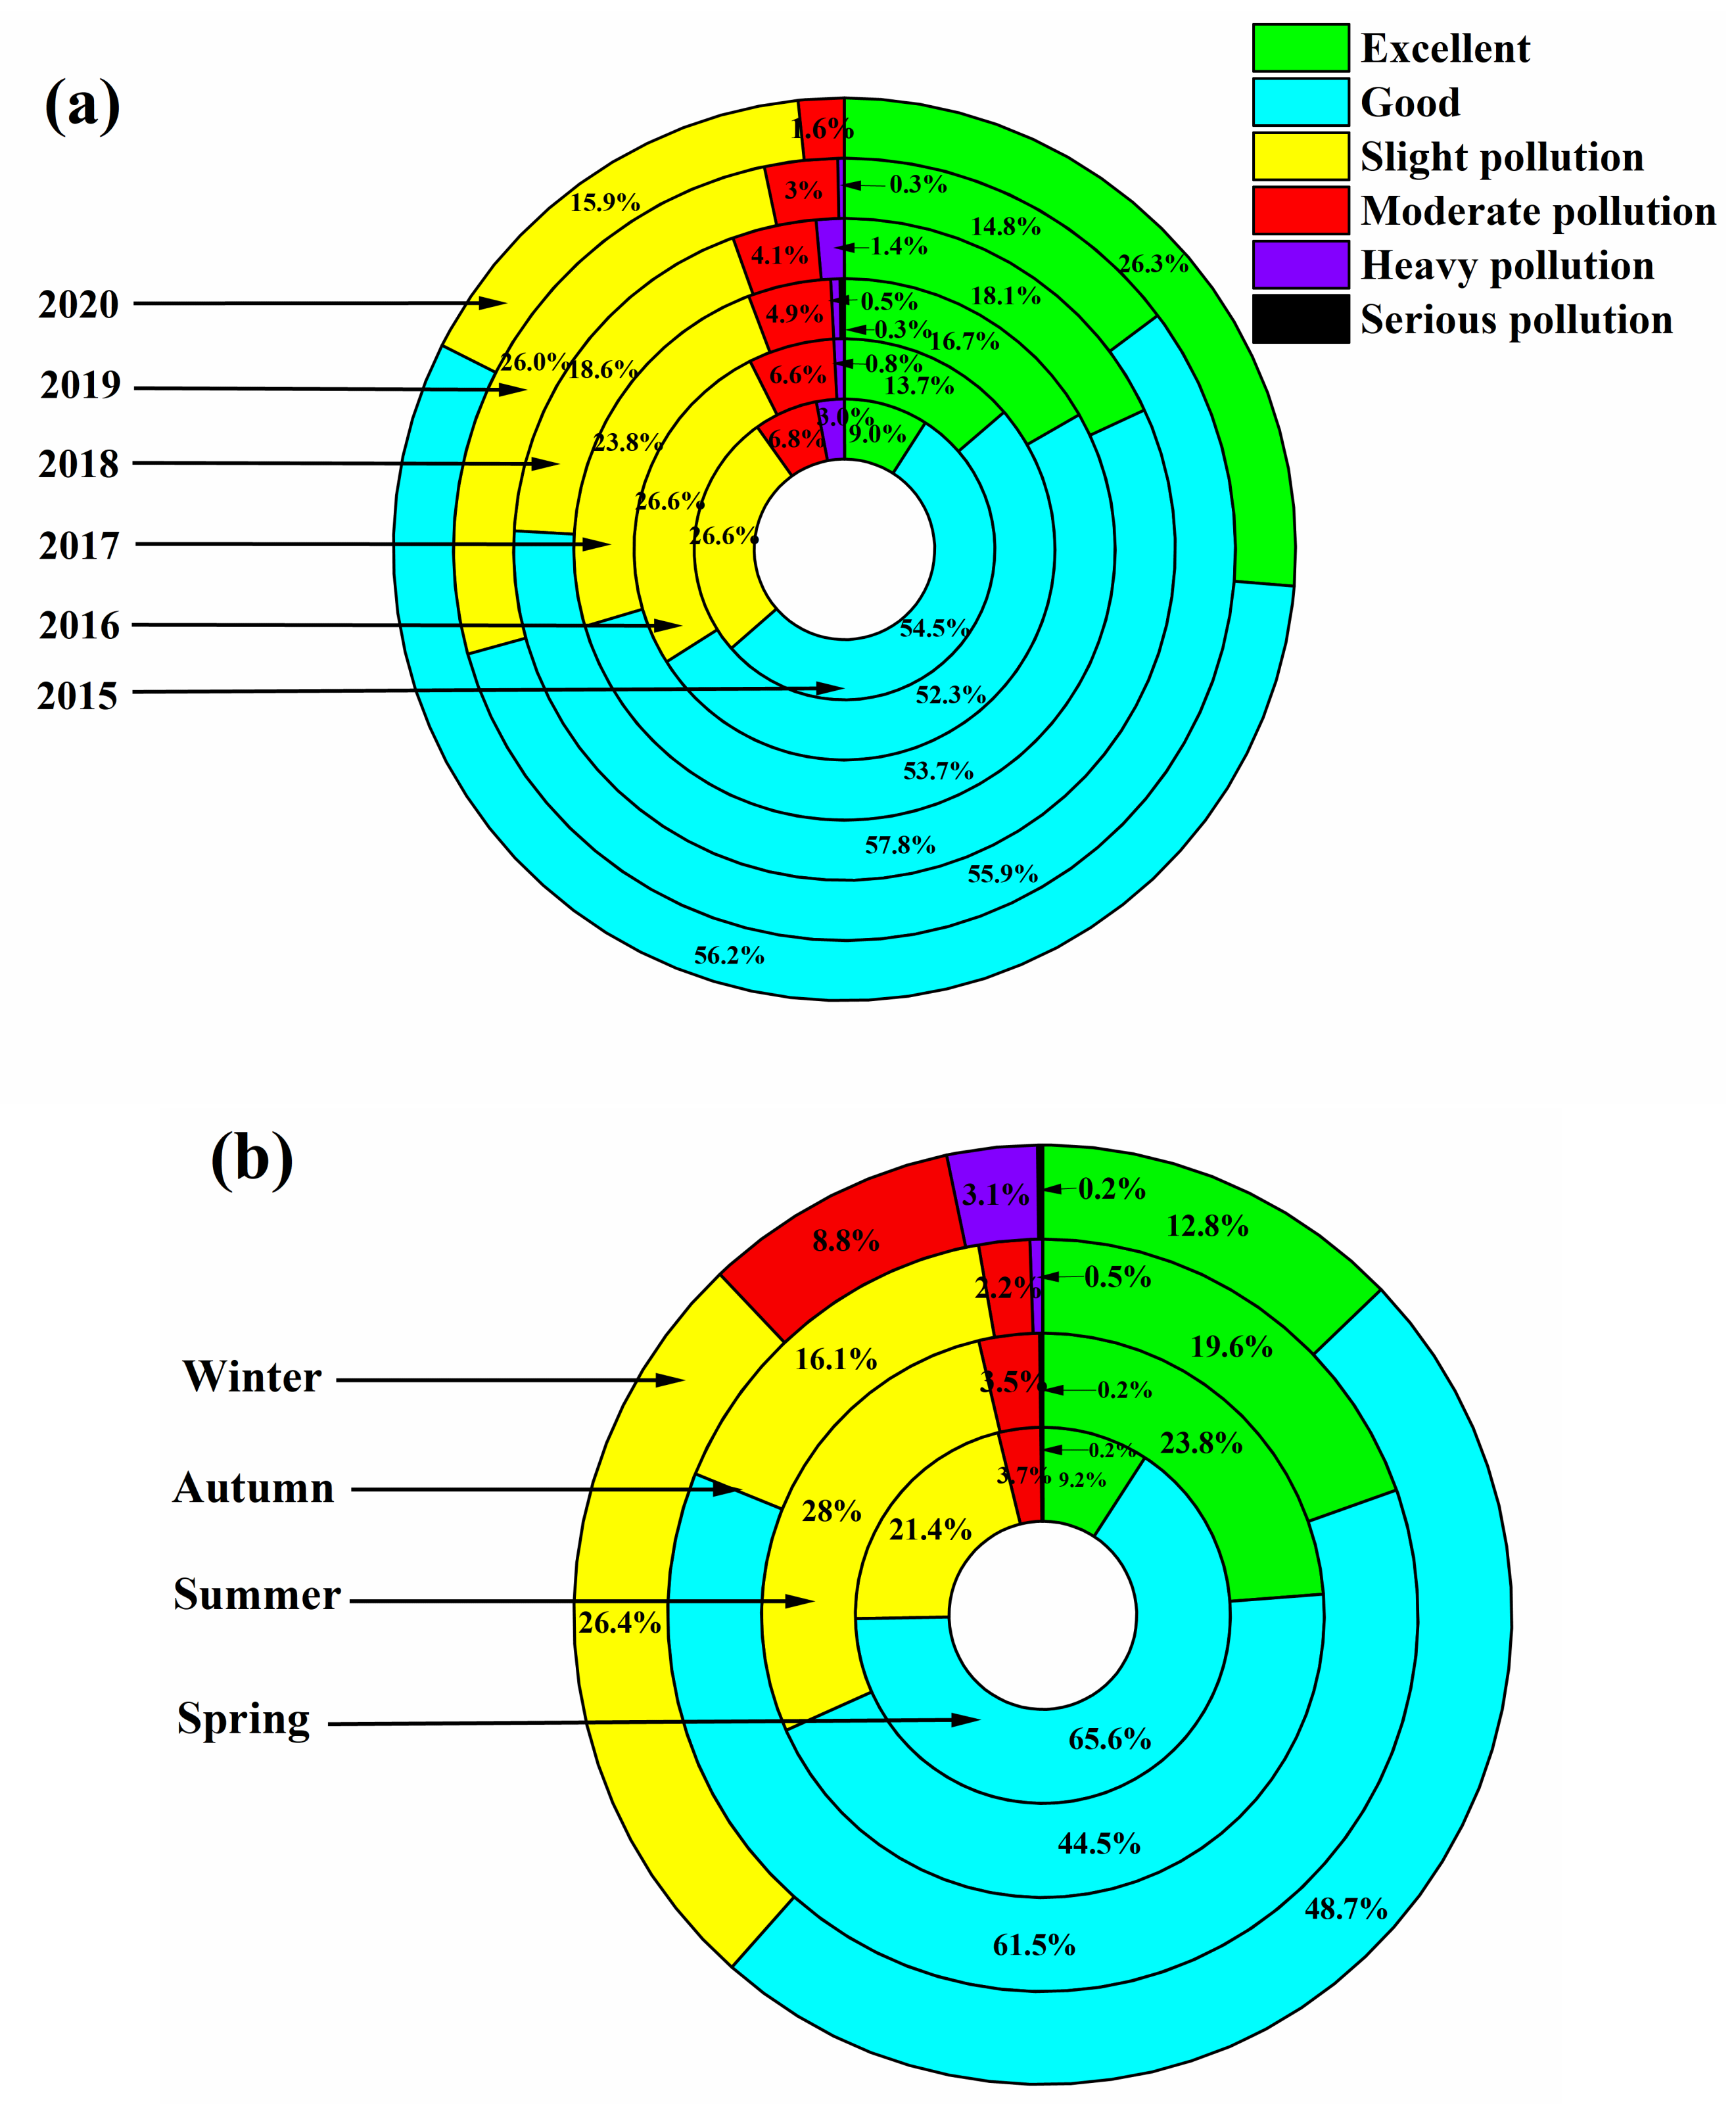
Figure 1a, it can be seen that the annual variation in the number of days with different air quality classes during the observation period varied significantly. The corresponding PM
2.5 and O
3 concentration limits of the air quality classes are referred to in
Table 1. The number of days with excellent air quality in 2015–2020 showed a significant upward trend, from 33 days in 2015 to 96 days in 2020, with an annual increase of 38.2%; the number of days with good air quality did not change significantly, all within 210 days; the number of days with slight air quality pollution showed a decreasing trend overall, but the number of days with slight pollution increased in 2019. The number of days with moderate air quality pollution decreased yearly from 2015 to 2020, from 25 days in 2015 to only six days in 2020, with an annual rate of decline of 15.2%; the number of days with heavy pollution showed a relatively apparent downward trend, with no heavy pollution in 2020; and there was only one day with serious pollution in 2017. It can be seen that the air quality from 2015 to 2020 showed a clear trend of improvement.
As shown in
Figure 1b, the seasonal differences in the number of days with different air quality levels during the observation period were significant. The proportion of days with slight pollution was summer (28.0%) > winter (26.4%) > spring (21.4%) > autumn (16.1%); the proportion of moderate pollution was 8.8% in winter, which was 2.3, 2.5, and 4.0 times higher than those in spring, summer, and autumn respectively; the proportion of days with heavy pollution was 3.1% in winter, which was significantly higher than those in spring, summer, and autumn. In addition, there was one day of serious pollution in winter. As can be seen, slight pollution was most likely to occur in summer, whereas moderate, heavy, and serious pollution were all concentrated in winter.
In
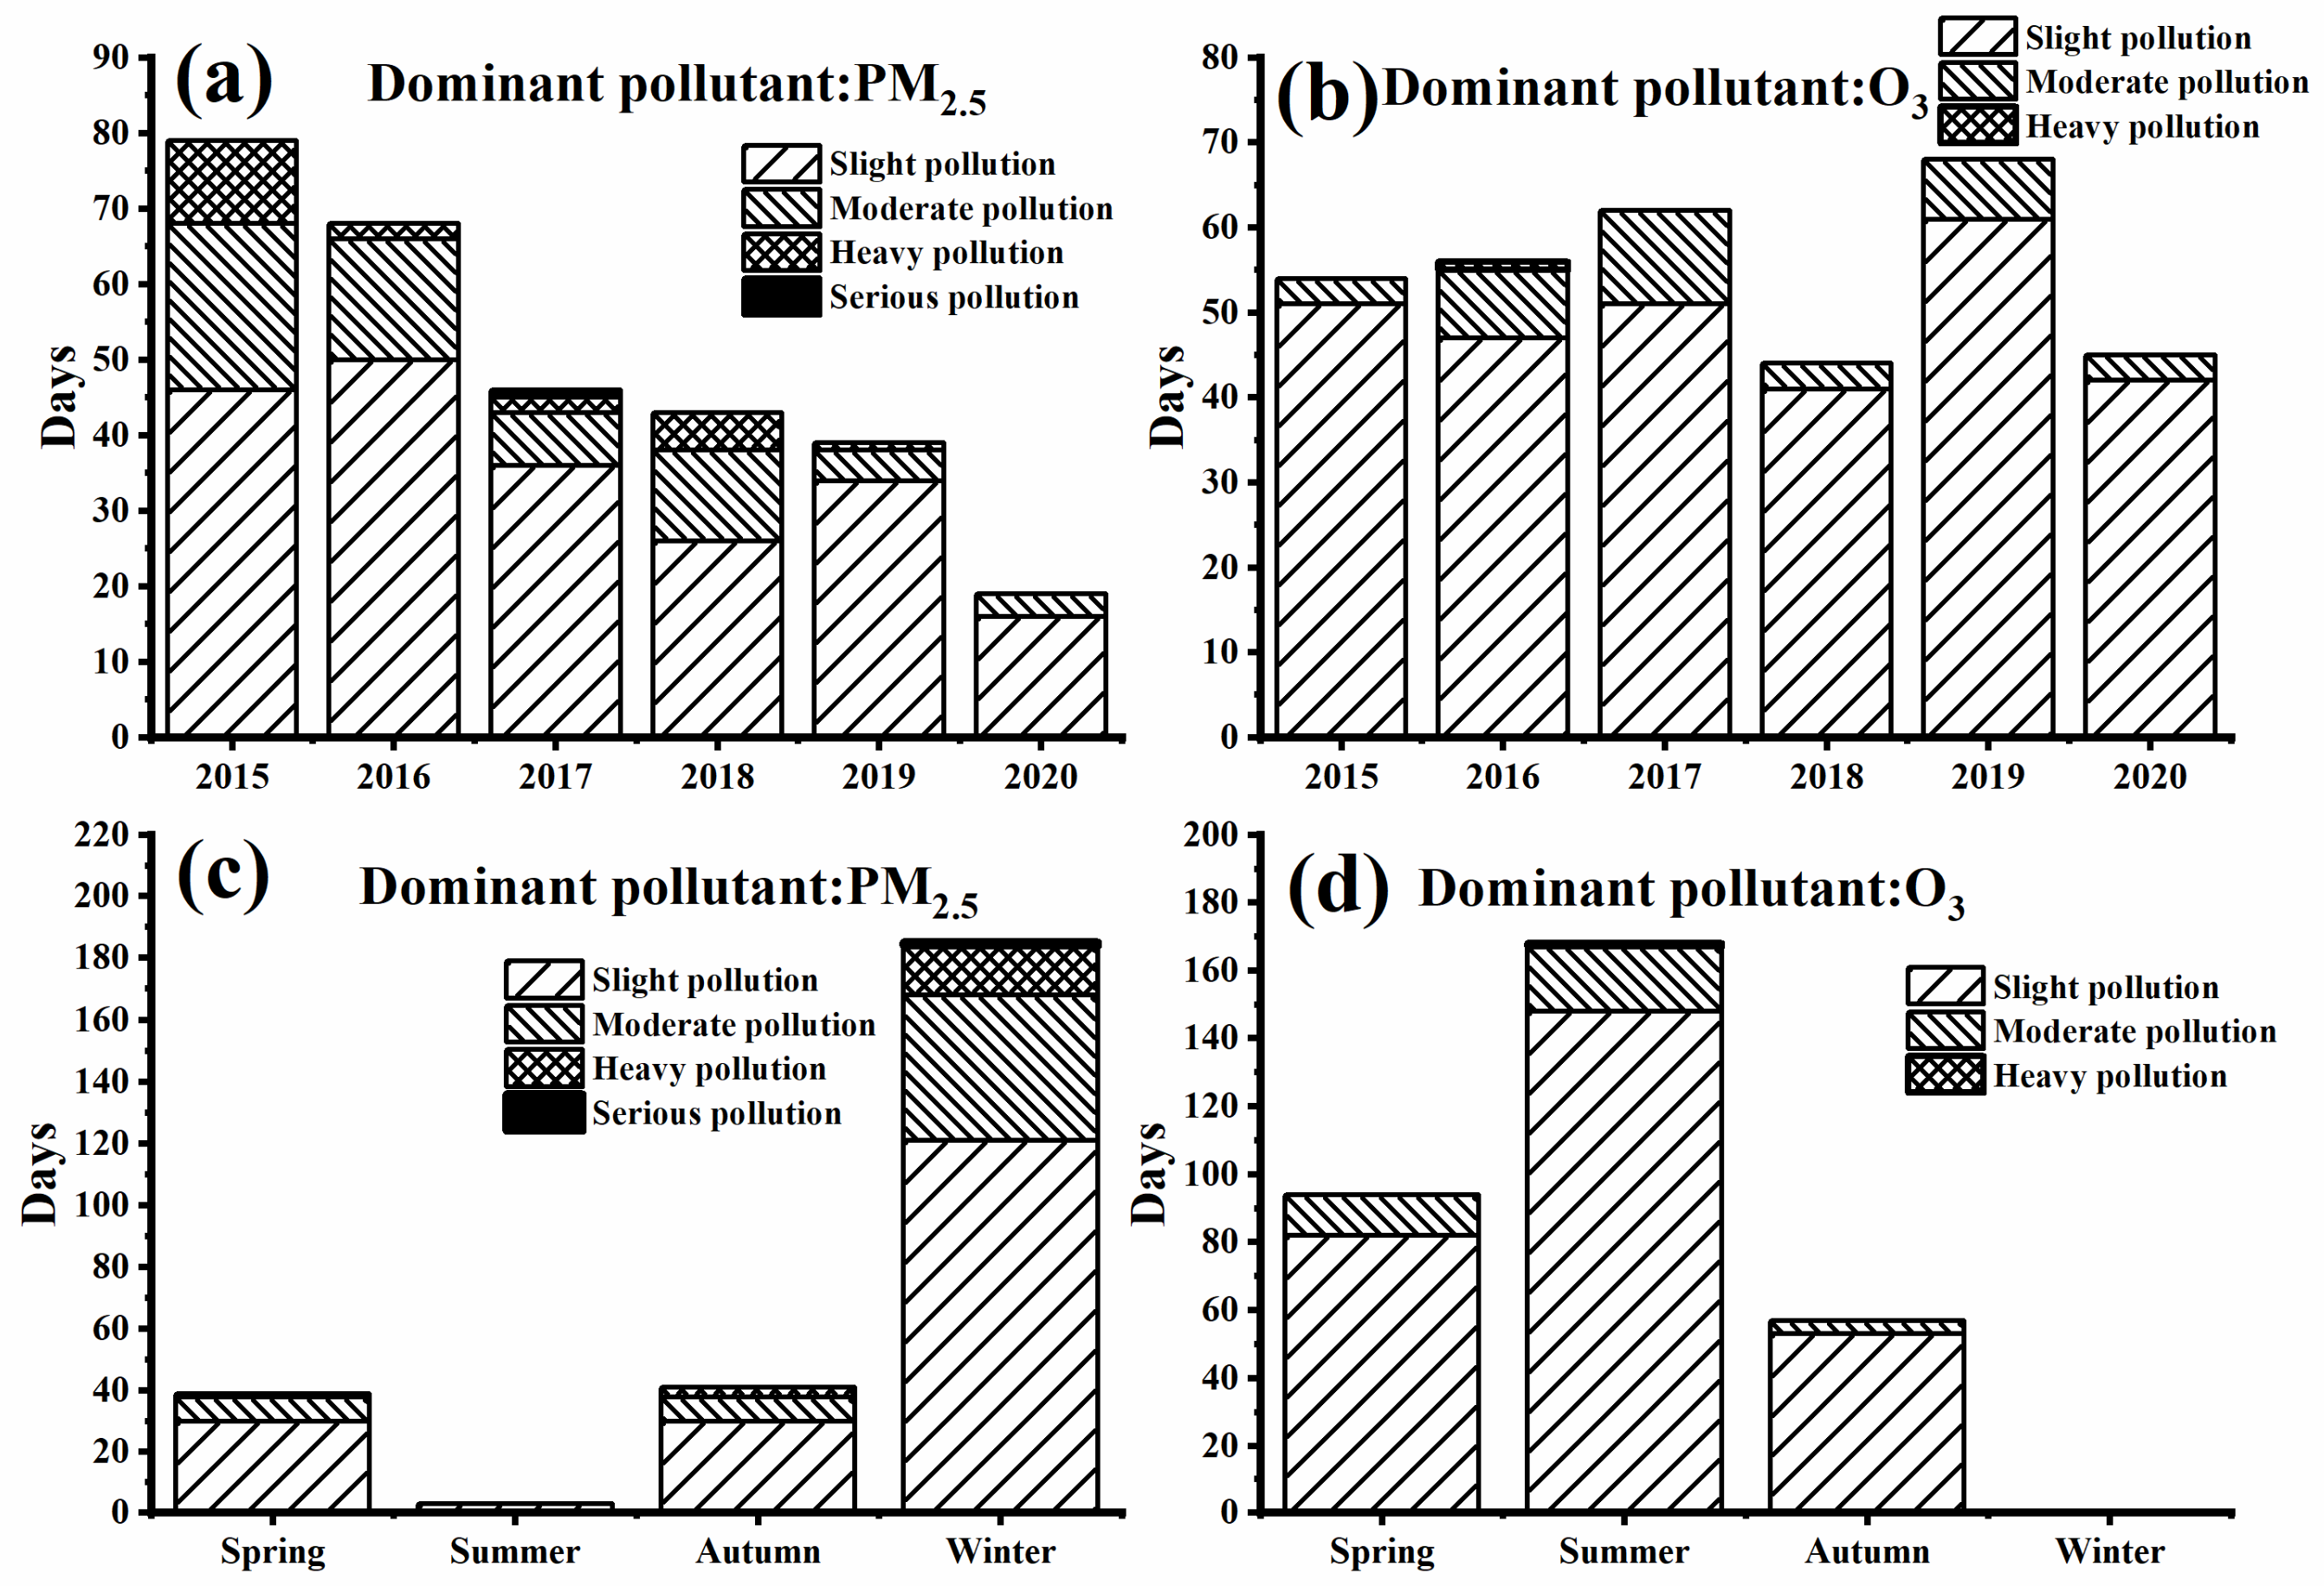
Figure 2a,b, it can be seen that the days with PM
2.5 and O
3 as the dominant pollutants in Nanjing from 2015 to 2020 were 268 and 319, respectively. The number of days with PM
2.5 and O
3 as the dominant pollutants accounted for 94.2% of all polluted days, indicating that PM
2.5 and O
3 pollution were the dominant air pollutants in Nanjing.
In
Figure 2c, it can be seen that when the dominant pollutant was PM
2.5, the number of PM
2.5 pollution days was 39, 3, 41, and 185 in spring, summer, autumn, and winter, respectively. The number of pollution days in winter was significantly higher than in the other seasons, being 374.4%, 606.7%, and 351.2% higher than in spring, summer, and autumn, respectively. The number of moderately polluted and heavily polluted days in winter was 47 and 16, respectively, which was also significantly higher than in the other seasons, in addition to one day of serious pollution in winter. This means that PM
2.5 pollution was mainly concentrated in winter and was more serious, mainly owing to the high rainfall and wet solid deposition in summer, which resulted in lower mass concentrations of atmospheric pollutants. In contrast, the lower boundary layer and stable stratification in winter were more likely to cause PM
2.5 accumulation.
In
Figure 2d, it can be seen that when the dominant pollutant was O
3, the number of days with O
3 pollution was 94, 168, and 57 in spring, summer, and autumn, respectively. The number of polluted days was higher in summer than in the other seasons, being 78.7% and 194.7% higher than in spring and autumn, respectively. At the same time, there were no days with O
3 as the dominant pollutant in winter. The number of moderately polluted days was 12, 19, and 4 in spring, summer, and autumn, respectively, indicating that O
3 pollution was mainly concentrated in summer and was more likely to occur at higher concentrations. This is mainly due to the stronger solar radiation and longer days of light hours in summer, which intensifies the photochemical reactions and is more conducive to O
3 production.
In addition,
Figure 2 shows that the total number of days with moderate, heavy, and serious pollution was 31.3% and 11.3% for PM
2.5 and O
3, respectively, indicating that pollution in Nanjing tends to be heavier when the dominant pollutant is PM
2.5.
3.2. Characteristics of BC Mass Concentration Changes under Different Air Quality Classes
In
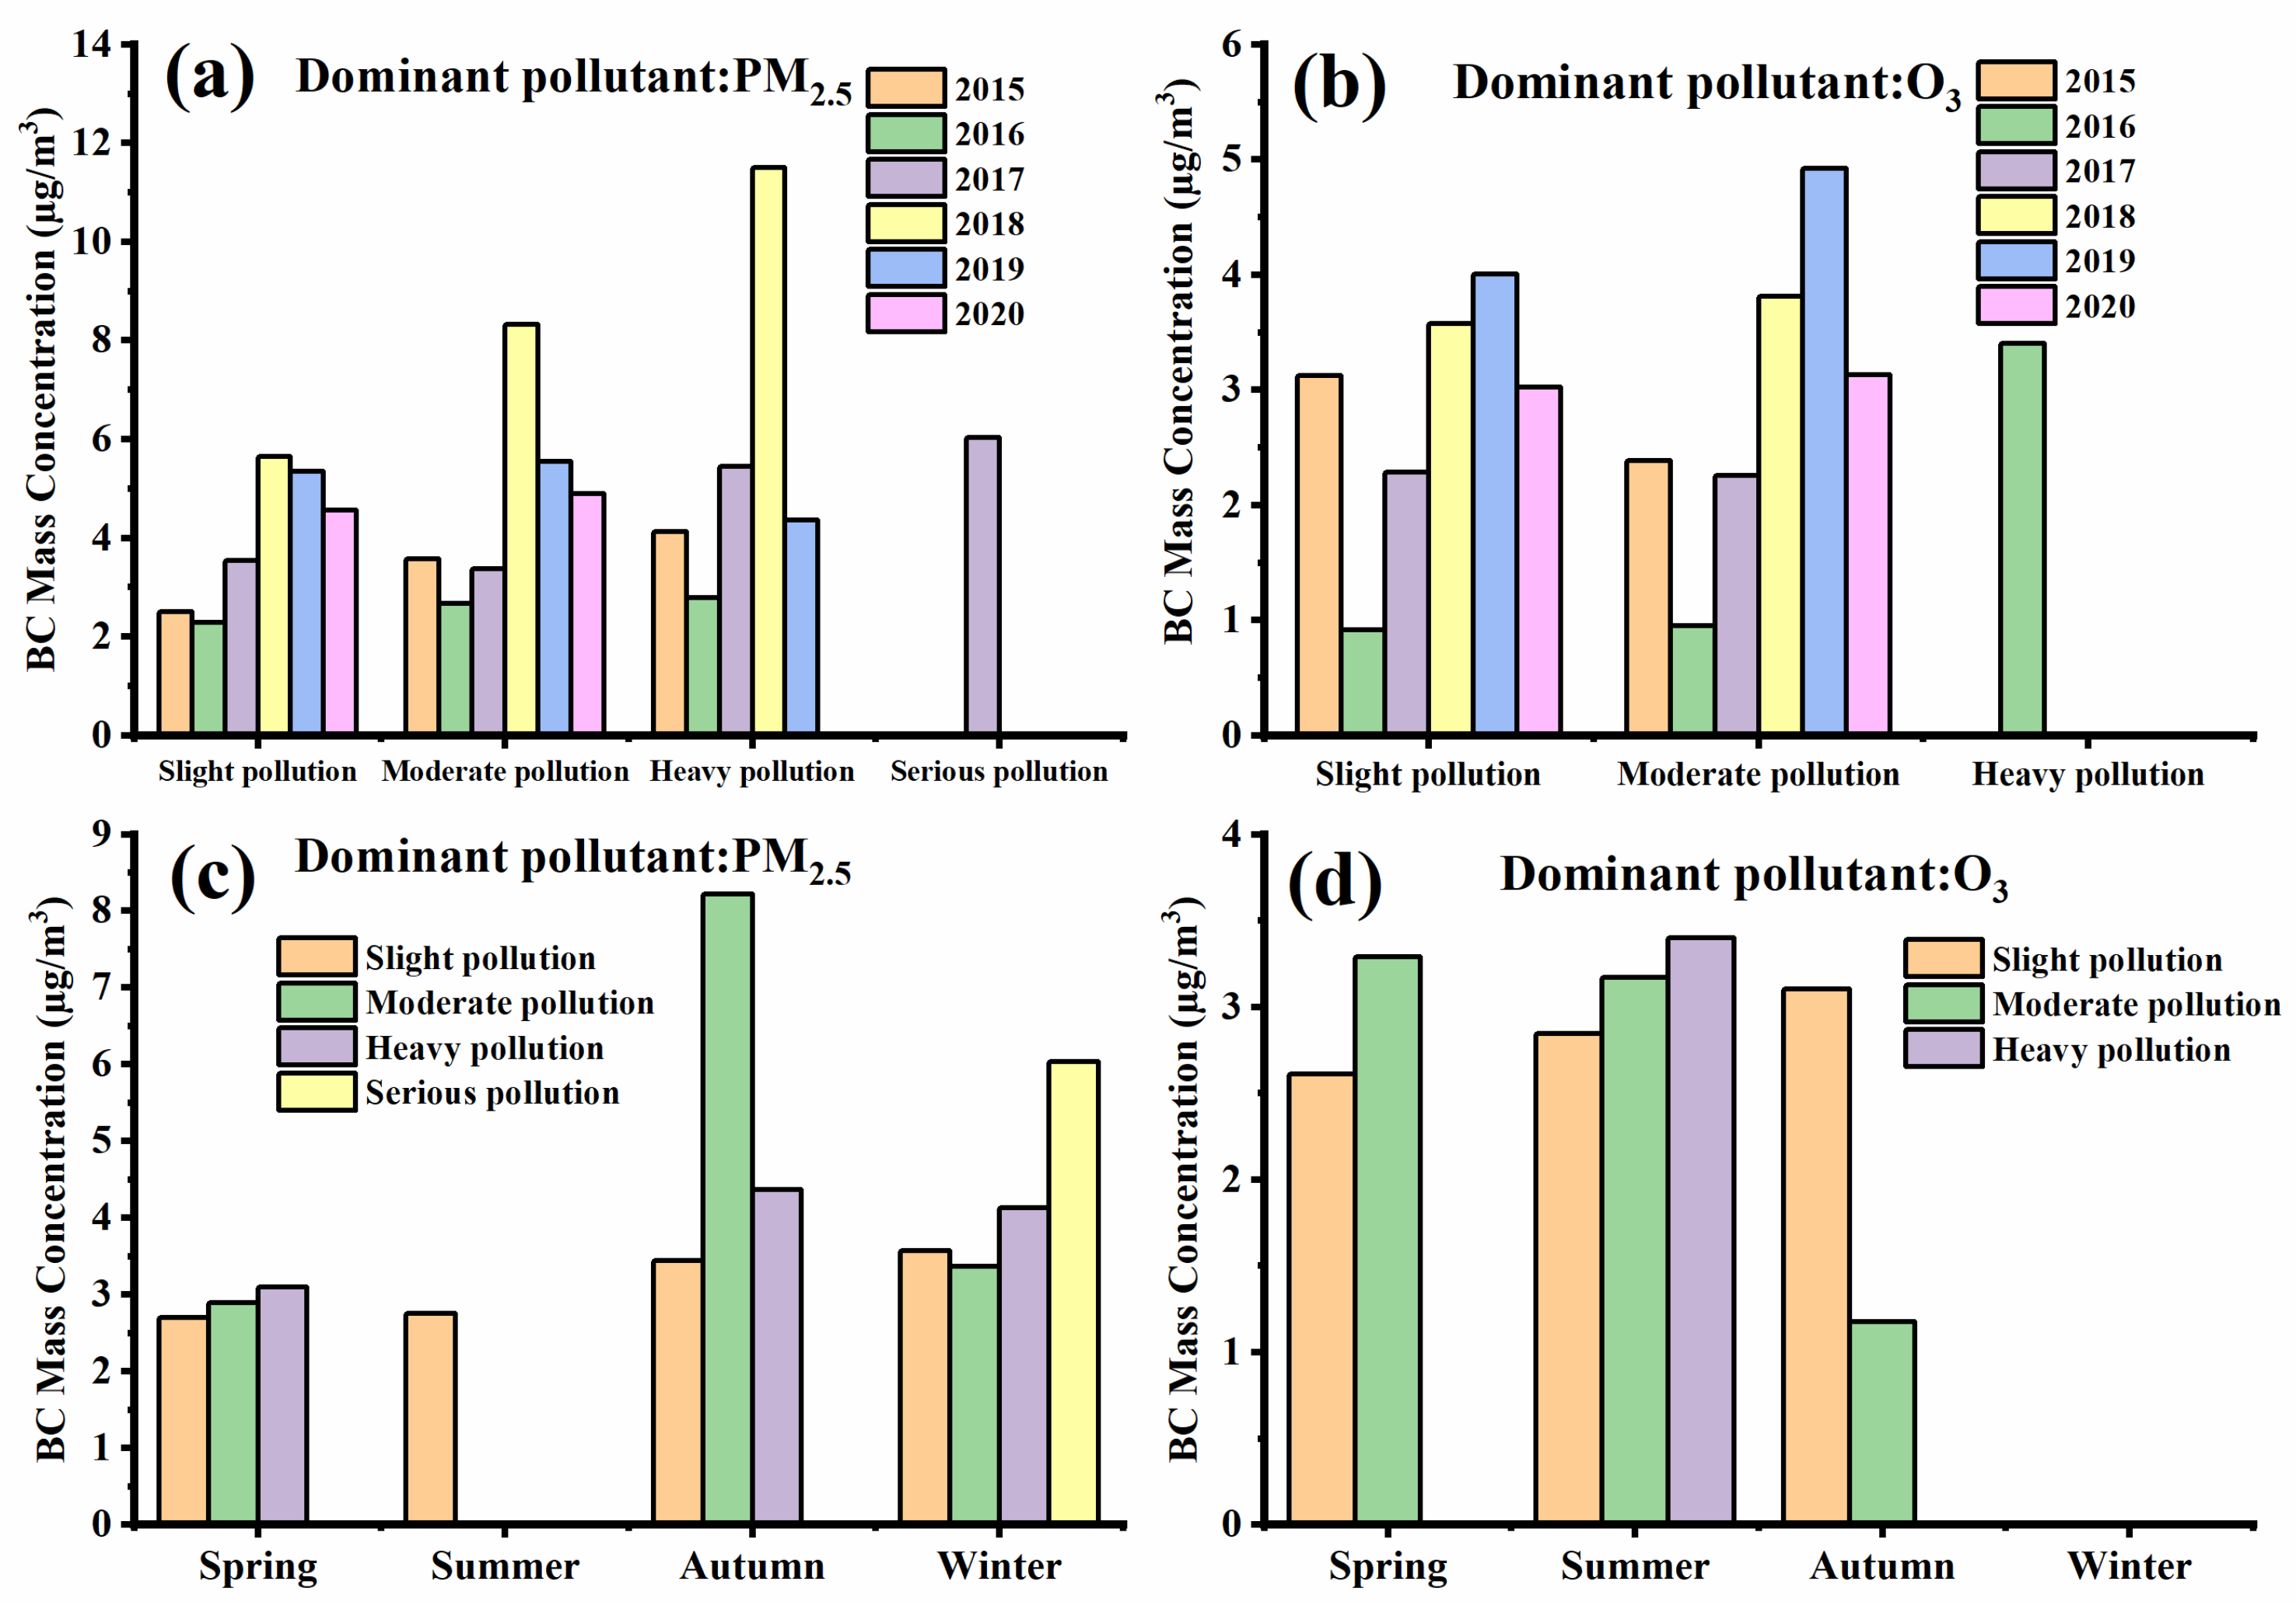
Figure 3a,b, it can be seen that when the air quality was under slight pollution, the BC mass concentration decreased in 2015–2016 when the dominant pollutant was PM
2.5, followed by a yearly upward trend in 2016–2018, with an annual rate of increase of 73.8%, reaching a maximum value of 5.6 μg·m
−3 in 2018, followed by a yearly downward trend during 2018–2020, with an annual rate of decline of 9.6%; the BC mass concentration decreased significantly in 2015–2016 when the dominant pollutant was O
3, being 70.6% lower in 2016 than in 2015, then increased significantly in 2016–2019, reaching a maximum value of 4.0 μg·m
−3 in 2019, with an annual rate of increase of 112.2%; and finally, the BC mass concentration in 2019–2020 decreased in mid-2019, with 2020 being 25.0% lower than 2019. In
Figure 4b, it can be seen that the correlation coefficient between the wind speed and BC in 2015–2020 was −0.79, which was highly negatively correlated, and then in
Figure 4f, it can be seen that there was no significant correlation between the BC mass concentration and visibility, indicating that the dominant pollutant was O
3 mainly when the lower wind speed caused BC to be less diffusible, thus increasing the BC mass concentration. It can be seen that the BC mass concentrations were lower in 2020 than in 2018 and 2019 when the dominant pollutant was either PM
2.5 or O
3, which is related to the reduction in anthropogenic emissions due to measures, such as industrial shutdowns and traffic closures, during COVID-19.
In
Figure 3a,b, it can be seen that when the air quality was under moderate pollution, the annual change in BC when the dominant pollutant was PM
2.5 was similar to that under slight pollution, with mass concentrations both decreasing in mid-2015–2016 and then both showing a year-on-year increase from 2016 to 2018, with an annual increase of 105.5%, peaking at 8.3 μg·m
−3 in 2018, which was significantly higher than those in other years. As can be seen in
Figure 4e, visibility also reached a minimum value of 1.8 km in 2018, indicating that the high concentration of PM
2.5 in 2018 was the leading cause of the occurrence of high BC concentrations, with a decreasing trend in all BC from 2018 to 2020 and an annual rate of decrease of 20.6%; the annual variation under moderate pollution of BC when the dominant pollutant was O
3 was similar to that under slight pollution, with the mass concentrations both decreasing significantly in 2015–2016, being 60.0% lower in 2016 than in 2015, then showing a yearly increasing trend in 2016–2019, reaching a maximum value of 4.9 μg·m
−3 in 2019, with an annual rate of increase of 138.6%; and finally, both decreased in 2019–2020. In
Figure 4b, it can be seen that the BC mass concentration changes in 2015–2020 were negatively correlated with wind speed to some extent, with a correlation coefficient of −0.68. It can be seen in
Figure 4f that the correlation between the BC mass concentration and visibility was not significant, which is mainly due to the lower wind speed, which tends to make BC accumulate and thus the concentration increases.
In
Figure 3a, it can be seen that when the air quality was under heavy pollution, the annual change in the BC mass concentration when the dominant pollutant was PM
2.5 was similar to that of slight and moderate pollution, both decreasing in the middle of 2015–2016 and then increasing year by year from 2016 to 2018, reaching a peak of 11.5 μg·m
−3 in 2018, with an annual rate of increase of 156.3%. As shown in
Figure 4a,e, this is related to the relatively lower wind speed and higher concentration of PM
2.5 in 2018, which caused the BC mass concentration to rise sharply, followed by a significant downward trend in 2018, being 62.1% lower in 2019 than in 2018.
In
Figure 3c,d, it can be seen that when the air quality was under slight pollution, the seasonal variation in the BC mass concentration was winter (3.6 μg·m
−3) > autumn (3.4 μg·m
−3) > summer (2.8 μg·m
−3) > spring (2.7 μg·m
−3) when the dominant pollutant was PM
2.5.
Figure 4c shows that the relatively lower wind speed in autumn and winter under slight pollution led to relatively higher BC mass concentration. The seasonal variation in the BC mass concentration was autumn (3.1 μg·m
−3) > summer (2.8 μg·m
−3) > spring (2.6 μg·m
−3) when the dominant pollutant was O
3, and the seasonal variation in the wind speed was spring (1.9 m·s
−1) > summer (1.7 m·s
−1) > autumn (1.5 m·s
−1), which can be seen in
Figure 4d, indicating that the lower wind speed under slight pollution makes BC less likely to disperse in autumn, resulting in higher concentrations.
In
Figure 3c,d, it can be seen that when the air quality was under moderate pollution, the BC mass concentrations were 2.9 μg·m
−3, 8.2 μg·m
−3, and 3.4 μg·m
−3 in spring, autumn, and winter, respectively, when the dominant pollutant was PM
2.5 and were significantly greater in autumn than in spring and winter, being 182.8% and 141.2% higher, respectively. In
Figure 4c, it can be seen that the seasonal variation in the wind speed under moderate pollution was spring (1.7 m·s
−1) > winter (1.4 m·s
−1) > autumn (1.3 m·s
−1); the relatively lower wind speed in autumn makes it difficult to diffuse BC so the concentration increase. In addition, the average daily precipitation values during this period were 1.91 mm, 0.53 mm, and 0.89 mm in spring, autumn, and winter, respectively, calculated from the date of the observation period. The average daily precipitation values in autumn were 260.4% and 67.9% lower than those in spring and winter, respectively, so the wet removal effect in autumn during this period was smaller, which led to a further increase in the BC mass concentration. (63.6% and 62.5%, respectively). In
Figure 4d, it can be seen that the seasonal variation in the wind speed was autumn (1.9 m·s
−1) > summer (1.7 m·s
−1) > spring (1.6 m·s
−1), and the greater wind speed in autumn made BC easier to disperse and the concentration decreased.
In
Figure 3c, it can be seen that when the air quality was under heavy pollution, the seasonal change in the BC mass concentration when the dominant pollutant was PM
2.5 was autumn (4.4 μg·m
−3) > winter (4.1 μg·m
−3) > spring (3.1 μg·m
−3).
Figure 4c shows that the seasonal variation in the wind speed under heavy pollution was spring (2.8 m·s
−1) > winter (1.6 m·s
−1) > autumn (1.3 m·s
−1), which indicates that the lower wind speed in autumn tends to accumulate pollutants during heavy pollution, resulting in high BC mass concentrations.
3.3. Influence of Boundary Layer Characteristics on BC Mass Concentrations at Different Air Quality Levels
The inverse thermocline within the boundary layer is similar to a “dome,” which prevents the diffusion of pollutants to higher altitudes, causing a significant accumulation of pollutants in the area below the inverse thermocline [
7]. In
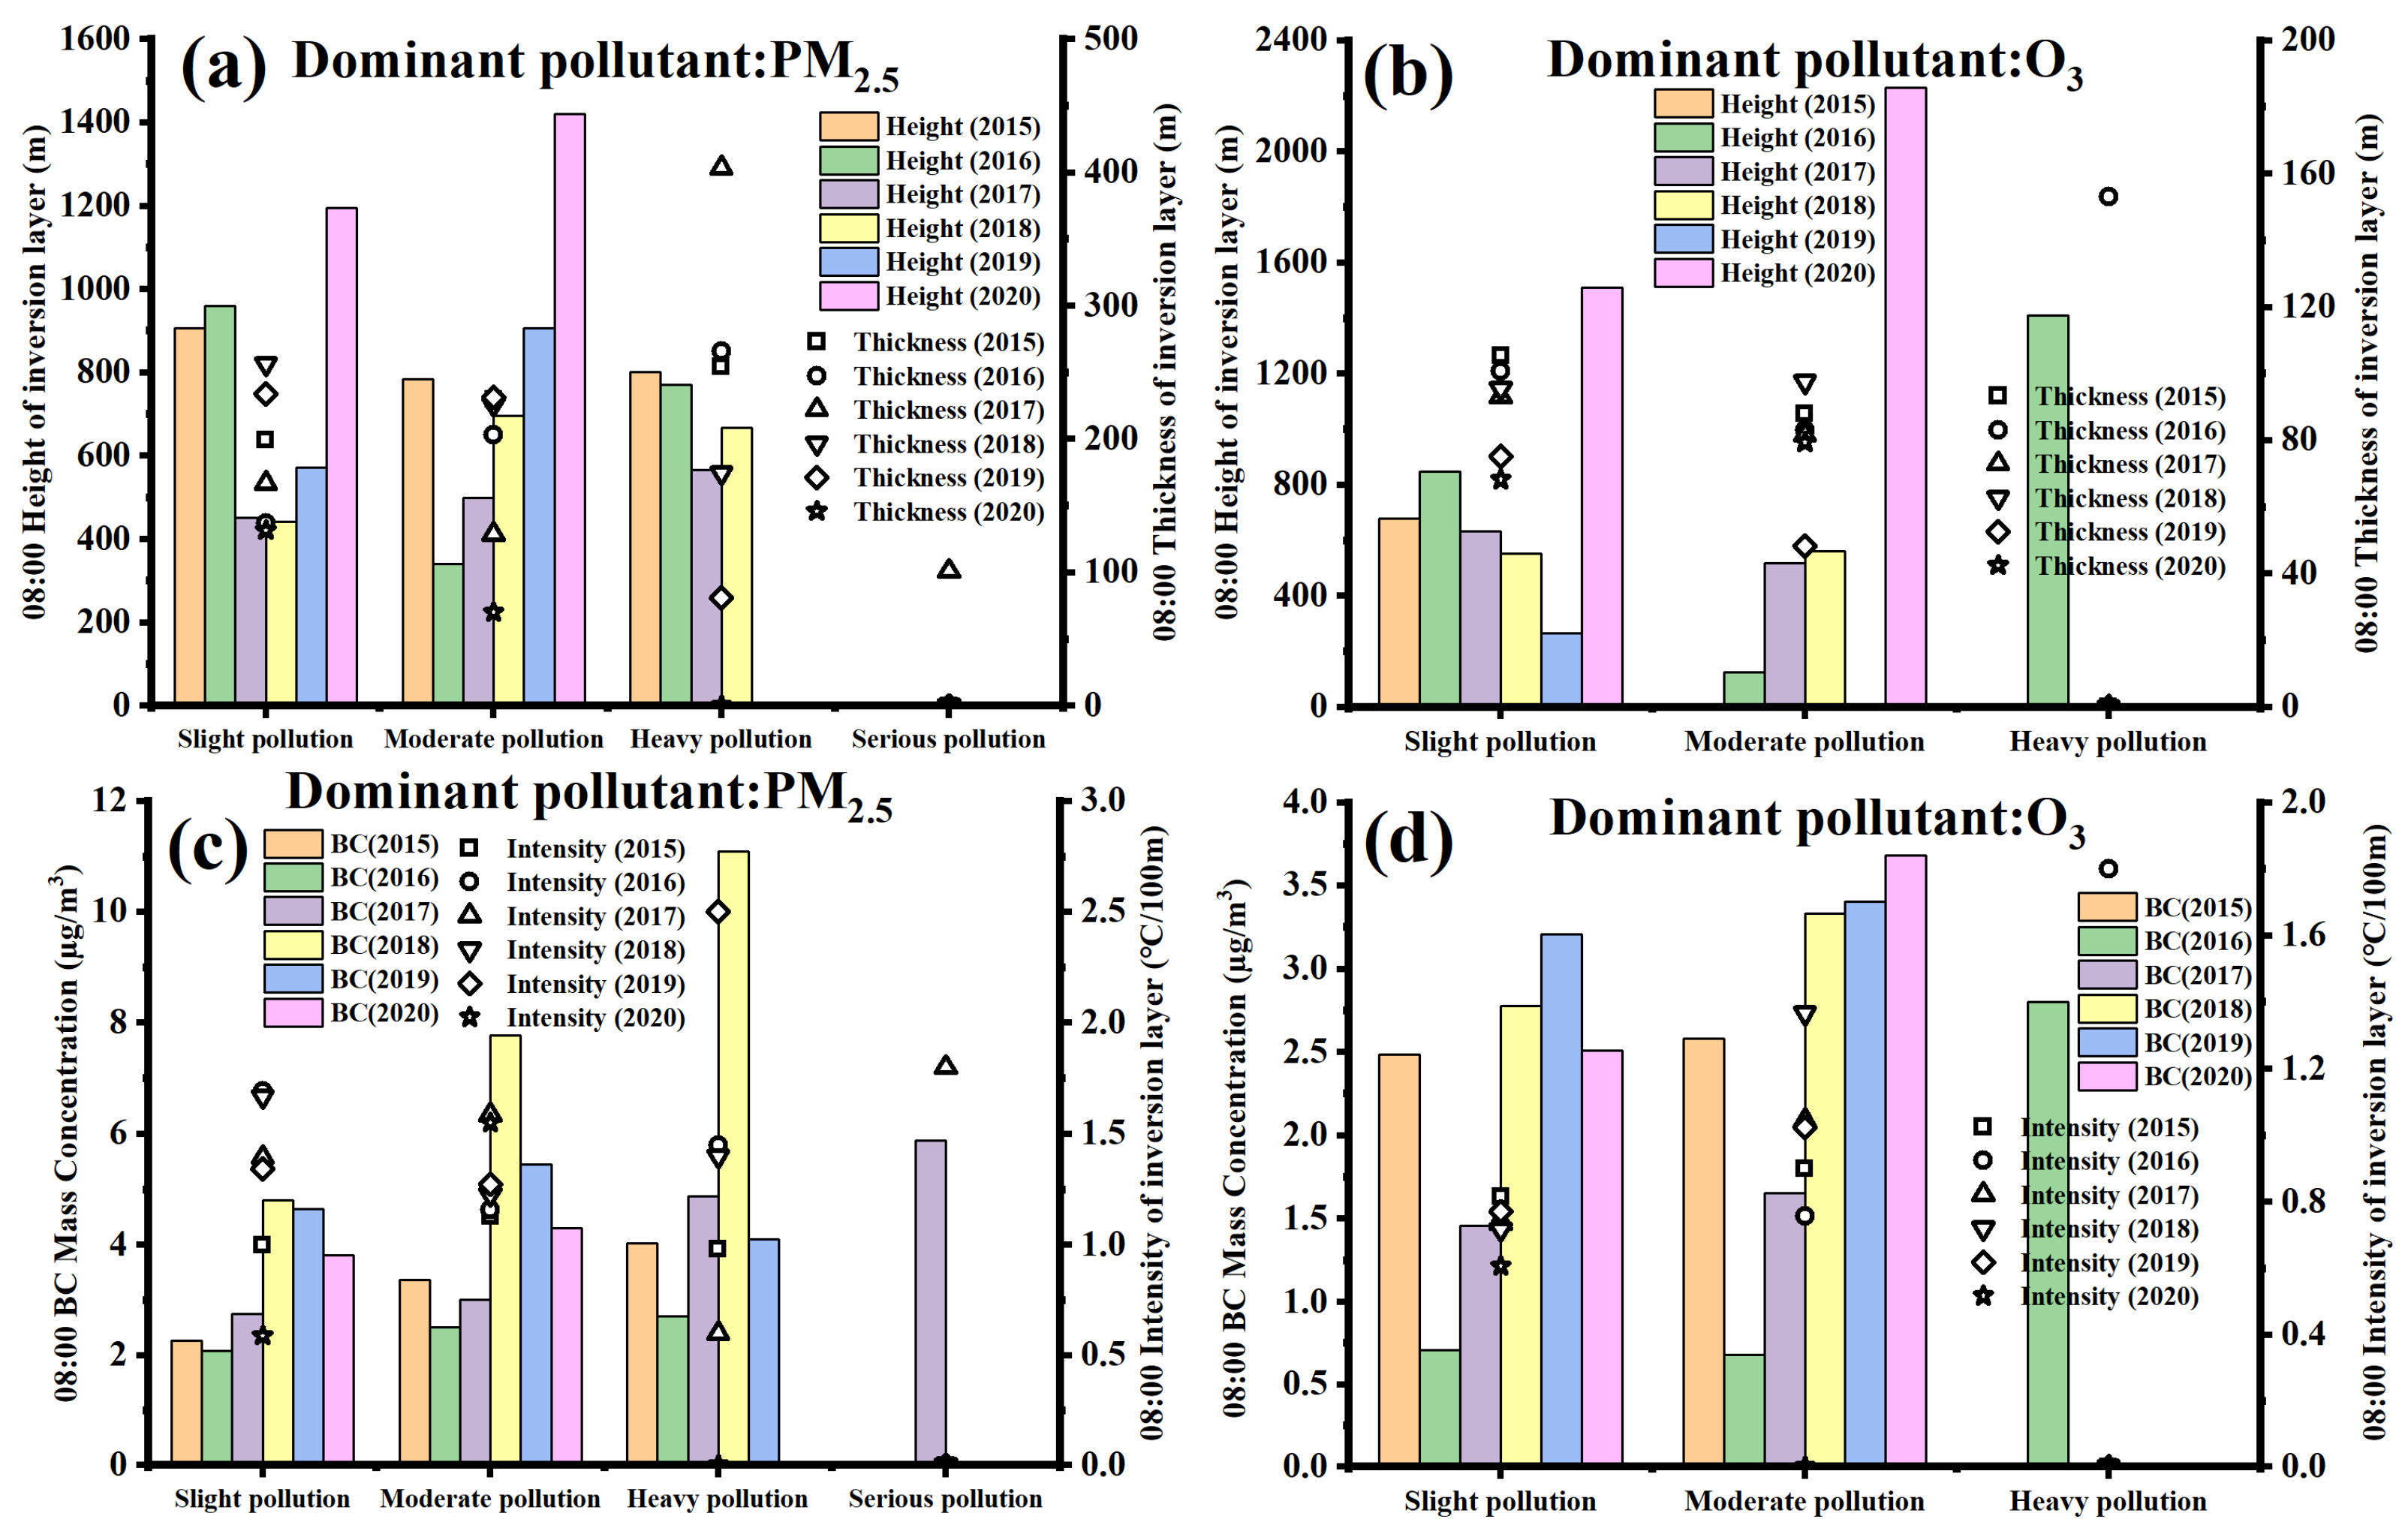
Figure 5c,d, it can be seen that when the air quality was under slight pollution, the daytime BC quality concentrations showed an overall increasing trend from 2016 to 2019, with annual rates of increase of 41.2% and 116.9% respectively, regardless of whether the dominant pollutant was PM
2.5 or O
3. In
Figure 5, it can be seen that BC was significantly negatively correlated with the daytime inverse thermosphere height in 2016–2019, with the correlation coefficients calculated to be −0.70 and −0.93, respectively, indicating that a lower inverse thermosphere height was more likely to confine BC to the near ground layer, making it less likely to disperse, resulting in higher BC mass concentrations. It can also be seen that when the dominant pollutant was PM
2.5, the inversion thickness in the daytime in 2018 and 2019 was 256.5 m and 234.1 m, respectively, which is significantly higher than that in other years, which is also the reason for the high values of the BC mass concentration in 2018 and 2019. When the dominant pollutant was O
3, the inversion thickness and inversion intensity in the daytime were not different, with an average of 89.3 m and 0.7 °C/100 m, respectively, and there was no significant correlation with BC. In
Figure 6c,d, it can be seen that when the air quality was under slight pollution, whether the dominant pollutant was PM
2.5 or O
3, the annual change in the BC mass concentration at night was similar to that during the day, both showing an overall increasing trend from 2016 to 2019, with annual rates of increase of 49.0% and 111.7%, respectively.
In
Figure 5c and
Figure 6c, it can be seen that when the air quality was under moderate pollution and the dominant pollutant was PM
2.5, the BC mass concentration reached large values of 7.8 μg·m
−3 and 8.6 μg·m
−3 in both the daytime and nighttime in 2018. It can be seen in
Figure 5 and
Figure 6 that the inversion thickness in 2018 was relatively large, at 226.1 m and 340.0 m, which is more conducive to the accumulation of BC. In addition, according to the calculation, the correlation coefficient between the inversion layer height and the BC mass concentration at night in 2015–2020 was −0.68, whereas the correlation between the BC mass concentration at both the daytime and nighttime and the inversion intensity was not significant, which indicates that the lower inversion layer height makes the pollutants difficult to diffuse and increases the BC mass concentration at night.
In
Figure 5d and
Figure 6d, it can be seen that when the air quality was under moderate pollution and when the dominant pollutant was O
3, the daytime BC mass concentration decreased significantly in 2015–2016, followed by a yearly upward trend in 2016–2020, with an annual rate of increase of 111.2%; the nighttime BC mass concentration showed an overall upward trend in 2015–2019, with an annual rate of increase of 44.0%, followed by a significant decrease in 2019–2020. In combination with
Figure 5b and
Figure 6b, it was found that the diurnal and annual changes in the inversion layer height, inversion thickness, and inversion intensity fluctuated greatly. After calculating the correlation with the diurnal and annual changes in BC, it was found that the correlation was not significant and may be greatly affected by anthropogenic emissions.
In
Figure 5c and
Figure 6c, it can be seen that when the air quality was under heavy pollution and the dominant pollutant was PM
2.5, the annual variation in the BC mass concentration of the inversion layer thickness during both the daytime and nighttime showed an increasing trend from 2015 to 2018, with annual rates of increase of 59.2% and 62.7% respectively. Then, they both decreased significantly from 2018 to 2019 to 63.1% and 59.2%, respectively.
It can be seen in
Figure 5a and
Figure 6a that the diurnal and annual changes in the BC mass concentration were not significantly correlated with the inversion layer height, inversion thickness, and inversion intensity. Under severe pollution, it was mainly concentrated in winter, which could have been greatly affected by the long-distance input of foreign pollutants through the cold front.
In general, when the dominant pollutant was PM
2.5, the annual changes in BC under slight and moderate pollution were greatly affected by the inversion layer height but had no obvious correlation with the inversion thickness and inversion intensity. If the pollution were more serious, BC could be affected by the transmission of overseas pollutants. When the dominant pollutant was O
3, the annual changes in BC were less affected by the inversion layer under both slight and moderate pollution and may have been more affected by human activities. In
Figure 7c and
Figure 8c, it can be seen that when the air quality was under slight pollution and the dominant pollutant was PM
2.5, the seasonal variation in the daytime BC mass concentration was winter (3.2 μg·m
−3) > summer (2.8 μg·m
−3) > autumn (2.5 μg·m
−3) > spring (2.4 μg·m
−3).
Figure 7a shows that the height of the inversion layer during the daytime in spring was 1174.3 m, which was significantly higher than in the other seasons and facilitates the diffusion of pollutants and lowers the BC concentration; the seasonal variation in the BC mass concentration at night was winter (4.0 μg·m
−3) > autumn (3.5 μg·m
−3) > spring (3.2 μg·m
−3) > summer (2.7 μg·m
−3). The inversion layer height at night in the summer was 660.0 m according to
Figure 8a and its thickness and intensity were correspondingly 157.0 m and 0.7 °C/100 m, which are both noticeably lower compared to the other seasons. Therefore, the inversion layer was weak and thin at night in summer, making it easily destroyed. As a result, the BC mass concentrations were low and rapidly diffused during summer.
In
Figure 7d and
Figure 8d, it can be seen that when the air quality was under slight pollution and the dominant pollutant was O
3, the daytime BC mass concentration was not significantly different in spring, summer, and winter, with a mean value of 2.2 μg·m
−3; the nighttime BC mass concentration was relatively high in autumn at 3.9 μg·m
−3, which was 20.4% and 20.3% higher than that in spring and summer, respectively. Both diurnal BC mass concentrations were not significantly correlated with the inversion layer height, inversion layer thickness, and inversion layer intensity.
In
Figure 7c and
Figure 8c, it can be seen that when the air quality was under moderate pollution and the dominant pollutant was PM
2.5, the daytime BC mass concentration was 7.1 μg·m
−3 in autumn, which was 153.6% and 116.5% higher than that in spring and winter, respectively. The daytime inversion layer intensity was 1.7 °C/100m in autumn, which was significantly higher than that in spring and winter, which were 133.5% and 39.3% higher, respectively This indicates that the lower daytime inversion layer height and more vigorous inversion layer intensity in autumn led to higher daytime BC mass concentrations in autumn; the nighttime BC mass concentration was 9.6 μg·m
−3 in autumn, which was 204.8% and 160.2% higher than that in spring and winter, respectively. The inversion layer thickness in autumn was 354.3 m, which was significantly greater than that in spring and winter, 64.7% and 19.2% higher, respectively. The higher inversion layer thickness made the inversion more stable and less susceptible to disruption, which led to the accumulation of BC and increased concentrations.
In
Figure 7d and
Figure 8d, it can be seen that when the air quality was under moderate pollution and the dominant pollutant was O
3, the daytime and nighttime BC mass concentrations were 0.81 μg·m
−3 and 1.6 μg·m
−3 in autumn, respectively, which were significantly lower than those in spring and summer. In combination with
Figure 8b, it can be seen that the height of the inversion layer was lowest at night in autumn. Still, the concentration of BC at night in autumn was significantly lower than that in spring and summer, which shows that the thickness of the inversion was significantly stronger in autumn than in spring and summer. This indicates that the mechanism of the inversion stratification on the concentration of atmospheric pollutants was complex. The height, thickness, and intensity of the inversion in different seasons under different dominant pollutants have different influences on the pollutants.
In
Figure 7c and
Figure 8c, it can be seen that when the air quality was under heavy pollution and the dominant pollutant was PM
2.5, the seasonal variation in the daytime BC mass concentration was winter (4.0 μg·m
−3) > autumn (3.5 μg·m
−3) > spring (2.9 μg·m
−3), and in
Figure 7a, it can be seen that the thickness of the inversion layer was as high as 266.1 m during winter, which was significantly greater than that in the other seasons. Combined with the relatively lower inversion layer height, BC was not quickly diffused. Thus, the daytime BC mass concentration was higher in winter; the seasonal variation in the nighttime BC mass concentration was autumn (5.1 μg·m
−3) > winter (4.5 μg·m
−3) > spring (3.3 μg·m
−3), as shown in
Figure 8a, and the nighttime inversion layer height was 141.0 m in autumn, which was lower than those in spring and winter by 71.8% and 70.8%, respectively. The lower inversion layer height and the strong and thick inversion laminar junction at night in autumn likely led to the accumulation of pollutants, making the BC mass concentration higher at night in autumn.
In general, when the dominant pollutant was PM2.5, the diurnal variation in the BC seasonal variation under slight pollution, moderate pollution, and severe pollution was significantly affected by the inversion layer. When the dominant pollutant was O3, the seasonal change in BC had no obvious correlation with the inversion layer, which was the same as the annual change in BC.


