Article

Association between Long-Term Exposure to Fine Particulate Matter and Asthma Incidence among School-Aged Children

1
COMWEL Daejeon Hospital, Korea Workers’ Compensation & Welfare Service, Daedeok-gu, Daejeon 34384, Korea
2
Department of Preventive Medicine, Seoul National University College of Medicine, 103 Daehak-ro, Jongno-gu, Seoul 03080, Korea
3
Department of Humans Systems Medicine, Seoul National University College of Medicine, 103 Daehak-ro, Jongno-gu, Seoul 03080, Korea
4
Department of Environmental and Safety Engineering, Ajou University, Suwon 16499, Korea
5
Section of Environmental Health, Department of Public Health, University of Copenhagen, 1353 Copenhagen, Denmark
6
Public Healthcare Center, Seoul National University Hospital, 101 Daehak-ro, Jongno-gu, Seoul 03080, Korea
*
Author to whom correspondence should be addressed.
Atmosphere 2022, 13(9), 1430; https://doi.org/10.3390/atmos13091430
Submission received: 7 June 2022 / Revised: 4 August 2022 / Accepted: 31 August 2022 / Published: 3 September 2022
(This article belongs to the Special Issue Air Quality and Public Health Effects in Korea)

Abstract

:
Studies on the correlation of long-term PM2.5 exposure with childhood-onset asthma are limited to western countries. We aimed to study the association between long-term PM2.5 exposure and childhood-onset asthma in South Korea, which has higher ambient PM2.5 levels than western countries. We constructed a retrospective cohort of children aged 6–14 years living in seven metropolitan cities using the National Health Insurance service in South Korea from 2011 to 2016. Children who made a hospital visit with asthma from 2008 to 2010 were excluded. A child was diagnosed with asthma incidence if he or she visited the hospital three times or more with a primary diagnostic code of asthma. A time-varying Cox regression model was constructed to investigate the association of long-term district-level PM2.5 exposure with asthma incidence. Of the 1,425,638 children evaluated, 52,133 showed asthma incidence, with an incidence rate of 6.9 cases/1000 person-years. A 10 µg/m3 increase in the 48-month moving average PM2.5 exposure was associated with an elevated risk of asthma incidence, with a hazard ratio of 1.075 (95% confidence interval: 1.024–1.126), and this association was robust for different PM2.5 exposure levels (12-, 36-, and 60-month moving average). In this study, long-term exposure to PM2.5 was associated with asthma incidence in school-aged children in South Korea. Policies to reduce environmental PM2.5 levels and protect children from PM2.5 are necessary to prevent childhood-onset asthma.

1. Introduction

Asthma is a chronic respiratory disease affecting more than 339 million people worldwide and is the most common chronic disease in children [1]. Several genetic and environmental factors, such as the history of allergic disease, stress, obesity, exposure to air pollution, tobacco smoke, and occupational dust exposure, increase the risk of asthma development [2]. Particulate matter less than 2.5 mm in diameter (PM2.5) has been suggested as one of environmental risk factors for asthma, especially among children [3,4].
Based on strong evidence that showed causal relationships between exposure to PM2.5 and mortality or development of diseases, the World Health Organization (WHO) updated the global air quality guidelines in 2021. The air quality guideline (AQG) level of PM2.5 was updated to 5 µg/m3, which is half of the previous level of 10 µg/m3. In the updated guideline, the WHO estimated that the burden of disease attributable to air pollution was competing with other major global health risks [5].
Children’s respiratory systems are more vulnerable to PM2.5 exposure because of immaturity, high respiratory rates, low dust filtration rate in the nasal passages, mouth-breathing related to increased pollution concentrations and poor air conditioning, and frequent outdoor activities [6]. Previous studies in western countries suggest that prenatal exposure to PM2.5 is associated with asthma development in children [3]. A systematic review and meta-analysis study of birth cohort studies to investigate the association between children’s exposure to air pollution reported an increased risk of asthma according to increased PM2.5 exposure in early childhood [7]. Another recent systematic review and meta-analysis study also reported that a 1 µg/m3 increase in PM2.5 is associated with 1.03 times higher risk of asthma development in childhood [4]. However, relatively few studies report the association between PM2.5 and asthma development in Asian countries, although some relevant studies exist [8,9].
In South Korea, where the annual ambient PM2.5 concentration is over 20 µg/m3 and is higher than that in western countries [10], it has yet been studied that the association between PM2.5 exposure in childhood and asthma incidence using nationwide data. This study aimed to examine the association between long-term exposure to PM2.5 and asthma incidence among school-aged children in South Korea.

2. Materials and Methods
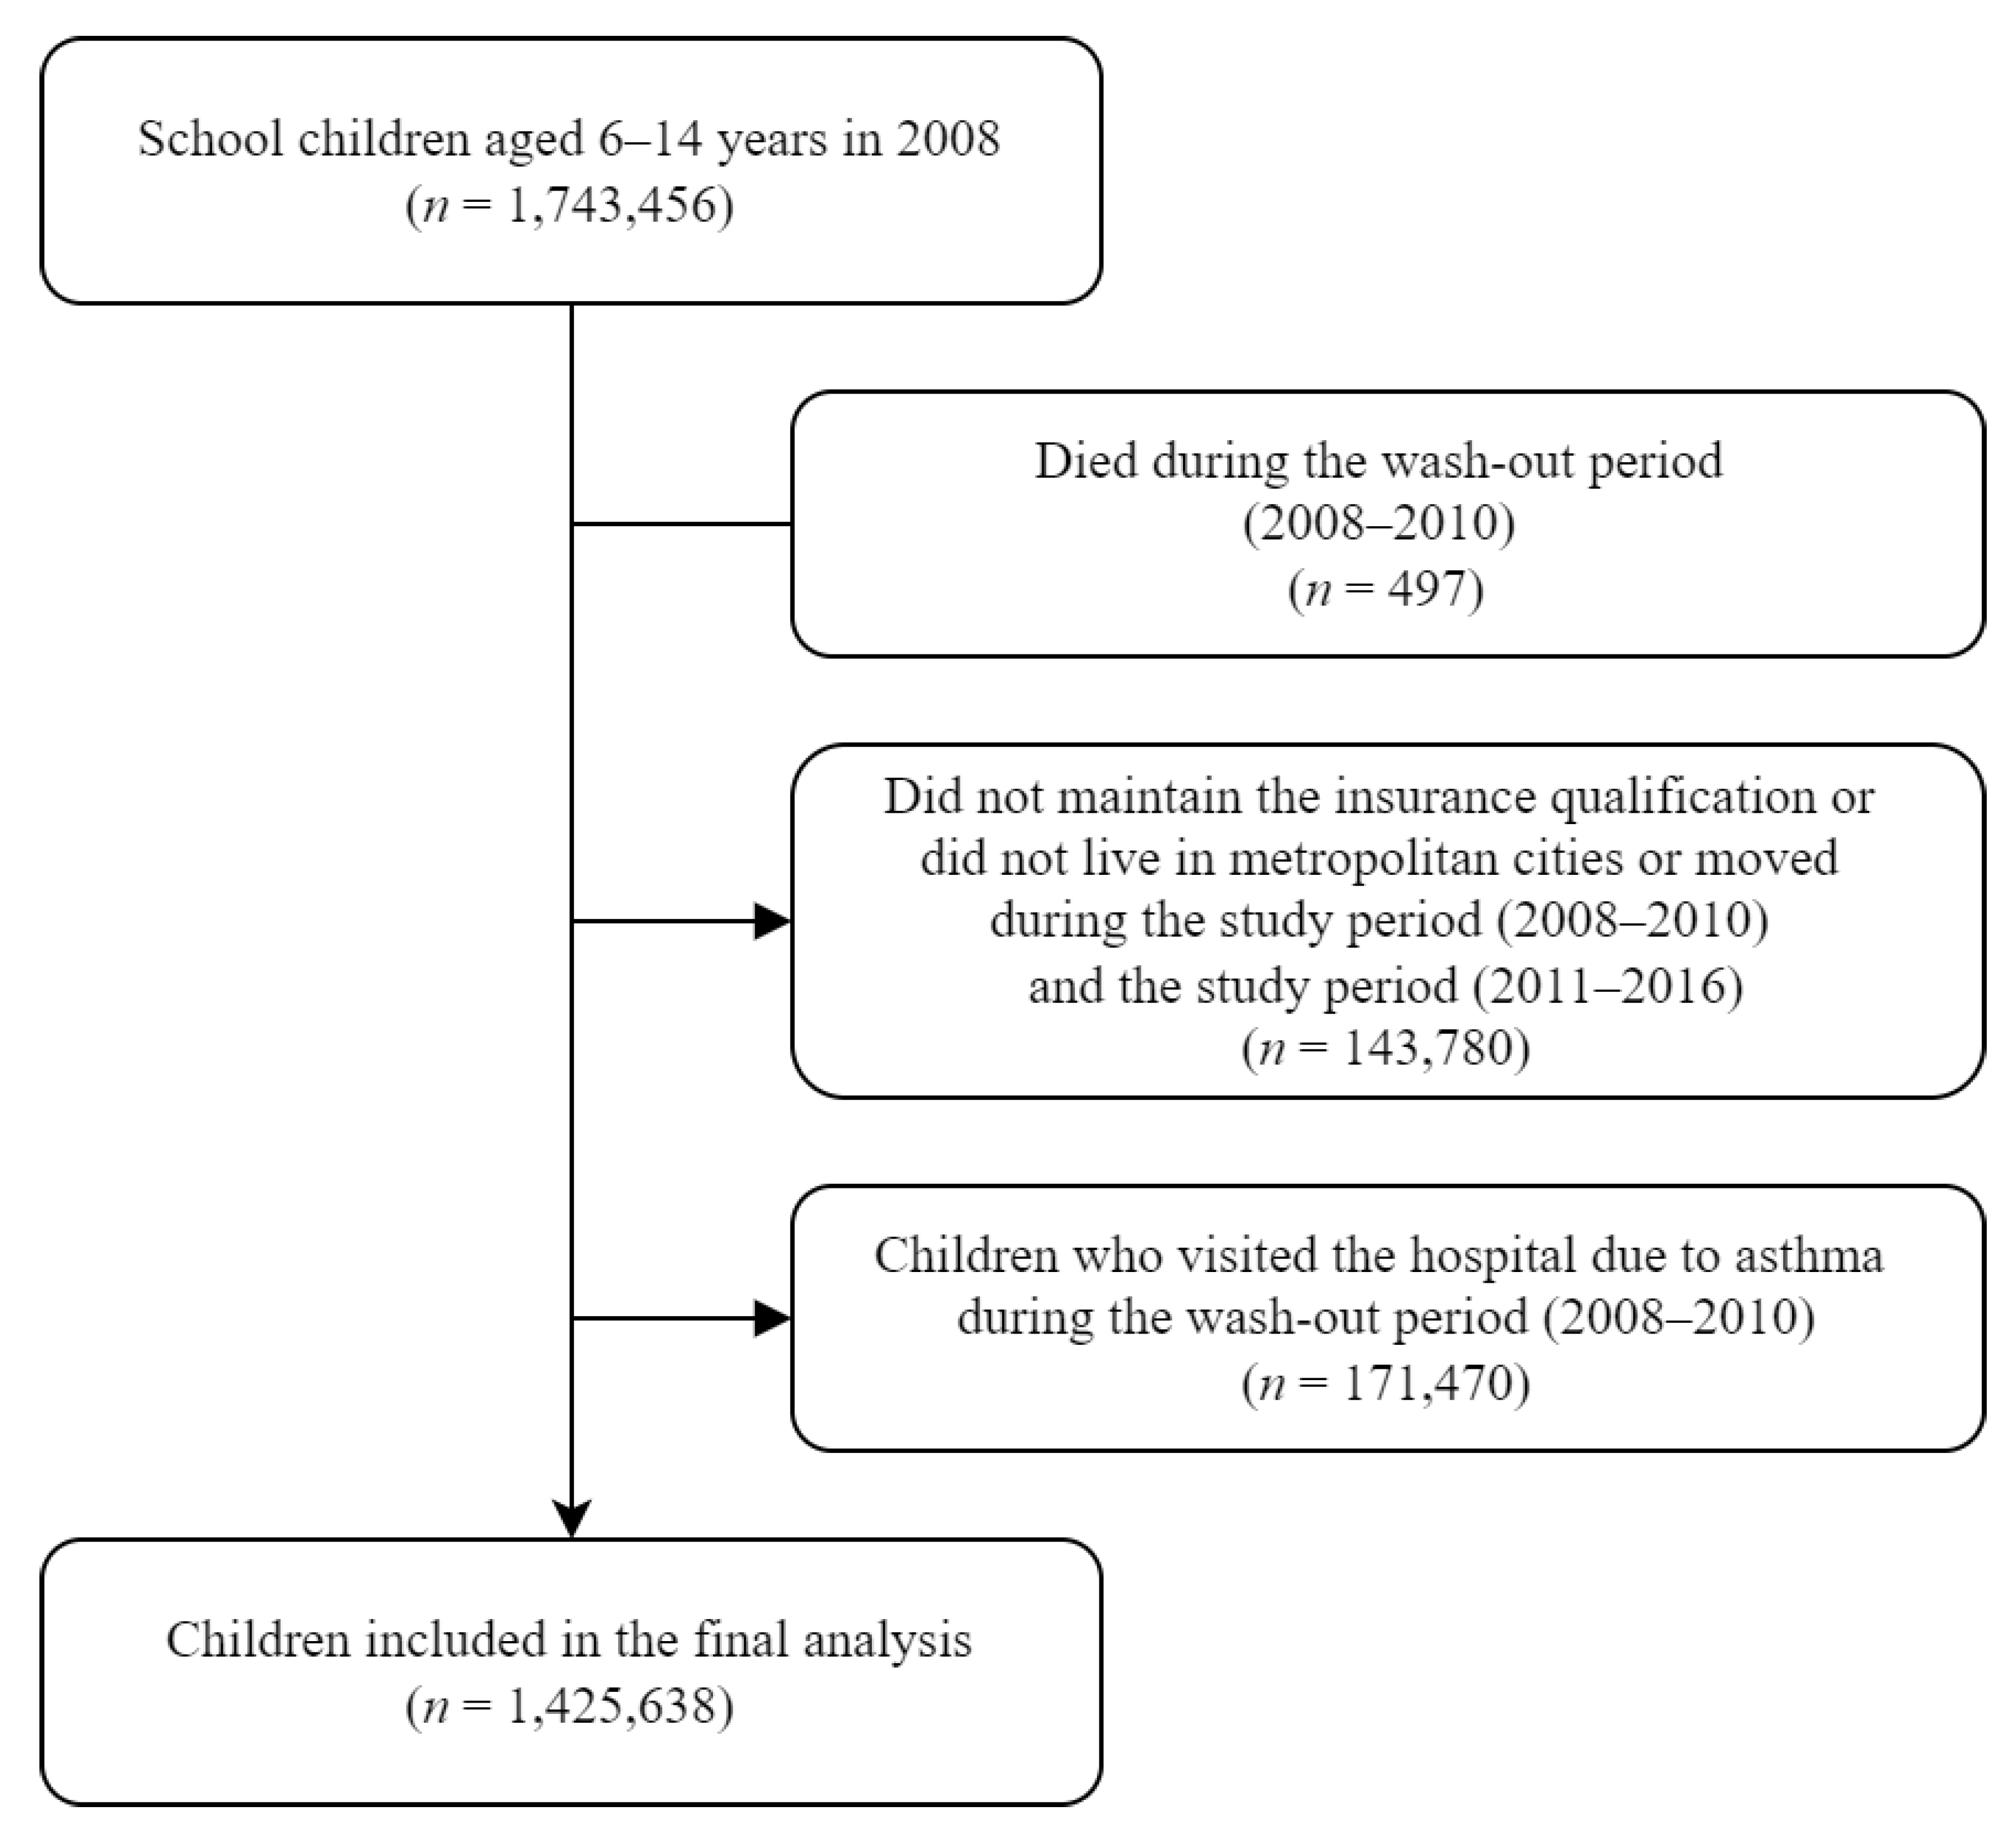
2.1. Study Design

South Korea is covered by the national health insurance service (NHIS), a single-payer health insurance service. It almost covers the entire population (over 97%) in South Korea. A detailed explanation of NHIS was published previously [11]. Using NHIS customized data in South Korea, we constructed a retrospective cohort for children living in seven metropolitan cities (Seoul, Busan, Daegu, Incheon, Gwangju, Daejeon, and Ulsan) with a 3-year wash-out period (2008–2010) and 6-year follow-up period (2011–2016). We selected study participants aged 6 to 14 years in 2011, the baseline year of the follow-up period. Due to the uncertainty of the diagnosis of asthma in children under 5 years of age [12], we focused on school-aged children over 6 years of age. Customized data on the following parameters were recorded: outpatient visit, hospitalization date, primary and secondary diagnostic codes, age, sex, household income, district-level address, cause of death, and date of death.
This study was exempted from review by the Institutional Review Board of the Seoul National University Hospital (E-1807-038-956) because we used de-identified data provided by the NHIS. The study complies with the NHIS personal information protection guidelines.

2.2. Outcome Variable: Asthma incidence

We excluded children who had asthma diagnoses in the claims data during the wash-out period (2008–2010), before the start year of the follow-up period. We set an operational definition of asthma. It was defined as asthma cases if the participant had at least three hospital visits due to asthma (J45–J46) as a primary diagnostic code according to the International Classification of Diseases, 10th revision (ICD-10), with reference to previous studies [13,14]. Hospital visits included all modes of visits (emergency or non-emergency), types of hospitals (primary or tertiary), and detailed medical service use (admission or ambulatory). Participants who met the operational definition of asthma in our dataset were regarded as asthma incidence cases.

2.3. Exposure Parameters: PM2.5 Exposure Level

Daily PM2.5 concentration was estimated using the Integrated Multi-Scale Air Quality system for Korea (IMAQS-K), developed by Ajou University, as nationwide PM2.5 measurement data were unavailable until 2015 in South Korea. In this system, the Weather Research and Forecast (WRF, version 3.3.1)-Sparse Matrix Operator Kernel Emission (SMOKE, version 3.1)-Community Multiscale Air Quality (CMAQ, version 4.7.1) were used [15]. This model is a chemical transport modeling to simulate PM2.5, and a three-dimensional computer modeling using emission sources, chemical mechanism, diffusion, and meteorological conditions. Previous studies documented the PM2.5 modeling data validity [16,17]. The correlation coefficient between the modeled data and observed data from the monitoring stations (2015–2016) in seven metropolitan cities was over 0.95 [18]. We estimated the daily and monthly PM2.5 levels in each district of cities. After that, exposure levels by every month were assigned to children based on their district-level addresses. It was calculated that monthly values of 12-, 24-, 36-, 48-, and 60-month moving average PM2.5 concentrations by every month during the follow-up period, to perform time-varying Cox regression.

2.4. Covariates

We collected information about the age (years), sex (boys or girls), district-level address, and household income of children from the NHIS data. The data contains the participants’ information on household income classes (1st–20th quantile), which are used for NHIS to determine the insurance premium. We divided household income into four levels (Q1, 1–5; Q2, 6–10; Q3, 11–15; Q4, 16–20). The annual average temperatures of summer (June–August) and winter (December–February) were calculated using the daily mean air temperature data obtained from the Korean Meteorological Administration.
As individual-level lifestyle information was unavailable in the NHIS data, we adjusted for district-level contextual variables based on the district-level address of each child. Contextual variables included the proportion of current smokers, the status of receiving a high school diploma (%) in 2010, and the monthly average income level in 2016. The information on smoking status was obtained from the Korea Community Health Survey data [19], while that about receiving a high school diploma (%) in 2010 was obtained from the Korea Statistical Information Service data. The data on the monthly average income level in 2016 were obtained from the National Information Society Agency.

2.5. Statistical Analysis

We used time-varying Cox regression to investigate the association of the outcome variables (asthma incidence) with long-term PM2.5 exposure that varied over time, rather than considering the fixed value of the concentration of PM2.5 at a point [20]. The time-varying Cox proportional hazards model calculates the HRs for a moving average PM2.5 concentration (12, 24, 36, 48, and 60 months) at monthly time intervals and generates a single HR value. The HR and 95% confidence interval (95% CI) were estimated according to the 10 μg/m3 increase in the moving average PM2.5 exposure levels. Each child was followed up from the start of the study period (2011) to the development of asthma, dropout or death, or the end of the study period (2016), whichever came first. The association between moving average exposure at 12, 24, 36, 48, and 60 months and asthma incidence in children was investigated. In Model 1, demographic variables such as age, sex, district-level address, household income, and the seasonal average temperature were adjusted. In Model 2, district-level contextual variables were adjusted, including the proportion of current smokers, high school diplomas, and monthly average income [21]. We performed stratified analysis by sex (boys and girls), age (6–9 and 10–14 years), and household income groups (Q1, Q2, Q3, and Q4) for their association with asthma incidence. In stratified analysis, the moving average exposure in 48 months was used because it was most significantly associated with asthma incidence among 12-, 24-, 36-, 48-, and 60-month moving average. The exposure-response curve between the 48-month moving average PM2.5 exposure and asthma incidence was estimated using the natural cubic splines model with 3 knots (5th, 50th, and 95th percentiles of 48-month moving average PM2.5 exposure).

3. Results

A total of 1,743,456 children, aged 6–14 years in 2008, were enrolled in this study. During the wash-out period (2008–2011), children who died (n = 497) and children who developed asthma (n = 171,470) were excluded from the study. During the study period (2008–2016), children who did not maintain health insurance qualifications, did not live in the seven metropolitan cities, or moved to other cities were excluded (n = 143,780). Finally, 1,425,638 children were included in the analysis (Figure 1). Of these, 52,133 (3.7%) developed asthma, and the incidence rate was 6.9 cases/1000 person-years.
Among the study subjects, the proportion of boys was 52.3% (n = 746,130), the proportion of the age group of 10–14 years was 57.7% (n = 822,060), and that of the highest household income group was 42.7% (n = 609,012). The number of participants living in Seoul (n = 570,263, 40%) was higher than that of other cities. Compared to the children who did not develop asthma, those who developed asthma were more common among boys, younger children, and higher household income groups (Table 1).
Figure 2 shows the annual average PM2.5 levels of seven metropolitan cities in South Korea from 2006 to 2016. The mean ± standard deviation (SD) of PM2.5 was 29.0 ± 7.6 µg/m3. Although the PM2.5 concentrations gradually decreased over time in all seven metropolitan cities, exposure to PM2.5 is still a growing concern given its higher concentration (>20 µg/m3).
Table 2 shows the HR of asthma incidence according to a 10 µg/m3 increase in the moving average PM2.5 levels. In Model 1, a 10 µg/m3 increase in the moving average PM2.5 exposure was associated with an elevated risk of asthma incidence, with HRs of 1.065 (95% CI: 1.023–1.107), 1.078 (95% CI: 1.030–1.127), 1.086 (95% CI: 1.038–1.135), and 1.079 (95% CI: 1.030–1.128) for the 12-, 36-, 48, and 60-month moving average PM2.5, respectively. In Model 2, when the contextual variables were adjusted, the results remained robust, with HRs of 1.056 (95% CI: 1.013–1.099), 1.070 (95% CI: 1.019–1.120), 1.075 (95% CI: 1.024–1.126), and 1.068 (95% CI: 1.017–1.119) for the 12-, 36-, 48, and 60-month moving average PM2.5, respectively.
Table 3 shows the results of stratified analysis by sex, age, and household income groups. We observed a statistically significant association between the 48-month moving average PM2.5 exposure and asthma incidence among girls (HR = 1.108, 95% CI: 1.031–1.185), but the association was not significant among boys (HR = 1.059, 95% CI: 0.991–1.127). In the stratified analysis by age group, those aged 6–9 years showed a significant association between PM2.5 and asthma incidence (HR = 1.112, 95% CI: 1.045–1.178), but those aged 10–14 years showed a non-significant association (HR = 1.029, 95% CI: 0.950–1.108). The 48-month moving average PM2.5 exposure and asthma were significantly associated among the highest household income quartile (HR = 1.234, 95% CI: 1.161–1.308), but not significantly associated among 1st, 2nd, and 3rd quartile income group (HR = 0.841, 95% CI: 0.708–0.974; HR = 1.078, 95% CI: 0.948–1.207; HR = 0.940, 95% CI: 0.831–1.048, respectively).
Figure 3 shows the exposure-response curves of the 48-month moving average PM2.5 exposure and the HR of asthma incidence. While analyzing the total population, when the exposure range was over 30 µg/m3, the HRs of asthma incidence increased linearly. In the 6–9-year age group and girls, the HRs of asthma incidence increased linearly over the entire exposure range. In the fourth quartile of the household income group, the HR of asthma incidence increased linearly when the exposure range was over 26 µg/m3.

4. Discussion

The present study demonstrated that long-term exposure to PM2.5 increased the risk of asthma incidence in school-aged children. A linear exposure-response association between long-term exposure to PM2.5 and risk of asthma incidence was observed in exposure ranges over 30 µg/m3.
In our data, a 10 µg/m3 increase of PM2.5 exposure was associated with asthma incidence as the HR of 1.09 (95% CI: 1.02–1.13), which can be expressed as the HR of 1.007 (95% CI: 1.002–1.011) for asthma incidence per 1 µg/m3 increase of PM2.5 exposure. There are previous studies that observed a smaller size of association than our study. A systematic review and meta-analysis of epidemiological studies published until 8 September 2016 reported that the overall random-effects risk estimate of childhood asthma development was 1.03 (95% CI: 1.01–1.05) per 1 µg/m3 increase of PM2.5 exposure [4]. In this systematic review, PM2.5 exposure levels in included studies were lower than in our study. A retrospective cohort study of 1,130,855 singleton live births between 2006 and 2014 in the province of Ontario, Canada, reported that ambient PM2.5 mass concentration during childhood was associated with an increased incidence of childhood asthma, and the HR for each 1 µg/m3 increase was 1.026 (95% CI: 1.021–1.031) [22]. The mean PM2.5 concentration of childhood exposure was 7.9 µg/m3. Corinne et al. used Medicaid data, and monitoring data of PM2.5 also showed a 1.023 (95% CI: 1.014–1.031) relative ratio to diagnosed asthma per 1 µg/m3, an increase of PM2.5 [23]. The mean concentration of PM2.5 in this study was 8.4 µg/m3. Here, we found a significant association between asthma incidence and exposure to PM2.5 in South Korea, where the exposure range of PM2.5 is higher than that in Western countries. In our data, the mean PM2.5 concentration was 29.0 µg/m3. Although we cannot explore the exposure-response curve at low level of PM2.5, because of the baseline level of PM2.5 in South Korea is relatively higher. There could be a stronger association between asthma incidence and an increase in PM2.5 at a low level than at a high level.
In this study, the exposure-response curve demonstrated that the HRs of asthma incidence increased linearly when the 48-month moving average PM2.5 level was over 30 µg/m3. Considering that 80% of the study participants were exposed to PM2.5 within this exposure range and the annual average PM2.5 concentration of the aforementioned seven metropolitan cities in South Korea (2006–2016) was 29 µg/m3, the linearity of the exposure-response curve found in this study could be applied at the high range of PM2.5 exposure. However, to analyze the exposure-response curve for the HRs of childhood asthma incidence at a low PM2.5 exposure, further studies should be conducted in countries or regions with low PM2.5 exposure.
In this study, the incidence rate of asthma in school-aged children aged 6–14 years was 6.9 cases/1000 person-years. The asthma prevalence in South Korea is 5.48–7.86%, measured by NHIS data [24], but no previous study has reported such data in South Korea. Our estimate of the asthma incidence rate is similar to that observed in the Netherlands (6.7 cases/1000 person-years of children aged 5–18 years) [25] and the United States (6.0 cases/1000 person-years of children aged 9–14 years) [26] and slightly higher than that observed in Denmark (5.3 cases/1000 person-years of children aged 5–9 years, 4.4 cases/1000 person-years of children aged 10–15 years) [27]. The observed differences could be explained by the environmental factors of the population and definitions of asthma incidence in different countries.
The stratified analysis revealed a stronger association between asthma development among younger children and children with high household incomes. As asthma incidence peaked in children aged 0–9 years [28], the association between PM2.5 and asthma could be more clearly observed at younger ages. The association between PM2.5 and asthma was stronger among the high-income group in our study. Children with low socioeconomic status have been regarded as more vulnerable to environmental hazards [29]. O’Lenick et al. investigated emergency department visit data in Atlanta. They observed a more significant association between air pollution and asthma among deprived children than non-deprived children [30]. However, a recent study investigated 39,782 Chinese children and showed higher socioeconomic status is related to asthma [31]. Further studies on the effects of socioeconomic status on the association between PM2.5 and asthma are required. Hsu et al. studied a mother-child cohort with 736 children, and reported that prenatal exposure to PM2.5 is only associated with asthma incidence among boys and suggested that the antioxidant properties of female sex hormones could have protective effects on PM2.5 [32]. However, this attenuation by sex was not observed in our study.
The strengths of our study lie in the use of NHIS data, which includes almost the entire urban population in South Korea, where citizens have high access to and low cost of medical care. Taking advantage of this, we estimated the representative incident rate of childhood asthma and the risk of childhood asthma development due to long-term exposure to PM2.5.
The present study has several limitations. First, there is a possibility that the individual ambient PM2.5 exposure was misclassified because we used PM2.5 concentration based on the district-level addresses of the study participants. Second, confounders such as exposure to secondhand smoke could not be adjusted because we could not gather personal level information from the NHIS data. Despite adjusting for district-level contextual variables, the confounding effect may persist. Third, our study could not use other air pollutants such as ozone and nitrogen dioxide. Although we considered the meteorological factors such as temperature, the association of other air pollutants with asthma incidence could not be assessed. Finally, precise asthma definitions in previous studies could not be applied due to limitations in using NHIS data, such as the inability to use prescription records, although we set the operational definition of asthma considering the previous studies [13,14].

5. Conclusions

Our retrospective cohort study using NHIS data showed that long-term exposure to PM2.5 increased the risk of asthma incidence among school-aged children. Considering that more than 90% of the world’s population lives in areas where PM2.5 levels exceeded 10 µg/m3 in 2019, our study results in South Korea, which has higher ambient PM2.5 levels than western countries, are meaningful. However, additional studies with a more reliable definition of asthma incidence using prescription records and better assessing personal characteristics as unmeasured confounders are needed.

Author Contributions

Conceptualization, D.-W.L.; methodology, D.-W.L., S.-W.R. and H.-M.L.; software, Y.-H.L., S.-W.R. and H.-M.L.; investigation, H.-M.L.; resources, S.-T.K.; data curation, S.-T.K.; writing—original draft preparation, H.-M.L. and S.-W.R.; writing—review and editing, D.-W.L. and Y.-C.H.; visualization, H.-M.L.; supervision, D.-W.L. All authors have read and agreed to the published version of the manuscript.

Funding

This research received no external funding.

Institutional Review Board Statement

This study was exempted from review by the Institutional Review Board of the Seoul National University Hospital (E-1807-038-956) because we used de-identified data provided by the NHIS. The study complies with the NHIS personal information protection guidelines.

Informed Consent Statement

Patient consent was waived because the NHIS data that we constructed and used is anonymized with strict confidentiality guidelines.

Data Availability Statement

Restrictions apply to the availability of these data. Data were obtained from the national health insurance service of South Korea and are available [at https://nhiss.nhis.or.kr/, accessed on 3 September 2022] with the permission of the NHIS.

Acknowledgments

This study used the customized Health Insurance Data based on health insurance claims data in Korea. The aim and conclusion of this study are irrelevant to the National Health Insurance Service, Republic of Korea. The research number of this study is NHIS-2019-1-023. This research was supported by the Seoul St. Mary’s Hospital’s Environmental Health Center for Training Environmental Medicine Professionals funded by the Ministry of Environment, Republic of Korea (2021).

Conflicts of Interest

The authors declare no conflict of interest.

References

  1. Addo-Yobo, E.; Ade, S.; Agodokpessi, G.; Aguirre, V.; Aït-Khaled, N. The Global Asthma Report 2018; The Global Asthma Network: Auckland, New Zealand, 2018. [Google Scholar]
  2. Toskala, E.; Kennedy, D.W. Asthma risk factors. Int. Forum Fllergy Rhinol. 2015, 5, S11–S16. [Google Scholar] [CrossRef]
  3. Holst, G.J.; Pedersen, C.B.; Thygesen, M.; Brandt, J.; Geels, C.; Bønløkke, J.H.; Sigsgaard, T. Air pollution and family related determinants of asthma onset and persistent wheezing in children: Nationwide case-control study. BMJ 2020, 370, m2791. [Google Scholar] [CrossRef] [PubMed]
  4. Khreis, H.; Kelly, C.; Tate, J.; Parslow, R.; Lucas, K.; Nieuwenhuijsen, M. Exposure to traffic-related air pollution and risk of development of childhood asthma: A systematic review and meta-analysis. Environ. Int. 2017, 100, 1–31. [Google Scholar] [CrossRef] [PubMed]
  5. Burnett, R.; Chen, H.; Szyszkowicz, M.; Fann, N.; Hubbell, B.; Pope, C.A.; Apte, J.S.; Brauer, M.; Cohen, A.; Weichenthal, S. Global estimates of mortality associated with long-term exposure to outdoor fine particulate matter. Proc. Natl. Acad. Sci. USA 2018, 115, 9592–9597. [Google Scholar] [CrossRef]
  6. Bateson, T.F.; Schwartz, J. Children’s response to air pollutants. J. Toxicol. Environ. Health Part A 2007, 71, 238–243. [Google Scholar] [CrossRef]
  7. Bowatte, G.; Lodge, C.; Lowe, A.J.; Erbas, B.; Perret, J.; Abramson, M.J.; Matheson, M.; Dharmage, S.C. The influence of childhood traffic-related air pollution exposure on asthma, allergy and sensitization: A systematic review and a meta-analysis of birth cohort studies. Allergy 2015, 70, 245–256. [Google Scholar] [CrossRef] [PubMed]
  8. Jung, C.-R.; Chen, W.-T.; Tang, Y.-H.; Hwang, B.-F. Fine particulate matter exposure during pregnancy and infancy and incident asthma. J. Allergy Clin. Immunol. 2019, 143, 2254–2262.e5. [Google Scholar] [CrossRef]
  9. Yang, S.I.; Lee, S.Y.; Kim, H.B.; Kim, H.C.; Leem, J.H.; Yang, H.J.; Kwon, H.; Seo, J.H.; Cho, H.J.; Yoon, J. Prenatal particulate matter affects new asthma via airway hyperresponsiveness in schoolchildren. Allergy 2019, 74, 675–684. [Google Scholar] [CrossRef]
  10. World Health Organization. WHO AIr Quality Database 2022. Available online: https://www.who.int/publications/m/item/who-air-quality-database-2022 (accessed on 23 July 2022).
  11. Cheol Seong, S.; Kim, Y.-Y.; Khang, Y.-H.; Heon Park, J.; Kang, H.-J.; Lee, H.; Do, C.-H.; Song, J.-S.; Hyon Bang, J.; Ha, S. Data resource profile: The national health information database of the National Health Insurance Service in South Korea. Int. J. Epidemiol. 2017, 46, 799–800. [Google Scholar] [CrossRef]
  12. Bateman, E.D.; Hurd, S.S.; Barnes, P.J.; Bousquet, J.; Drazen, J.M.; FitzGerald, M.; Gibson, P.; Ohta, K.; O’byrne, P.; Pedersen, S.E.; et al. Global strategy for asthma management and prevention: GINA executive summary. Eur. Respir. J. 2008, 31, 143–178. [Google Scholar] [CrossRef]
  13. Ma, Y.-C.; Lin, C.-C.; Yang, S.-Y.; Chen, H.-J.; Li, T.-C.; Lin, J.-G. Time trend analysis of the prevalence and incidence of diagnosed asthma and traditional Chinese medicine use among adults in Taiwan from 2000 to 2011: A population-based study. PLoS ONE 2015, 10, e0140318. [Google Scholar] [CrossRef]
  14. Lee, D.-W.; Han, C.-W.; Hong, Y.-C.; Oh, J.-M.; Bae, H.-J.; Kim, S.; Lim, Y.-H. Long-term exposure to fine particulate matter and incident asthma among elderly adults. Chemosphere 2021, 272, 129619. [Google Scholar] [CrossRef]
  15. Skamarock, W.C.; Klemp, J.B. A time-split nonhydrostatic atmospheric model for weather research and forecasting applications. J. Comput. Phys. 2008, 227, 3465–3485. [Google Scholar] [CrossRef]
  16. Kim, H.C.; Kim, E.; Bae, C.; Cho, J.H.; Kim, B.-U.; Kim, S. Regional contributions to particulate matter concentration in the Seoul metropolitan area, South Korea: Seasonal variation and sensitivity to meteorology and emissions inventory. Atmos. Chem. Phys. 2017, 17, 10315–10332. [Google Scholar] [CrossRef]
  17. Kim, B.-U.; Bae, C.; Kim, H.C.; Kim, E.; Kim, S. Spatially and chemically resolved source apportionment analysis: Case study of high particulate matter event. Atmos. Environ. 2017, 162, 55–70. [Google Scholar] [CrossRef]
  18. Han, C.; Oh, J.; Lim, Y.-H.; Kim, S.; Hong, Y.-C. Long-term exposure to fine particulate matter and development of chronic obstructive pulmonary disease in the elderly. Environ. Int. 2020, 143, 105895. [Google Scholar] [CrossRef] [PubMed]
  19. Kang, Y.W.; Ko, Y.S.; Kim, Y.J.; Sung, K.M.; Kim, H.J.; Choi, H.Y.; Sung, C.; Jeong, E. Korea community health survey data profiles. Osong Public Health Res. Perspect. 2015, 6, 211–217. [Google Scholar] [CrossRef] [PubMed]
  20. Dekker, F.W.; De Mutsert, R.; Van Dijk, P.C.; Zoccali, C.; Jager, K.J. Survival analysis: Time-dependent effects and time-varying risk factors. Kidney Int. 2008, 74, 994–997. [Google Scholar] [CrossRef]
  21. Gan, W.Q.; FitzGerald, J.M.; Carlsten, C.; Sadatsafavi, M.; Brauer, M. Associations of ambient air pollution with chronic obstructive pulmonary disease hospitalization and mortality. Am. J. Respir. Crit. Care Med. 2013, 187, 721–727. [Google Scholar] [CrossRef]
  22. Lavigne, É.; Talarico, R.; van Donkelaar, A.; Martin, R.V.; Stieb, D.M.; Crighton, E.; Weichenthal, S.; Smith-Doiron, M.; Burnett, R.T.; Chen, H. Fine particulate matter concentration and composition and the incidence of childhood asthma. Environ. Int. 2021, 152, 106486. [Google Scholar] [CrossRef]
  23. Keet, C.A.; Keller, J.P.; Peng, R.D. Long-term coarse particulate matter exposure is associated with asthma among children in Medicaid. Am. J. Respir. Crit. Care Med. 2018, 197, 737–746. [Google Scholar] [CrossRef] [PubMed]
  24. Sol, I.S.; Jang, H.; Noh, J.; Kim, S.Y.; Kim, M.J.; Kim, Y.H.; Kim, C.; Sohn, M.H.; Kim, K.W. Mortality and morbidity in children with asthma: A nationwide study in Korea. Respir. Med. 2021, 177, 106306. [Google Scholar] [CrossRef]
  25. Engelkes, M.; Janssens, H.M.; de Ridder, M.A.; de Jongste, J.C.; Sturkenboom, M.C.; Verhamme, K.M. Time trends in the incidence, prevalence and age at diagnosis of asthma in children. Pediatric Allergy Immunol. 2015, 26, 367–374. [Google Scholar] [CrossRef] [PubMed]
  26. Chen, Z.; Salam, M.T.; Alderete, T.L.; Habre, R.; Bastain, T.M.; Berhane, K.; Gilliland, F.D. Effects of childhood asthma on the development of obesity among school-aged children. Am. J. Respir. Crit. Care Med. 2017, 195, 1181–1188. [Google Scholar] [CrossRef]
  27. Henriksen, L.; Simonsen, J.; Haerskjold, A.; Linder, M.; Kieler, H.; Thomsen, S.F.; Stensballe, L.G. Incidence rates of atopic dermatitis, asthma, and allergic rhinoconjunctivitis in Danish and Swedish children. J. Allergy Clin. Immunol. 2015, 136, 360–366.e2. [Google Scholar] [CrossRef] [PubMed]
  28. Honkamäki, J.; Hisinger-Mölkänen, H.; Ilmarinen, P.; Piirilä, P.; Tuomisto, L.E.; Andersén, H.; Huhtala, H.; Sovijärvi, A.; Backman, H.; Lundbäck, B. Age-and gender-specific incidence of new asthma diagnosis from childhood to late adulthood. Respir. Med. 2019, 154, 56–62. [Google Scholar] [CrossRef]
  29. Bae, H.-J. Effects of Reduced Ambient PM 10 Levels on the Health of Children in Lower-income Families. J. Environ. Health Sci. 2010, 36, 182–190. [Google Scholar] [CrossRef]
  30. O’lenick, C.R.; Winquist, A.; Mulholland, J.A.; Friberg, M.D.; Chang, H.H.; Kramer, M.R.; Darrow, L.A.; Sarnat, S.E. Assessment of neighbourhood-level socioeconomic status as a modifier of air pollution–asthma associations among children in Atlanta. J Epidemiol. Community Health 2017, 71, 129–136. [Google Scholar] [CrossRef]
  31. Norbäck, D.; Lu, C.; Wang, J.; Zhang, Y.; Li, B.; Zhao, Z.; Huang, C.; Zhang, X.; Qian, H.; Sun, Y. Asthma and rhinitis among Chinese children—Indoor and outdoor air pollution and indicators of socioeconomic status (SES). Environ. Int. 2018, 115, 1–8. [Google Scholar] [CrossRef]
  32. Leon Hsu, H.-H.; Mathilda Chiu, Y.-H.; Coull, B.A.; Kloog, I.; Schwartz, J.; Lee, A.; Wright, R.O.; Wright, R.J. Prenatal particulate air pollution and asthma onset in urban children. Identifying sensitive windows and sex differences. Am. J. Respir. Crit. Care Med. 2015, 192, 1052–1059. [Google Scholar] [CrossRef] [Green Version]
Figure 1. Flow chart of the study population.
Atmosphere 13 01430 g001
Figure 2. Mean concentration of PM2.5 by year and metropolitan city.
Atmosphere 13 01430 g002
Figure 3. Hazard ratio plot of the 48-month moving average of PM2.5 levels for asthma incidence. Red line, hazard ratio (HR) of incident asthma by PM2.5 levels; Dotted line, 95% confidence intervals of HR of incident asthma by PM2.5 levels; Black line, the reference line with HR of 1.
Atmosphere 13 01430 g003
Table 1. Descriptive statistics of the study participants at the baseline.
VariableTotalNon-AsthmaticAsthmatic
n (%) an (%) bn (%) b
Total1,425,638 (100.0)1,373,505 (96.3)52,133 (3.7)
Sex
Boy746,130 (52.3)716,794 (96.1)29,336 (3.9)
Girl679,508 (47.7)656,711 (96.6)22,797 (3.4)
Age
6–9603,578 (42.3)573,721 (95.1)29,857 (4.9)
10–14822,060 (57.7)799,784 (97.3)22,276 (2.7)
Income status
Q1 (lowest)269,275 (18.9)261,038 (96.9)8237 (3.1)
Q2250,953 (17.6)242,370 (96.6)8223 (3.3)
Q3296,398 (20.8)284,512 (96.0)11,886 (4.0)
Q4 (highest)609,012 (42.7)585,225 (96.1)23,787 (3.9)
Metropolitan city
Seoul570,263 (40.0)547,533 (96.0)22,730 (4.0)
Busan203,661 (14.3)197,215 (96.8)6446 (3.2)
Daegu154,420 (10.8)147,866 (95.8)6554 (4.2)
Incheon190,641 (13.4)183,862 (96.4)6779 (3.6)
Gwangju118,820 (8.3)115,296 (97.0)3524 (3.0)
Daejeon105,302 (7.4)101,915 (96.8)3327 (3.2)
Ulsan82,531 (5.8)19,158 (96.6)2773 (3.4)
Contextual variables (district level)
Proportion of high school diploma (%)68.0 ± 4.568.0 ± 4.568.1 ± 4.6
Proportion of current smokers (%)24.5 ± 2.324.5 ± 2.324.5 ± 2.3
Monthly average income (1000 KRW)1307 ± 86.41307 ± 86.41310 ± 87.0
a Percent in a column; b Percent in a row.
Table 2. Hazard ratios for asthma incidence per 10 µg/m3 increase in PM2.5 levels.
Moving Average
Exposure (Months)
nCasesModel 1Model 2
HR(95% CI)p-ValueHR(95% CI)p-Value
121,425,63852,1331.065(1.023–1.107)0.0031.056(1.013–1.099)0.013
24 1.040(0.995–1.086)0.0871.031(0.984–1.078)0.204
36 1.078(1.030–1.127)0.0021.070(1.019–1.120)0.008
48 1.086(1.038–1.135)0.0011.075(1.024–1.126)0.005
60 1.079(1.030–1.128)0.0021.068(1.017–1.119)0.011
PM2.5, particulate matter less than 2.5 µm in diameter; HR, hazard ratio; CI, confidence interval; Model 1: adjusted for age, sex, income group, metropolitan city, mean annual temperature (summer and winter); Model 2: Model 1 + district level proportion of high school diploma (%), the proportion of current smokers (%), monthly average income.
Table 3. HRs for asthma incidence per 10 µg/m3 in the 48-month moving average of PM2.5 level group.
VariablenCasesPerson-YearModel 1Model 2
HR(95% CI)p-ValueHR(95% CI)p-Value
Total1,425,63852,1337,558,7651.086(1.038, 1.135)0.0011.075(1.024–1.126)0.005
Sex
Boy746,13029,3363,948,4201.056(0.991–1.120)0.0961.059(0.991–1.127)0.099
Girl679,50822,7973,610,3451.135(1.061–1.209)0.0011.108(1.031–1.185)0.009
Age
6–9603,57829,8573,173,5981.121(1.057–1.185)<0.0011.112(1.045–1.178)0.002
10–14822,06022,2764,395,1161.036(0.961–1.111)0.3621.029(0.950–1.108)0.474
Income
Q1 (lowest)269,27582371,431,3470.886(0.757–1.014)0.0650.841(0.708–0.974)0.011
Q2250,95382231,323,2831.082(0.957–1.207)0.2181.078(0.948–1.207)0.258
Q3296,39811,8861,557,1030.962(0.858–1.066)0.4620.940(0.831–1.048)0.260
Q4 (highest)609,01223,7873,247,0311.217(1.148–1.286)<0.0011.234(1.161–1.308)<0.001
PM2.5, particulate matter less than 2.5 µm in diameter; HR, hazard ratio; CI, confidence interval; Model 1: adjusted for age, sex, income group, metropolitan city, mean annual temperature (summer and winter); Model 2: Model 1 + district level proportion of high school diploma (%), the proportion of current smokers (%), monthly average income.
Publisher’s Note: MDPI stays neutral with regard to jurisdictional claims in published maps and institutional affiliations.

