

Air Quality Health Benefits of the Nevada Renewable Portfolio Standard

 , and
, and
Abstract
1. Introduction
2. Approaches
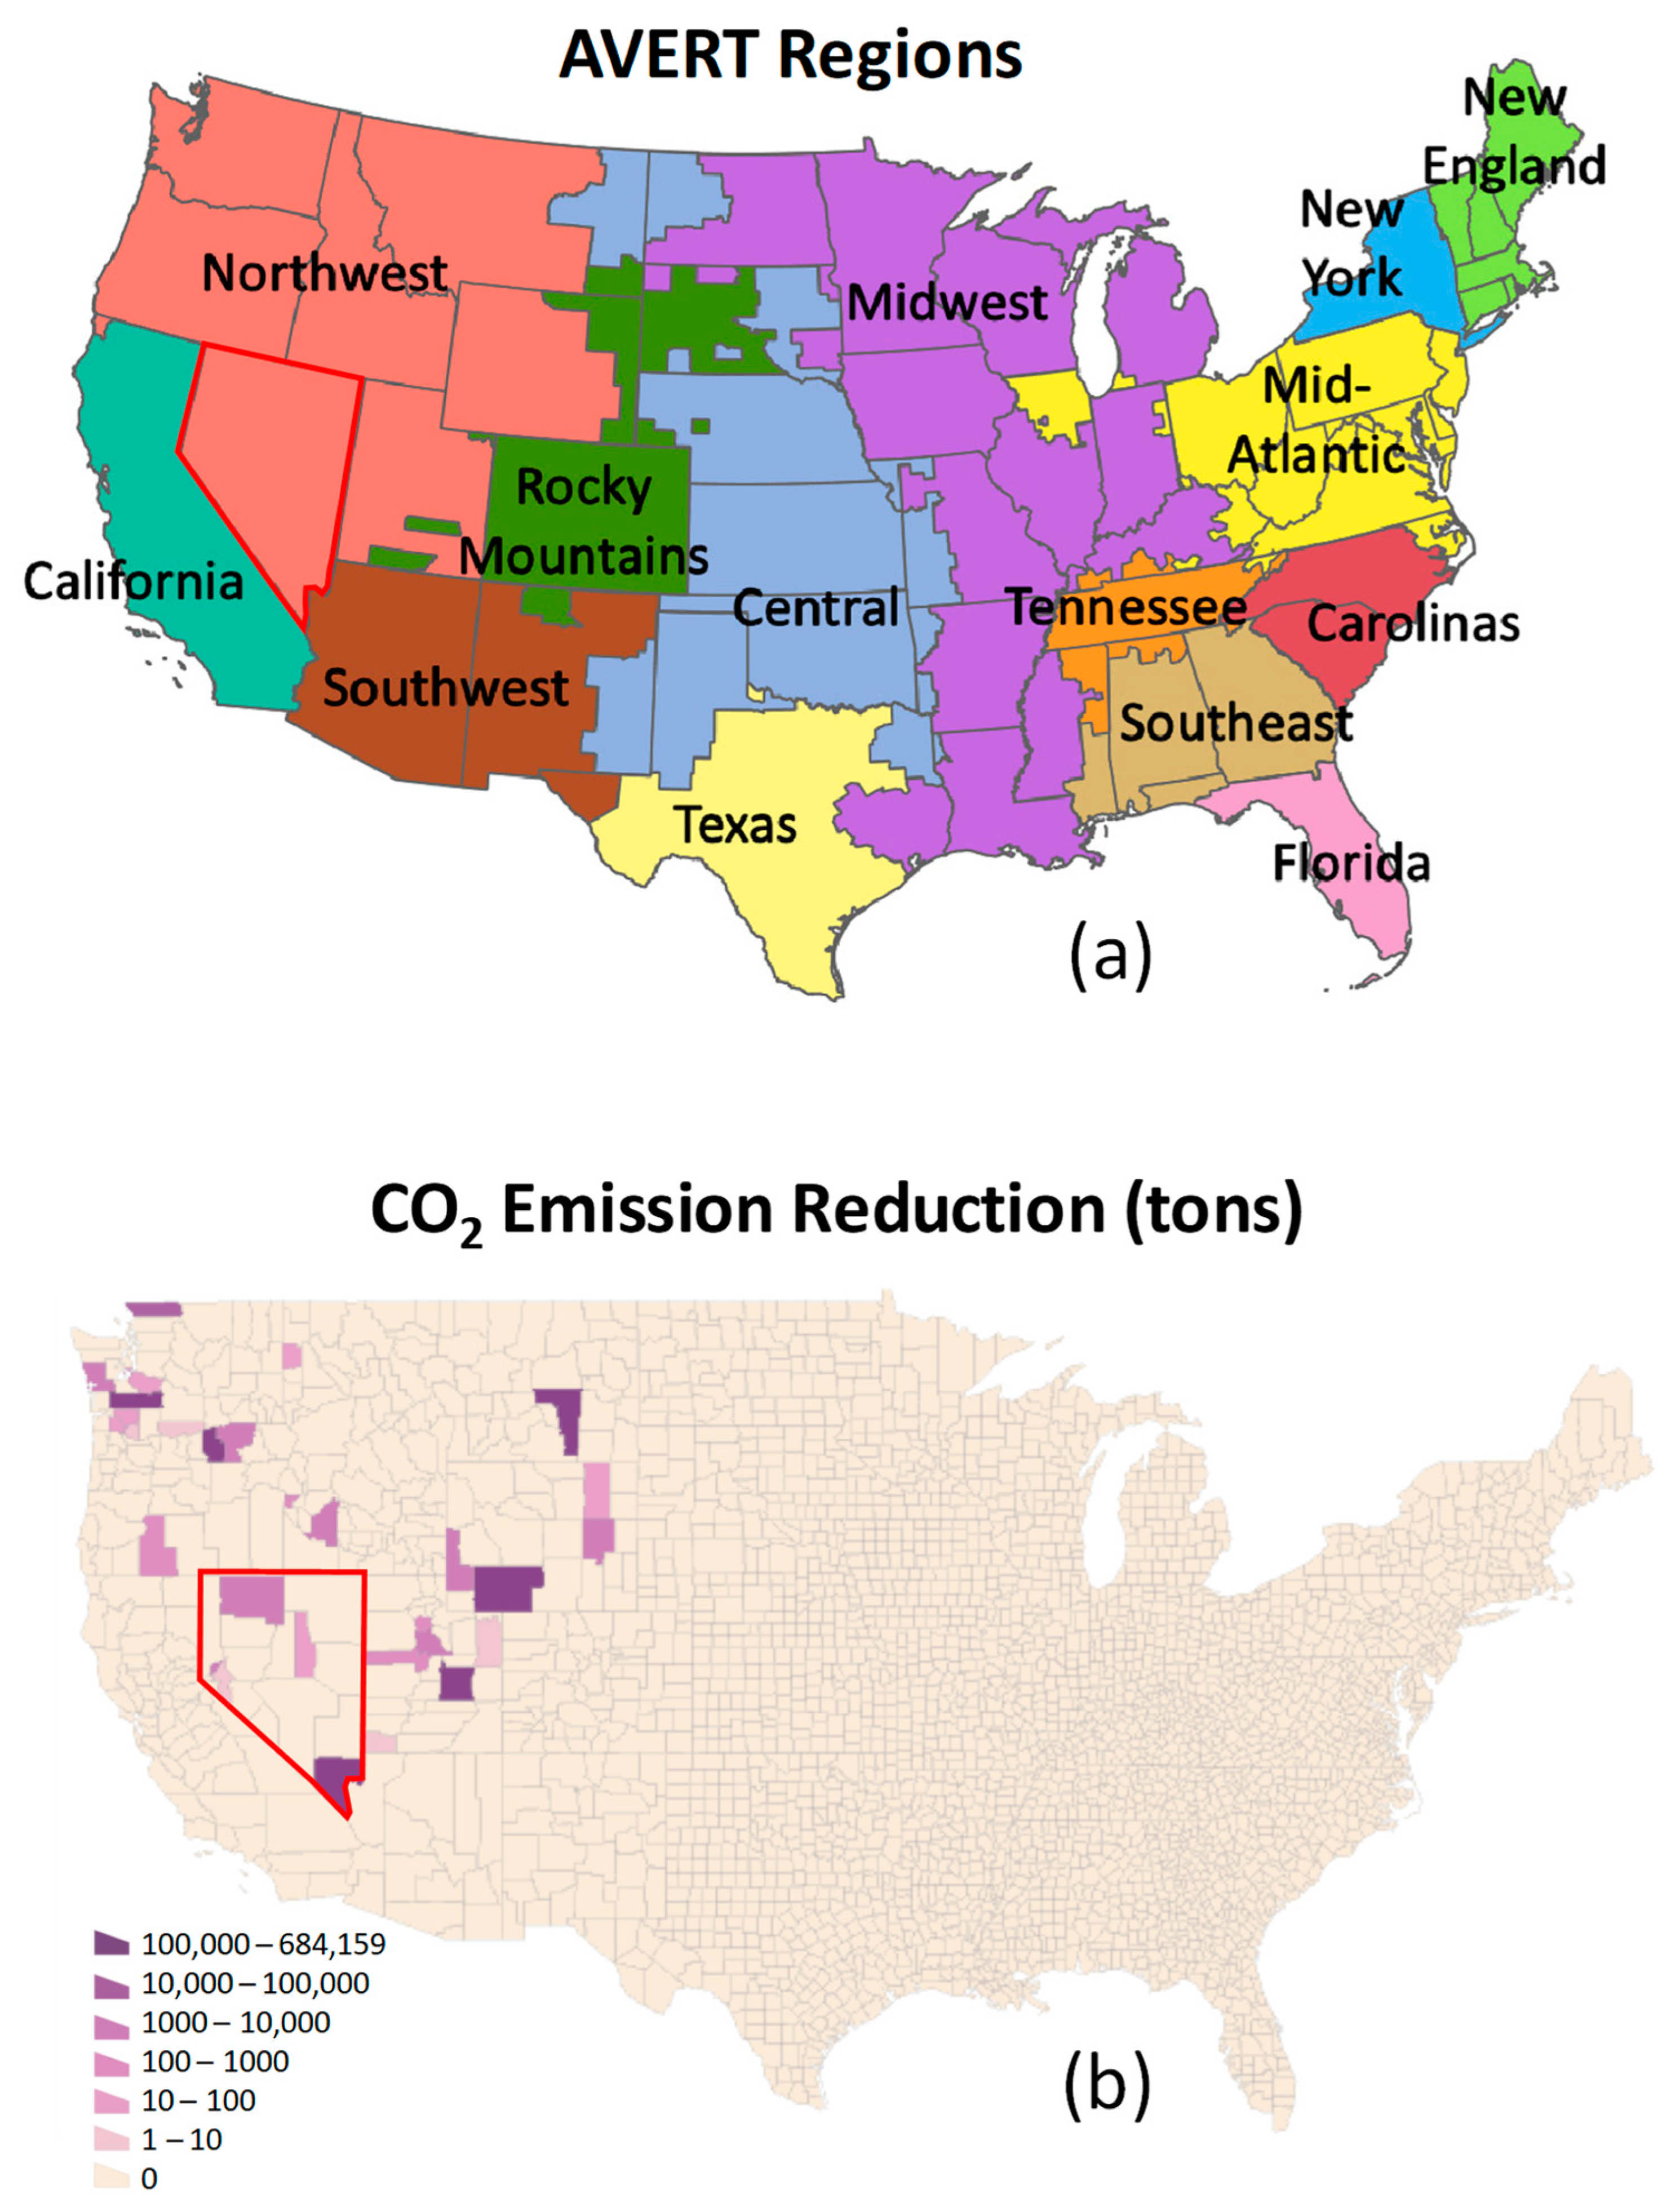
- AVERT
- COBRA
- Model Scenarios
3. Results and Discussion
- Scenario-specific Model Inputs
- Fossil Fuel Demand and Emission Reductions
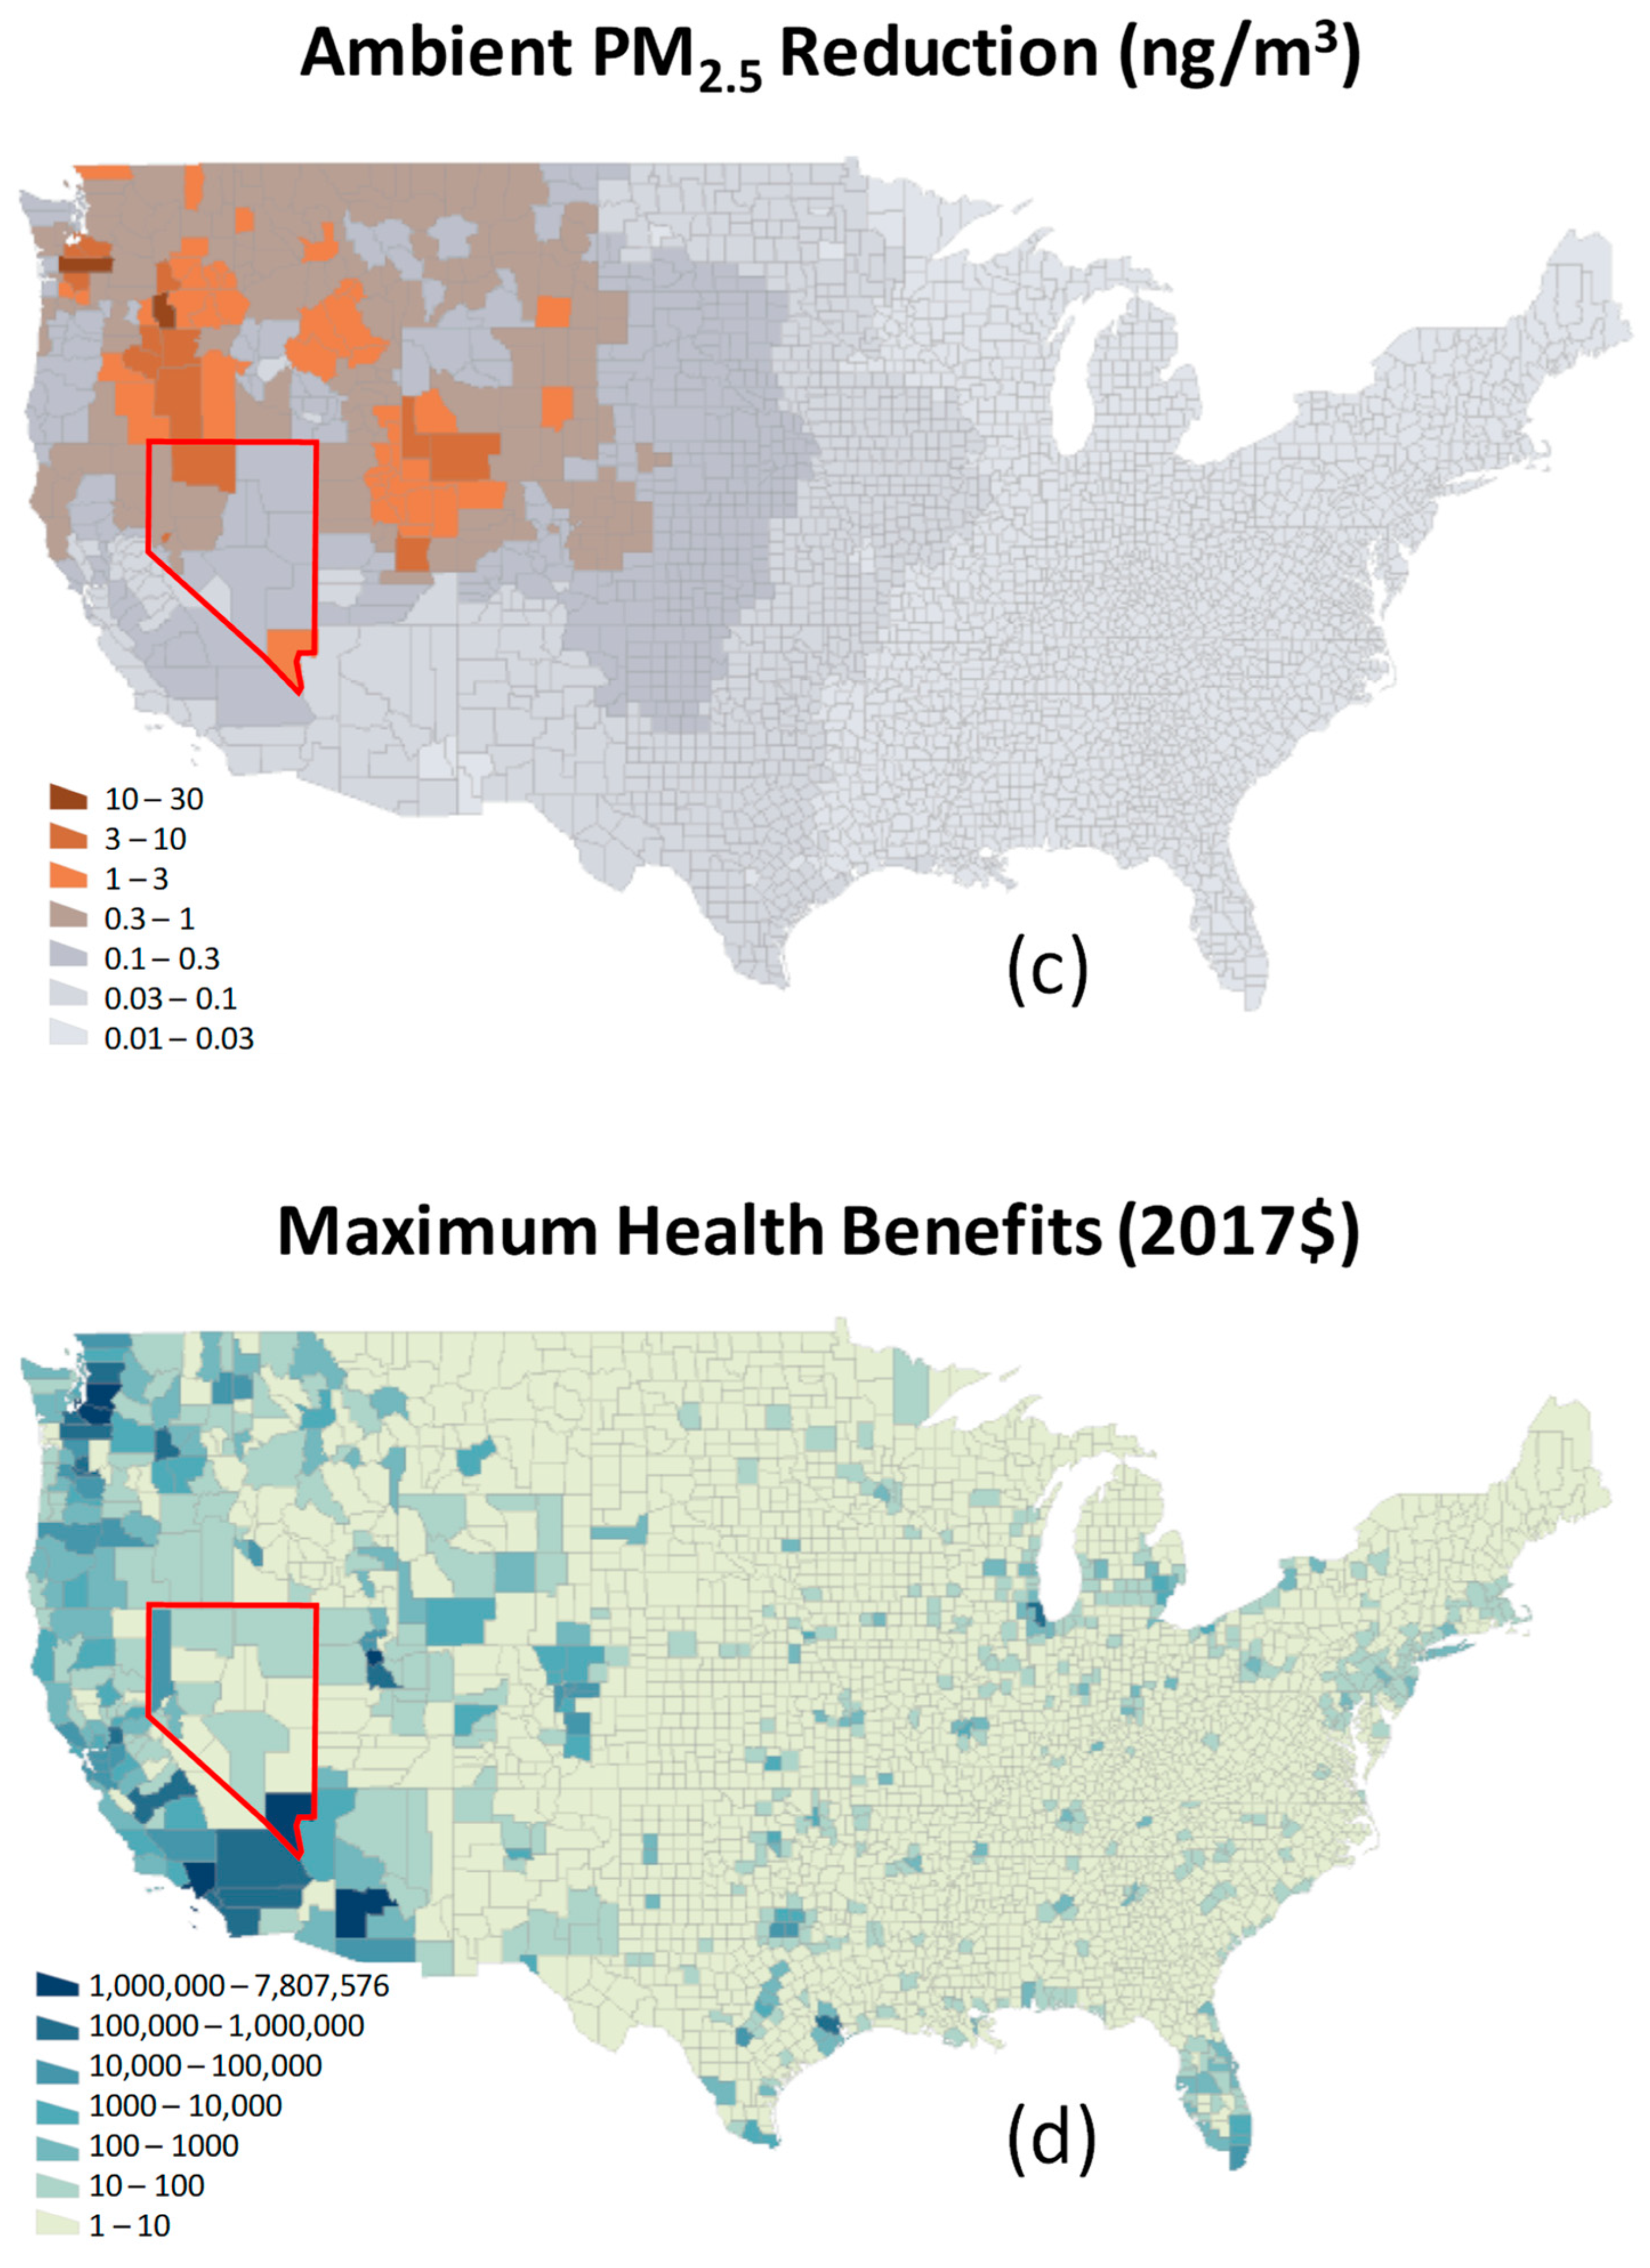
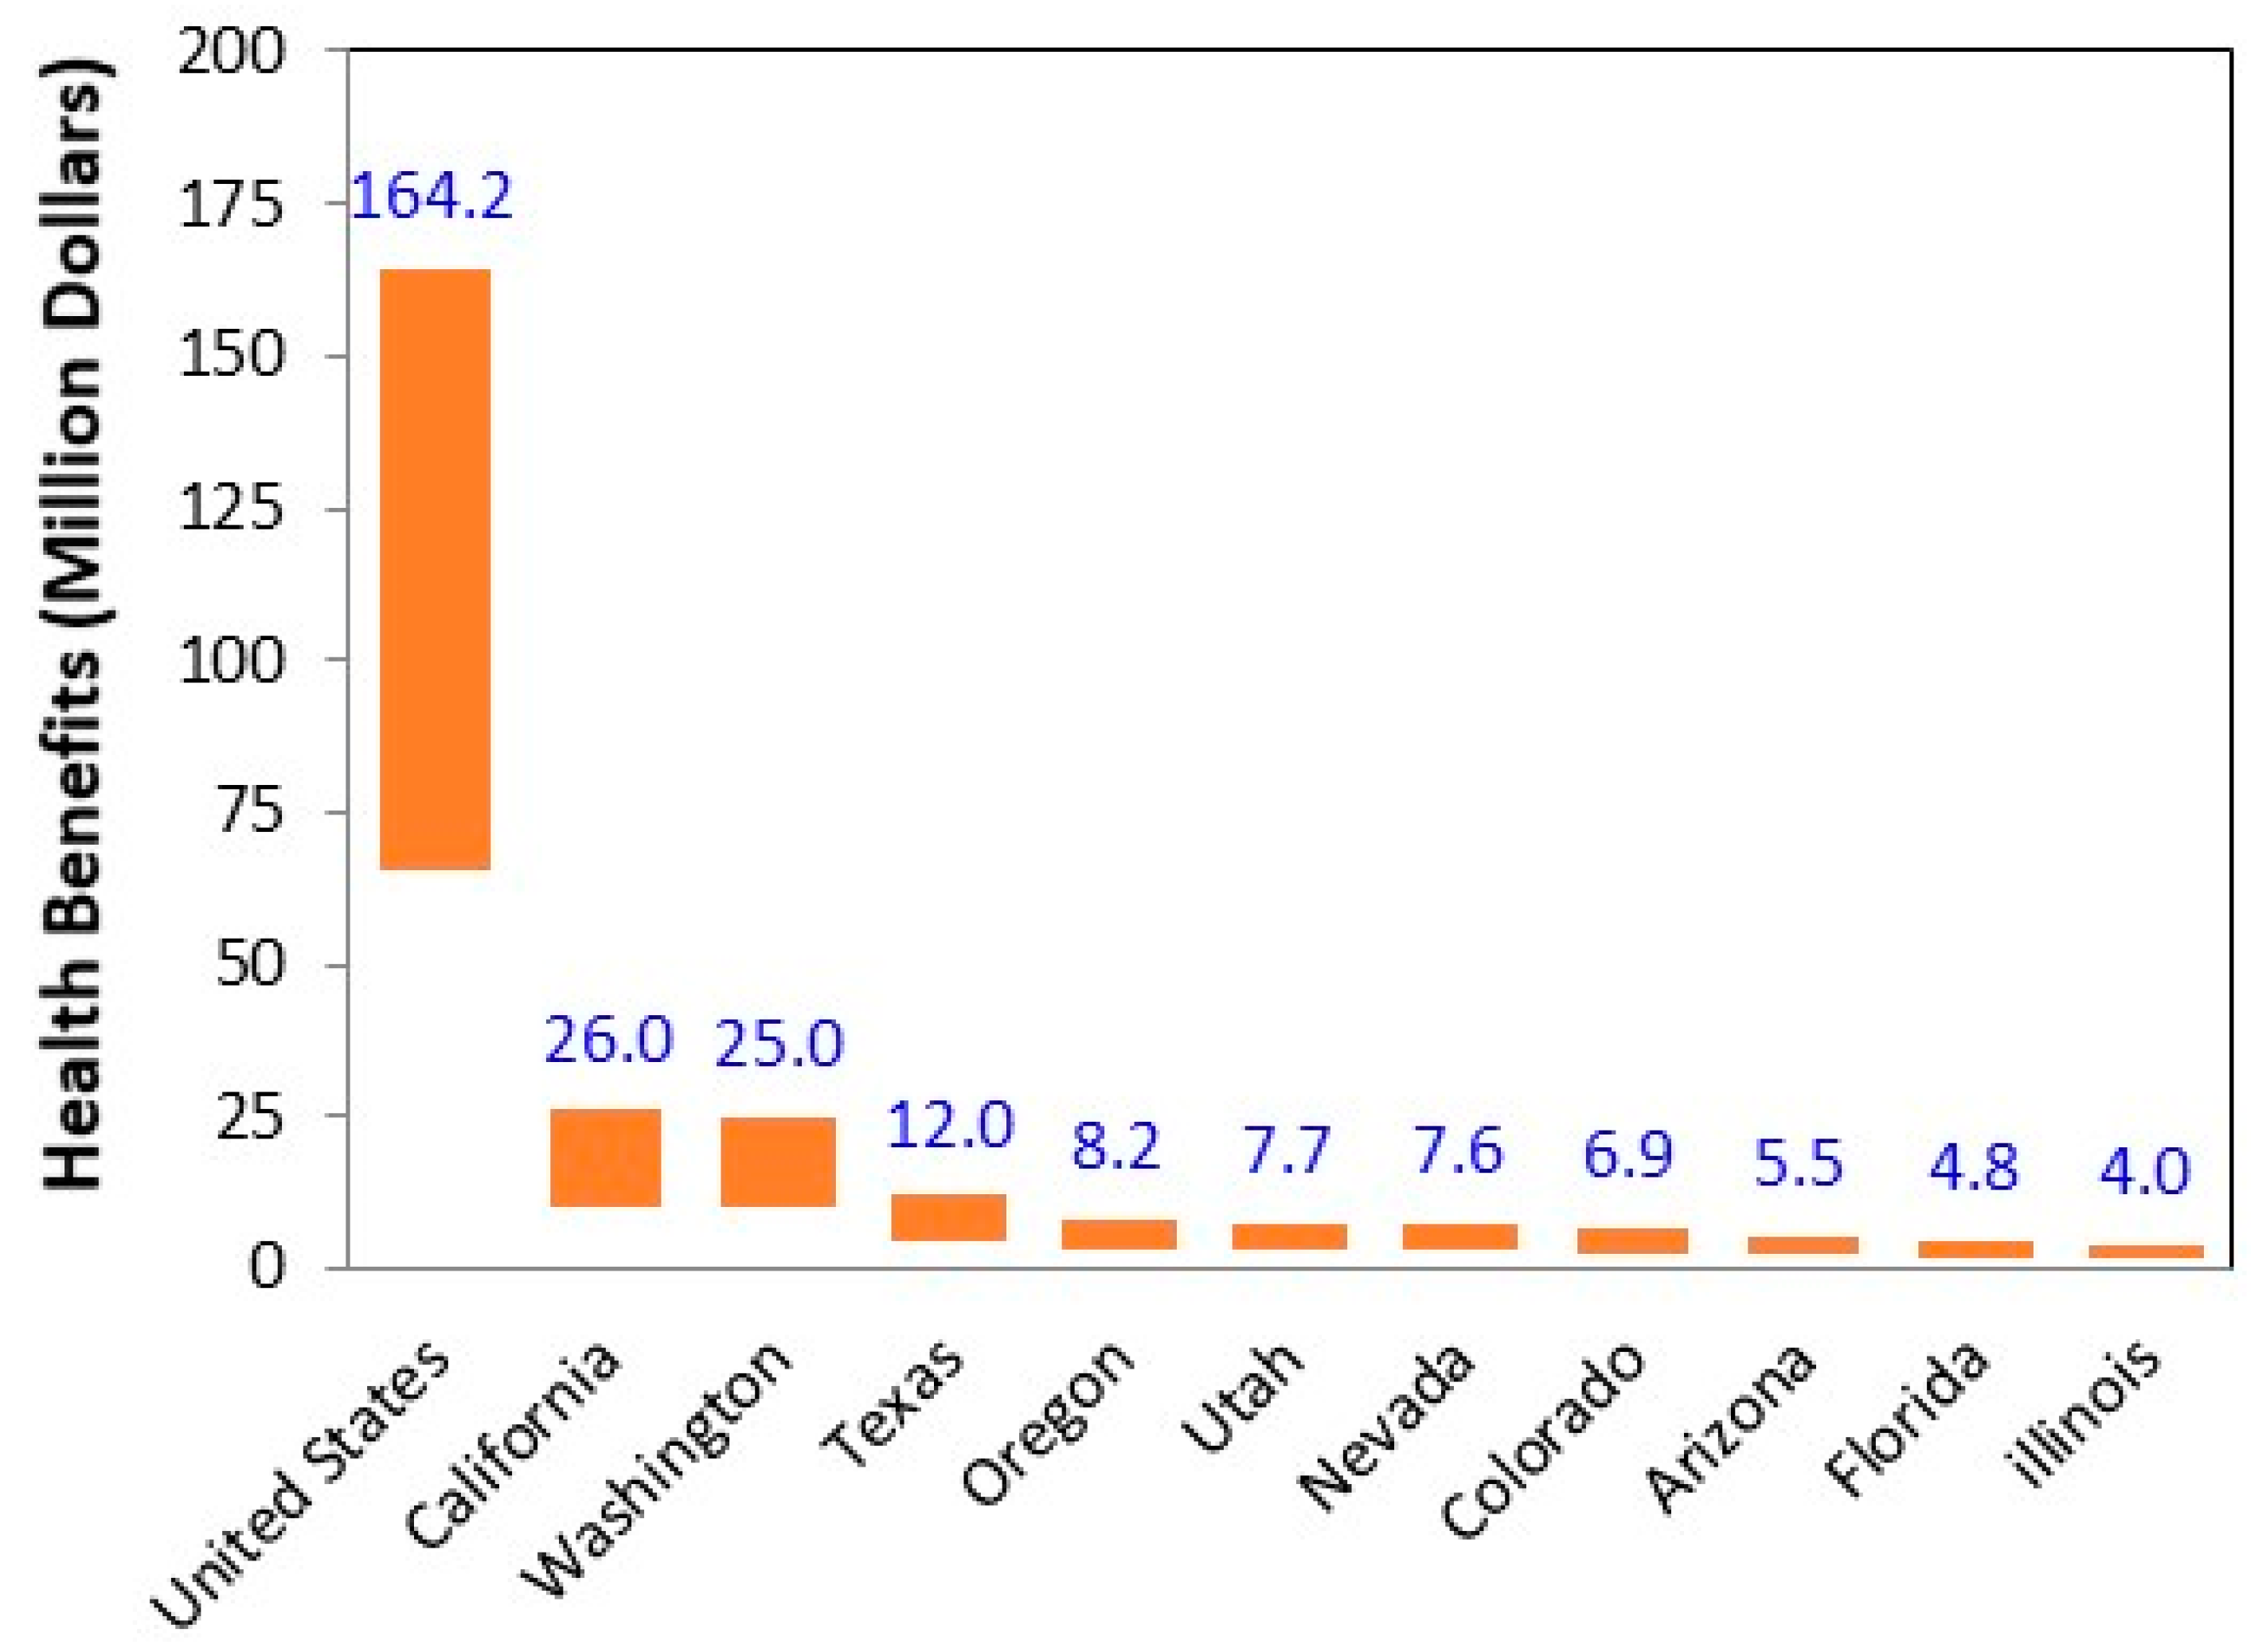
- Regional Health Benefits


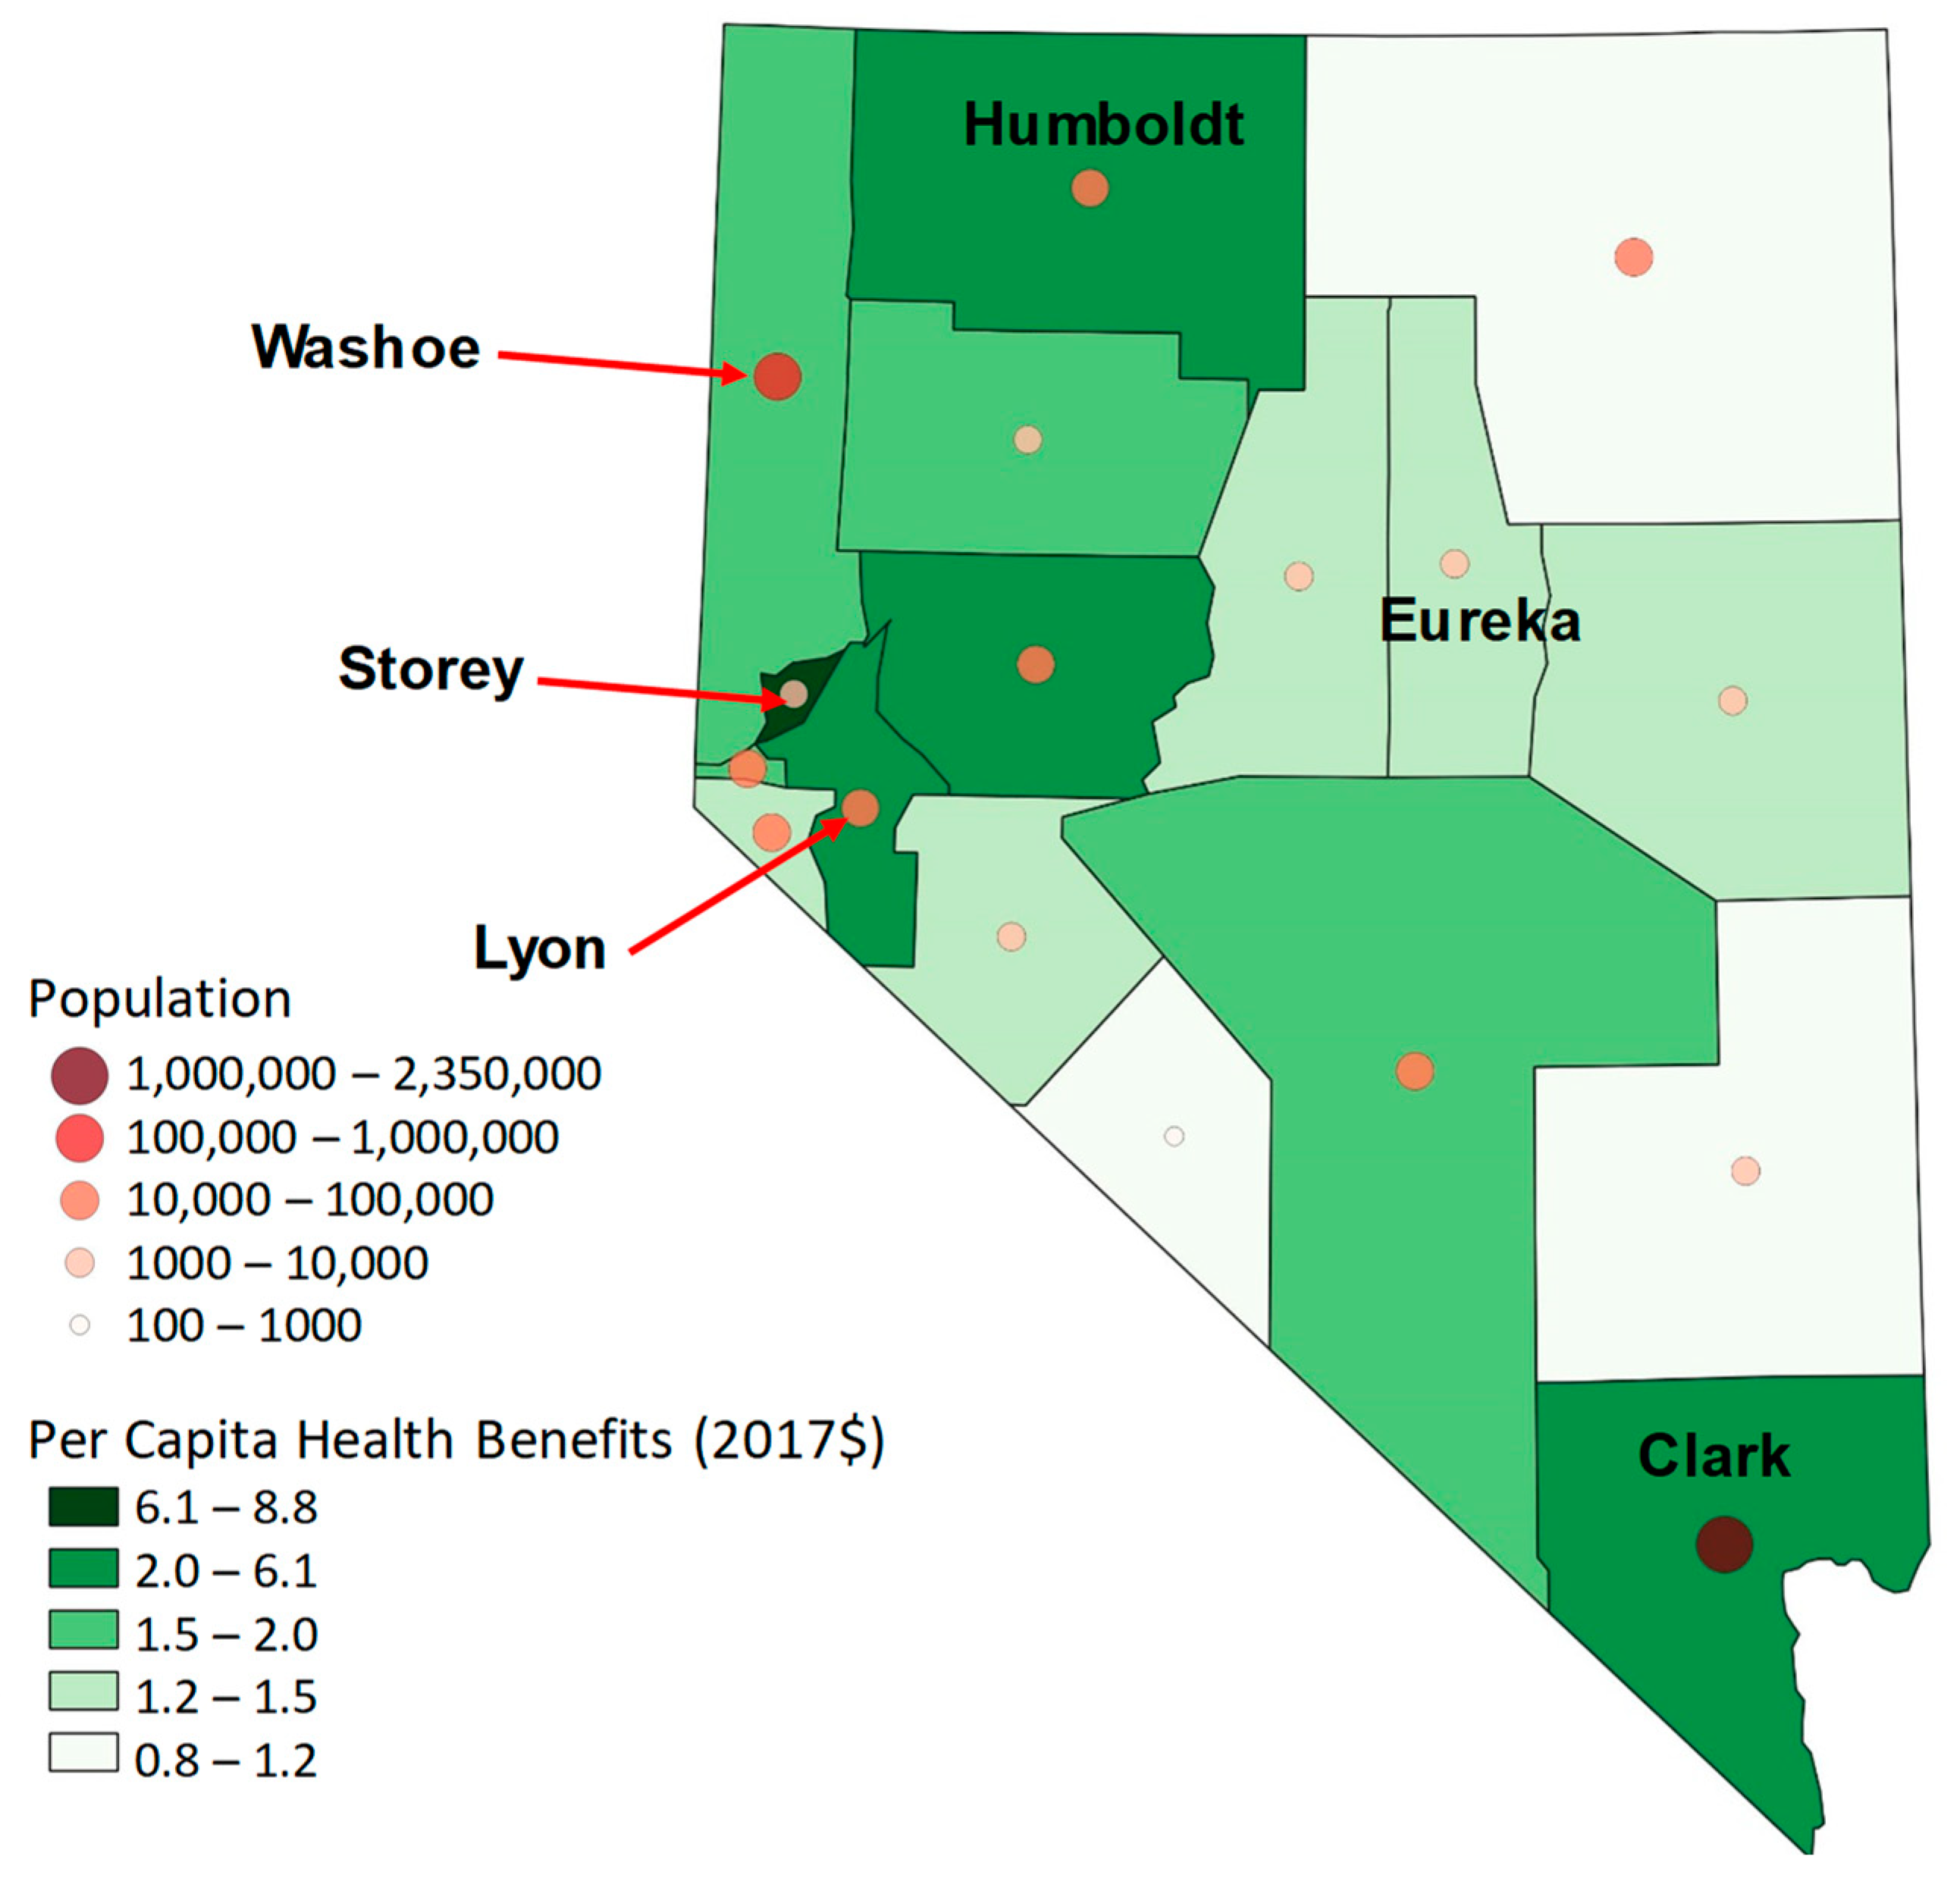
- Distribution of Benefits Among Nevada Counties
- Effect of Electricity Demand
- Limitations
4. Conclusions
Supplementary Materials
Author Contributions
Funding
Institutional Review Board Statement
Informed Consent Statement
Data Availability Statement
Acknowledgments
Conflicts of Interest
References
- Manisalidis, I.; Stavropoulou, E.; Stavropoulos, A.; Bezirtzoglou, E. Environmental and Health Impacts of Air Pollution: A Review. Front. Public Health 2020, 8, 14. [Google Scholar] [CrossRef] [PubMed]
- Rountree, V. Nevada’s experience with the Renewable Portfolio Standard. Energy Policy 2019, 129, 279–291. [Google Scholar] [CrossRef]
- Cleveland, M.; Shields, L. State Renewable Portfolio Standards and Goals. National Conference of State Legislatures. 2021. Available online: https://www.ncsl.org/research/energy/renewable-portfolio-standards.aspx (accessed on 15 August 2022).
- Mai, T.; Cole, W.; Gates, N.; Greer, D. The prospective impacts of 2019 state energy policies on the US electricity system. Energy Policy 2021, 149, 112013. [Google Scholar] [CrossRef]
- Nevada Senate Bill 358. 80th Nevada State Legislature. 2019. Available online: https://www.leg.state.nv.us/App/NELIS/REL/80th2019/Bill/6651/Text# (accessed on 15 August 2022).
- Chen, L.-W.A.; Lowenthal, D.H.; Watson, J.G.; Koracin, D.; Kumar, N.; Knipping, E.M.; Wheeler, N.; Craig, K.; Reid, S. Toward effective source apportionment using positive matrix factorization: Experiments with simulated PM2.5 data. J. Air Waste Manag. Assoc. 2010, 60, 43–54. [Google Scholar] [CrossRef] [PubMed]
- Feng, S.; Gao, D.; Liao, F.; Zhou, F.; Wang, X. The health effects of ambient PM2.5 and potential mechanisms. Ecotoxicol. Environ. Saf. 2016, 128, 67–74. [Google Scholar] [CrossRef] [PubMed]
- Frumkin, H. Environmental Health: From Global to Local, 3rd ed.; John Wiley Sons, Inc.: Hoboken, NJ, USA, 2016. [Google Scholar]
- World Health Organization. Ambient Air Pollution. 2018. Available online: https://www.who.int/teams/environment-climate-change-and-health/air-quality-and-health/ambient-air-pollution (accessed on 15 August 2022).
- World Health Organization. Health Effects of Particulate Matter: Policy Implications for Countries in Eastern Europe, Caucasus and Central Asia. 2013. Available online: https://apps.who.int/iris/handle/10665/344854 (accessed on 15 August 2022).
- Heeter, J.; Barbose, G.; Bird, L.; Weaver, S.; Flores-Espino, F.; Kuskova-Burns, K.; Wiser, R. Survey of State-Level Cost and Benefit Estimates of Renewable Portfolio Standards; National Renewable Energy Laboratory (NREL): Golden, CO, USA, 2014. [CrossRef]
- Mai, T.; Wiser, R.; Barbose, G.; Bird, L.; Heeter, J.; Keyser, D.; Millstein, D. A Prospective Analysis of the Costs, Benefits, and Impacts of U.S. Renewable Portfolio Standards; National Renewable Energy Laboratory (NREL): Golden, CO, USA, 2016. [CrossRef]
- Wiser, R.; Barbose, G.; Heeter, J.; Mai, T.; Bird, L.; Bolinger, M.; Millstein, D. A Retrospective Analysis of the Benefits and Impacts of U.S. Renewable Portfolio Standards; Lawrence Berkeley National Lab. (LBNL): Berkeley, CA, USA, 2016. [CrossRef]
- Millstein, D.; Wiser, R.; Bolinger, M.; Barbose, G. The climate and air-quality benefits of wind and solar power in the United States. Nat. Energy 2017, 2, 17134. [Google Scholar] [CrossRef]
- Abel, D.W.; Holloway, T.; Martínez-Santos, J.; Harkey, M.; Tao, M.; Kubes, C.; Hayes, S. Air quality-related health benefits of energy efficiency in the United States. Environ. Sci. Technol. 2019, 53, 3987–3998. [Google Scholar] [CrossRef] [PubMed]
- Fisher, J.; Knight, P.; Horowitz, A.; Odom, C.; Allison, A.; Biewald, B. AVoided Emissions and geneRation Tool (AVERT) User Manual Version 3.2. Available online: https://www.epa.gov/avert/avert-user-manual (accessed on 15 August 2022).
- Clappier, A.; Pisoni, E.; Thunis, P. A new approach to design source–receptor relationships for air quality modelling. Environ. Model. Softw. 2015, 74, 66–74. [Google Scholar] [CrossRef]
- U.S. Environmental Protection Agency. User’s Manual for the Co-Benefits Risk Assessment Health. 2021. Available online: https://www.epa.gov/system/files/documents/2021-11/cobra-user-manual-nov-2021_4.1_0.pdf (accessed on 15 August 2022).
- Hou, L.; Zhang, K.; Luthin, M.A.; Baccarelli, A.A. Public Health Impact and Economic Costs of Volkswagen’s Lack of Compliance with the United States’ Emission Standards. Int. J. Environ. Res. Public Health 2016, 13, 891. [Google Scholar] [CrossRef] [PubMed]
- Thomson, V.E.; Huelsman, K.; Ong, D. Coal-fired power plant regulatory rollback in the United States: Implications for local and Regional Public Health. Energy Policy 2018, 123, 558–568. [Google Scholar] [CrossRef]
- Olawepo, J.; Chen, L.-W. Health benefits from upgrading public buses for Cleaner Air: A case study of Clark County, Nevada and the United States. Int. J. Environ. Res. Public Health 2019, 16, 720. [Google Scholar] [CrossRef] [PubMed]
- U.S. Energy Information Administration (U.S. EIA). Annual Energy Outlook 2021. Available online: https://www.eia.gov/outlooks/aeo/electricity/sub-topic-01.php (accessed on 15 August 2022).
- Northwest Power and Conservation Council (NWPCC). Seventh Power Plan. Available online: https://www.nwcouncil.org/sites/default/files/7thplanfinal_chap07_demandforecast.pdf (accessed on 15 August 2022).
- U.S. Securities and Exchange Commission (U.S. SEC). 2020. Available online: https://www.sec.gov/Archives/edgar/data/71180/000108131620000003/bhe123119form10-k.htm (accessed on 15 August 2022).
- State of Nevada Governor’s Office of Energy. 2020 Status of Energy Report. Available online: https://energy.nv.gov/uploadedFiles/energynvgov/content/Media/2020%20Status%20of%20Energy%20Report.pdf (accessed on 15 August 2022).
- Sullivan, D.D. 50% Renewables in NV Will Boost Investment, Cut Pollution. 2018. Available online: https://www.nrdc.org/experts/dylan-sullivan/50-renewables-nv-will-boost-investment-cut-pollution (accessed on 15 August 2022).
- Inflation Reduction Act. H.R. 5376, 117th Congress. Available online: https://www.democrats.senate.gov/imo/media/doc/inflation_reduction_act_one_page_summary.pdf (accessed on 15 August 2022).
- Jaffe, D.A.; O’Neill, S.M.; Larkin, N.K.; Holder, A.L.; Peterson, D.L.; Halofsky, J.E.; Rappold, A.G. Wildfire and prescribed burning impacts on air quality in the United States. J. Air Waste Manag. Assoc. 2020, 70, 583–615. [Google Scholar] [CrossRef] [PubMed]


| AVERT Scenario | Low Economic Growth/Low Demand | High Economic Growth/High Demand |
|---|---|---|
| E2030/E2019 | 1.047 | 1.104 |
| FN2019 | 0.18 | 0.18 |
| FN2030 | 0.50 | 0.50 |
| FFDR% | 36.2% | 32.7% |
| EDR% | 29.7% | 26.8% |
| State | CO2 (tons) | NOx (lbs) | SO2 (lbs) | PM2.5 (lbs) | VOCs (lbs) | NH3 (lbs) |
|---|---|---|---|---|---|---|
| Idaho | ||||||
| Low demand | −198,030 | −128,660 | −1590 | −12,370 | −3740 | −18,120 |
| High demand | −179,590 | −117,350 | −1440 | −11,170 | −3370 | −16,480 |
| Montana | ||||||
| Low demand | −536,670 | −1,177,910 | −900,990 | −100,500 | −21,480 | −1100 |
| High demand | −482,140 | −1,057,280 | −809,500 | −90,460 | −19,330 | −1000 |
| Nevada | ||||||
| Low demand | −755,710 | −614,010 | −591,890 | −89,870 | −49,390 | −49,960 |
| High demand | −688,170 | −560,300 | −539,380 | −81,890 | −45,090 | −42,850 |
| Oregon | ||||||
| Low demand | −633,880 | −726,560 | −933,240 | −115,350 | −20,960 | −31,530 |
| High demand | −569,860 | −653,830 | −839,870 | −103,790 | −18,870 | −28,350 |
| Utah | ||||||
| Low demand | −929,380 | −1,753,900 | −649,360 | −69,050 | −25,660 | −17,630 |
| High demand | −838,320 | −1,580,030 | −584,310 | −62,350 | −23,190 | −16,020 |
| Washington | ||||||
| Low demand | −1,001,140 | −1,144,610 | −308, 790 | −104,090 | −73,090 | −20,370 |
| High demand | −903,120 | −1,030,550 | −277,740 | −93,880 | −65,810 | −18,440 |
| Wyoming | ||||||
| Low demand | −687,890 | −1,184,920 | −1,027,900 | −53,630 | −21,260 | −320 |
| High demand | −621,290 | −1,071,760 | −927,810 | −48,420 | −19,200 | −290 |
| County | CO2 (tons) | NOx (lbs) | SO2 (lbs) | PM2.5 (lbs) | VOCs (lbs) | NH3 (lbs) |
|---|---|---|---|---|---|---|
| Clark | ||||||
| Low demand | −454,009 | −83,846 | −3094 | −63,298 | −23,920 | −34,846 |
| High demand | −413,433 | −76,954 | −2820 | −57,714 | −21,840 | −31,804 |
| Eureka | ||||||
| Low demand | −43,500 | −20,346 | −16,116 | −3476 | −296 | −532 |
| High demand | −39,612 | −18,322 | −14,866 | −3134 | −268 | −480 |
| Humboldt | ||||||
| Low demand | −124,662 | −388,308 | −571,872 | −7806 | 0 | −1526 |
| High demand | −113,521 | −354,090 | −520,960 | −7102 | 0 | −1388 |
| Lyon | ||||||
| Low demand | −30,253 | −55,892 | −438 | −3652 | −16,680 | −1564 |
| High demand | −27,549 | −50,954 | −398 | −3332 | −15,216 | −1428 |
| Storey | ||||||
| Low demand | −103,286 | −65,622 | −374 | −11,634 | −8504 | −8496 |
| High demand | −94,056 | −59,984 | −342 | −10,608 | −7762 | −7750 |
Publisher’s Note: MDPI stays neutral with regard to jurisdictional claims in published maps and institutional affiliations. |
© 2022 by the authors. Licensee MDPI, Basel, Switzerland. This article is an open access article distributed under the terms and conditions of the Creative Commons Attribution (CC BY) license (https://creativecommons.org/licenses/by/4.0/).
Share and Cite
Rezaee, A.; Chen, L.-W.A.; Lin, G.; Buttner, M.P.; Gakh, M.; Bloomfield, E.F. Air Quality Health Benefits of the Nevada Renewable Portfolio Standard. Atmosphere 2022, 13, 1387. https://doi.org/10.3390/atmos13091387
Rezaee A, Chen L-WA, Lin G, Buttner MP, Gakh M, Bloomfield EF. Air Quality Health Benefits of the Nevada Renewable Portfolio Standard. Atmosphere. 2022; 13(9):1387. https://doi.org/10.3390/atmos13091387
Chicago/Turabian StyleRezaee, Alireza, Lung-Wen Antony Chen, Ge Lin, Mark P. Buttner, Maxim Gakh, and Emma Frances Bloomfield. 2022. "Air Quality Health Benefits of the Nevada Renewable Portfolio Standard" Atmosphere 13, no. 9: 1387. https://doi.org/10.3390/atmos13091387
APA StyleRezaee, A., Chen, L.-W. A., Lin, G., Buttner, M. P., Gakh, M., & Bloomfield, E. F. (2022). Air Quality Health Benefits of the Nevada Renewable Portfolio Standard. Atmosphere, 13(9), 1387. https://doi.org/10.3390/atmos13091387