Article

Summer Precipitation Extremes over the Yellow River Loop Valley and Its link to European Blocking

1
Key Laboratory of Physical Oceanography, College of Oceanic and Atmospheric Science, Ocean University of China, Qingdao 266100, China
2
School of Basic Sciences for Aviation, Naval Aviation University, Yantai 264000, China
3
91954 PLA, Yongzhou 425000, China
*
Author to whom correspondence should be addressed.
Atmosphere 2022, 13(7), 1140; https://doi.org/10.3390/atmos13071140
Submission received: 18 May 2022 / Revised: 9 July 2022 / Accepted: 11 July 2022 / Published: 18 July 2022
(This article belongs to the Special Issue Atmospheric Blocking and Weather Extremes)

Abstract

:
Characteristics of extreme precipitation over Yellow River Loop Valley (YRLV) and links to European blocking are investigated in this study. Spatial and temporal analysis of extreme precipitation shows that it contributes more than 30% of the total summer precipitation in the YRLV and is characterized by a strong and short period of local rainfall. Most of the extreme rains in the YRLV occur in July and August. Two typical circulation patterns were identified using a k-means clustering method. The extreme precipitation results from the combined actions of intensified high pressure over northeast China (NECH) and the westward extension of the western Pacific subtropical high (WPSH). The intensified southerly flow of the amplified NECH strengthens the water vapor transport induced by the westward extension of the WPSH from the northwest Pacific or Bay of Bengal into the YRLV. The NECH is amplified by the wave energy propagating from European blocking via the Silk Road pattern (SRP). This is the subseasonal cause of extreme precipitation over the YRLV. The composited July and August mean 500 hPa geopotential anomaly pattern for extreme precipitation years shows a high-pressure anomaly over the European continent and a negative phase of the SRP. The former provides a background for the occurrence of European blocking, and the latter explains the preexistence of the NECH and provides a linkage between the activity of European blocking and the subseasonal evolution of the NECH. Thus, the interannual variation in the extreme precipitation over the YRLV is mainly reflected by the phase of the SRP and the stationary waves over Europe.

1. Introduction

The Yellow River Loop Valley (YRLV), a semiarid region, is located in the middle and upper Yellow River reaches in northwest China. Summer precipitation accounts for more than fifty percent of the total annual precipitation in this region [1], which decreases from southwest to northeast of the YRLV and typically consists of intense but brief downpours [2]. It peaks in August with an average monthly precipitation of 80 mm, accounting for 22 percent of the annual precipitation [3]. China’s principal summer precipitation regions are over the Yangtze River basin and the South China region [4]. YRLV extreme precipitation is comparable to that of the Yangtze River basin and South China region [5].
Several studies have examined the precipitation in Yellow River Basin, which includes the YRLV. The number of extreme days in the Yellow River Basin is decreasing, with the exception of YRLV after 2003 [6]. This suggests that the mechanism for extreme precipitation in YRLV may differ from other regions. Extreme precipitation has led to an increase in drought occurrences in this region [7]. In the past 60 years, annual precipitation in the YRLV has increased at a rate of mm·(10a)−1 [8]. Additionally, the ratio of extreme precipitation to total annual precipitation increases significantly in the Yellow River Basin [9]. Thus, extreme summer precipitation, particularly in July and August, plays a significant role in the total precipitation for this semiarid region.
Previous research has shown that the position and strength of the Western Pacific Subtropical High (WPSH, henceforth) have a significant impact on the summer precipitation over China [10,11]. The northward and westerly displacement of the WPSH increases precipitation in the Yellow River Basin [12,13]. Water vapor is transported from the Bay of Bengal to the middle and lower Yellow River reaches in flood years in the Yellow River Basin when the intensified WPSH shifts north and develops into an isolated high-pressure over the west of Japan [14]. Several analyses of the heavy rainfall over YRLV support this viewpoint [15,16]. Previous studies [12,17,18] discussed the statistical correlation between Yellow River Basin precipitation and WPSH, as well as the pattern of water vapor transport and local circulation distribution during Yellow River Basin precipitation. In the preceding study, the causes of extreme precipitation in the YRLV were investigated.
Previous research has indicated that the WPSH plays a significant role in precipitation over the Yellow River Basin and that the isolated high pressure over the Sea of Japan has a significant impact on precipitation. This isolated high pressure over the Sea of Japan resembles the Bonin high discussed by Enomoto et al. [19], which is a stationary barotropic ridge that develops after Meiyu in late summer. It is believed that the Bonin high is formed by the propagation of the Silk Road pattern (SRP) along the Asian jet in the upper troposphere [19,20]. The SRP is a stationary wave train over Asia in the middle of summer, with three action centers located in Middle Asia (50°–85° E, 30°–50° N), Mongolia (85°–110° E, 30°–50° N), and East Asia (110°–145° E, 30°–50° N) [19,20,21,22,23,24,25]. According to a number of studies, the SRP has a significant impact on the climate across a vast region, including the Indian subcontinent, Europe, northern China, and Japan [20,21,22,23,24]. The Yellow River is located beneath the SRP’s path. In addition, the SRP is a wave pathway for the eastward propagation of Rossby waves [19] and displays substantial intraseasonal phase and intensity variations. There is an association between the SRP, which is a type of atmospheric internal variability, and upstream blocking activity [25]. Due to this, not only the WPSH, but also the SRP and upstream blocking influence the occurrence of extreme precipitation in the YRLV.
In this study, the effect of the WPSH on extreme precipitation over the YRLV was examined. We investigate the relationship between upstream blocking, the SRP, and extreme precipitation over the YRLV, as well as the intraseasonal influence of atmospheric circulations upstream on the occurrence of extreme precipitation. It may contribute to the improvement of intraseasonal forecasts of extreme summer precipitation over the YRLV.
The paper is organized as follows: in Section 2, data and methods are described. The characteristics of extreme precipitation events over the YRLV are discussed in Section 3.1. In Section 3, circulation patterns associated with extreme precipitation events over the YRLV are described, along with their daily variability. In Section 3.3, the relationship between extreme precipitation over the YRLV and upstream blocking activity is discussed. A summary and discussion are provided in Section 4. Section 5 concludes with the conclusion.

2. Data and Methods

2.1. Study Area and Data

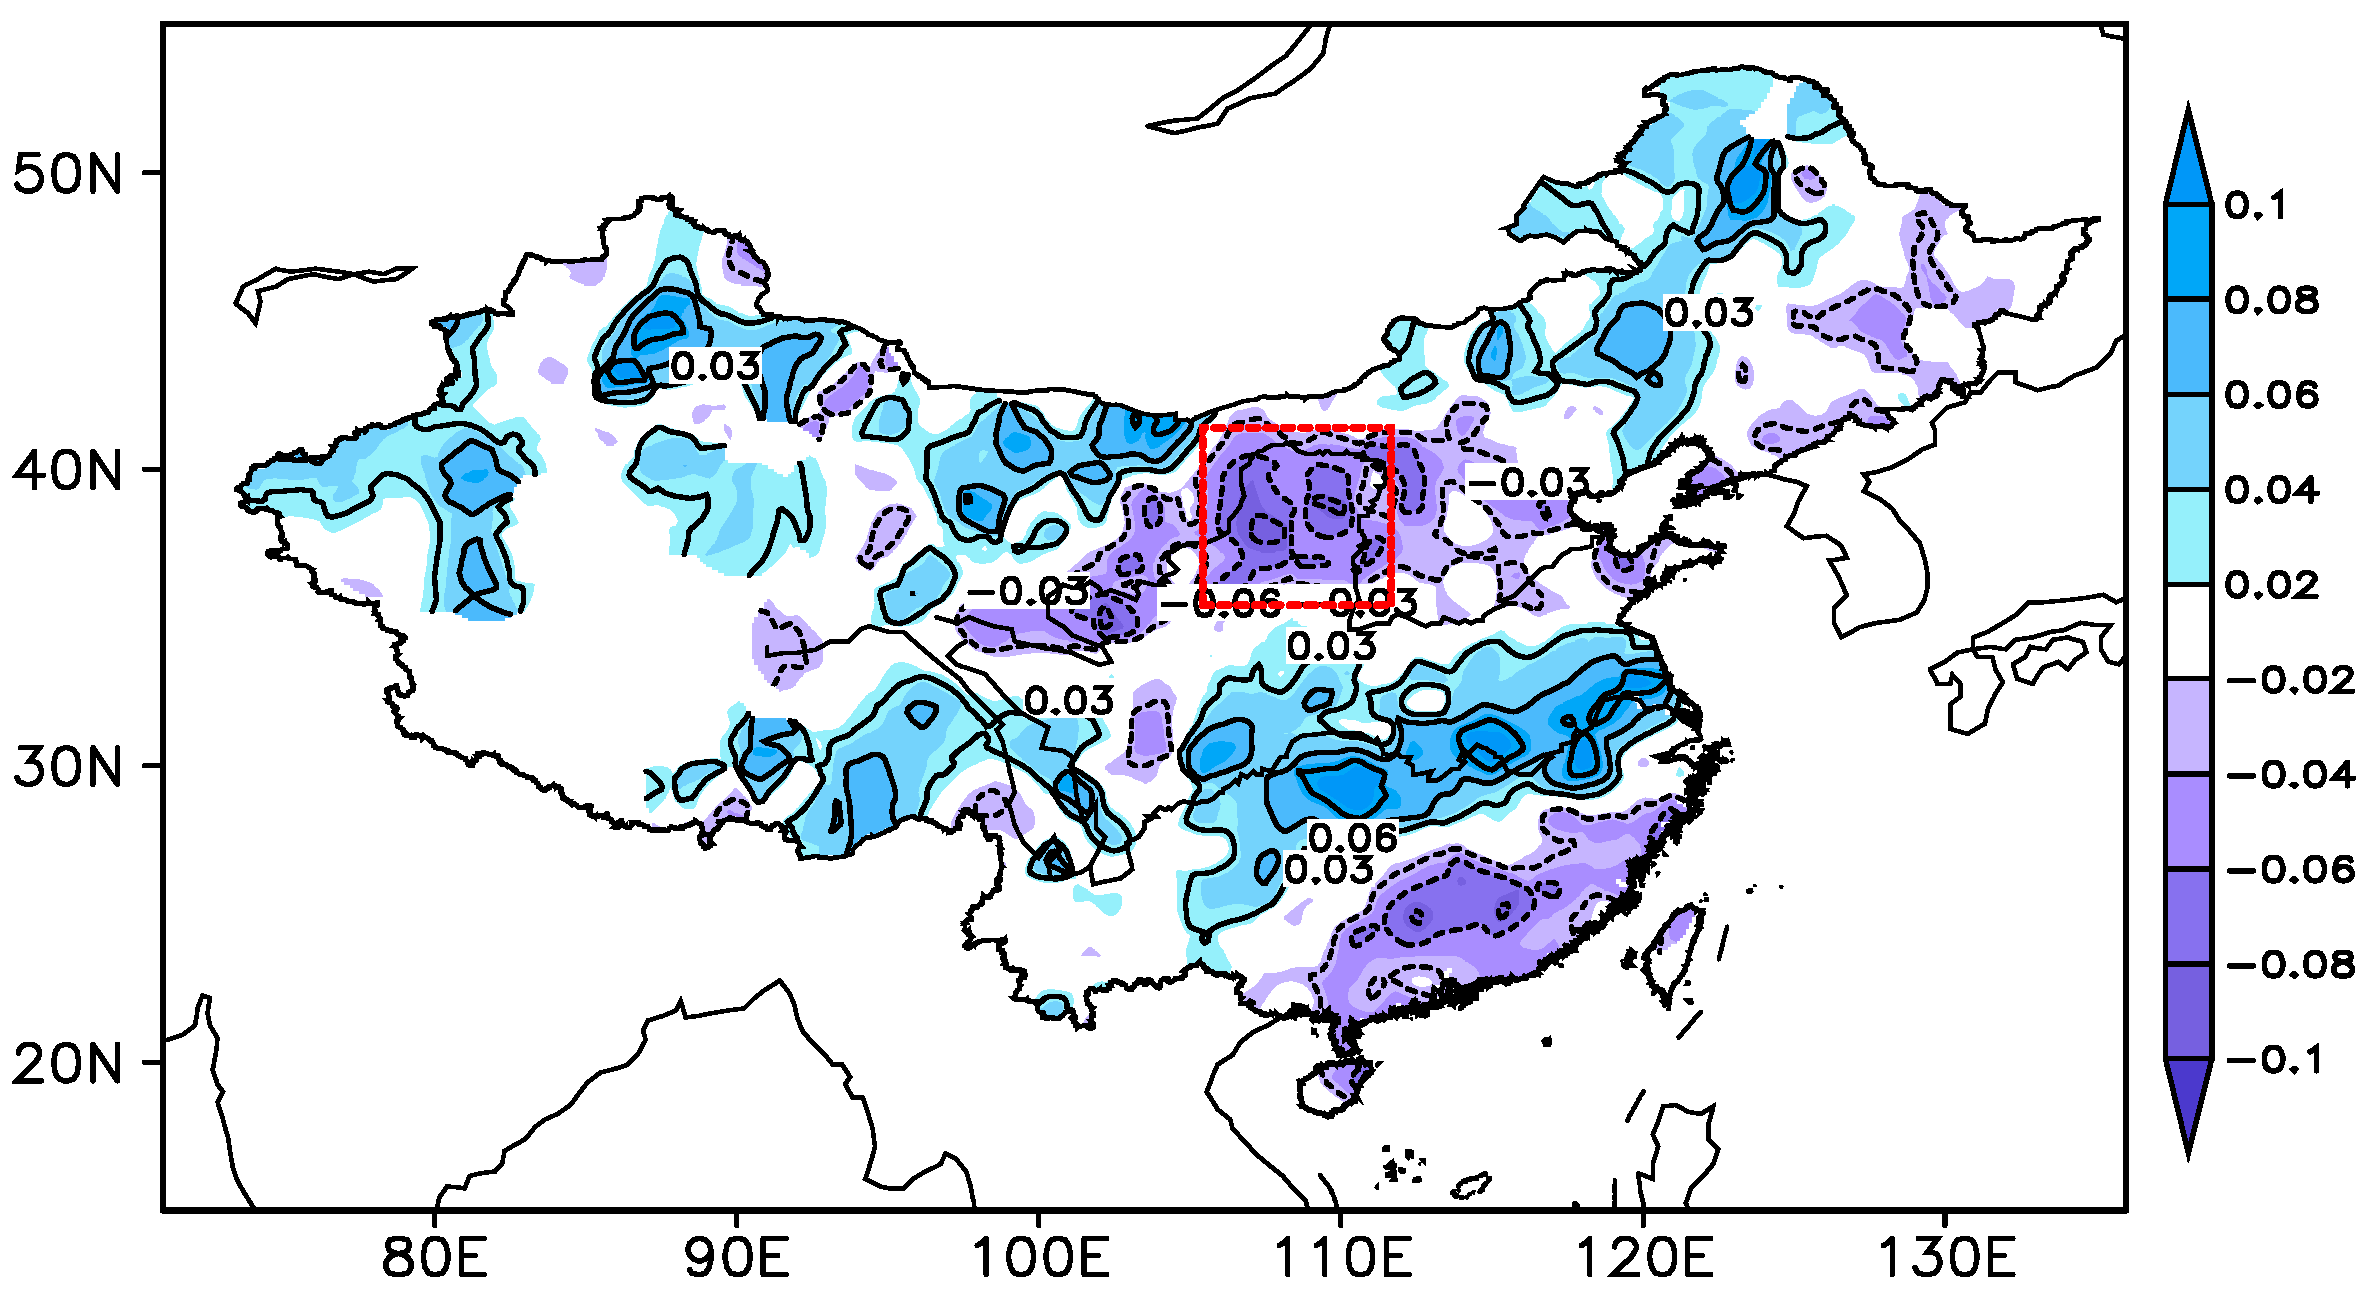
Daily precipitation data at 740 stations in mainland China for the period of 1960–2009 were used in this study; the data were developed at the Climate Data Center (CDC) of the National Meteorological Center of the China Meteorological Administration. A total of 573 stations were selected from the 740 stations by considering the persistency of the precipitation data at each station. The Yellow River Loop Valley Daily here is defined as the rectangle region from (34° N, 104° E) to (41° N, 112° E) (red rectangle in), which includes 40 out of 573 stations. Daily data for geopotential height, velocity, and specific humidity were taken from the National Center for Environmental Prediction/National Center for Atmospheric Research (NCEP/NCAR) reanalysis data [26]. Data are on the 2.5° longitude × 2.5° latitude grid and daily timescale.

2.2. Definition of Extreme Precipitation Days

The extreme precipitation threshold was calculated as the top 5th percentile of the descending sorted daily precipitation based on 50 years of summer months (from July to August). This calculation was based on the percentile-based index [27] developed by the Expert Team on Climate Change Detection, Monitoring and Indices (ETCCDMI). Extreme precipitation days for a station were defined as days in which the daily precipitation exceeded the threshold of this station. The features of extreme precipitation days in YRLV were analyzed by Empirical Orthogonal Functions (EOF) [28] statistical methods. The regional extreme precipitation events were defined according to the leading EOF mode of the YRLV precipitation extremes according to the station precipitation data, which is discussed in Section 3.1.2.

2.3. Method

A two-dimensional blocking index of Diao et al. [29] was used to identify blocking events. A k-means algorithm [30] was used to identify the 500 hPa height circulation regimes associated with regional extreme and normal precipitation events. K-means is a clustering algorithm. Its objective is to minimize the average squared Euclidean distance of documents from their cluster centers where a cluster center is defined as the mean or centroid μ of the documents in a cluster ω .
μ ( ω ) = 1 | ω | x ω x
In this study, x represents the 500 hPa geopotential height circulation field. There is the smallest average distance in n-dimensional vector space in one cluster, which means these events are similar. The wave-activity flux, defined by Takaya and Nakamura [31], was used to evaluate the Rossby wave. Composite maps were used to show the daily evolution of the circulation patterns related to the extreme regional precipitation events. The characteristics of the blocking activities and the background circulation in the extreme precipitation years were also investigated using composite maps. The composite results are described in Section 3.2 and Section 3.3, respectively.
The use of the above methods in the research process is as follows (Figure 1):

3. Results

3.1. Climatology of Extreme Precipitation over the Yellow River Loop Valley

3.1.1. Linkage to the Extreme Precipitation over China

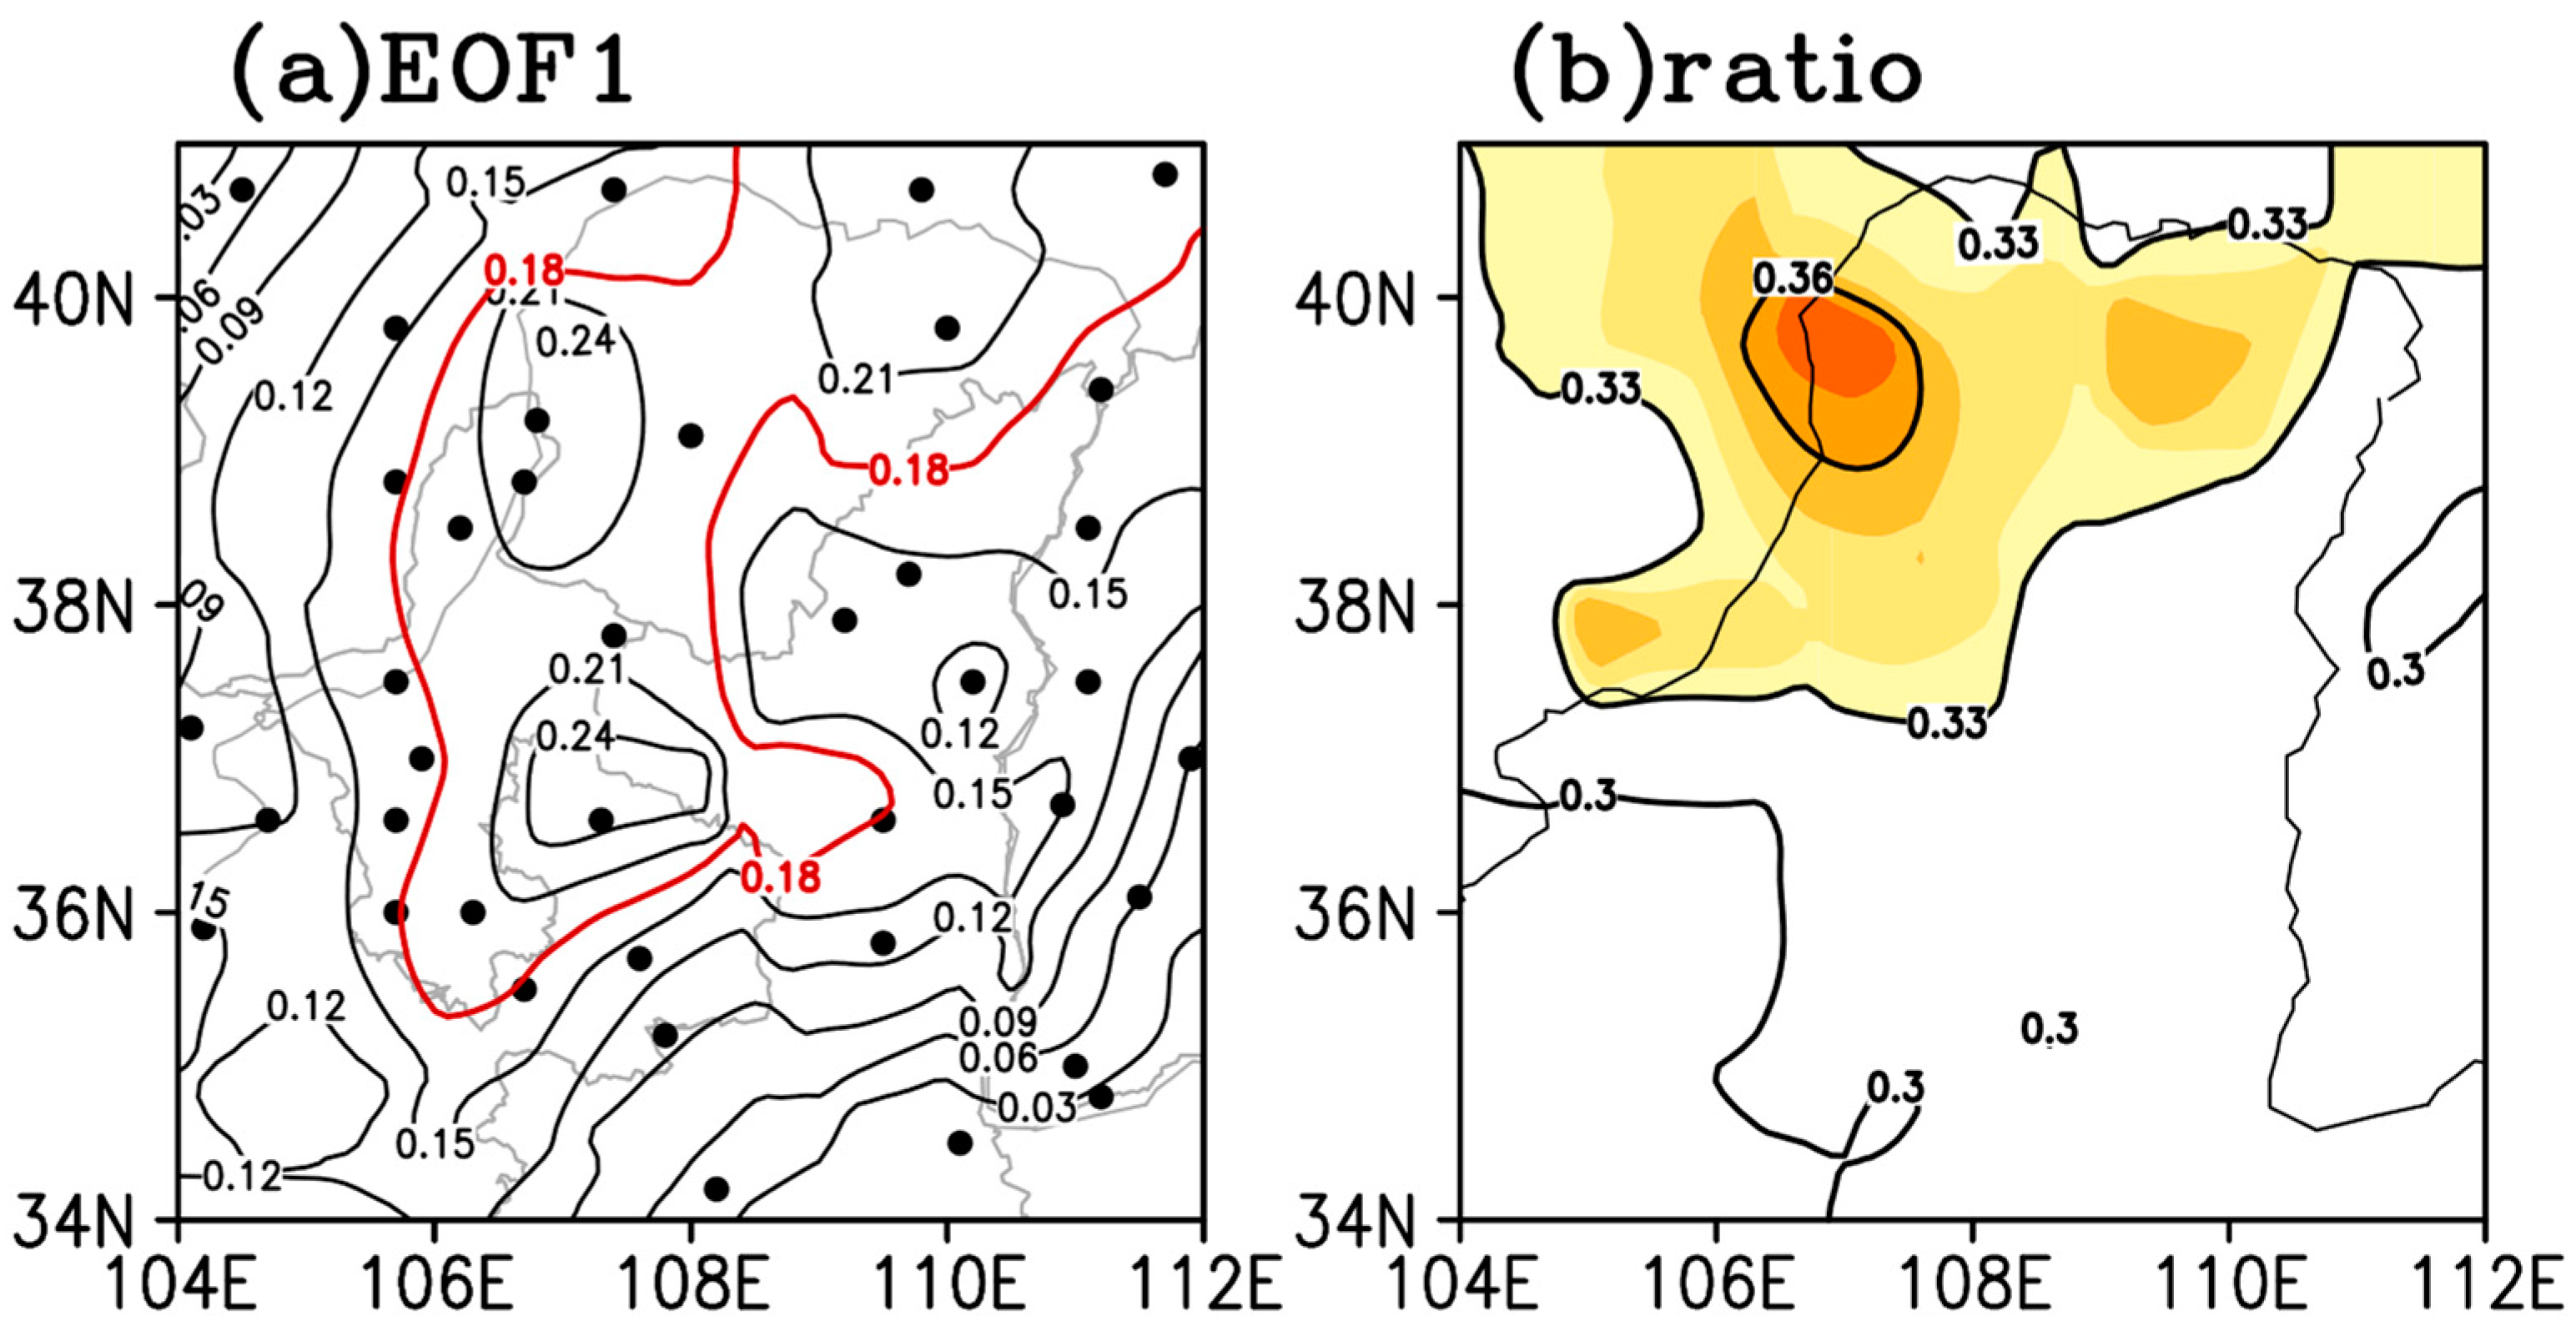
The number of extreme precipitation days in summer at each station was calculated for the 1960–2009 period, according to the extreme precipitation definition described in Section 2. The EOF of the interannual variations of the summer extreme precipitation days at each station were calculated to show the major spatial correlations of local variations of the summer extreme precipitation over mainland China. The first EOF shows that summer extreme precipitation over China exhibits a meridional tripole mode with one action center over the YRLV. The interannual variations in summer extreme precipitation over the YRLV and Southeast China have the same sign but are opposite to those over the Yangzi River basin (Figure 2). This result is very similar to the result of Wang et al. [14], who used a fixed daily precipitation value as a threshold. Because the summer extreme precipitation over the YRLV is correlated with the rainfall over other regions of China (Figure 2), the extreme precipitation over the YRLV may be influenced by changes in large-scale atmospheric circulation patterns. Figure 3b shows that the contributions of summer extreme precipitation to the total summer rainfall exceed 30% over the YRLV, and this percent contribution is even larger over the northwest of the YRLV. This result indicates that extreme precipitation plays an important role in the total rainfall in this semiarid region.

3.1.2. Characteristics of Summer Extreme Precipitation over the YRLV

To examine the characteristics of extreme precipitation over the YRLV, 40 local stations were used for further analysis (Figure 3a). EOF was performed for the number of extreme precipitation days per year at these 40 stations. The leading EOF mode of local extreme precipitation over the YRLV shows a homogenous pattern; the main loading is over the northwest part of the YRLV (Figure 3a); notably, extreme precipitation occupies a larger portion of the total summer rainfall over the northwest part of the YRLV than over the southeast part of the YRLV (Figure 3b). The leading EOF mode is shown in Figure 3a and the time series (PC1) in Figure 4a. The homogenous pattern of the leading EOF indicates that the extreme precipitation over the YRLV presents regional consistency, especially over the northwest part of the YRLV, where the EOF value is larger than that of the surrounding areas.
The large-EOF-value region (indicated by the thick red line in Figure 3a) was defined as the key region for the summer extreme precipitation over the YRLV in this study. Regional extreme precipitation (REP) days were defined as days in which at least three stations inside the key region simultaneously reached the extreme precipitation threshold and there were at least 10 stations inside the key region with a daily precipitation value greater than 1 mm. An REP event was defined as successive precipitation days in which there was at least one REP Day. Moreover, any two extreme precipitation events had to have a time interval of more than 3 days; otherwise, they were considered one event.
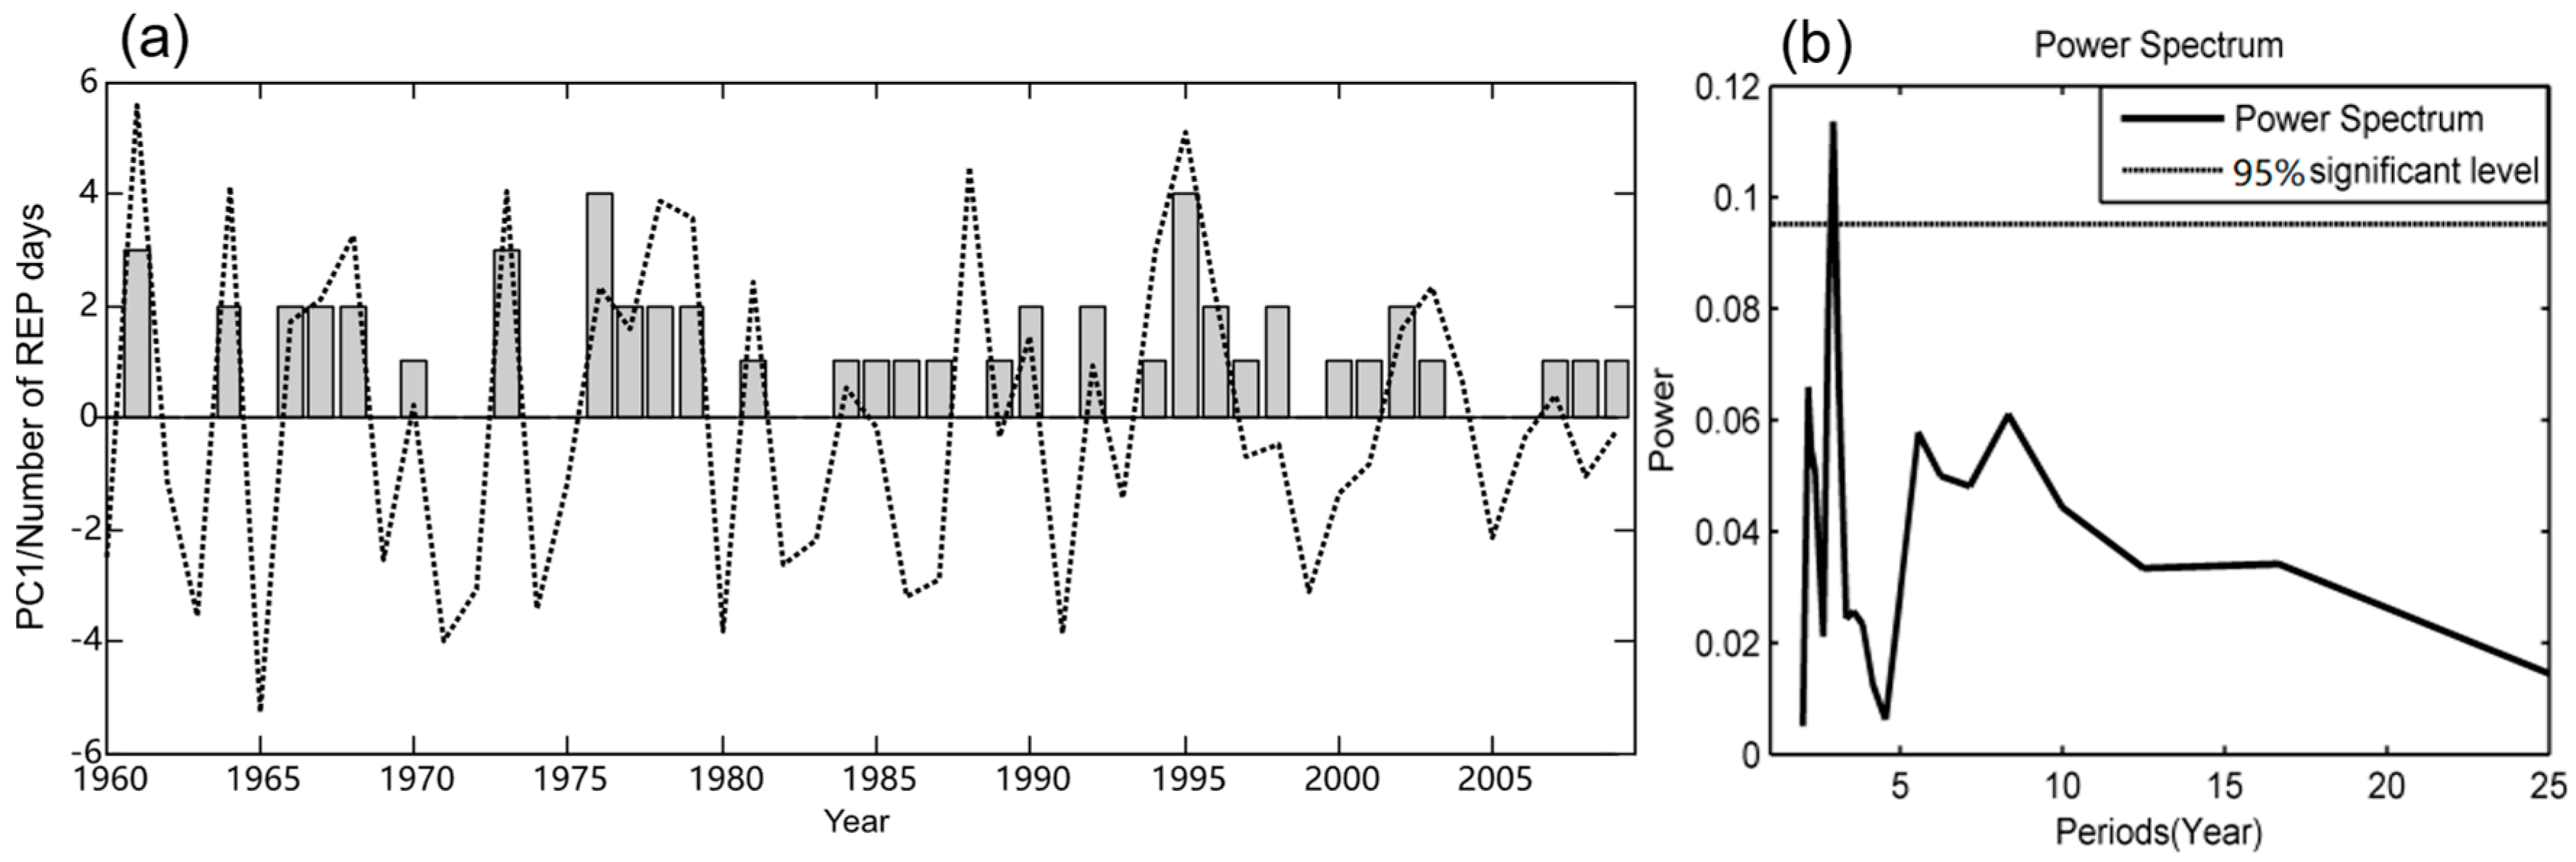
Figure 4 shows the PC1 of REP days and the power spectrum of it. Both the PC1 and interannual variation in the REP days show no significant trend. The main timescale of the interannual variability is approximately 3 years. The interannual variation of the summer REP days is significantly similar to that of the leading EOF (PC1) for station-based extreme precipitation frequency. This result confirms that the leading EOF pattern reflects most of the variation in the extreme precipitation over the YRLV.
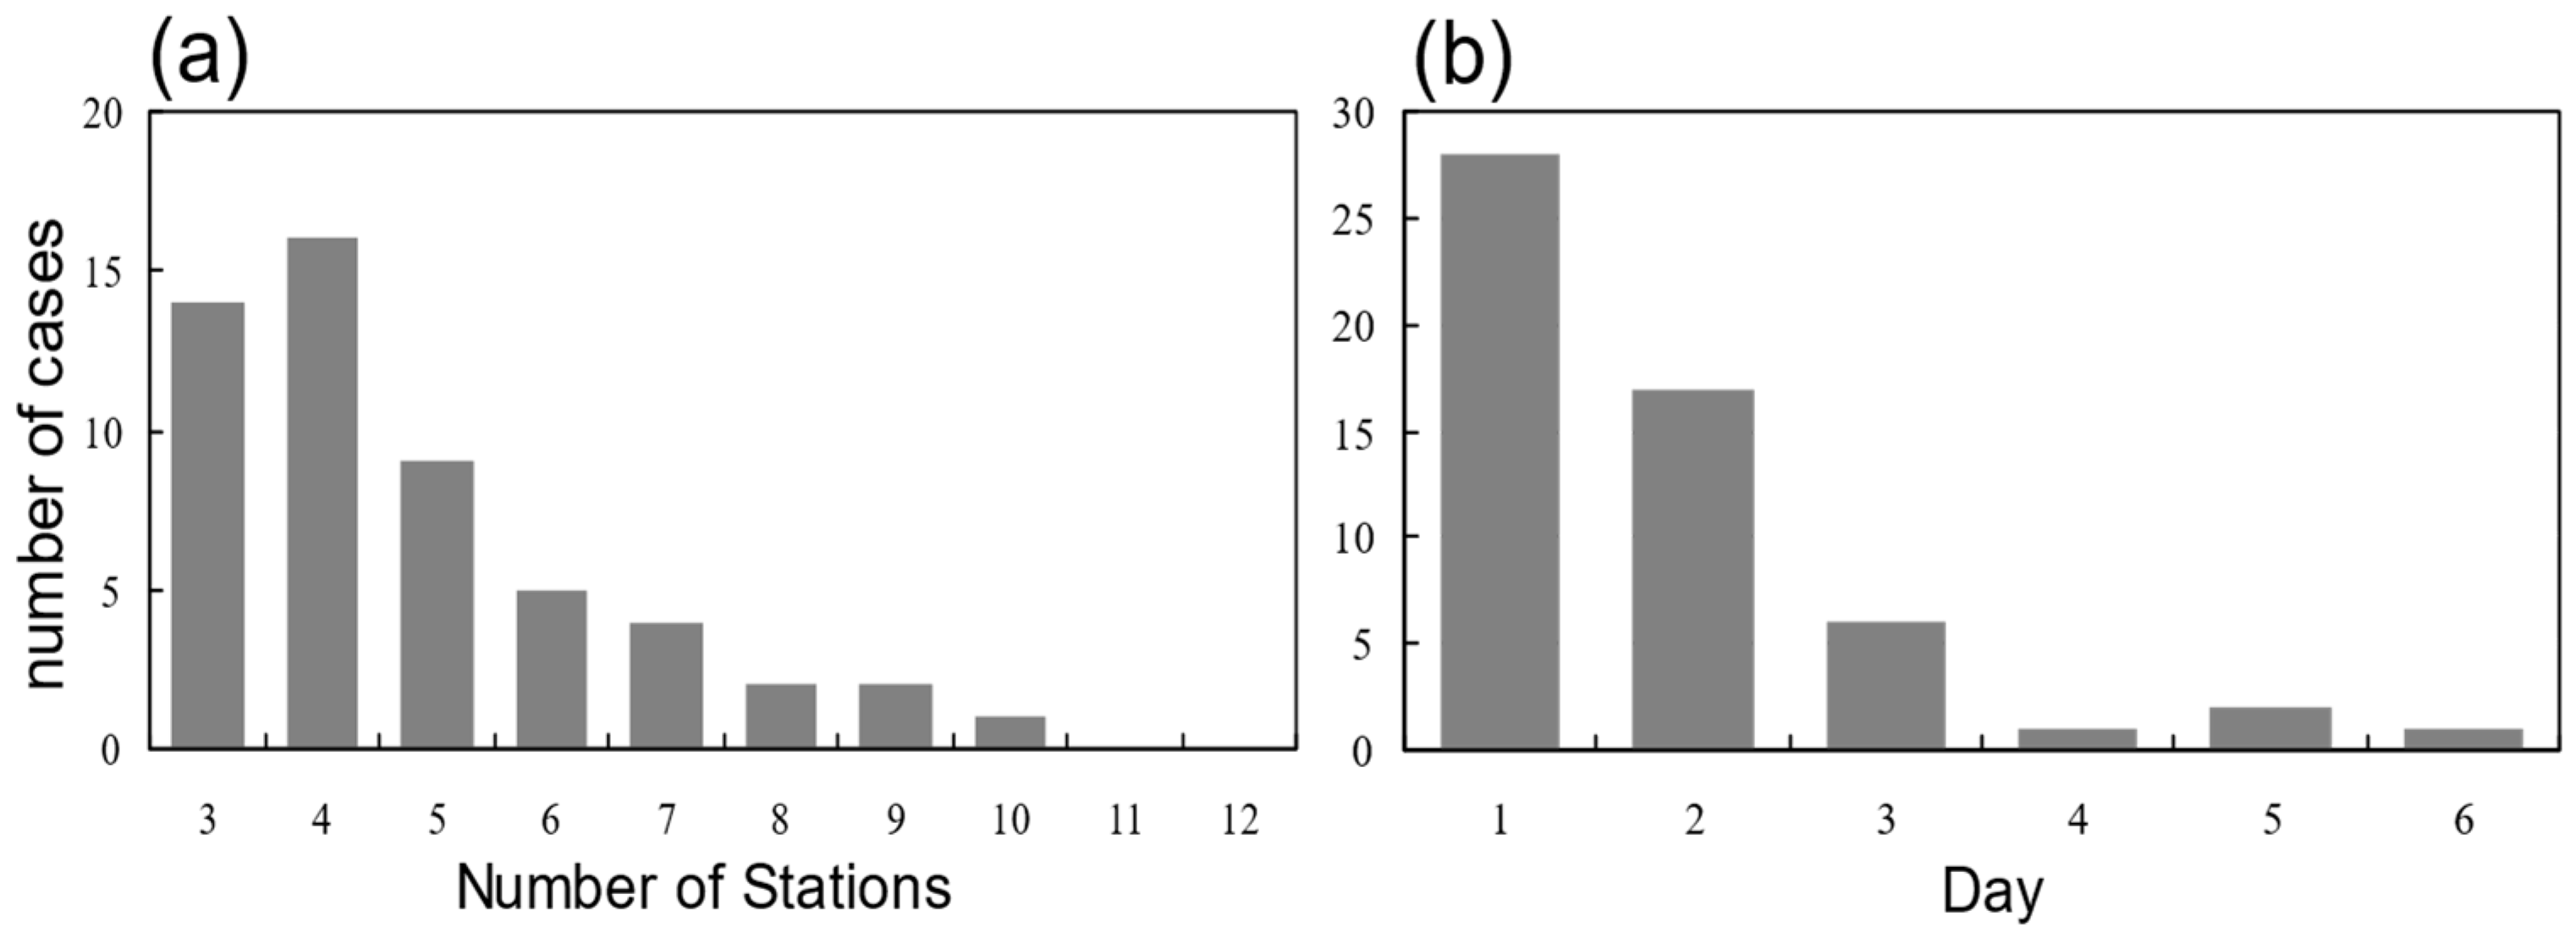
According to the criterion defined above, 53 REP events were found in the summers (JJA) from 1960 to 2009. It was found that these REP events exhibit some similar characteristics. The probability distribution (PDF) of the spatial extent (indicated by the number of extreme precipitation stations) of all REP days (regional extreme precipitation days in these 53 REP events) is shown in Figure 5a. The result indicates that, for a major portion of the REP days, the REP occurs simultaneously at 3–5 stations. Only in a few of the REP days does extreme precipitation simultaneously occur within the regions that cover 6–10 stations, which means that the REP events mainly occur in a narrow region. The PDF–REP event durations show the number of REP events versus their duration in days (Figure 5b) and indicates that the REP events are short-period events that mostly last 1–2 days; only a small fraction of the REP events persist for 3–6 days. The monthly mean numbers of REP days in each summer from 1960 to 2009 indicate that summer extreme precipitation in the YRLV occurs mainly in July and August (mid-to-late summer); in these months, extreme precipitation days occupy 39% and 49% of all days, respectively.

3.2. Associated Atmospheric Circulations

3.2.1. Anomalous Circulation Patterns Corresponding to REP Events

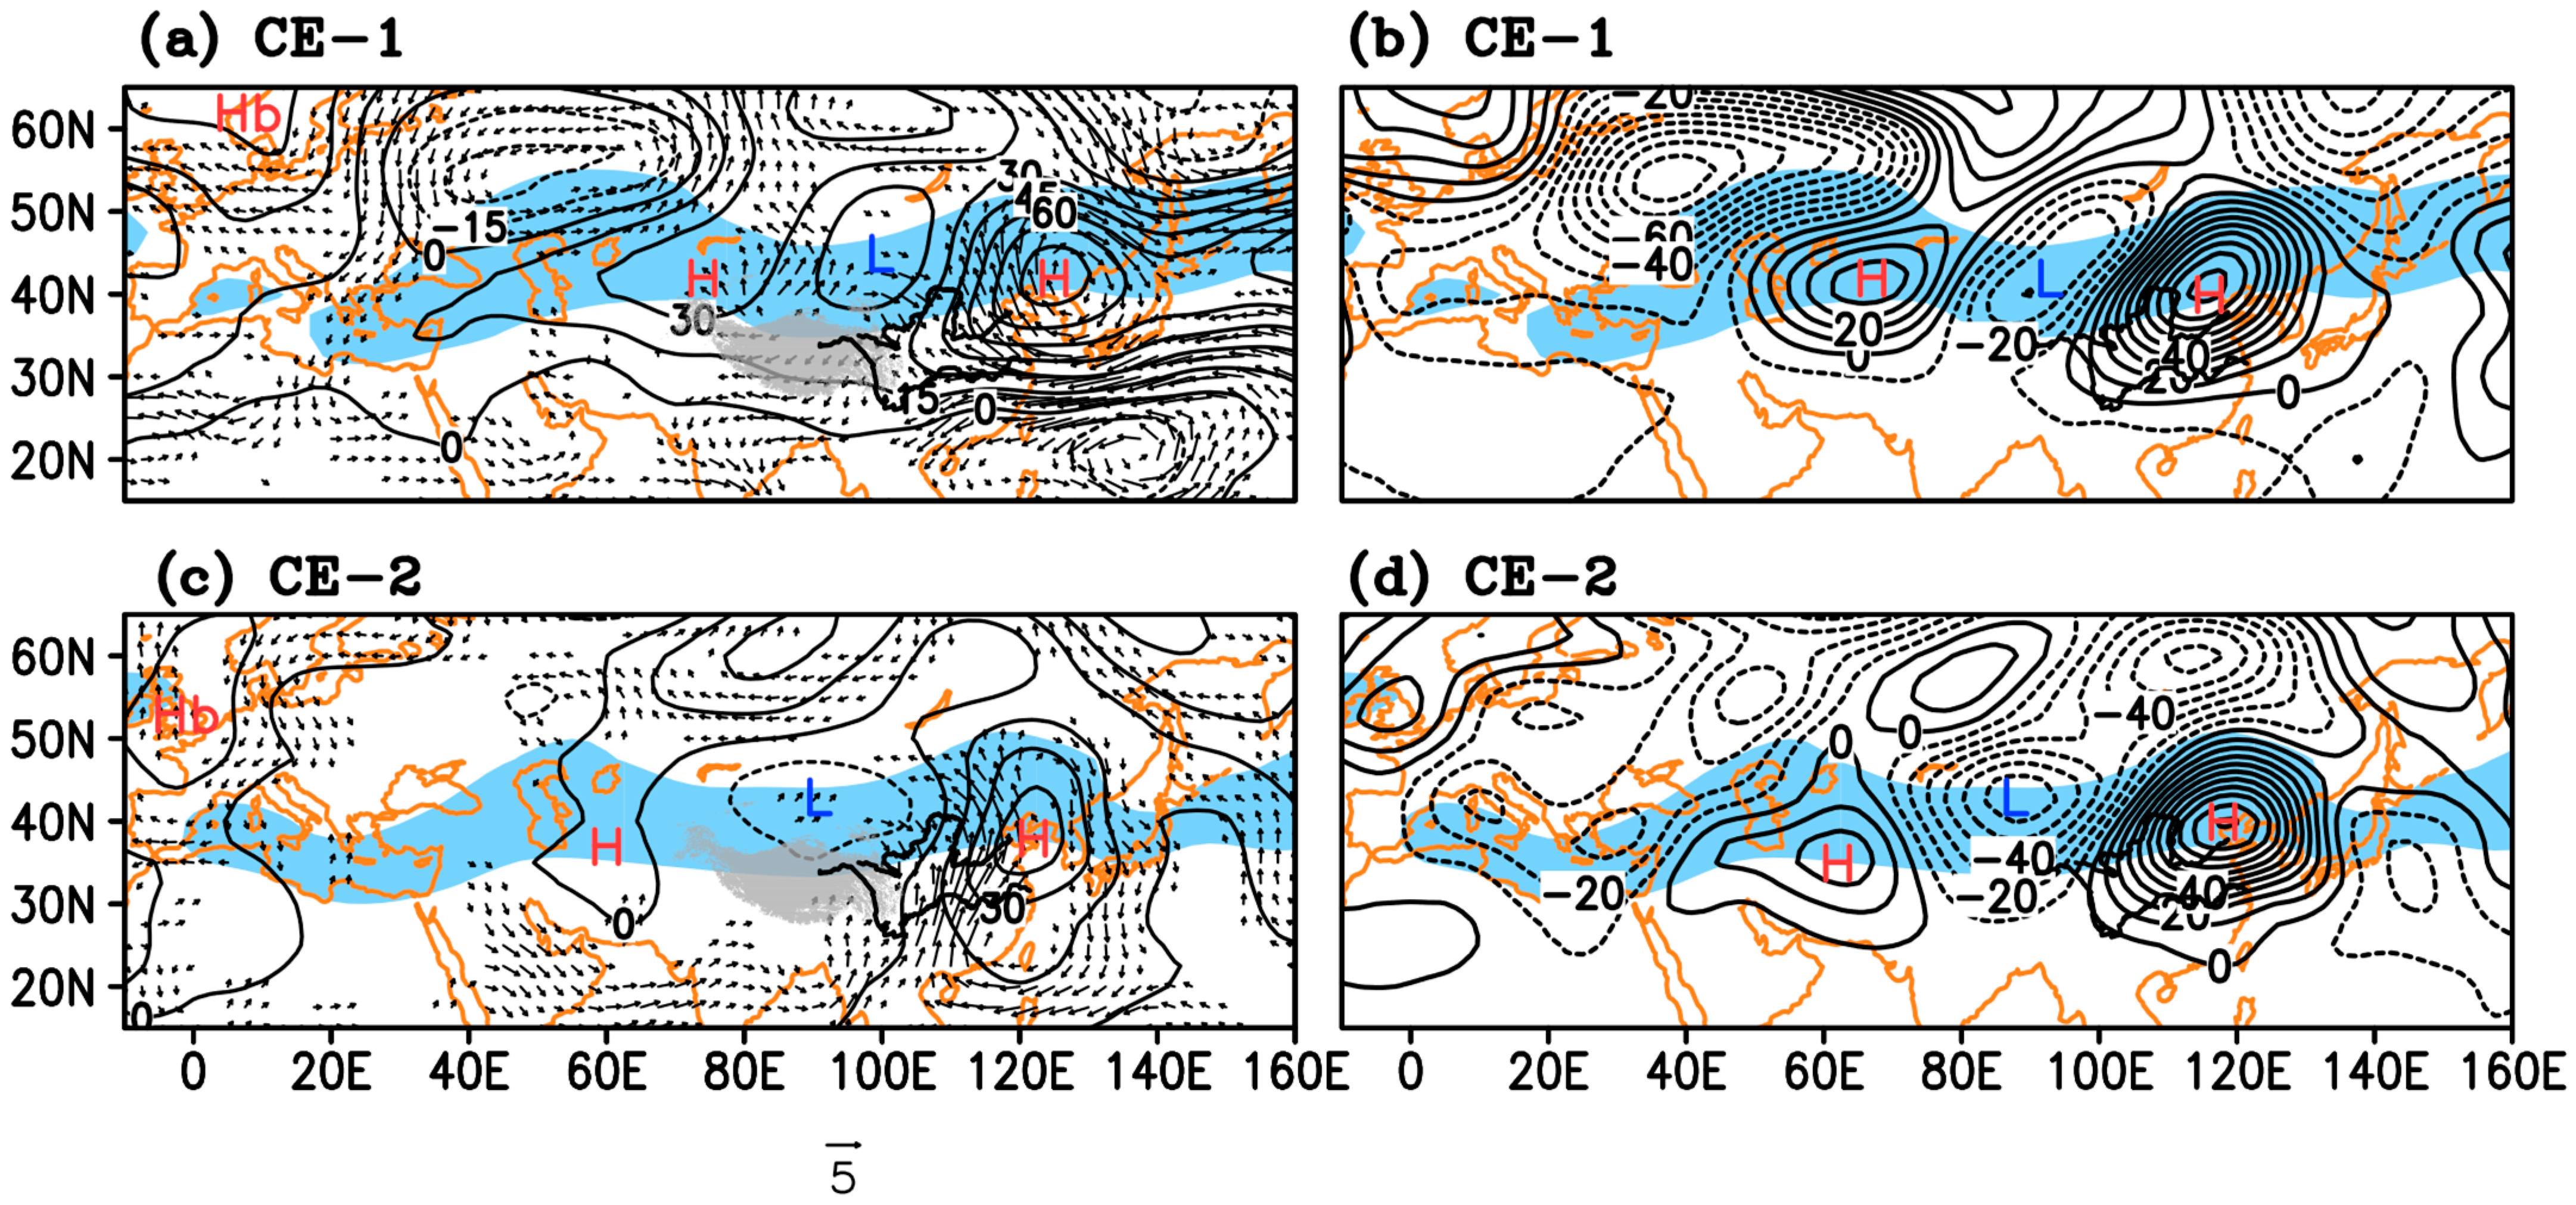
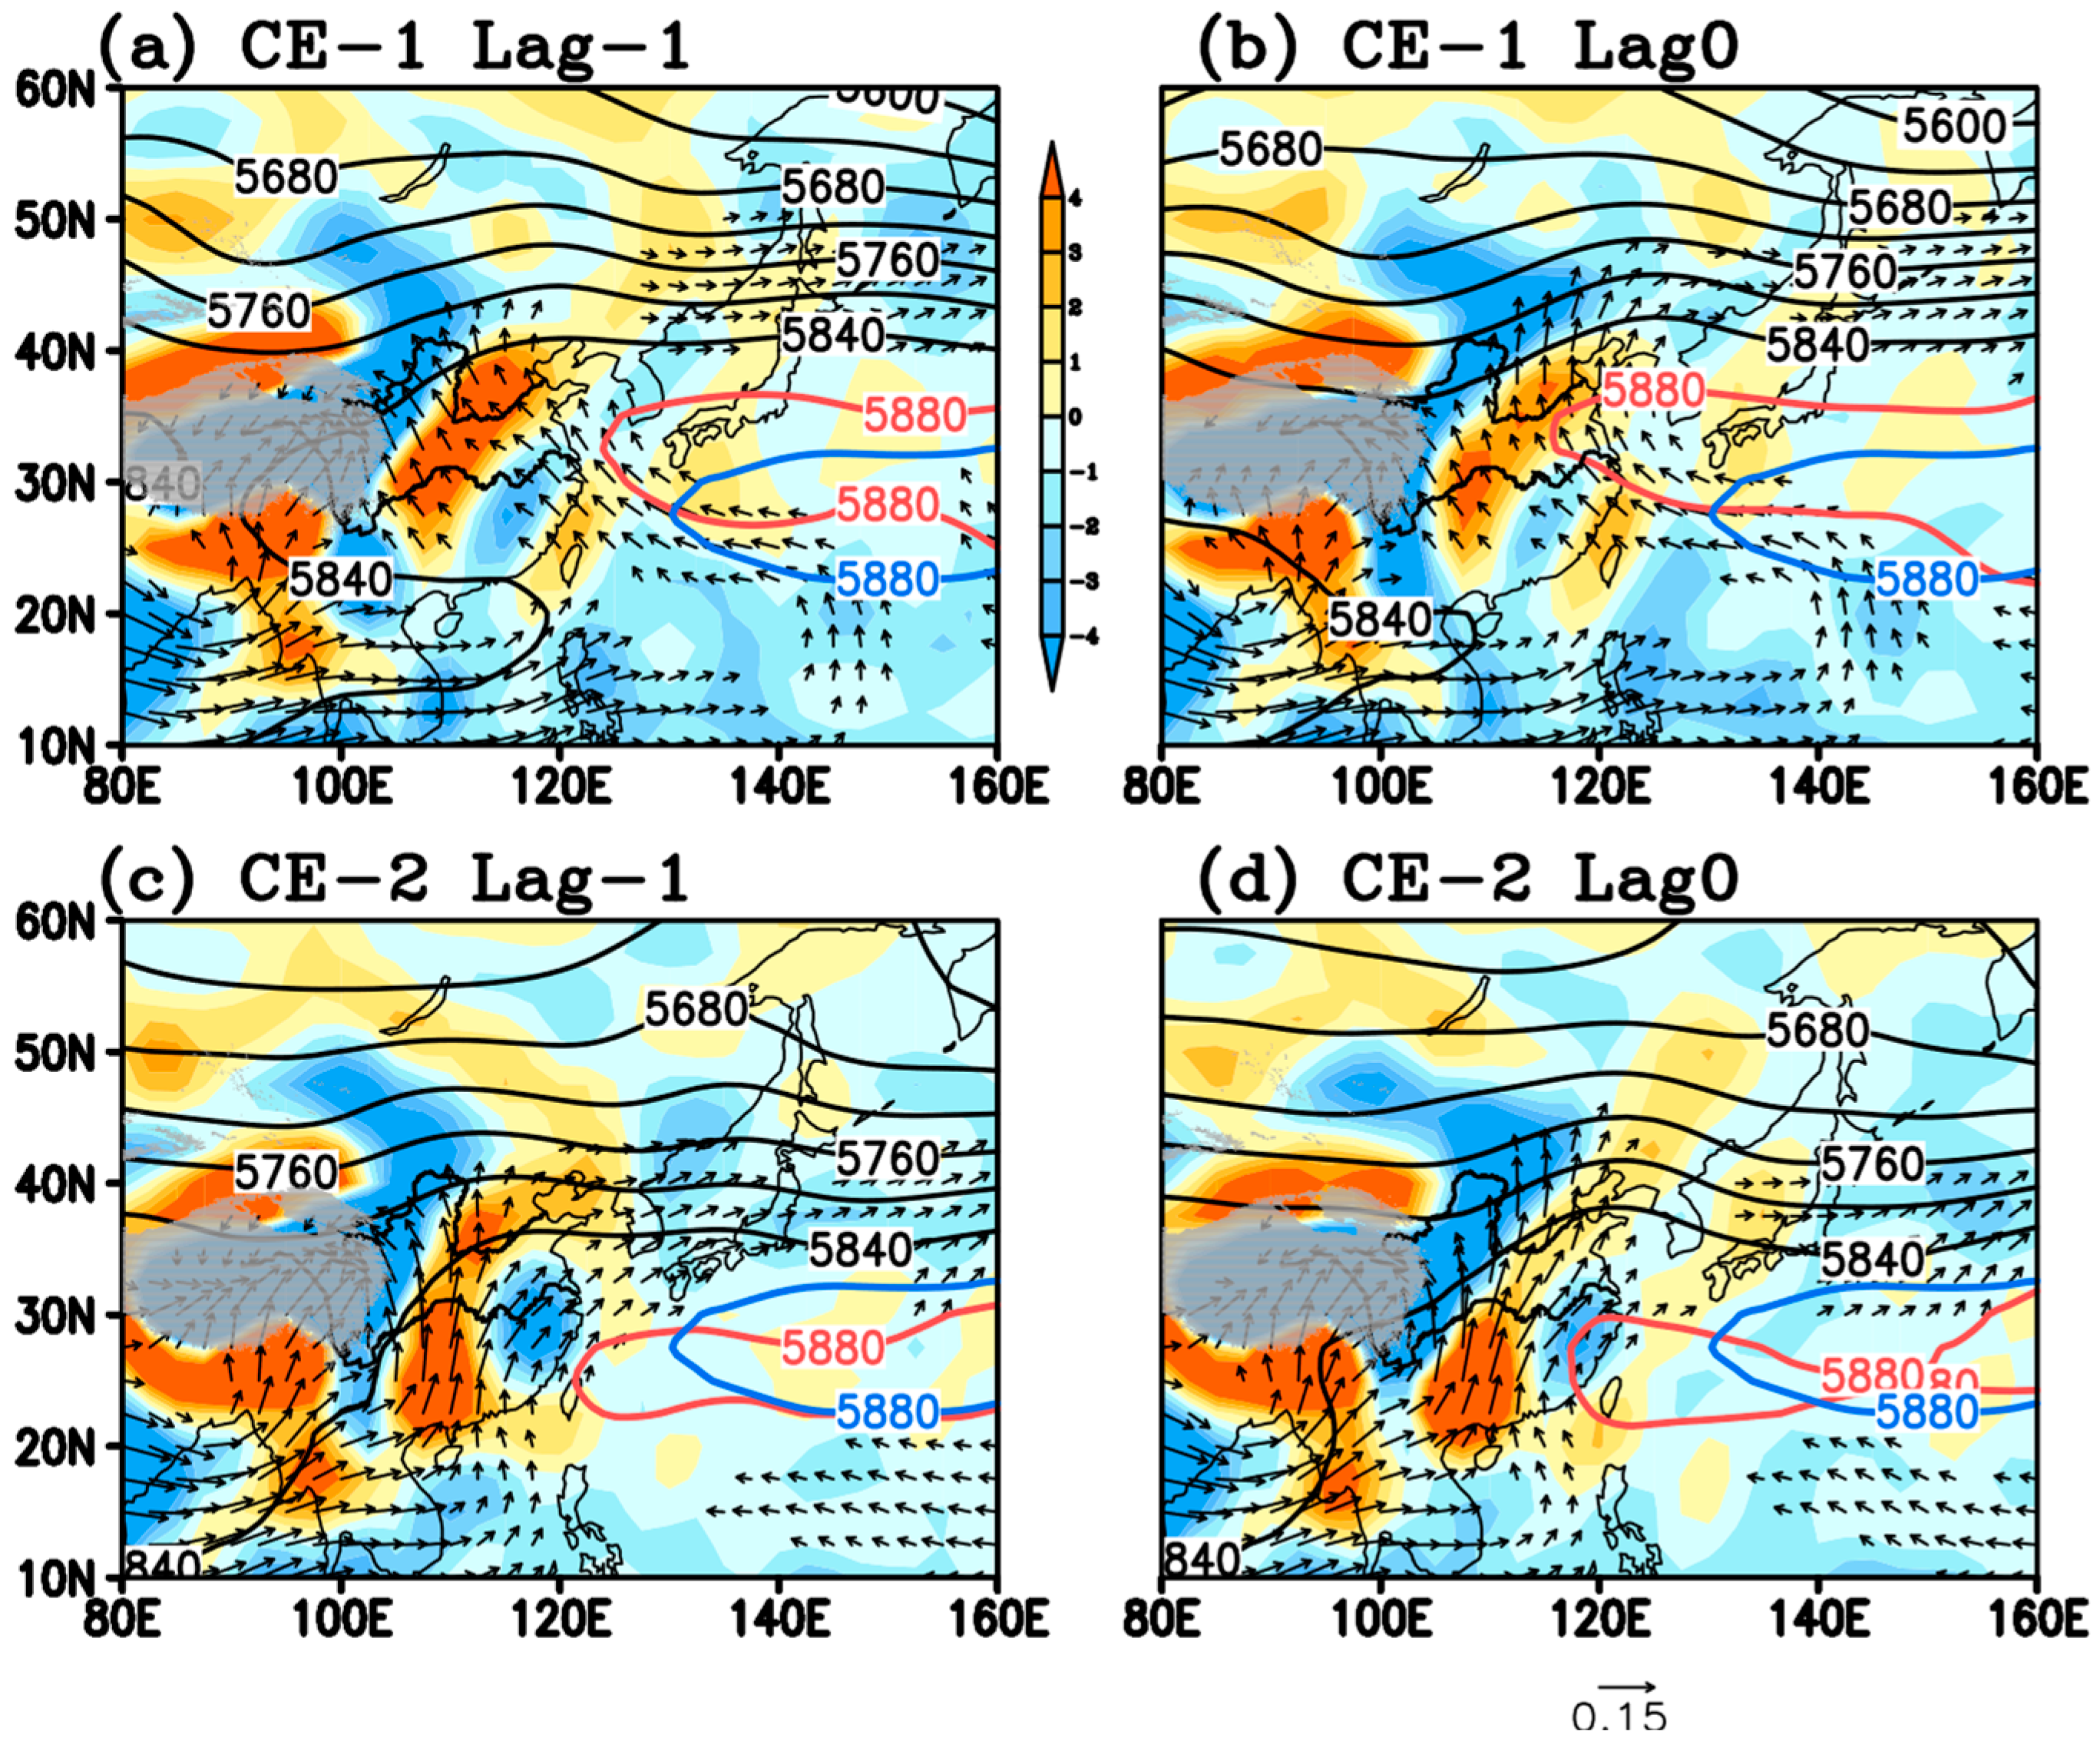
As indicated in the above section, the duration of most REP events is no more than 2 days, and a large amount of the REP events occur within one day. For those consecutive processes lasting more than one day, the day with maximum precipitation is defined as the Lag 0 day. For one-day events, the extreme precipitation day is the Lag 0 day. To show the circulations related to REP events, the 500 hPa geopotential height anomalies corresponding to the Lag 0 day of the 53 REP events are clustered into two typical regimes using the K-mean cluster method, called CE-1 and CE-2 hereafter. The 300 hPa and 500 hPa geopotential height anomalies, the 850 hPa wind vectors (Figure 6), and the water vapor transport and its divergence are composited based on the two clusters (Figure 7).
The composited geopotential anomaly fields in the two REP-event clusters show a wave train with three action centers, illustrating positive, negative, and positive geopotential height anomalies along the Asian jet from 60° E to 140° E at both the 300 hPa and 500 hPa levels and with a vertically barotropic structure (Figure 6), which is typical of a negative phase of the SRP. In the mid-summer Asian continent, the SRP is the leading mode along the Asian jet. The anomalous pattern of the SRP efficiently extracts available potential energy from the jet by means of baroclinic energy conversion [25]. The barotropic kinetic energy conversion from the Asian jet to the SRP occurring over the northwest of the Asian jet is also a critical factor for anchoring the strongest vorticity anomaly around the western jet core and determining the preferred longitudinal phase alignment of the wave train. The wave energy propagating from the polar front jet in a southeastward direction to the Asian jet may influence the evolution of the SRP [25]. Kosaka et al. [32] showed that European blocking can be instrumental in triggering the SRP at a subseasonal time scale. The appearance of European blocking is associated with the positive phase of the North Atlantic Oscillation (NAO) [33].
The most prominent feature of the SRP in both clusters of REP events is the significantly amplified eastern action center, the high-pressure anomaly over northeast China (the NECH, hereafter). However, there are distinct differences between the composites of the geopotential height anomalies of the two clusters. The CE-1 shows the SRP as part of larger-scale wave trains extending in a northwest-southeast direction from the European continent, beginning with a high-pressure anomaly at approximately 0° E to the Asian continent. The subpolar front wave train and the SRP are connected at the entrance of the Asian jet. The NECH is constrained north of 30° N at both the 300 hPa and 500 hPa levels (Figure 6a,b). At the 500 hPa level, the NECH and the negative geopotential height anomaly over the South China Sea constitute a meridional dipole along the east coast of China. The composite circulation corresponding to the CE-2 shows a more zonal SPR along the Asian jet at both the 500 hPa and 300 hPa levels. The NECH illustrates a meridional monopole extending southward along the east coast of the Asian continent (Figure 6c,d).
Based on the above result, it was found that the SRP is the upper-level background condition for the occurrence of extreme precipitation over the YRLV. The difference in the upper-level geopotential height fields between the two clusters induces different lower-level wind fields and moisture transport. In CE-1, the meridional dipole along the eastern coast leads to wind flow originating from the northwest Pacific and induces plentiful water vapor transport into the YRLV, as illustrated by the 850 hPa water vapor transportation. The moist wind flow originating from the Pacific meets the northwesterly flow beneath the forepart of the 500 hPa low-pressure anomaly west of the YRLV, a condition that results in a strong convergence band over the west part of the YRLV. The water vapor convergence and the extreme precipitation are constrained mainly over the west part of the YRLV. The convergence and precipitation are strong and persistent, beginning at Lag −1 day and reaching a maximum at Lag 0 day. In CE-2, the more southward-extended eastern high-pressure action center at 500 hPa induces southerly flow and water vapor transport from the Bay of Bengal, as seen at 850 hPa. Strong water vapor convergence occurs over the west part of the YRLV one day before the extreme precipitation day. On the extreme precipitation day, the water vapor convergence reaches its maximum and expands to almost the whole YRLV.

3.2.2. Anomalous Circulation Patterns Associated with Normal Precipitation Events

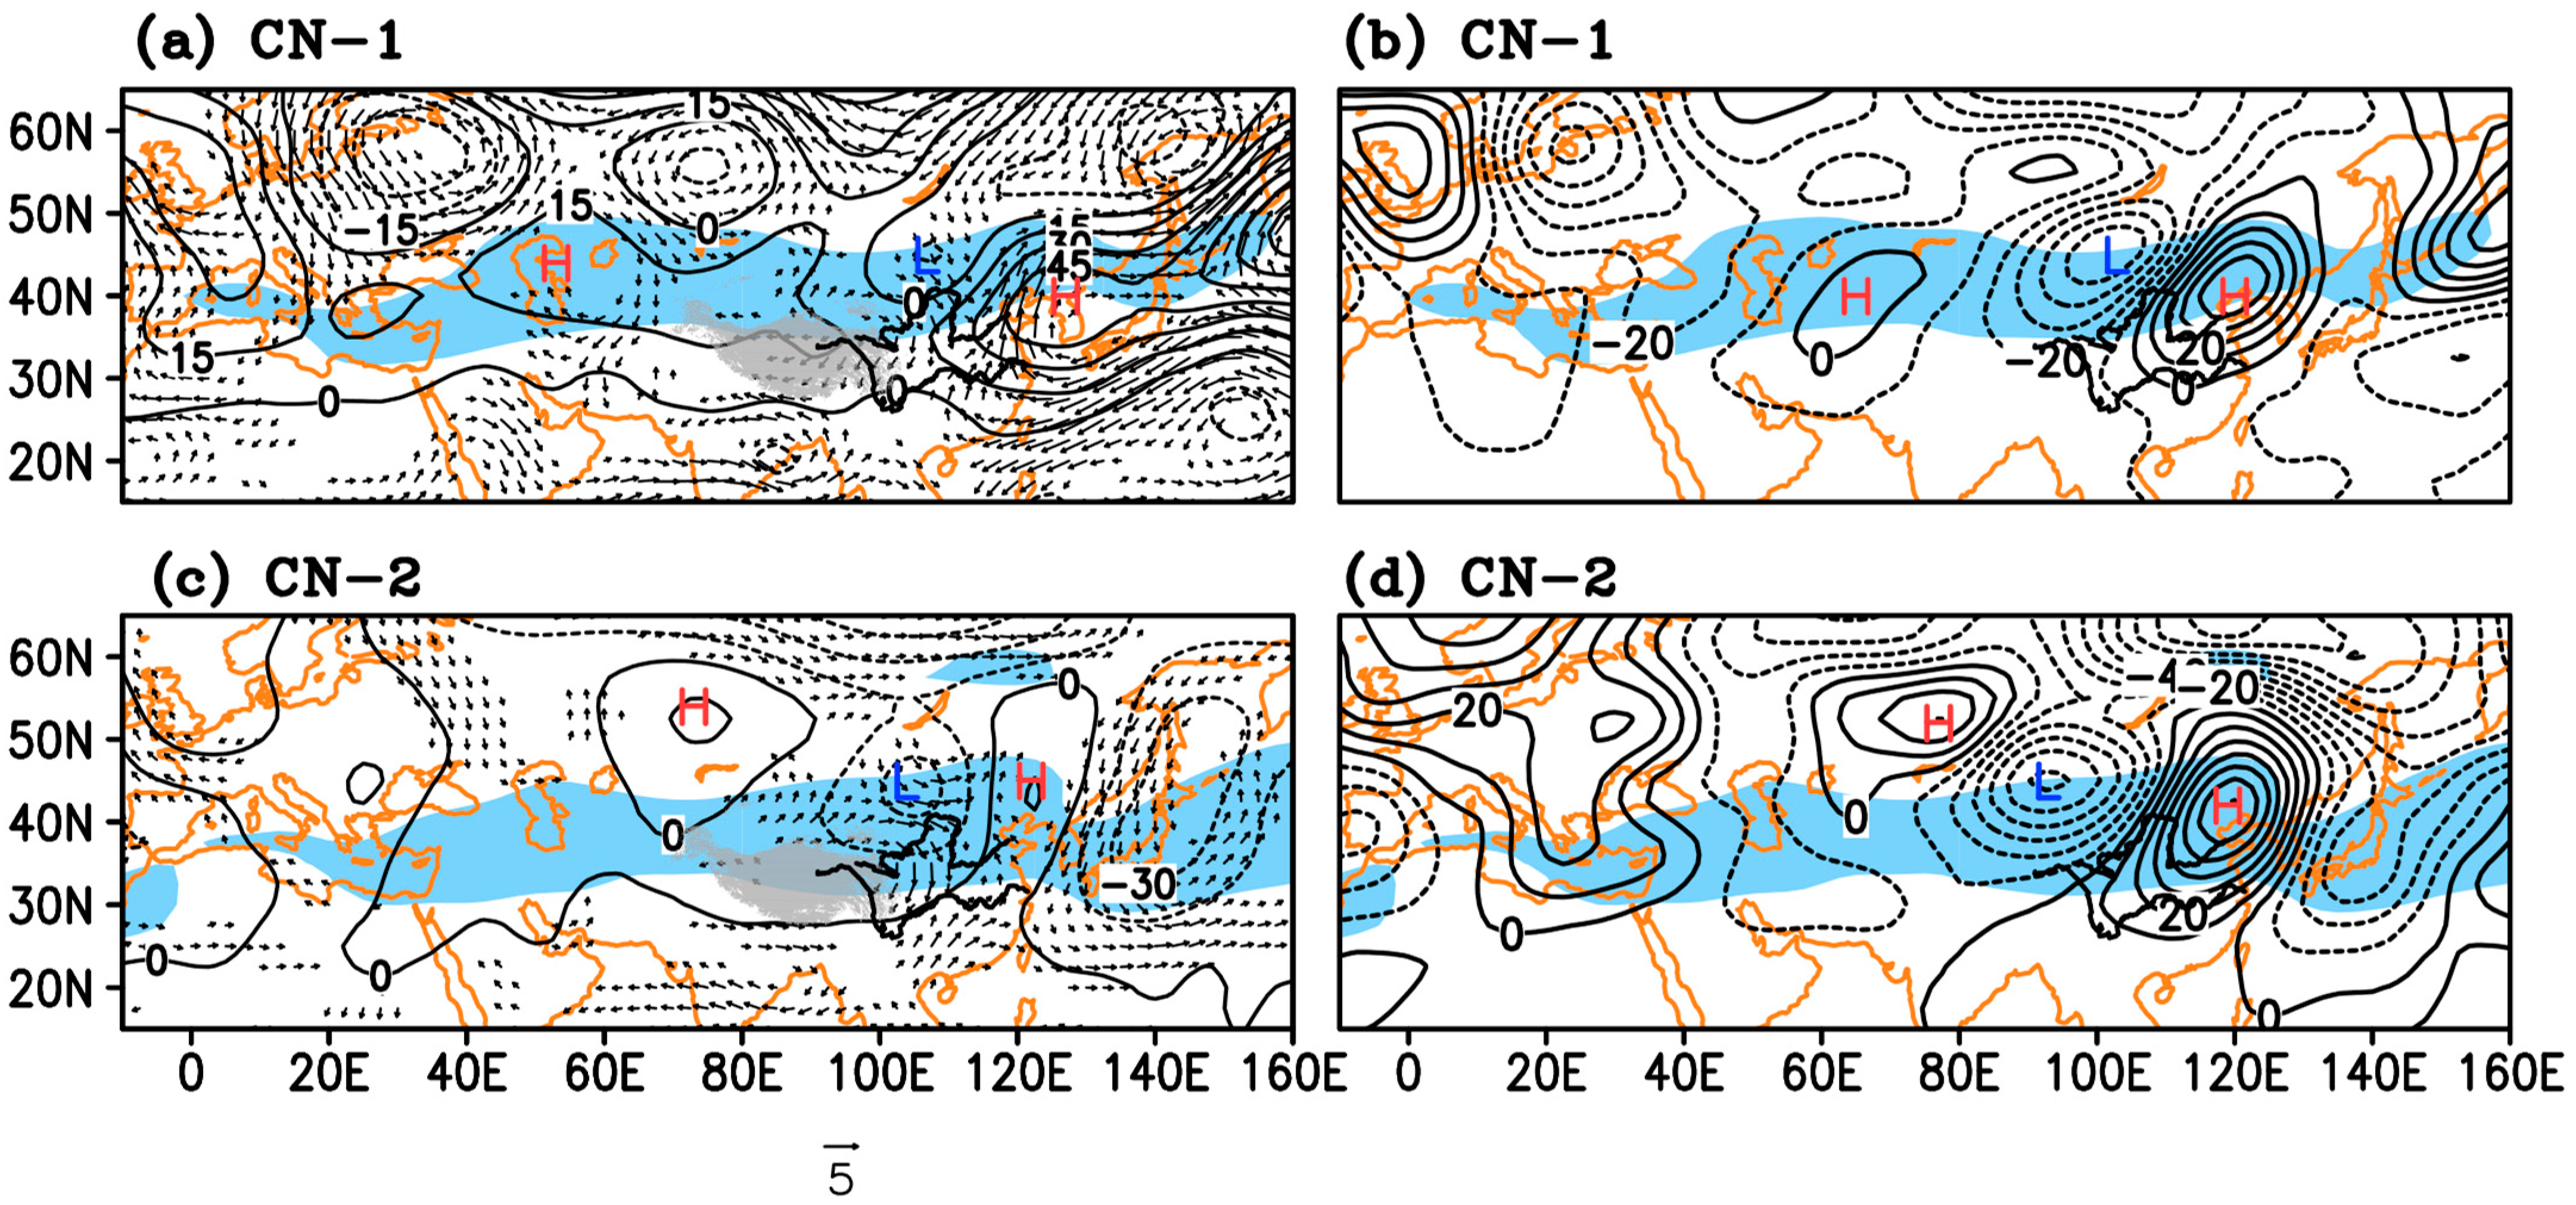
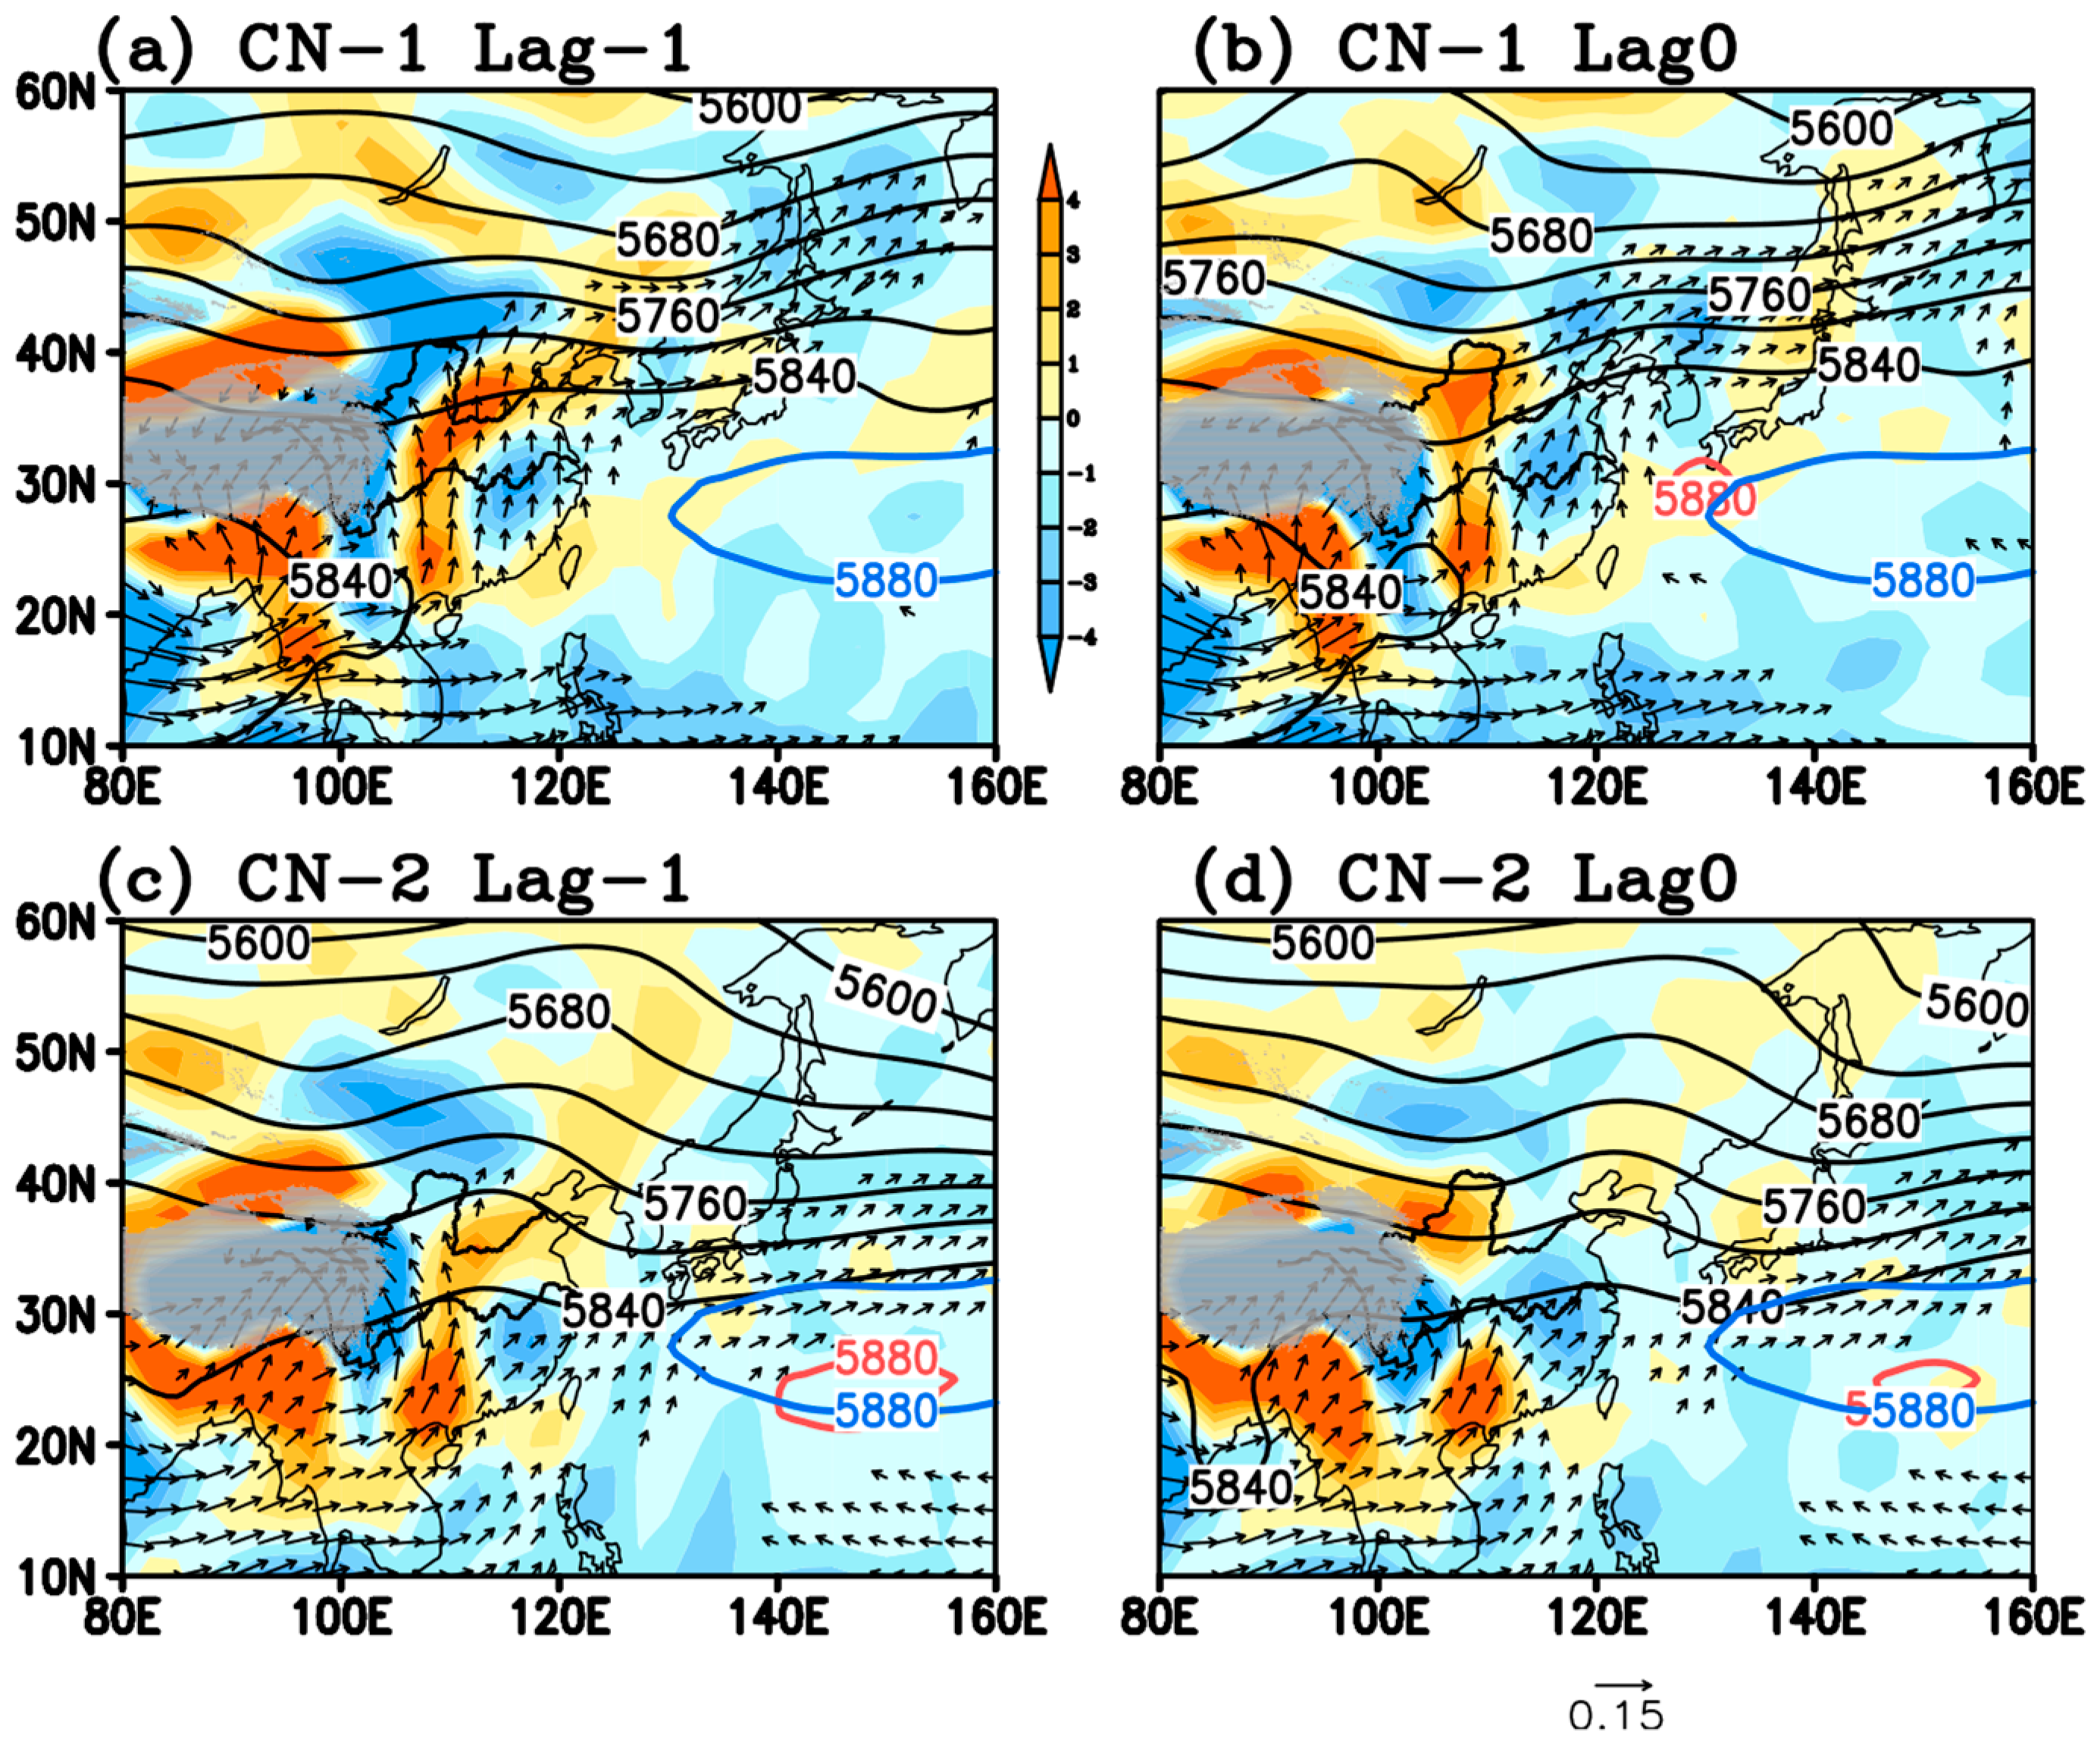
For comparison, normal precipitation day was defined as a day when at least 10 stations in the key region observe a daily precipitation no less than 1 mm, but no stations satisfy the extreme precipitation criterion. Sixty-seven normal precipitation events were selected and are clustered in the same way. The 500 hPa and 300 hPa geopotential height anomaly fields corresponding to Lag 0 day of the normal precipitation events are clustered into two typical regimes (Figure 8). The composited 300 hPa geopotential height anomalies corresponding to the two clusters show a negative phase of the SRP, with the eastern action center illustrating a high-pressure anomaly over NECH, similar to the composited patterns corresponding to the two REP-event clusters. However, the action centers of the SRP related to the normal precipitation events are much weaker than those related to the REP events. At 500 hPa, the two clusters are also distinguished from each other by the different spatial distributions of the eastern high-pressure centers of the SRP. One cluster shows a meridional dipole with a high-pressure anomaly over NECH and a low-pressure anomaly over the South China Sea (CN-1, hereafter) (Figure 8a), and the other cluster shows a meridionally elongating high-pressure anomaly from NECH to South China (CN-2, hereafter) (Figure 8b). In the composite result of the CN-1, the water vapor transport comes mainly from the Bay of Bangel and the South China Sea, which leads to moisture convergence over the western part of the YRLV at Lag −1 day (Figure 9a,b). For CN-2, the water vapor transport comes mainly from the Bay of Bengal, and convergence occurs over the southwest part of the YRLV. For both clusters, the water vapor transport and convergence occur only at Lag −1 day, a duration that is shorter than that of the REP events (Figure 9c,d).

3.2.3. Link to the Western Pacific Subtropical High

The composited geopotential height anomalies at 500 hPa and 300 hPa show the existence of a negative phase of the SRP and an amplified NECH at Lag −1 day and Lag 0 day of the REP events, acting as the upstream and local circulation conditions for extreme precipitation over the YRLV. Meanwhile, the summer WPSH over the western Pacific, which can extend westward to the eastern coast of the Asian continent, has prominent impacts on weather over China in summer [34]. To examine whether the WPSH is connected to the REP events, the 5880 gpm contours are highlighted in 500 hPa geopotential height fields that correspond to the two REP-event clusters in Figure 7 to show the spatial distribution of the current WPSH. For comparison, the climatologic 5880 gpm contour is also added.
The 500 hPa geopotential heights of both clusters show a wavy Asian jet over mid-latitude Asia, which is a reflection of the SRP. Over the northwest Pacific, the spatial pattern of the WPSH exhibits an obvious difference between CE-2 and CE-1, which leads to differences in the spatial distribution of the westerly jet over the northwest Pacific and NECH. In the composite map of CE-1, the WPSH is located more northward than the climatologic mean, which has a western ridge north of 30° N. On Lag −1 day, the northward-shifted WPSH induces southeasterly flow from the Pacific to the eastern coast of China. The intensified NECH illustrated as the strong ridge in the original 500 hPa geopotential height field (Figure 7a) also induces southeasterly flow and relays the northwest-Pacific-originating flow to the YRLV. At Lag 0 day, the NECH is further intensified, and the WPSH extends westward; the NECH and WPSH seem to join with each other. The 5880 gpm contour extends westward into East China, a condition that further intensifies the Pacific-originating flows intruding into the YRLV. In the composite map of CE-2, the WPSH is located south of 30° N, with a western edge in the East China Sea at Lag −1 day. As the NECH continues to intensify, the WPSH extends to South China at Lag 0 day. The intensification of the NECH and the WPSH together strengthens the southerly flow and water vapor transport from the Bay of Bengal in CE-2.
However, the composited 500 hPa geopotential heights of both CN-1 and CN-2 show much weaker WPSH (Figure 9). The current 5880 gpm contour almost disappears west of longitude 140° E. Thus, it seems that the WPSH has little influence on the distribution of NECH and does not significantly contribute to the water vapor transport toward the YRLV. The high-pressure anomalies over NECH are the result of the development of the negative phase of the SRP.
According to the above discussion, it is showed that water vapor transport is carried out by both the NECH and the westward-extended WPSH as a relay process. The westward-extended WPSH causes water vapor transport from the northwest Pacific or the Bay of Bengal to East China or South China, and the NECH continues to transport the water vapor to the YRLV. Therefore, the intensified WPSH reinforces the southerly flow and water vapor transport at the lower level. Moreover, the difference in the location of the WPSH leads to different distributions of lower troposphere circulation over the east coast and consequently different water vapor transport patterns.

3.2.4. Differences between Normal Precipitation Events and REP Events

To further distinguish the circulation of REP events from that of normal precipitation events, differences in the 500 hPa geopotential height anomalies, the 850 hPa wind velocity vectors, and water vapor transport (vectors) and its divergence (color shadings) between the REP events and normal precipitation events are shown in Figure 10. The differences in the 500 hPa geopotential height anomalies between the REP events and normal precipitation events show a significant positive anomaly west of Japan that is confined to the north of 30° N for Cluster 1, as well as a more meridionally elongated positive anomaly along the east coast of the Asian continent. The results indicate that there is a high similarity between the clustered circulation regimes of the REP events and normal precipitation. The two clustered regimes have typical circulation patterns for both normal and extreme precipitation events. The significant positive geopotential height anomalies over the NECH indicate that the amplification of the NECH is the main reason for the extreme precipitation over the YRLV through enhanced westward and northward water vapor transport from the ocean. The differences in the water vapor transport and the divergence of this transport between the REP events and normal precipitation events, as shown in Figure 10a,b, reveal that the 850 hPa flow and associated water vapor transport from the northwest Pacific/Bay of Bengal are strengthened during extreme precipitation events for CE-1/CE-2. Thus, the strength of the water vapor convergence is greatly increased for the two clusters of extreme precipitation events.
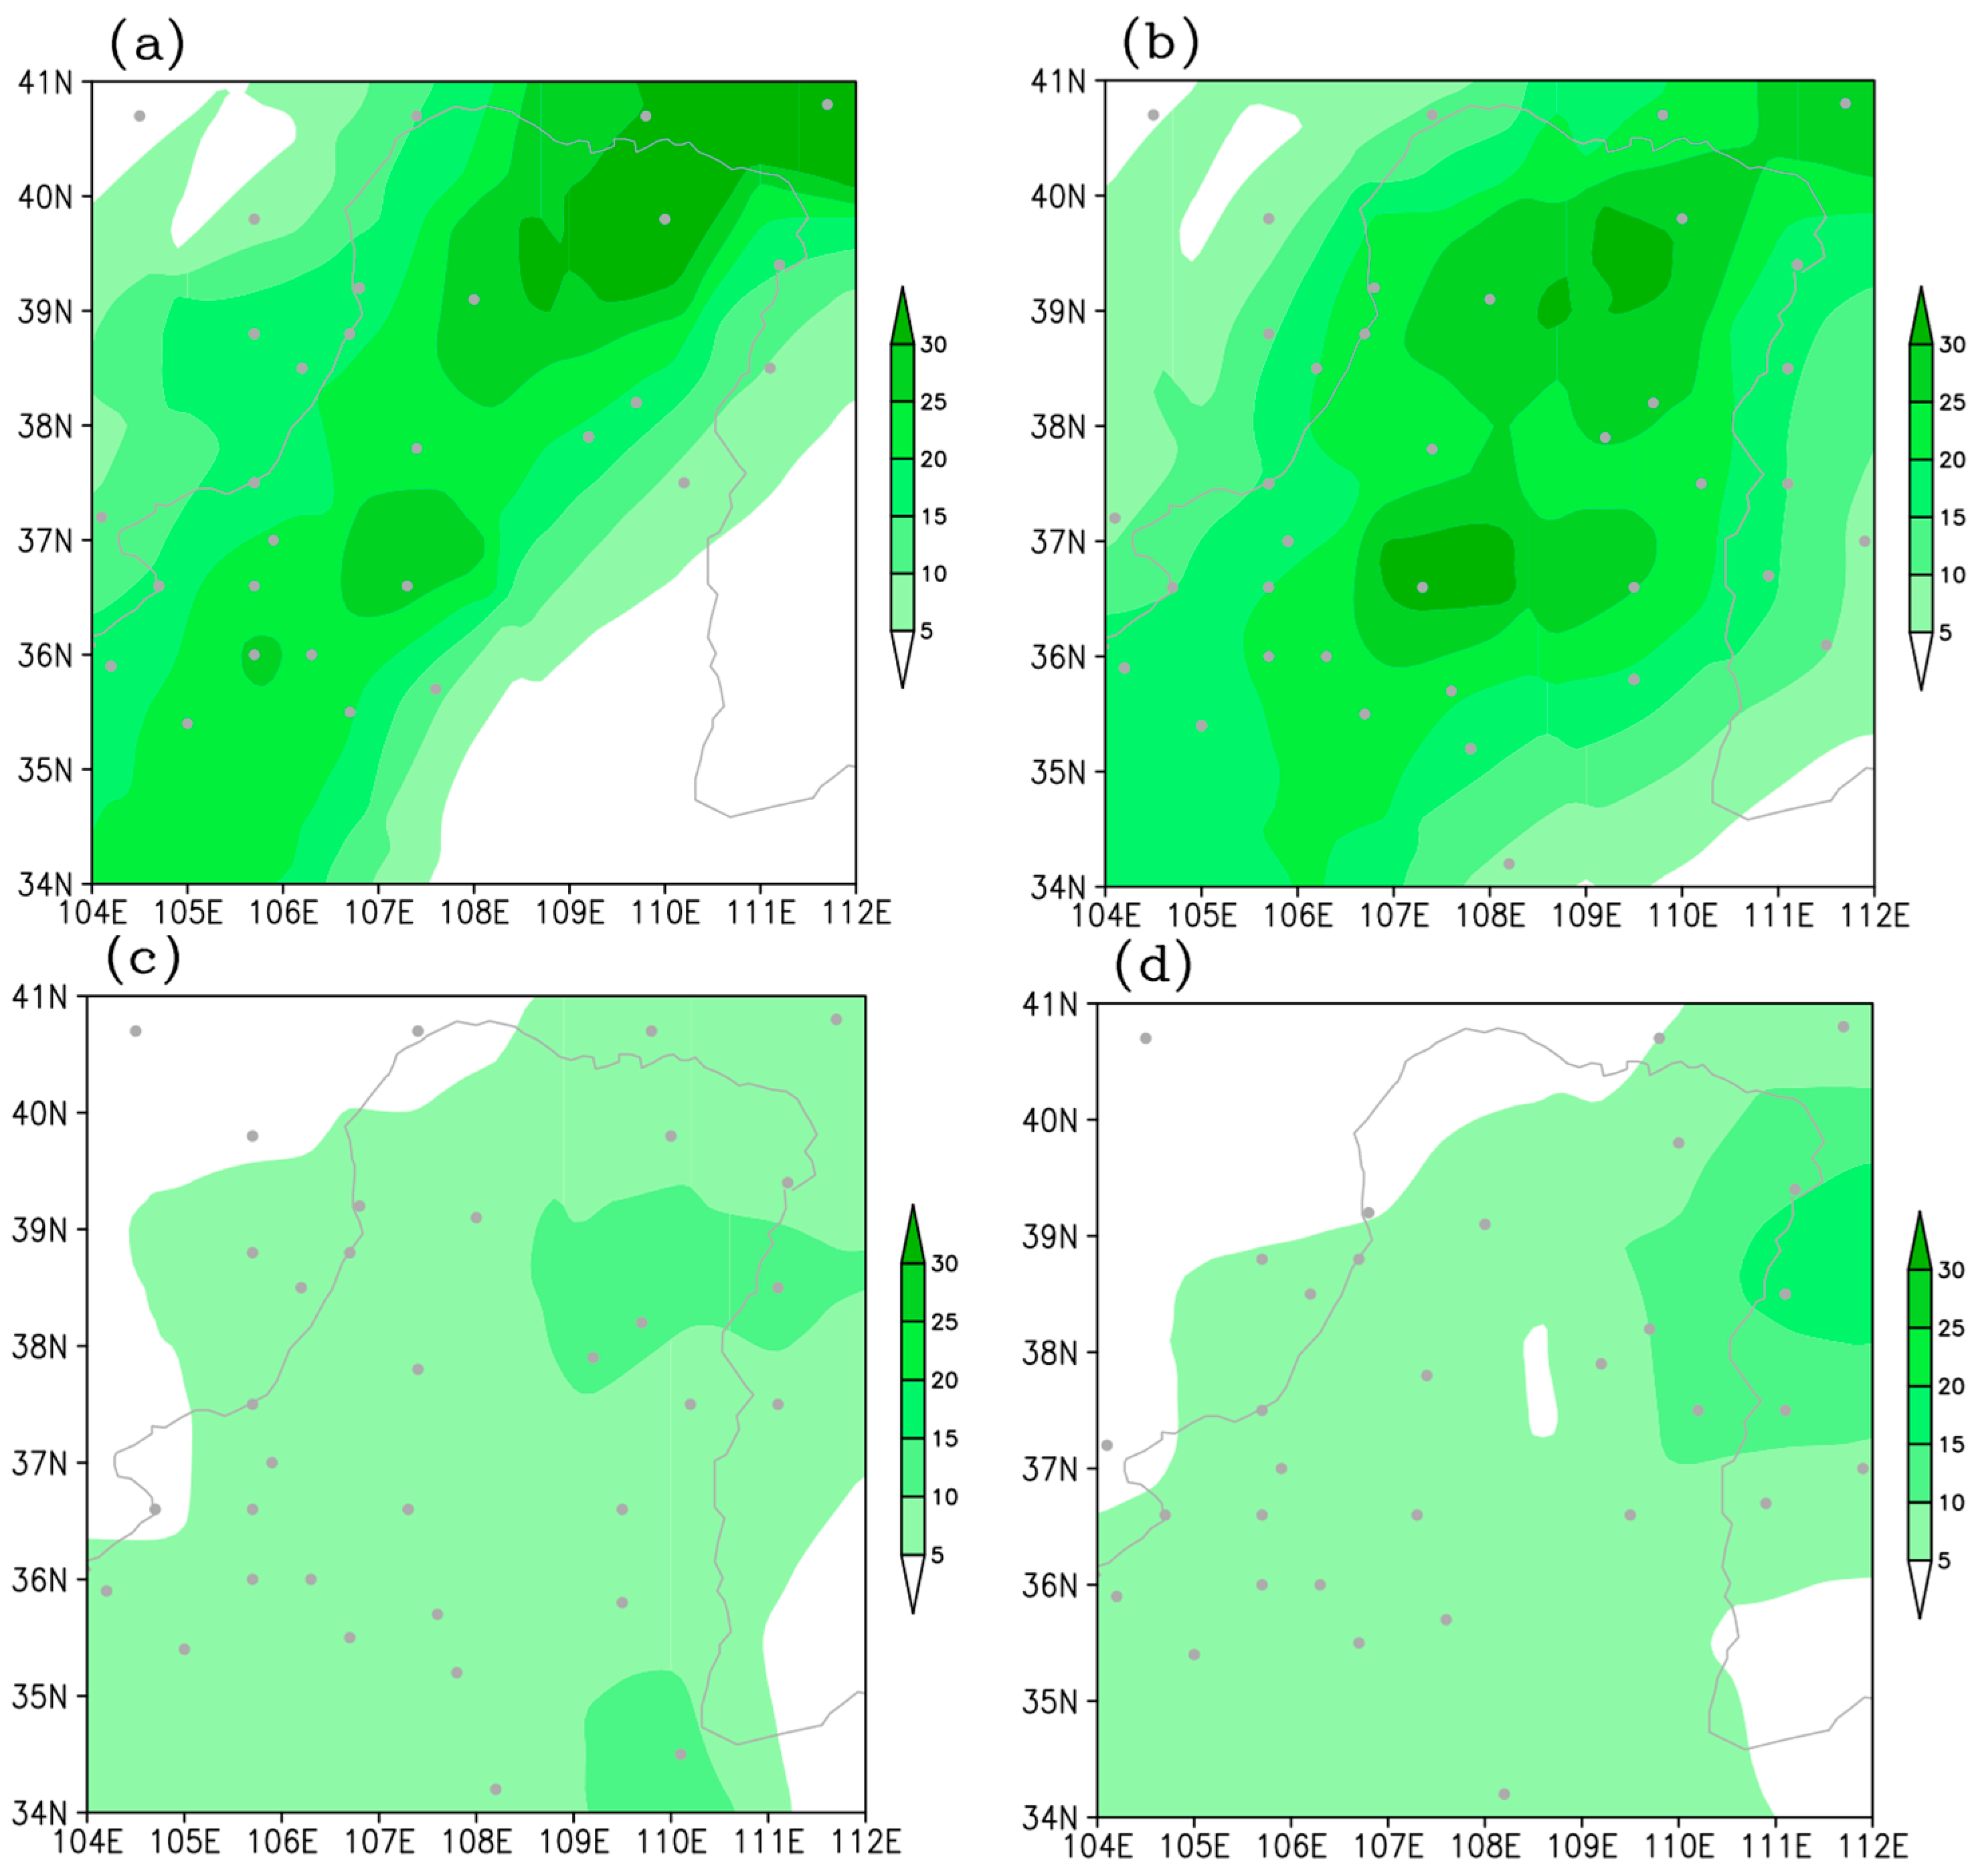
The rainfall amounts of the two REP-event clusters and normal precipitation events are composited, as shown in Figure 11. During the CE-1 REP events, the NECH pressure is located northward, and the northwest-Pacific-originating water vapor is transported mainly from southeast of the YRLV. The extreme precipitation loading occurs primarily over the north and west of the YRLV, with a maximum over the north of the YRLV. For the REP events of CE-2, the extreme precipitation covers the entire YRLV, with a maximum over the central part of the YRLV. This is because the NECH is more meridionally elongated, and the corresponding water vapor transport comes from south of the YRLV. In contrast, the precipitation composites of the two clusters of normal precipitation events are much weaker than those of the REP events. Th e difference between the spatial distributions of the eastern high-pressure circulation in the two clusters of the normal precipitation events also leads to different distributions of rainfall in the YRLV. However, the difference is not obvious.

3.3. Links to European Blocking Activity

According to the above discussion, it has been showed that precipitation over the YRLV occurs when the SRP shows a negative phase with a high-pressure anomaly over NECH. Extreme precipitation occurs when the high-pressure anomaly over NECH is intensified and the WPSH extends westward. Although the westward-extended WPSH can reinforce southerly flow in the lower troposphere from the northwest Pacific during REP events, the WPSH is not the reason for the intensification of the NECH and the other two action centers of the SPR. The SRP is a signal that is most significant above the 500 hPa level. Moreover, the amplified NECH is the local circulation that controls the local water vapor transport and convergence over the YRLV. Therefore, the development of the SRP and the amplification of the NECH is the key to explaining the summer extreme precipitation in YRLV. Kosaka et al. [25] indicated that the intraseasonal intensification of the SRP is generally attributed to the energy from upstream blocking. In this section, the possible connection between upstream blocking activities and the evolution of the NECH is investigated.

3.3.1. Statistic Connection to Upstream Blocking Activities

In the mid-summer Asian continent, the SRP is the leading mode along the Asian jet. The anomalous pattern of the SRP efficiently extracts available potential energy from the jet by means of baroclinic energy conversion [25]. Chen at el. also indicated that quasi-stationary external modes are destabilized by weak thermal damping. Chen and Huang [22] indicated that the interannual variation in the SRP is connected to the Circumglobal Teleconnection (CGT). However, at a monthly to seasonal scale, coupled models cannot predict the temporal phase of the SRP, and the wave energy propagating from the polar front jet in a southeastward direction to the Asian jet influences the evolution of the SRP [25]. Kosaka et al. [32] showed that European blocking can be instrumental in triggering the SRP at a subseasonal time scale.
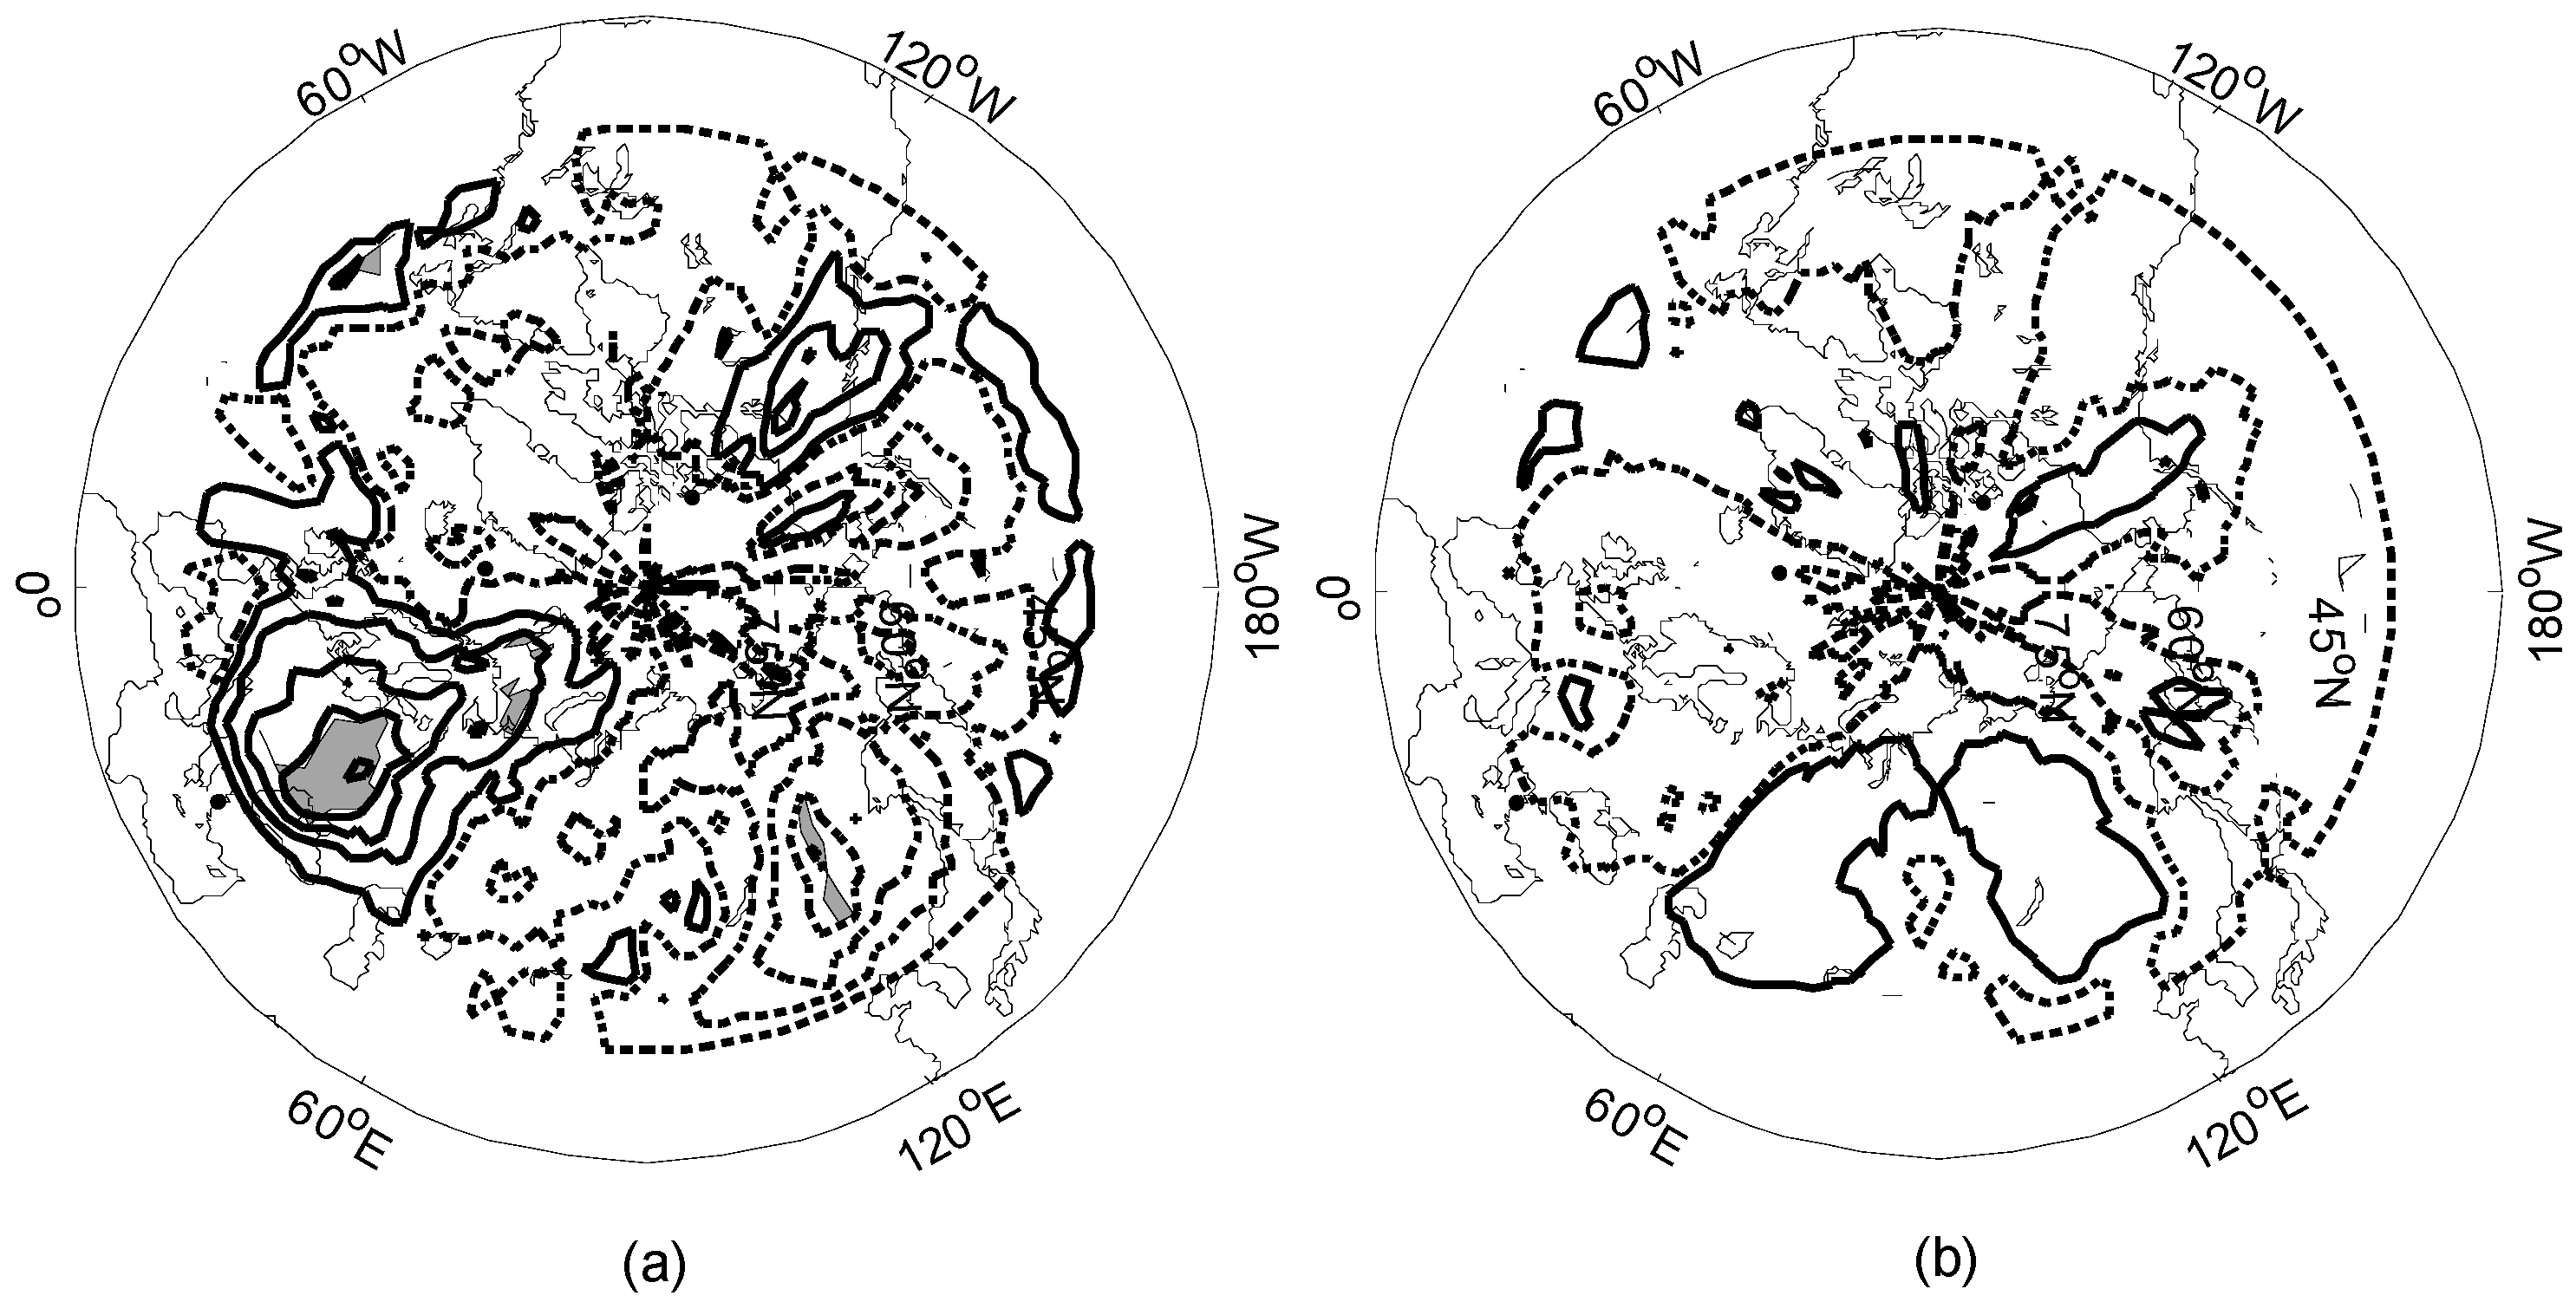
To examine the connection between upstream blocking and the summer precipitation extremes over the YRLV, the blocking activities for strong extreme precipitation years and normal precipitation years were composited. The extreme and normal precipitation years were defined as follows. Based on the yearly REP index, an extreme precipitation year must have least 3 REP days in summer, while a normal year must have no REP days in summer. The blocking frequency was calculated according to a two-dimensional blocking index [29]. The results (Figure 12a) indicate that the number of summer blocking days is greater than the climatological mean in extreme precipitation years; in contrast, the number of European blocking days is at the mean level in normal precipitation years (Figure 12b). This confirms our conjecture that the occurrence of extreme precipitation in the YRLV is connected to upstream blocking activities.

3.3.2. Daily Evolutions of the SRP Action Centers and Upstream Blocking

The composited results of the extreme/normal precipitation years indicate a statistical connection between European blocking and the occurrence of REP in the YRLV (Figure 12). In this section, the evolution of the action centers in the SRP will show how upstream blocking influences the amplification of high pressure over the NECH. This may provide a possible mechanism underlying the occurrence of REP in the YRLV.
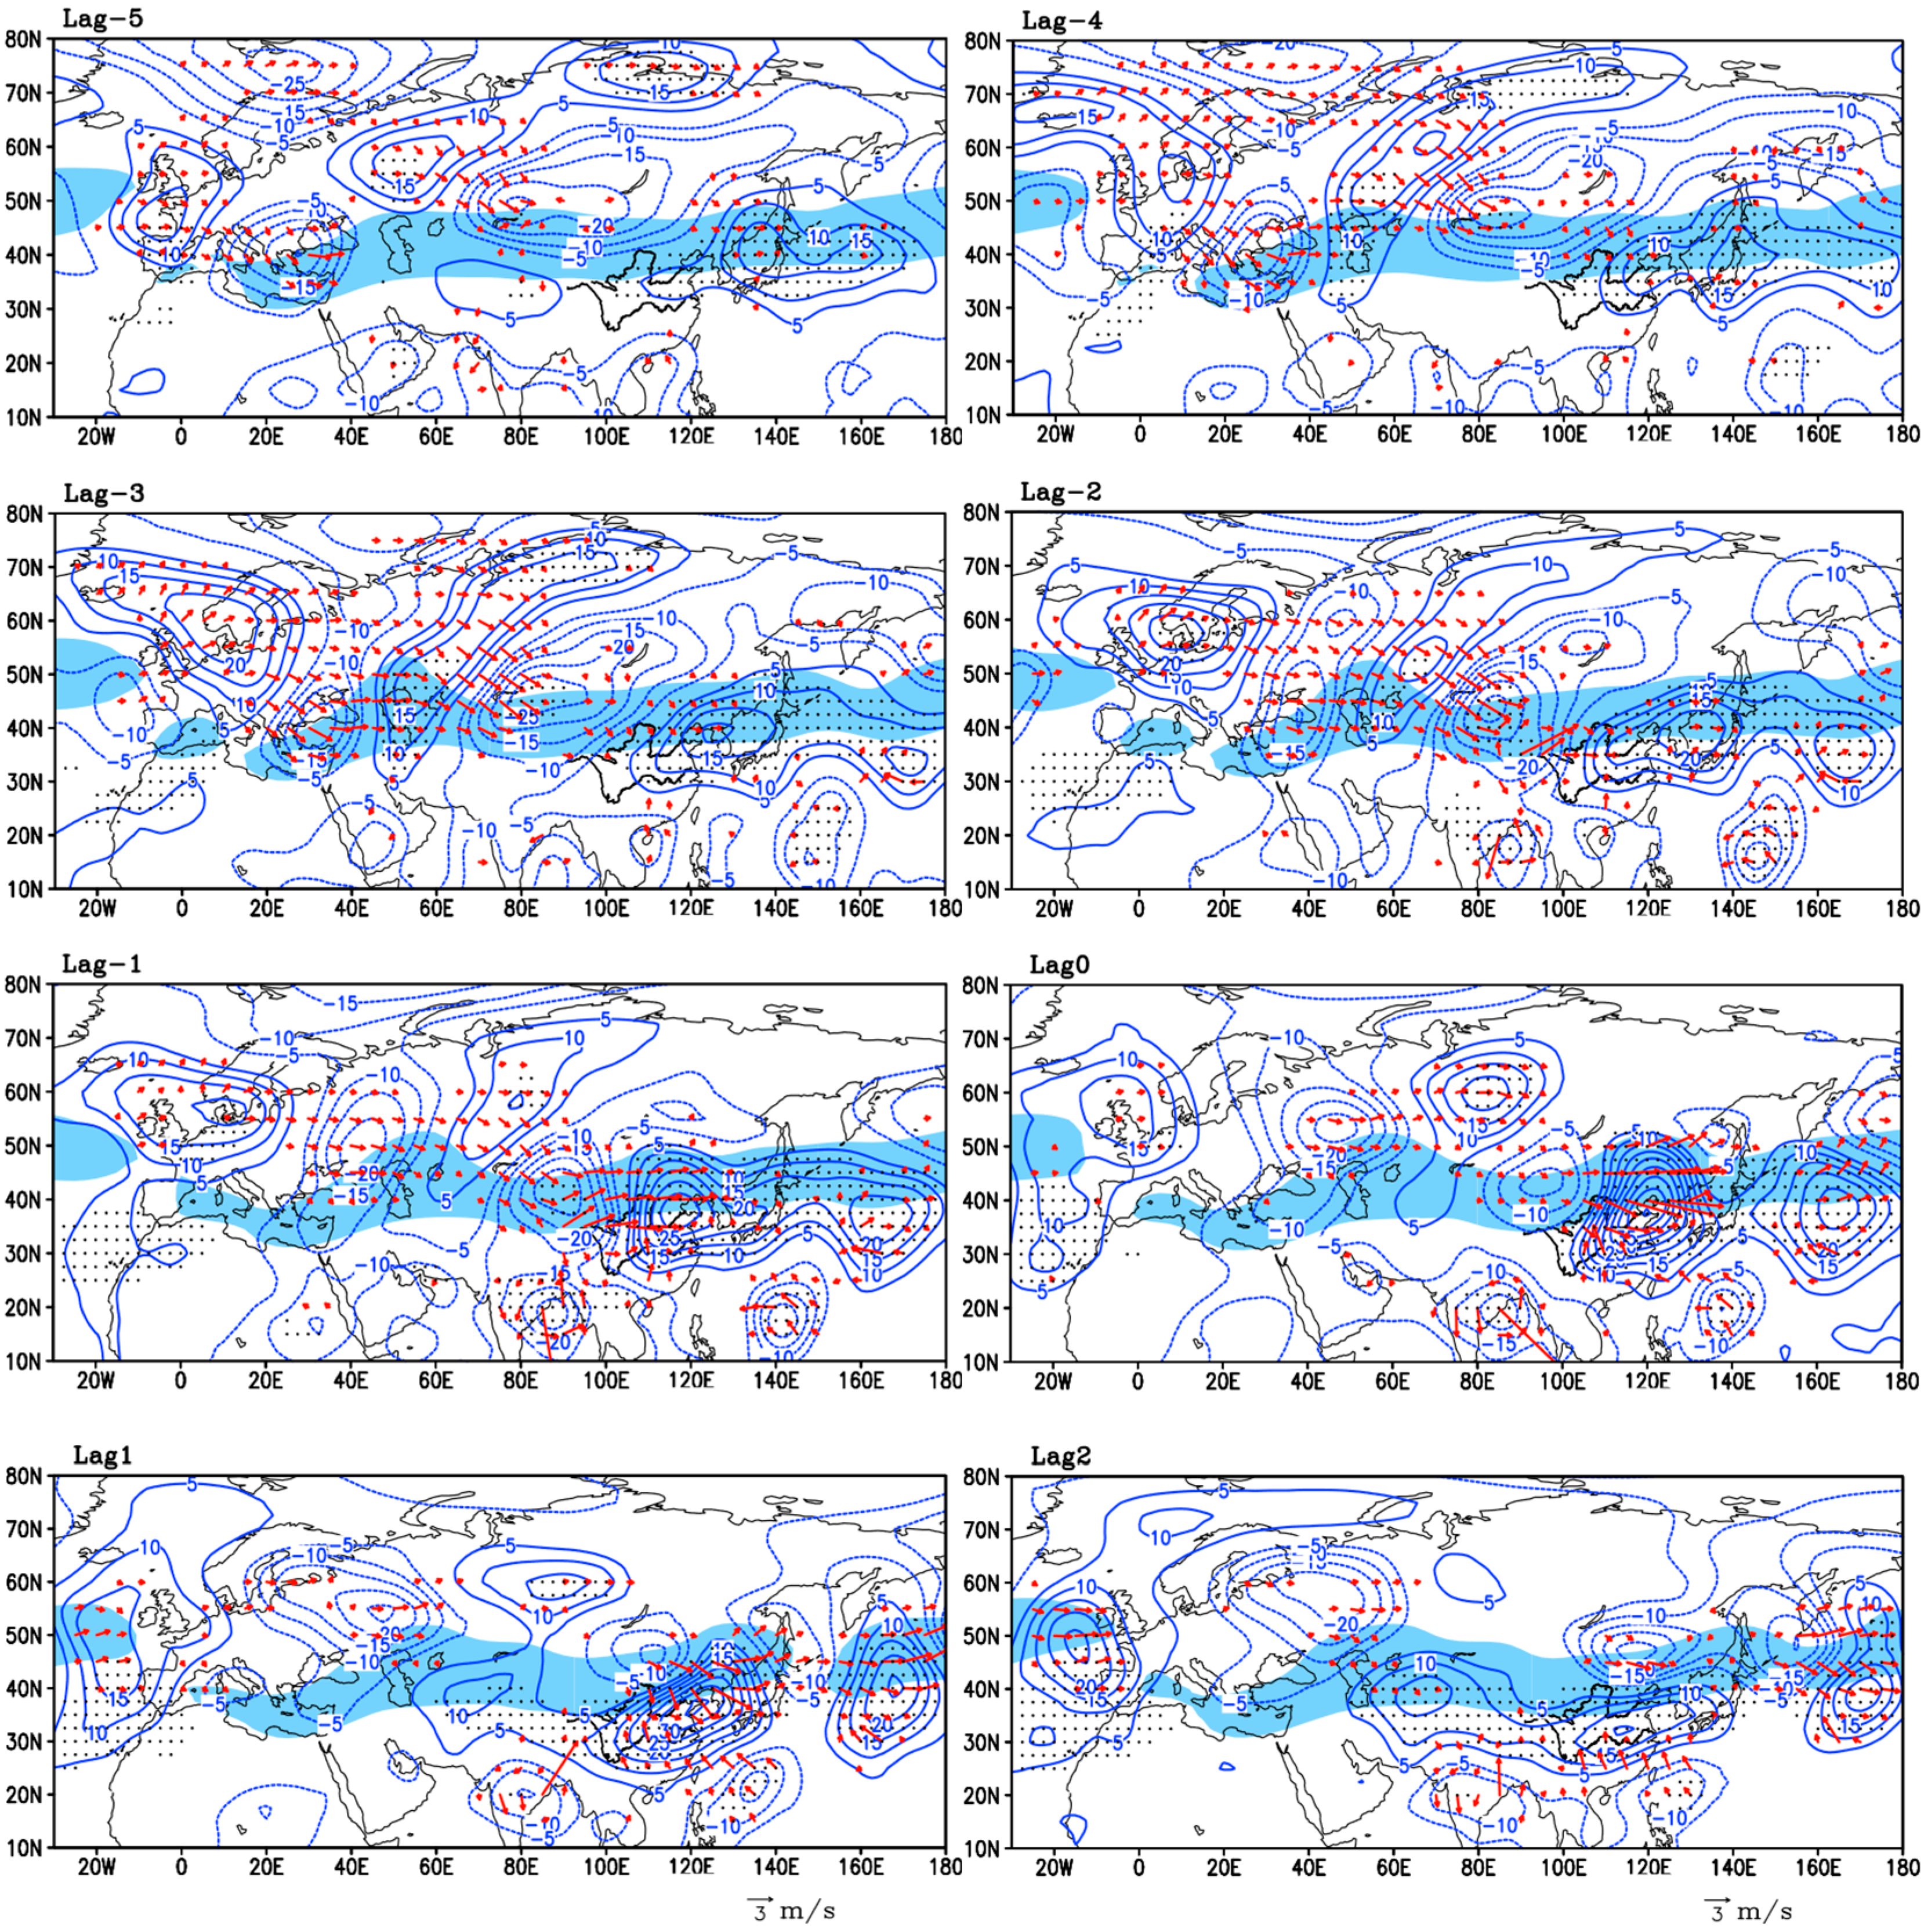
To investigate how upstream blocking influences the evolution of high-pressure anomalies over NECH, the daily variations in the 500 hPa height anomaly from Lag −5 to Lag +2 are composited based on the 53 selected REP events (Figure 13). At Lag −5 day, the composited 500 hPa geopotential height anomalies illustrate an incipient negative phase of the SRP along the Asian jet with high pressure over Japan and a northwest-southeast oriented subpolar wave train from north Europe to the Asian continent. The wave train pattern is very similar to the July and August mean high-pressure anomaly for the extreme precipitation years in Figure 13. This indicates that the July and August mean circulation pattern provides a background for the intraseasonal development of the SRP and the NECH that corresponds to the occurrence of extreme precipitation in the YRLV. The wave-activity flux is considered a “snapshot’’ of a propagating packet of stationary or migratory wave disturbances [31]. Figure 13 also shows the daily wave-activity flux during the REP events. On Lag −5 day, the wave-activity flux is found mainly along two paths: one path begins at the entrance of the Asian jet, and the other is oriented in a southeast direction from north Europe (polar front) to the Asian jet. Kosaka et al. [25] concluded that the southeastward direction of the wave-activity flux indicates the propagation of wave energy from the polar front jet to the Asian jet. Figure 13 illustrates a combination of the wave-activity fluxes of the polar front and Asian jet from the Lag −5 day to the Lag −2 day that leads to the intensification of the action centers of the SRP. The SRP begins to show a typical shape on Lag −4 day. The west part of the incipient high-pressure anomaly over Japan intensifies as the wave activity flux continuously propagates from west to east and eventually appears as high pressure over NECH. The incipient large-scale high pressure is then divided into two high-pressure centers. Thus, the amplification of the high pressure over NECH is a result of downstream wave energy propagation from the wave activity over Europe.
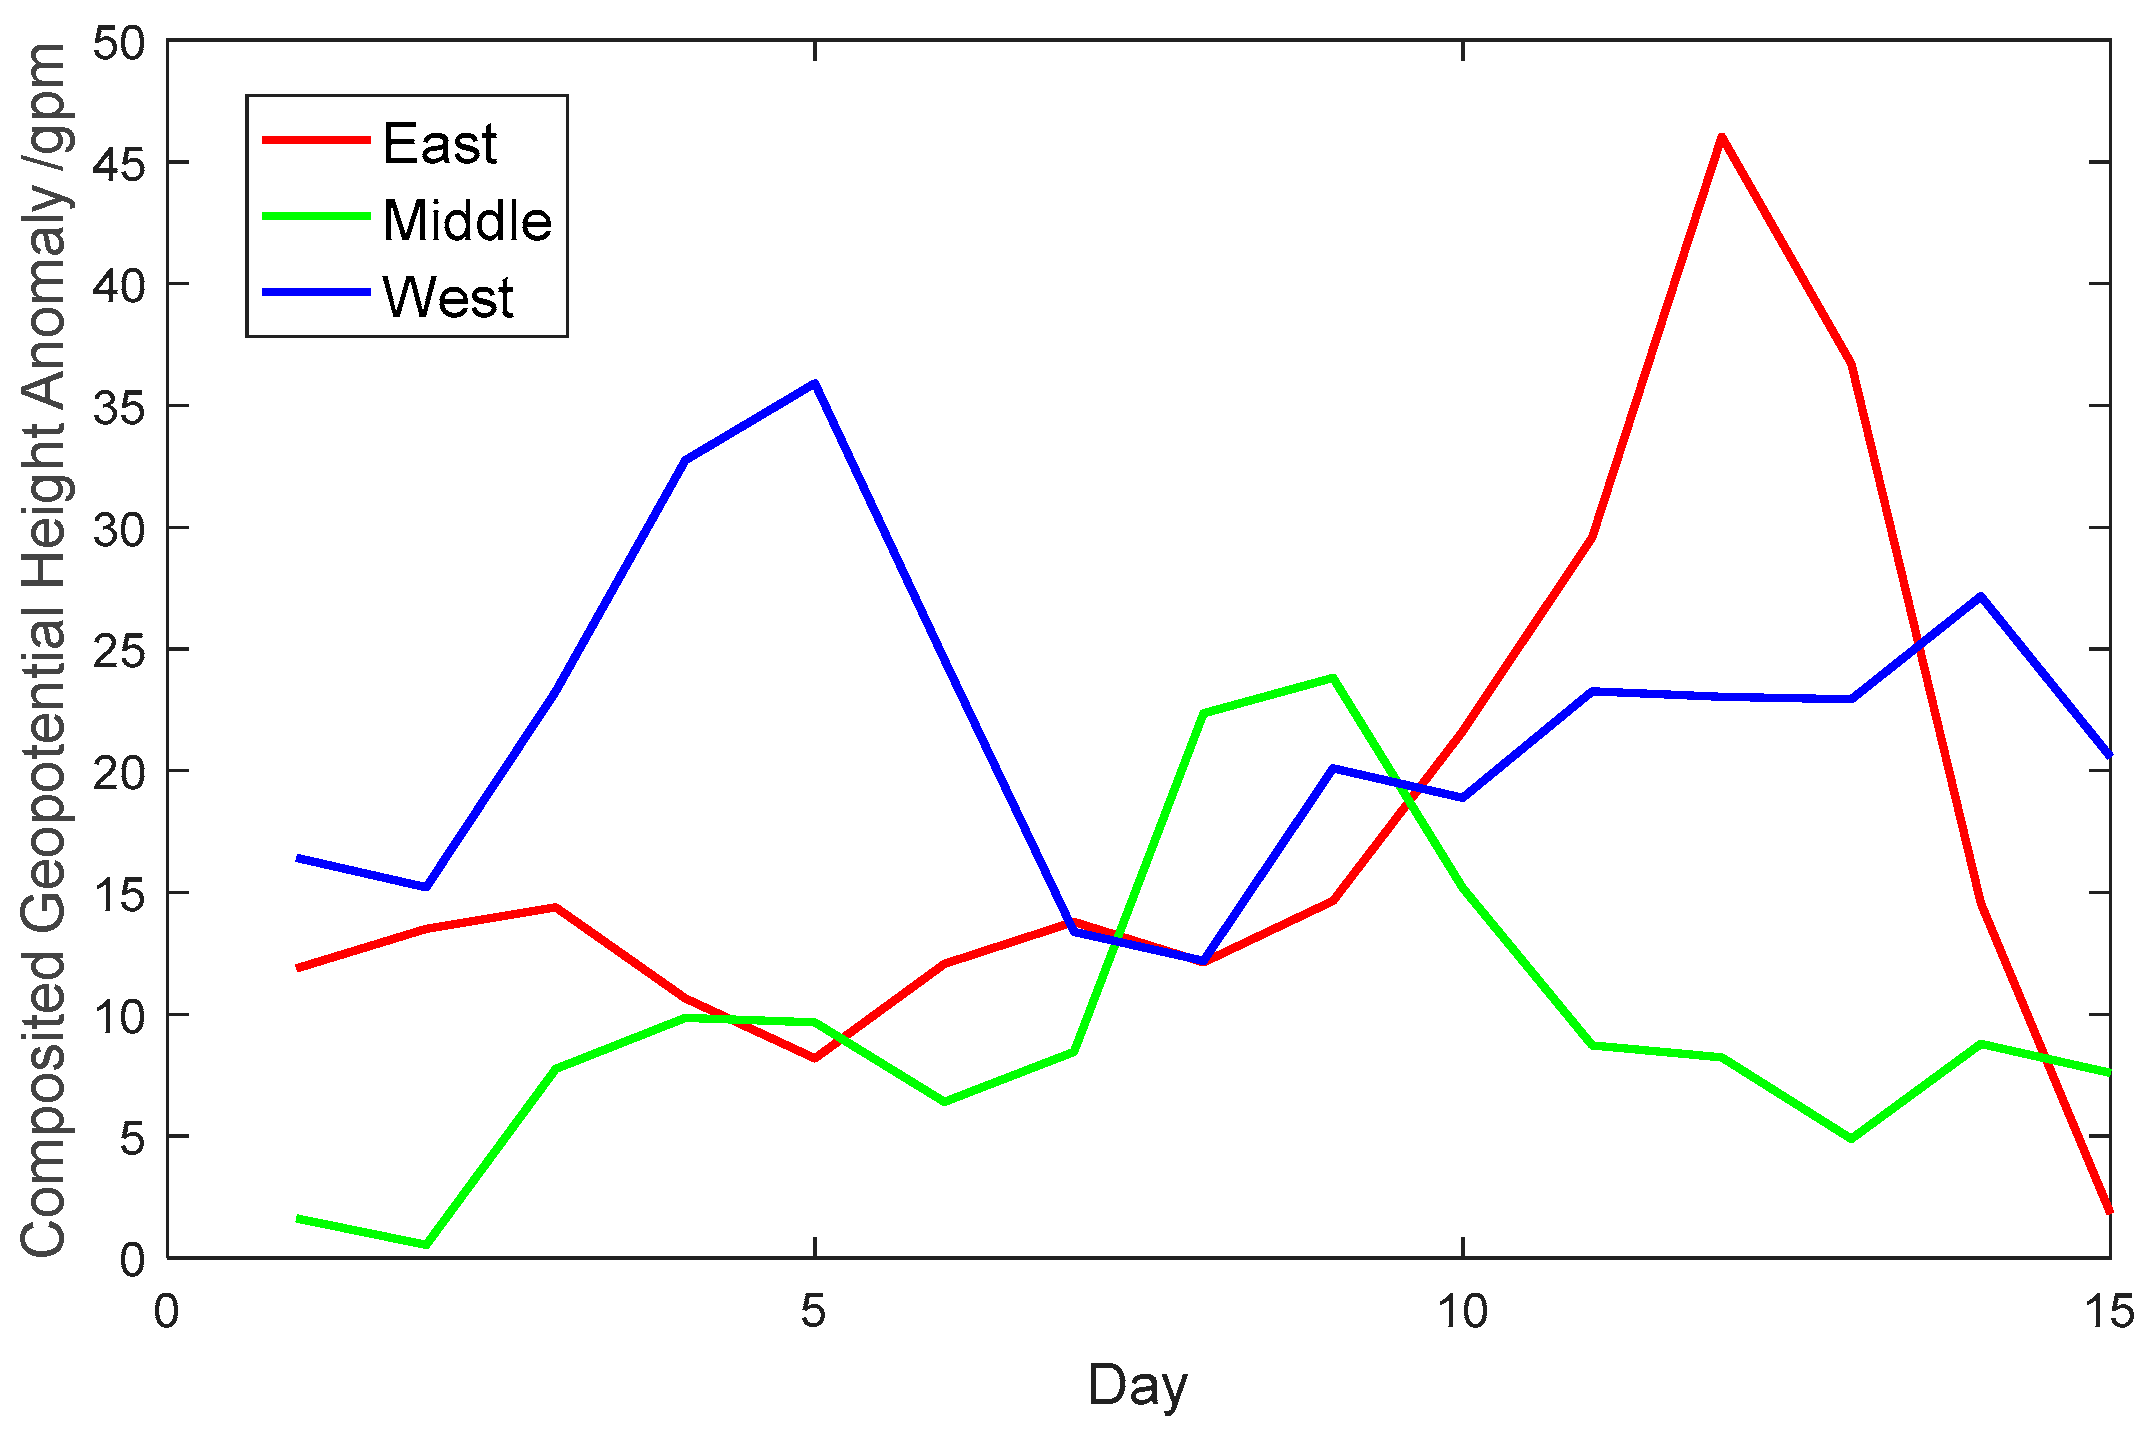
Figure 13 also shows that a high-pressure anomaly persists over Europe from the Lag −5 day to the Lag +2 day. The long-lasting high pressure indicates the existence of a blocking event over Europe that is related to the positive phase of NAO [33]. The eastward propagating wave-activity fluxes propagate continuously from the Europe blocking, a condition that implies the energy connection between upstream blocking and the action centers of the SRP. Three high-pressure centers are in relation with the process, including blocking over Europe (20° W–20° E, 40° N–70° N), the medium high-pressure anomaly over Mongolia (40° E–80° E, 40° N–70° N, the medium center), and the high-pressure anomaly over northeast Asia (110° E–160° E, 40° N–70° N, the eastern center), which evolves into the NECH. The maximum composited 500 hPa geopotential height anomalies in these three regions are shown in Figure 14; these values are considered the amplitudes of the action centers. The result shows that the development of the three action centers illustrates a lead-lag process. The amplitude of the blocking circulation first develops 10 days before the extreme precipitation day (Lag −10 day), reaches its maximum at Lag −7 day, and then decays to its minimum at Lag −4 day. The medium center intensifies during the decay of the blocking and reaches its maximum on Lag −3 day. The decay of the medium center is accompanied by the amplification of the eastern center, which reaches a maximum at Lag 0 day. This significant lead-lag connection among the three high-pressure anomalies confirms that the amplification of the NECH is a result of the existence of blocking over Europe.

3.3.3. Seasonal Background

The connection between extreme precipitation and blocking activities at the interannual time scale are reflected in seasonal background circulation patterns. The July and August mean 500 hPa geopotential height anomalies are composited according to the extreme precipitation years and normal precipitation years (Figure 15a,b). The most prominent characteristic of the composited fields is the negative phase of the SRP over the Asian continent. The three action centers of the SRP, showing positive-negative-positive geopotential height anomalies, align along the Asian jet from west to the east over 60° E, 90° E, and 120° E, respectively. Meanwhile, the composite 500 hPa geopotential height for the normal precipitation years shows no obvious high-pressure anomaly over the European continent and a weak positive SRP over the Asian continent. The negative phase of the SRP corresponding to the extreme precipitation years is very similar to the leading mode of the summer 200 hPa geopotential height anomaly, the CGT [35], which is considered the interannual component of the SRP and is connected to tropical heating anomalies [22]. Chen and Huang [22] indicated that the tropical heating anomalies most responsible for the CGT pattern are located over the North Indian Ocean. Their result is supported in this study. The composite one-month-leading (June–July mean) tropical sea surface temperature (SST) anomaly pattern of the extreme precipitation years shows significant positive SST anomalies over the northern Indian Ocean (Figure 16). Hong and Lu [36] further indicated that the negative SST anomalies over the tropical central and eastern Pacific of the preceding spring lead to significantly cooler tropical tropospheric temperatures in summer and induced the northward displacement of the Asian jet and the negative phase of the SRP. The composite SST anomaly pattern of the extreme precipitation years also shows negative anomalies over the central and eastern tropical Pacific.
In the composited July and August mean geopotential height anomaly field (Figure 15), the subpolar wave train is also significant, especially the high-pressure anomaly over the European continent. Because a blocking anticyclone develops through the interaction of an incipient high-pressure anomaly with preexisting synoptic-scale perturbations [37], the high-pressure anomaly over the European continent indicates the tendency of European blocking. Thus, the background European high and negative phases of the SRP can be regarded as preconditions for the amplification of the high-pressure anomaly over NECH and extreme precipitation over the YRLV. However, we do not observe an obvious intensification and westward extension of the main body of the WPSH in the composited July and August mean circulation pattern for the extreme precipitation years. There is only a strong high-pressure anomaly from NECH to Japan. This July and August mean high-pressure anomaly is often called the Bonin high [19], which is a stationary barotropic ridge that occurs after Meiyu in late summer near Japan. Enomoto et al. [19] indicated that the Bonin high is formed as a result of the propagation of the SRP along the Asian jet in the upper troposphere. The existence of the Bonin high provides a condition for the west and north stretch of the WPSH at the subseasonal time scale. Therefore, the spatial pattern of the subpolar stationary wave over the Eurasian continent and the phase of the SRP are responsible for the interannual variability of extreme precipitation over the YRLV. The occurrence of blocking events stimulates the subseasonal evolution of extreme precipitation.

4. Discussion

4.1. Extreme Precipitation Days

The first EOF of the interannual summer extreme precipitation variability over China shows a distinct loading over the YRLV and has the same sign as the interannual summer extreme precipitation variability over South China but an opposite sign as that over the Yangtze River basin. This result indicates that the interannual variabilities of extreme precipitation over the YRLV could be influenced by large-scale circulation and could be connected to the lower latitude circulation system.
Previous studies show the variations of rainfall at the middle and upper reaches of the Yellow River [14] or the climatology variation of days with heavy rain in YRLV [2]. This study further reveals the spatial and temporal distribution of extreme precipitation days over the YRLV region. The distribution of the local summer extreme precipitation days over the YRLV (Figure 3a) shows a homogenous mode. The action center is located over the northwest YRLV. Summer extreme precipitation accounts for a large amount of the total summer rainfall in the YRLV region, especially over the northwest part of it. The extreme precipitation occupies more than 30% of the total amount of summer precipitation in the northwest YRLV (Figure 3b), indicating that extreme precipitation has a critical influence on the local dry climate. Most of the extreme precipitation events occur simultaneously over fewer than three stations and persist for 1–2 days (Figure 4).

4.2. Atmospheric Circulations

The YRLV is in the boundary belt of the summer monsoon [38]. The edge of the summer monsoon circulation expands the most northward in late July and then retreats southward [38]. After the retreat of the summer monsoon, the SRP becomes obvious in July and August [29], during which the YRLV and its surroundings are under the control of the SRP. Thus, the background circulations over the YRLV in the early summer are different from those over the YRLV in the mid to late summer. Summer monsoon-induced rainfall mostly occurs over the southeast part of the YRLV, and the impact of the summer monsoon usually ends in July. Most of the extreme precipitation (nearly 90% of the total summer extreme precipitation) in the YRLV occurs in July and August, a period that is consistent with the results showing that extreme precipitation in the YRLV is induced by the amplification of the SRP.
The composite 500 hPa and 300 hPa circulations at Lag −1 day and Lag 0 day of both the regional extreme and normal precipitation events show high-pressure anomalies over NECH (Figure 6, Figure 7, Figure 8 and Figure 9) and a negative phase of the SRP over the Eurasia continent. This means that either normal precipitation or extreme precipitation is connected to the high-pressure anomalies over NECH. However, this high-pressure anomaly is much stronger for extreme precipitation. The strong high-pressure anomaly induces enhanced water vapor transport from the Bay of Bangle or the northwest Pacific, which results in extreme precipitation in the YRLV.
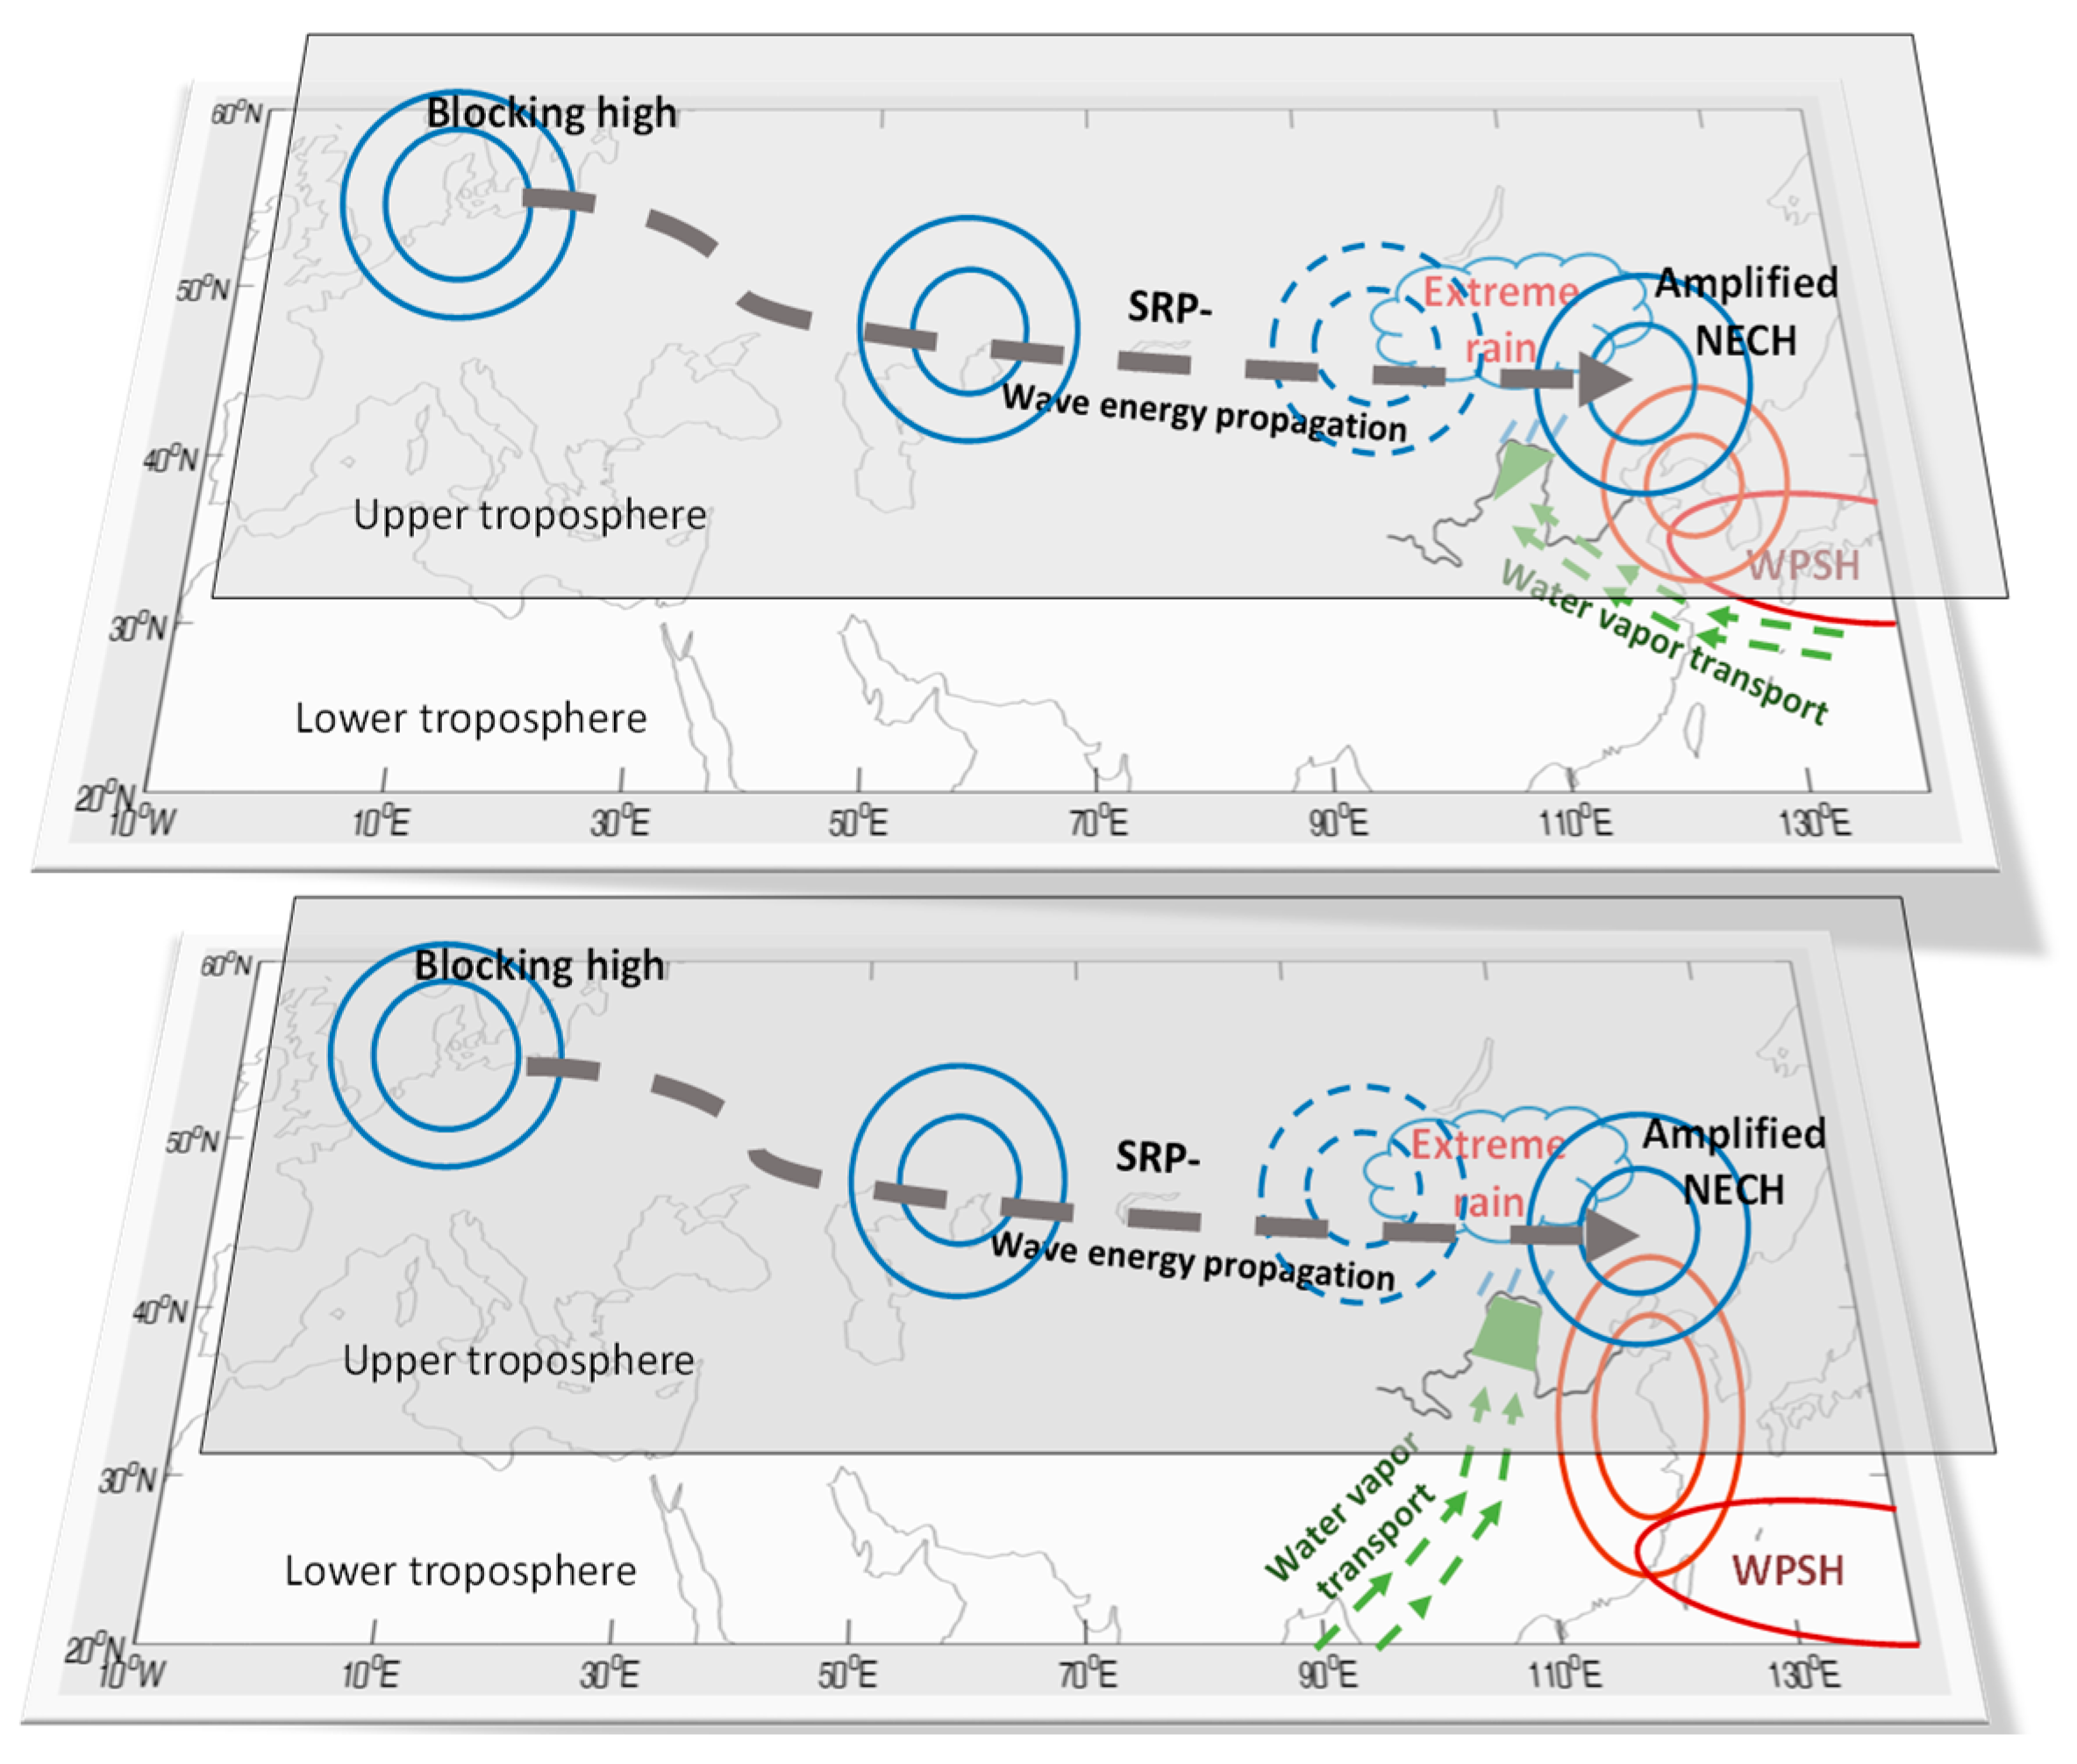
Various studies have indicated that the SRP significantly affects climate over a broad area [20,21,22,39]. In this study, it was found that Rossby wave energy propagates in a southeastward direction from the European blocking to the SRP and eventually amplifies the NECH, the eastern action center of the SRP in the upper troposphere. The schematic diagram in Figure 17 shows the subseasonal procedure by which blocking amplifies the NECH a36.
d leads to extreme precipitation over the YRLV.
The lower troposphere anti-cyclonic circulation with a center over the Bohai Sea is the lower-level reflection of the NECH, whose spatial pattern is modulated by the location of the WPSH, as shown in the composited 500 hPa circulations of the CE-1 and CE-2 at Lag 0 day (Figure 6 and Figure 7). The amplified NECH and the WPSH strengthen the water vapor transport and determine the pattern of water vapor transport and the location of extreme precipitation over the YRLV (Figure 7). For the REP events in CE-2/CE-1, the southerly flow along the west of the high-pressure anomaly over the NECH relays the water vapor transport from the Bay of Bengal/northwest Pacific along the west and south of the intensified WPSH.
The composited 500 hPa background circulation pattern for the extreme precipitation years does not illustrate the westward extension of the main body of the WPSH; there is a significant high-pressure anomaly covering a broad region from the Bohai Sea to Japan that is similar to the Bonin high (Figure 15). This high pressure is considered a result of the propagation of the SRP along the Asian jet [19]. The apparent westward extension of the 5880 gpm contour in the composite Lag −1 day and Lag 0 day of the REP events can be considered the result of both the amplification of the Bonin high and the daily evolution of the WPSH. This is consistent with many earlier studies that indicated that an isolated high pressure exists west of Japan in flood years [14,40]. However, these studies did not discuss extreme precipitation. As shown in the present study, extreme precipitation occurring after the retreat of the summer monsoon circulation is a critical supplement for the drier northwest YRLV, which always leads to drought or flood summers in this region.
The composited July and August mean 500 hPa geopotential anomaly for the extreme precipitation years shows a high-pressure anomaly over the European continent and a negative phase of the SRP along the Asian jet (Figure 15). The former provides a background for the occurrence of European blocking, and the latter provides an explanation for the preexistence of the NECH and a linkage between European blocking and the amplification of the NECH. Thus, the interannual variation in the extreme precipitation over the YRLV is mainly reflected by the phase of the SRP and the stationary waves over Europe, which are considered to be connected to the tropical heating over the north Indian Ocean and the tropical Pacific (Figure 16). The occurrence of blocking events stimulates the subseasonal evolution of extreme precipitation.

5. Conclusions

This study analyses the features of extreme precipitations in summer over YRLV, as well as the corresponding circulation characteristics. Based on the analysis of regional extreme precipitation events, the circulation field of extreme precipitation can be divided into two clusters. Enhanced high pressure over northeast China (NECH) and the western Pacific subtropical high (WPSH) are the key factors causing extreme precipitation. The intensified southerly flow of the amplified NECH strengthens the water vapor transport induced by the westward extension of the WPSH from the northwest Pacific or Bay of Bengal into the YRLV. Extreme precipitation occurs over the northwest/central region of the YRLV when the WPSH is located north/south of 30° N.
There is a high anomaly of blocking frequency for extreme precipitation years. Additionally, the NECH is amplified by the wave energy propagating from European blocking via the Silk Road pattern.

Author Contributions

Formal analysis, P.H.; Investigation, Y.D, P.H. and K.X.; Writing—original draft preparation, Y.D.; Writing—review and editing, K.X. All authors have read and agreed to the published version of the manuscript.

Funding

The authors acknowledge support from the National Key Basic Research Project of China (Grant 2019YFA0607002), the National Science Founding of Shandong Province of China on Major Basic Research Program (ZR2019ZD12), National Natural Science Foundation of China (Grant 42075025).

Institutional Review Board Statement

Not applicable.

Informed Consent Statement

Not applicable.

Data Availability Statement

Precipitation data are from Climate Data Center (CDC) of the National Meteorological Center of the China Meteorological Administration; The reanalysis data are provided by the NOAA PSL, Boulder, Colorado, USA, from their website at https://psl.noaa.gov (accessed on 17 May 2022).

Conflicts of Interest

The authors declare no conflict of interest.

References

  1. Wang, H.J.; Yang, Z.S.; Saito, Y.; Liu, J.P.; Sun, X.X. Interannual and seasonal variation of the Huanghe (Yellow River) water discharge over the past 50 years: Connections to impacts from ENSO events and dams. Glob. Planet. Chang. 2006, 50, 212–225. [Google Scholar] [CrossRef]
  2. Cai, M.; Zhang, Z. Characteristic analysis on climatological variation of precipitation days with heavy and above rain intensities over Hetao region. Torrential Rain Disasters 2014, 33, 401–406, (In Chinese with English Abstract). [Google Scholar]
  3. Chen, S.; Liu, B.; Tan, X.; Huang, Z. Characteristics and Circulation Background of Extreme Precipitation over East China. Nat. Hazards 2019, 99, 537–552. [Google Scholar] [CrossRef]
  4. Li, Y.; Leung, L.R. Potential Impacts of the Arctic on Interannual and Interdecadal Summer Precipitation over China. J. Clim. 2013, 26, 899–917. [Google Scholar] [CrossRef]
  5. Wang, W.P.; Yang, X.Q.; Xie, Y.J.; Zou, Y.C.; Fang, J.B.; Xie, Q. Spatio-temporal variation of seasonal extreme wet days in china and its relationship with sst anomalies. J. Trop. Meteorol. 2012, 18, 485–493. [Google Scholar] [CrossRef]
  6. Zhao, Y.; Xu, X.; Huang, W.; Wang, Y.; Xu, Y.; Chen, H.; Kang, Z. Trends in Observed Mean and Extreme Precipitation within the Yellow River Basin, China. Theor. Appl. Climatol. 2019, 136, 1387–1396. [Google Scholar] [CrossRef] [Green Version]
  7. Cong, Z.T.; Yang, D.W.; Gao, B.; Yang, H.B.; Hu, H.P. Hydrological trend analysis in the Yellow River basin using a distributed hydrological model. Water Resour. Res. 2009, 45, W00A13. [Google Scholar] [CrossRef]
  8. Wang, C.; Yang, J.; Yang, K.; Zhang, F.; Zhang, S.; Li, K.; Yang, Y. Changing Precipitation Characteristics in the Yellow River Basin in the Last 60 Years and Tendency Prediction for next 30 Years. Arid Zone Res. 2022, 39, 708–722. [Google Scholar] [CrossRef]
  9. Zhai, P.M.; Zhang, X.B.; Wan, H. Trends in total precipitation and frequency of daily precipitation extremes over China. J. Clim. 2005, 4, 1096–1107. [Google Scholar] [CrossRef]
  10. Wang, Z.Y.; Ding, Y.H. Climatic Characteristics of Rainy Seasons in China. Chin. J. Atmos. Sci. 2008, 32, 1–13. [Google Scholar]
  11. Yihui, D.; Chan, J.C.L. The East Asian Summer Monsoon: An Overview. Meteorol. Atmos. Phys. 2005, 89, 117–142. [Google Scholar] [CrossRef]
  12. Shao, P.C.; Li, D.L.; Wang, C.X. Spatial and Temporal Changes of Summer Rain the Yellow River Basin and Its Relation to the East Asia Subtropical Westerly Jet in Last 50 year. Plateau Meteorol. 2015, 34, 347–356, (In Chinese with English abstract). [Google Scholar]
  13. Wang, X.C.; Wu, G.X. The analysis of the relationship between the spatial modes of summer precipitation anomalies over China and the general circulation. Chin. J. Atmos. Sci. 1997, 21, 34–42. [Google Scholar]
  14. Wang, N.; Li, D.L.; Zhang, J. Variations and circulation pattern of drought and flood in summer at middle and upper reaches of Yellow River. Arid Land Geogr. 2012, 35, 754–763, (In Chinese with English abstract). [Google Scholar]
  15. Yuan, H.M.; Li, R.Q. Rainstorm Characteristics of “7.19”Hetao Area dur-ing the Process of Sub-tropical High Northward Jumping. J. Agric. Catastrophol. 2018, 8, 24–28, (In Chinese with English abstract). [Google Scholar] [CrossRef]
  16. Fan, B. The cause analysis of a Rainstorm in Hetao region in 2012. Meteorol. J. Inter Mong. 2017, 4. (In Chinese with English abstract). [Google Scholar] [CrossRef]
  17. Zhang, Y.; Zhang, Q.; Ye, D.X.; Chen, X.Y.; Shang, Z.D. Analysis of rain-water logging in the Yellow River and the Yangtze River basins during 1951-2006. Adv. Clim. Change Res. 2009, 5, 226–230, (In Chinese with English abstract). [Google Scholar]
  18. Wang, C.X.; Li, D.L. Analysis of the inter-annual variation of the summer precipitation over the Yellow River basin and the effect factors based on MTM-SVD method. Chin. J. Atmos. Sci. 2012, 36, 823–834, (In Chinese with English abstract). [Google Scholar]
  19. Enomoto, T.; Hoskins, B.J.; Matsuda, Y. The formation mechanism of the Bonin high in August. Q. J. R. Meteorol. Soc. 2003, 129, 157–178. [Google Scholar] [CrossRef]
  20. Lu, R.Y.; Oh, J.H.; Kim, B.J. A Teleconnection Pattern in Upper-Level Meridional Wind over the North African and Eurasian Continent in Summer. Tellus, Ser. A: Dyn. Meteorol. Oceanogr. 2002, 54, 44–55. [Google Scholar] [CrossRef]
  21. Huang, G.; Liu, Y.; Huang, R. The Interannual Variability of Summer Rainfall in the Arid and Semiarid Regions of Northern China and Its Association with the Northern Hemisphere Circumglobal Teleconnection. Adv. Atmos. Sci. 2011, 28, 257–268. [Google Scholar] [CrossRef]
  22. Chen, G.S.; Huang, R.H. Excitation mechanisms of the teleconnection patterns affecting the July precipitation in Northwest China. J. Clim. 2012, 25, 7834–7850. [Google Scholar] [CrossRef]
  23. Chowdary, J.S.; Hu, K.; Srinivas, G.; Kosaka, Y.; Wang, L.; Rao, K.K. The Eurasian Jet Streams as Conduits for East Asian Monsoon Variability. Curr. Clim. Change Rep. 2019, 5, 233–244. [Google Scholar] [CrossRef]
  24. Saeed, S.; van Lipzig, N.; Müller, W.A.; Saeed, F.; Zanchettin, D. Influence of the Circumglobal Wave-Train on European Summer Precipitation. Clim. Dyn. 2014, 43, 503–515. [Google Scholar] [CrossRef]
  25. Kosaka, Y.; Nakamura, H.; Watanabe, M.; Kimoto, M. Analysis on the dynamics of a wave-like teleconnection pattern along the summertime Asian jet based on a reanalysis dataset and climate model simulations. J. Meteorol. Soc. Jpn. 2009, 87, 561–580. [Google Scholar] [CrossRef] [Green Version]
  26. Kalnay, E.; Kanamitsu, M.; Kistler, R.; Collins, W.; Deaven, D.; Gandin, L.; Iredell, M.; Saha, S.; White, G.; Woollen, J.; et al. The NCEP/NCAR 40-Year Reanalysis Project. Bull. Am. Meteorol. Soc. 1996, 77, 437–472. [Google Scholar] [CrossRef] [Green Version]
  27. Alexander, L.V.; Zhang, X.; Peterson, T.C. Global observed changes in daily climate extremes of temperature and precipitation. J. Geophys. Res. 2006, 111, D05109. [Google Scholar] [CrossRef] [Green Version]
  28. Storch, H.; Zwiers, F. Empirical Orthogonal Functions. In Statistical Analysis in Climate Research; Cambridge University Press: Cambridge, UK, 1999; pp. 293–316. ISBN 9780511612336. [Google Scholar]
  29. Diao, Y.N.; Li, J.P.; Luo, D.H. A New Blocking Index and Its Application: Blocking Action in the Northern Hemisphere. J. Clim. 2006, 19, 4819–4839. [Google Scholar] [CrossRef]
  30. Anderberg, M.R. Cluster Analysis for Applications; Academic Press: New York, NY, USA, 1973; p. 359. ISBN 978-0-12-057650-0. [Google Scholar]
  31. Takaya, K.; Nakamura, H. A formulation of a phase-independent wave-activity flux for stationary and migratory quasigeostrophic eddies on a zonally varying basic flow. J. Atmos. Sci. 2001, 58, 608–627. [Google Scholar] [CrossRef]
  32. Kosaka, Y.; Chowdary, J.S.; Xie, S.P.; Min, Y.M.; Lee, J.Y. Limitations of seasonal predictability for summer climate over East Asia and the Northwestern Pacific. J. Clim. 2012, 25, 7574–7589. [Google Scholar] [CrossRef]
  33. Luo, D. Dynamics of eddy-driven lowfrequency dipole modes. Part I: A simple model of North Atlantic Oscillations. J. Atmos. Sci. 2007, 64, 3–28. [Google Scholar] [CrossRef]
  34. Ren, X.; Yang, X.Q.; Sun, X. Zonal oscillation of western Pacific subtropical high and subseasonal SST variations during Yangtze persistent heavy rainfall events. J. Clim. 2013, 26, 8929–8946. [Google Scholar] [CrossRef]
  35. Ding, Q.H.; Wang, B. Circumglobal Teleconnection in the Northern Hemisphere Summer. J. Clim. 2005, 18, 3483–3505. [Google Scholar] [CrossRef]
  36. Hong, X.; Lu, R. The Meridional Displacement of the Summer Asian Jet, Silk Road Pattern, and Tropical SST Anomalies. J. Clim. 2016, 29, 3753–3766. [Google Scholar] [CrossRef]
  37. Luo, D.H. A barotropic envelope Rossby soliton model for block-eddy interaction. Part II: Role of westward-traveling planetary waves. J. Atmos. Sci. 2005, 62, 22–40. [Google Scholar] [CrossRef]
  38. Tang, X.; Qian, W.H.; Liang, P. Climatic Features of Boundary Belt for East Asian Summer Monsoon. Plateau Meteorol. 2006, 25, 375–381, (In Chinese with English abstract). [Google Scholar]
  39. Enomoto, T. Interannual Variability of the Bonin High Associated with the Propagation of Rossby Waves along the Asian Jet. J. Meteorol. Soc. Jpn. 2004, 82, 1019–1034. [Google Scholar] [CrossRef] [Green Version]
  40. Li, J.; Li, D.L.; Zhang, J. Characteristics of water vapor transportation and budget of winter and summer in the Yellow River Basin. Plateau Meteorol. 2012, 31, 342–350, (In Chinese with English abstract). [Google Scholar]
Figure 1. The methods used in this study and research processes.
Atmosphere 13 01140 g001
Figure 2. First EOF of the station-based summer extreme precipitation days in China, which explains 8.2% of the total variance. The red rectangle with the dashed line is defined as the YRLV region.
Atmosphere 13 01140 g002
Figure 3. (a) The first EOF mode of the station-based extreme precipitation days (explaining 18.8% of the total variance); the black dots indicate the spatial distribution of the selected stations over the YRLV. The region enclosed by a red solid line is the key region used to define the REP over the YRLV. (b) The ratio of summer extreme precipitation to total summer precipitation over the YRLV; the shaded region denotes that the ratio exceeds 0.33 (33%).
Atmosphere 13 01140 g003
Figure 4. Interannual variability in the number of the REP days over the YRLV (gray bar) and the PC of the first EOFs (PC1, dashed line) of the station-based extreme precipitation days (a) and the power spectrum of PC1 (b).
Atmosphere 13 01140 g004
Figure 5. The number of cases of REP events versus the number of stations (a) and the persistence days (b).
Atmosphere 13 01140 g005
Figure 6. Composites of 500 hPa geopotential height anomalies (contour, units: gpm) and 850 hPa wind velocity (vector, unit: m·s−1) (a,c) and of 300 hPa geopotential height anomalies (b,d) at Lag 0 days of the REP events in CE-1 (a,b) and CE-2 (c,d); the blue shaded regions indicate the zonal wind velocity (larger than 15 m/s) at 300 hPa, ‘Hb’ indicates the blocking high, and ‘H’ and ‘L’ indicate the high- and low-pressure anomalies, respectively. The clusters are based on all Lag 0 days of the REP events. The gray shaded areas in (a,c) indicate elevations > 3200 m.
Atmosphere 13 01140 g006
Figure 7. Composites of the 850 hPa water vapor transportation (vector, units: m·kg·s−1·kg−1) and divergence (colored shading, same for all subplots, units: kg·s−1·kg−1 ) and of 500 hPa geopotential height (black contour, units: gpm) at Lag −1 day (a,c) and Lag 0 day (b,d) for the REP events in CE-1 (a,b) and CE-2 (c,d). The 5880 gpm contour and the climatologic July and August mean 5880 gpm contours are highlighted as a thick red line and thick blue line, respectively. The gray shaded areas indicate elevations > 3200 m.
Atmosphere 13 01140 g007
Figure 8. Composites of 500 hPa geopotential height anomalies (contour, units: gpm) and 850 hPa wind velocity (vector, unit: m·s−1) (a,c) and of 300 hPa geopotential height anomalies (b,d) at Lag 0 days of the normal precipitation events in CN-1 (a,b) and CN-2 (c,d); the blue shaded regions indicate the zonal wind velocity (larger than 15 m/s) at 300 hPa, ‘Hb’ indicates the blocking high, and ‘H’ and ‘L’ indicate the high- and low-pressure anomalies, respectively. The clusters are based on all Lag 0 days of the normal precipitation events. The gray shaded areas in (a,c) indicate elevations > 3200 m.
Atmosphere 13 01140 g008
Figure 9. Composites of the 850 hPa water vapor transportation (vector, units: m·kg·s−1·kg−1) and divergence (colored shading, same for all subplots, units: kg·s−1·kg−1 ) and of 500 hPa geopotential height (black contour, units: gpm) at Lag −1 day (a,c) and Lag 0 day (b,d) for the normal precipitation events in CN-1 (a,b) and CN-2 (c,d). The 5880 gpm contour and the climatologic July and August mean 5880 gpm contours are highlighted as a thick red line and thick blue line, respectively. The gray shaded areas indicate elevations > 3200 m.
Atmosphere 13 01140 g009
Figure 10. The difference (extreme minus normal) of the composited water vapor transport (vectors, m·kg·s−1·kg−1) and its divergence (color shadings) (a,b) and of the composited 500 hPa geopotential height (contours) and 850 hPa wind vector (vectors, m·s−1) (c,d) between the composites based on the Lag −1 days of the events in CE-1 and CN-1 (a,c) and in CE-2 and CN-2. The red dots denote the 95% confidence level.
Atmosphere 13 01140 g010
Figure 11. Composite of the total rainfall amount (mm/day) over the YRLV for the events in CE-1 (a), CE-2 (b), CN-1 (c), and CN-2 (d); the gray dots denote the 95% confidence level.
Atmosphere 13 01140 g011
Figure 12. Composites of the blocking frequency anomalies for extreme precipitation years (a) and normal precipitation years (b). The contour interval is 2; shading denotes the 95% confidence level.
Atmosphere 13 01140 g012
Figure 13. Composites of the Lag −5 day to the Lag +2 day 500 hPa geopotential height (contour, gpm) and 300 hPa Rossby wave activity (vector, m 2 / s 2 ) for the REP events. The gray dots indicate the 95% confidence level.
Atmosphere 13 01140 g013
Figure 14. Temporal evolution of the three high-pressure anomaly centers: blocking high over the European continent (the blue line, located at 20° W–20° E; 40° N–70° N), the high-pressure anomaly over Mongolia (the green line, located at 40° E–80° E; 40° N–70° N), and the high-pressure anomaly over the west of Japan (the red line, located at 110° E–160° E; 40° N–70° N).
Atmosphere 13 01140 g014
Figure 15. Composites of the July and August mean 500 hPa height anomaly for the extreme precipitation years (a) and normal precipitation years (b). The shading denotes the 90% confidence level, the dashed/solid lines indicate negative/positive values, and the contour interval is 4 gpm.
Atmosphere 13 01140 g015
Figure 16. Composite of the June−July mean SST anomalies (°C) for extreme precipitation years.
Atmosphere 13 01140 g016
Figure 17. A schematic diagram showing how European blocking causes the occurrence of extreme precipitation over the YRLV under the combined action of the negative phase of the Silk Road pattern (SRP—the blue circles over mid-latitude Asia) and the western Pacific high (WPSH, the red solid arc). The Rossby wave energy (the thick dashed gray curve with arrows denoting the pattern and direction of the wave energy propagation) propagates in a southeastward direction from the European block to the SRP, amplifying the northeast China high (NECH), the eastern action center of the SRP in the upper troposphere. The lower troposphere anti-cyclonic circulation with a center over the Bohai Sea is the lower-level reflection of the NECH, which has a spatial pattern modulated by the location of the WPSH. The combined effect of the amplified NECH and the WPSH strengthens the water vapor transport and determines the water vapor transport pattern and location of extreme precipitation over the YRLV.
Atmosphere 13 01140 g017
Publisher’s Note: MDPI stays neutral with regard to jurisdictional claims in published maps and institutional affiliations.