Abstract
PM2.5 and PM10 in the atmosphere seriously affect human health and air quality, a situation which has aroused widespread concern. In this paper, we analyze the temporal and spatial distribution of PM2.5 and PM10 concentrations from 2016 to 2021 based on real-time monitoring data. In addition, we also explore the influence of meteorological conditions on pollutants. The results show that PM2.5 and PM10 concentrations are similarly distribution in temporal and spatial from 2016 to 2021, and the average concentrations of both show a decreasing trend. The ratio of PM2.5 to PM10 is decreasing, indicating that the proportion of fine particles is declining. PM2.5 and PM10 concentrations are higher in spring and winter, but lower in summer. Spatially, it shows a gradual shift from the characteristic of “high in the south and low in the north” to a uniform homogenization across districts. The spatial distribution of PM2.5 and PM10 mass concentrations is synchronous by applying empirical orthogonal functions (EOF). The first EOF pattern exhibits a consistent characteristic of high in the southeast and low in the northwest. The second pattern EOF reflects the effect of impairing PM2.5 concentrations in the southeast during the winter of 2016–2018. The PM2.5 and PM10 concentrations are significantly negatively correlated with wind speed and precipitation in both spring and winter. On the other hand, from the perspective of the circulation situation, the southeasterly and weak westerly wind in spring produce convergence resulting in higher particulate matter concentrations in the south than in the north in Beijing. The westerly wind is flatter at 700 hPa geopotential height, which is conducive to the formation of stationary weather. The vertical direction of airflow in spring and winter is dominated by convergence and sinking, indicating the weak dispersion ability of the atmosphere. The reason for the accumulation of particulate matter at the surface is investigated, which is beneficial to provide the theoretical basis for air quality management and pollution control in Beijing.
1. Introduction
Beijing is the political, economic, and cultural center of China, and the condition of the air quality has caused widespread concern within the society and government. Wang et al. [1] noted that the Beijing–Tianjin–Hebei region, north of the Yangtze River and east of the Hu Huanyong Line, is one of the most polluted regions in China. PM2.5 is particulate matter with a kinetic diameter of less than or equal to 2.5 μm in the atmosphere, also known as atmospheric fine particulate matter. PM10 refers to particulate matter with a kinetic diameter of less than or equal to 10 μm in the atmosphere, also known as inhalable particulate matter. PM2.5 and PM10 affect atmospheric visibility by affecting the scattering of light and reducing the contrast between the target and the atmosphere. Moreover, the radiation balance is affected by the scattering and absorption of particulate matter, which in turn affects the global climate [2,3,4]. Heavy metals in PM2.5 have significant carcinogenic and non-carcinogenic risks, which seriously affect human health [5,6,7].
The investigation of spatial differences and temporal variation patterns is an important part of the research on air pollution [8]. A study found higher levels of PM2.5 concentrations in Mexico in winter and spring using the MERRA-2 reanalysis datasets, with the highest concentrations occurring in spring [9]. Fine particulate matter in the United States has shown a decreasing trend over time in recent decades [10]. Qu et al. [11] believed that PM2.5 has a spatial spillover effect. The PM2.5 concentrations in 2013 had a wide range of fluctuations over time in Beijing throughout the year, with several sawteeth [12]. In 2013, the State Council explicitly proposed the establishment of a collaborative mechanism for pollution prevention and control in the Beijing–Tianjin–Hebei region. PM2.5 concentrations decreased substantially in most of China, with significant reductions in the Pearl River Delta and Yangtze River Delta after 2013. However, pollution remains more severe in northern China, especially in winter [13,14,15]. The number of days with severe PM2.5 pollution (daily average concentration > 150 μg/m3) was more frequent in North China from 2013 to 2019, especially in winter [16]. Compared to 1 January–30 April 2019, the national average concentrations of PM2.5 and PM10 decreased by 14% and 15% during the same period in 2020, respectively [17]. During the COVID-19 lockdown, PM2.5 concentrations decreased 3.5 times faster in southern China than in northern [18]. It is worth noting that the level of socio-economic activity decreased in January–February 2020 in North China, but there were two heavy pollution processes [19]. Some studies have indicated that extreme unfavorable meteorological conditions may be the main reason for the increase in pollutant concentrations compared to the impact of emission reductions [20].
In recent years, various scholars have summarized the influencing factors of PM2.5 and found that precipitation and vegetation mainly contribute to the removal of PM2.5, while wind speed and direction and topography mainly influence the transport and dispersion of pollutants [21,22,23]. Different circulation situations have significant effects on the transport, accumulation and dispersion of pollutants [24,25,26]. It is suggested that the most prone circulating types of PM2.5 in Beijing are mainly south wind transport and east wind convergence [27,28,29]. Wu et al. [30] classified the persistent pollution events occurring in the Beijing–Tianjin–Hebei region from 1980 to 2013 into two categories: latitudinal westerly flow and high-pressure ridges.
Most previous studies have analyzed the relationship between pollution processes over a certain time and various meteorological factors. To further understand the distribution of particulate matter pollution in Beijing in recent years and the influence of meteorological conditions on it. We firstly analyze the spatio-temporal distribution of PM2.5 and PM10 in Beijing from 2016 to 2021 based on real-time observation data from automatic monitoring stations. Then, the EOF pattern decomposition of PM2.5 and PM10 concentrations in the last 6 years is carried out to study the main characteristics of pollutant distribution. Next, we conduct the atmospheric circulation for synthetic analysis to reveal the dominant weather systems and their dynamical and thermal characteristics in the season of high pollutant concentrations. Finally, we compare this issue with other relevant studies and explore the natural factors of the particulate matter distribution in depth in the discussion. This study provides a theoretical basis for the prediction and early warning of particulate matter pollution and for the formulation of control measures in Beijing.
2. Data and Methods
2.1. Study Area
Beijing is located at 39°26′ N~41°03′ N, 115°25′ E~117°30′ E. The total area is about 16,410.54 km2, with a length of about 176 km from north to south and a width of about 160 km from east to west. It is located at the northern edge of the North China Plain, with mountains in the west and north, and plains in the east and central part. As shown in Figure 1, the topography is low in the southeast and high in the northwest. To the east, it is about 150 km from the Bohai Sea. To the southeast, it is bordered by Tianjin and surrounded by Hebei Province. Located in the northern temperate zone, the climate type is the semi-humid temperate continental monsoon climate with four distinct seasons and uneven seasonal distribution of precipitation. Beijing currently consists of 16 districts, which are divided into five regions in this study, with reference to the study by Wang et al. [31]. They are the northwest (Changping and Yanqing districts), the northeast (Huairou, Miyun, Shunyi and Pinggu districts), the six districts of the city (Dongcheng, Xicheng, Chaoyang, Haidian, Shijingshan and Fengtai districts), the southwest (Fangshan District and Mengtougou District) and the southeast (Daxing and Tongzhou districts).
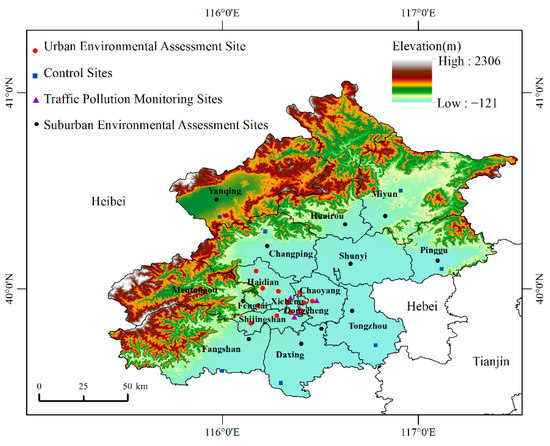
Figure 1.
Distribution of air monitoring stations in Beijing.
2.2. Data
Daily scale data of PM2.5 and PM10 mass concentrations at 35 stations in Beijing from 2016–2021 are obtained from the website of the Beijing Municipal Ecological and Environmental Monitoring Center (http://www.bjmemc.com.cn/, accessed on 28 February 2022). The stations are divided into four categories according to monitoring functions [31]. There are 12 urban environmental evaluation sites, 11 control sites, 5 traffic pollution monitoring sites, and 7 suburban environmental assessment sites (Figure 1). Some sites change after 23 January 2021, Figure 1 shows the distribution of sites until 23 January 2021. PM2.5 and PM10 mass concentrations are obtained from 35 automatic monitoring stations. We have removed sites with incomplete data in our analysis.
The instrument outputs are 5 min data, while the data obtained from the Beijing Ecological Environment Platform are hourly. The monitoring device for PM2.5 is the Thermo Fisher 1405F monitoring instrument [31]. The principle is to draw PM2.5 and PM10 particles in the ambient air at a constant flow rate through a sampling cutter inside the instrument and measure PM2.5 and PM10 concentrations [31]. This gas analysis instrument is capable of accurately measuring the concentration of particulate matter and is widely used in the study of air quality [32]. Data quality assurance is based on the Technical Regulation on Ambient Air Quality Index (on trial) (HJ633-2012).
The meteorological data of the surface observations are derived from the CN05.1 gridded observation datasets. The data are obtained by Wu et al. [33] using the daily observation data of more than 2400 national stations of the National Meteorological Data Center and interpolated by the thin-slab sample strip and angular distance weighting methods. In this paper, mean temperature (T), precipitation (PRE), wind speed (WS) and relative humidity (RH) are chosen from 1 January 2016 to 31 December 2021. In addition, the monthly data used in the analysis of circulation situation are obtained from the European Center for Medium-Range Weather Forecasts (ECMWF), including geopotential height, horizontal wind field (U-component of wind and V-component of wind), relative humidity, sea level pressure, vertical velocity and dispersion. The horizontal resolution of the above two data is also 0.25° × 0.25°.
In this paper, the data used in the analyses in this paper are based on hourly concentrations. Daily averages are obtained from the arithmetic mean of the hourly concentrations for 24 h in each day. Monthly averages are obtained from the arithmetic mean of the daily averages for each day of the month. Quarterly averages are obtained from the arithmetic mean of the monthly averages for each month in each season [31]. The annual averages are the arithmetic mean of the monthly averages in each year. PM2.5 and PM10 concentrations in Beijing are averaged across all stations. The four seasons are spring (March to May), summer (June to August), autumn (September to November), and winter (December to January and February of the following year).
2.3. Methods
2.3.1. Kriging Interpolation Method
We use the Kriging interpolation method to interpolate the station data to obtain the regional continuous distribution. The Kriging interpolation results are characterized by higher accuracy, good continuity and less fluctuation. The method is based on spatial location to influence spatial attributes. The attribute values to be interpolated are estimated by sampling point values. Considering anisotropy, the Gaussian function fits best. In this paper, drawing on the study of Wang et al. [1], we use the ordinary Kriging interpolation as the method for spatial interpolation of PM2.5 and PM10, which is calculated as:
Z(X0) in Equation (1) is the value of the unknown sampling point. λi is the weight coefficient, where the weight coefficient relies on the calculation of the variance function rather than simply by the distance; n is the number of known sample points.
2.3.2. Empirical Orthogonal Function
In order to analyze the main characteristics of the spatial variation of PM2.5 and PM10 in the last 6 years and the contribution of particulate matter concentrations at different times to the overall spatial distribution, we will choose the method of empirical orthogonal function (EOF) decomposition. EOF decomposition is a method for statistical analysis of spatial and temporal variability, mostly applied in the field of atmospheric science. It is also called eigenvector analysis or principal component analysis. The basic principle is to decompose the physical quantity field orthogonally into the product of spatial fields and temporal coefficients and extract the main eigenvectors. The spatial patterns are quantitatively reflecting the spatial distribution characteristics of the elemental fields, while the temporal coefficients capture the temporal variation.
The monthly average PM2.5 and PM10 mass concentrations at each testing site in Beijing from 2016–2021 are decomposed into a linear combination of the spatial eigenvector matrix V and the corresponding time coefficient matrix Z:
where m and n are spatial and temporal points, each column of V represents a spatially typical field of a pattern, which is only related to space. The corresponding T series is the time coefficient of the pattern, which describes the time variation characteristics of the spatial pattern.
3. Results
3.1. Temporal Variation of PM2.5 and PM10 Concentrations
Based on the hourly concentration data of PM2.5 and PM10 at each station, we obtain the average concentrations of the two particulate matters in Beijing for different dates from 2016 to 2021. The daily average concentrations of PM2.5 and PM10 in Beijing over the past 6 years are shown in Figure 2a,b, while the monthly average concentration series are presented in Figure 2c,d. According to the HJ633-2012 specifications, the 24 h national primarily standard level and secondary standard level of PM2.5 are the daily average concentration of 35 μg/m3 and 75 μg/m3, respectively. PM10 are 50 μg/m3 and 150 μg/m3, respectively. The daily average concentration curve shows that PM2.5 concentrations are relatively low from 20 May to 28 August. Additionally, the concentration level reaches its peak around December 2016 (400 μg/m3). In comparison, PM10 concentrations show high values in late March and late April, which may be related to the dusty weather in spring. From the beginning of June to the end of September, PM10 concentrations are below the national secondary standard level. The PM2.5 and PM10 concentrations in Beijing in 2020 during the COVID-19 lockdown period do not show a significant downward trend compared to the same period.
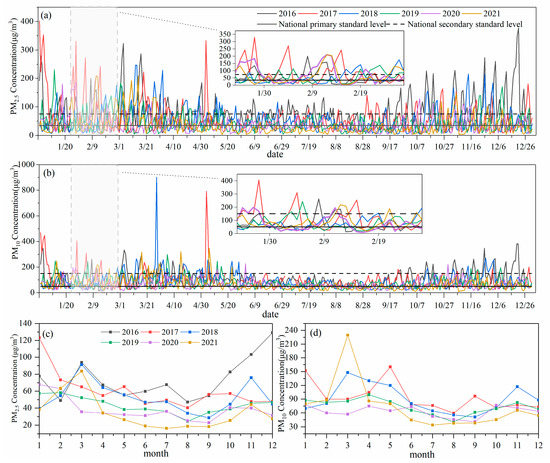
Figure 2.
Distribution of daily (a,b) and monthly (c,d) average PM2.5 and PM10 concentrations from 2016 to 2021. The subplots in figures (a,b) show the changes in PM2.5 and PM10 during the COVID-19 epidemic lockdown in Beijing (24 January–29 February 2020), respectively.
On a monthly scale, as shown in Figure 2c, PM2.5 concentrations present an overall “U” shape from 2016 to 2021, with a fluctuating downward trend from January to August and increase from August to December. Among them, there are peaks in January–March and December. The highest PM10 concentration in the last 6 years is recorded in March 2021 at 230 μg/m3 (Figure 2d). PM2.5 and PM10 concentrations show troughs in August. The annual average PM2.5 concentrations in Beijing from 2016–2021 are 74 μg/m3, 60.6 μg/m3, 52.4 μg/m3, 43.5 μg/m3, 38.4 μg/m3 and 34.8 μg/m3, respectively. For PM10, the concentrations are 101 μg/m3, 94.2 μg/m3, 89.8 μg/m3, 73.7 μg/m3, 63.2 μg/m3, 73.7 μg/m3 for the last 6 years, respectively.
The changes in PM2.5 and PM10 concentrations in Beijing for 2016–2021 appear synchronous for most of the time, showing a decrease followed by an increase in both May to October. Both higher concentrations in January and December were due to the combined effect of heating period and meteorological factors [34].
PM2.5 is characterized by its small particle size, large specific surface area, long residence time in the air and the tendency to carry harmful substances on its surface. PM2.5 is the smaller particle size fraction of PM10, the ratio of PM2.5 to PM10 mass concentration indicates the proportion of fine particulate matter to inhalable particulate matter. The overall performance of the PM2.5/PM10 ratio is wavy on the monthly scale from 2016–2021. As shown in Figure 3, the ratio of PM2.5/PM10 is very high in July, October and December, whereas the ratio is lowest in May, which is less than 0.6. The PM2.5/PM10 ratio decreases in Beijing in spring when the wind speed is higher and the dusty weather is more frequent. The average PM2.5/PM10 ratios for 2016–2021 are 0.73, 0.65, 0.59, 0.59, 0.61, and 0.49, respectively. It shows a decreasing trend, exhibiting that the proportion of fine particulate matter in Beijing is declining.
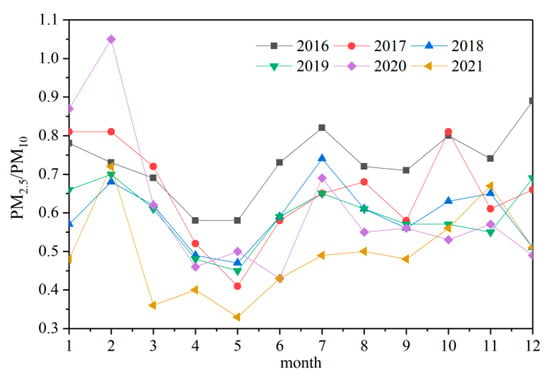
Figure 3.
Monthly average of PM2.5/PM10 ratio from 2016 to 2021.
3.2. Spatial Distribution
3.2.1. Spatial Patterns of PM2.5 and PM10 Concentrations
We apply the ordinary Kriging method to interpolate each discrete station to obtain the spatial distribution of PM2.5 and PM10 in Beijing from 2016–2021 (Figure 4 and Figure 5). PM2.5 concentration levels are generally higher in spring and winter than in summer and autumn, with significant seasonal differences. Additionally, it is an aggregation effect in areas with high mass concentrations. There is a significant decrease in PM2.5 concentrations in four seasons in 2020 and 2021. On the whole, the spatial pattern of PM2.5 concentrations distribution in Beijing over the last 6 years shows a gradual shift from “high in the south and low in the north” to a uniform homogenization across districts. As shown in Figure 4t–v, the regional differences are obvious in the winter of 2017–2019. Most parts of the southwest and southeast had concentration levels above 65 μg/m3, reaching maximum values above 100 μg/m3. On the contrary, the concentration levels in summer are lower than in other seasons, and regional differences are not evident. In conclusion, PM2.5 concentration levels have declined to varying degrees in all parts of Beijing, and the differences between districts are not significant in the last 6 years, especially in spring and winter.
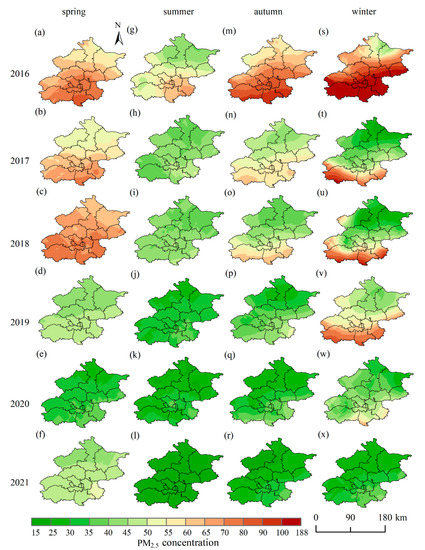
Figure 4.
Spatial distribution of PM2.5 concentration in spring (a–f), summer (g–l), autumn (m–r) and winter(s–x) from 2016 to 2021, respectively. Unit: μg/m3.
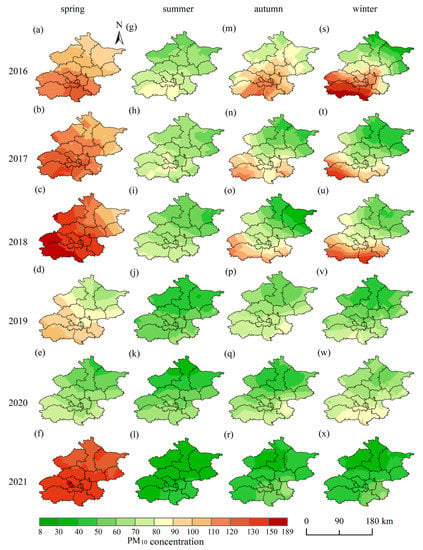
Figure 5.
Spatial distribution of PM10 concentration in spring(a–f), summer (g–l), autumn (m–r) and winter (s–x) from 2016 to 2021, respectively. Unit: μg/m3.
Figure 5 shows the spatial distribution of PM10 concentrations in different seasons from 2016 to 2021, similar to the PM2.5 distribution. In terms of different seasons, PM10 concentrations are higher in spring than in other seasons and are generally lower in summer. The PM10 concentrations are high in the 2016–2018 spring (Figure 5a–c), and the high-value center reaches more than 120 μg/m3. In particular, the concentration is greater than 100 μg/m3 in most areas in 2016. On the other hand, the PM10 concentrations in spring 2019 and 2020 are relatively low (Figure 5d,e). PM10 concentrations exhibit a semi-annular distribution pattern of “high in the south and low in the north” in winter 2016–2018, and the range of high value of concentration is shrinking (Figure 5s–u).
The spatial distribution patterns of PM2.5 and PM10 concentrations in the four seasons show consistency, especially the high-value center and low-value center show evident similarity. Meanwhile, PM2.5 and PM10 concentrations in different seasons show the characteristics of decreasing from south to north from 2016 to 2019, especially in winter, with a semi-ring-shaped distribution. This pattern is similar to the spatial distribution in 2013 and 2014. The high concentrations of PM2.5 and PM10 in the south area are related to the geographical location near heavy industrial cities, which are more influenced by regional transport, as well as closely related to regional air pollution and meteorological conditions [35]. However, the distribution of particulate matter concentrations is more even across all regions of the city in 2020 and 2021. In particular, PM2.5 concentrations show an overall decrease across all seasons compared to 2016.
3.2.2. Spatial Distribution of PM2.5/PM10 Ratio
Based on the spatial patterns of PM2.5 and PM10 concentrations, the spatial pattern of PM2.5/PM10 ratio is obtained. We can see that there are obvious seasonal variations of the PM2.5/PM10 ratios in Beijing (Figure 6). The spring ratios show an overall low trend relative to other seasons, ranging from 0.3 to 0.6 in most areas, with fewer spatial variations (Figure 6a–f). It may be influenced by the higher PM10 concentrations in spring. Conversely, the PM2.5/PM10 ratio shows significant regional differences from north to south in summer and autumn. For winter, the overall performance of the ratio is higher in 2016, 2019 and 2021, especially the PM2.5/PM10 ratio is higher than 0.85 in most regions in 2016 and 2019 (Figure 6s,v,x). It can be seen that both PM2.5 and PM10 concentrations are low in winter 2019 and 2021 relative to other years, but the ratio of both is large, indicating a high percentage of fine particulate matter concentrations in winter in these two years. During the winter in Beijing, the primary pollutant in the atmosphere is coal-fired emissions [36], and the ratio increases with high PM2.5 content.
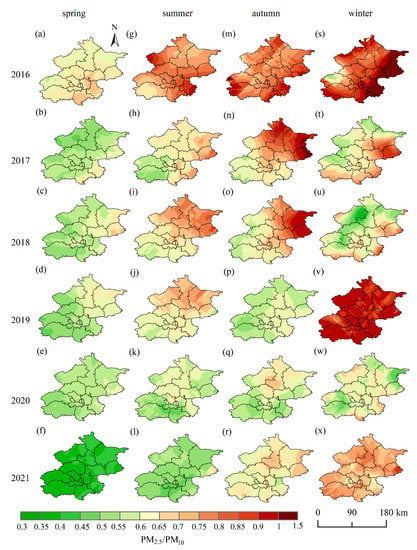
Figure 6.
Spatial distribution of PM2.5/PM10 ratio in spring (a–f), summer (g–l), autumn (m–r) and winter(s–x) from 2016 to 2021, respectively.
3.3. Decomposed EOF Patterns of PM2.5 and PM 10 Concentrations
Figure 7 shows the empirical orthogonal function analysis of the monthly average concentrations of PM2.5 and PM10 at different sites in Beijing from 2016–2021, which can reveal the main change characteristics. The first EOF patterns and corresponding principal components of PM2.5 and PM10 contributed 93.02% and 89.57% of the total variance, respectively, which are much larger than the variance contributions of other principal components. The variance contributions in the second patterns of PM2.5 and PM10 are 3.26% and 2.95%, respectively. The first two patterns both passed North’s test [37].
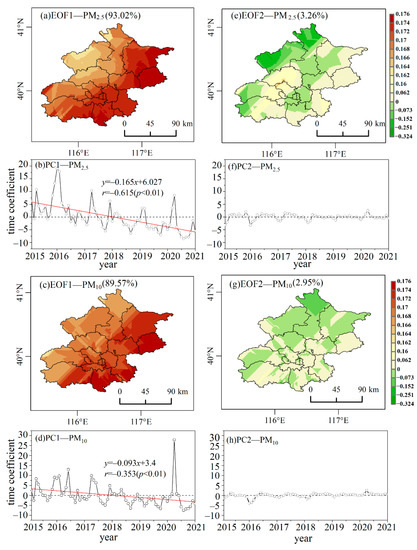
Figure 7.
The first two leading EOF patterns of monthly average PM2.5 and PM10 mass concentrations and time coefficients in Beijing from 2016–2021 (the left side indicates the first EOF pattern (a,c) and time coefficient (b,d), with the second EOF pattern (e,g) and time coefficient (f,h) on the right side).
The first EOF patterns (EOF1) of PM2.5 and PM10 mass concentrations are covered by positive values, indicating that the spatial trends of these two particulate matters are synchronous. Specifically, the higher value area is located in the northeast of Beijing, and the lower value area is in the southwest. It can be seen by taking into account the time coefficients that the PM2.5 and PM10 concentrations show a decreasing trend from 2016 to 2021. Additionally, there are obvious seasonal oscillation characteristics, both have high concentrations in spring and winter and low concentrations in summer.
The second EOF pattern (EOF2) reflects the heterogeneity of PM2.5 and PM10 changes in Beijing in the last six years, with obvious regional differences. The variation of PM2.5 concentrations in the south and the northwest shows an opposite feature, and the time coefficient in the winter of 2016–2020 exhibits negative values, indicating that PM2.5 concentrations are smaller in the south and larger in the northwest. For PM2.5, in negative temporal coefficient cases in winter from 2016 to 2018, the variation in urban six districts and southeastern areas is significantly lower than in the surrounding areas, this pattern has the effect of impairing PM2.5 concentrations in the southeast, it may be affected by meteorological conditions partially offsetting the increase in pollutant concentrations due to regional transport, resulting in some reduction in concentrations in winter.
3.4. Meteorological Conditions Affecting PM2.5 and PM10
3.4.1. Meteorological Factors Influencing PM2.5 and PM10
Although regional transport has a major influence on the distribution of pollutants, the variation of meteorological conditions is also the main cause of pollutant variation. Therefore, we perform the Pearson correlation analysis of PM2.5 and PM10 concentrations with the meteorological data of the corresponding stations to study the influence of meteorological factors on PM2.5 and PM10. Meteorological factors are closely related to PM2.5 and PM10 concentrations in all seasons, but the degree of correlation varies somewhat [13].
Among the factors, PM2.5 and PM10 concentrations show a stable negative correlation with wind speed, especially in spring and winter. The correlation coefficients between PM2.5 concentration and wind speed are −0.694 and −0.479 in spring and winter, respectively, while those between PM10 concentration and wind speed are −0.453 and −0.486 in spring and winter, respectively (the correlation coefficients all passed the significance test at the two-tailed 0.01 level) (Table 1). It is difficult for pollutants to dissipate, due to the obstruction of surface airflow by the subsurface. In addition, there is an input of external pollution, which leads to an increase in the concentration of particulate matter. At the time of higher wind, the dispersion of particulate matter is favored [38,39]. Besides wind speed, precipitation affects the concentrations of particulate matter in spring with a stable negative correlation. The removal capacity of precipitation for pollutants is related to the intensity, duration and total amount of precipitation. As a result of physical effects such as scouring, dilution and collision of large amounts of rainfall, the particulate matter in the atmosphere is reduced. In winter, PM2.5 and PM10 concentrations are significantly and positively correlated with temperature, except for the effect of wind speed, with correlation coefficients of 0.662 and 0.524, respectively.

Table 1.
Relationship between PM2.5, PM10 and meteorological factors in different seasons.
3.4.2. Influence of Atmospheric Circulation Situations on PM2.5 and PM10
PM2.5 and PM10 concentrations are not only related to pollutant emissions but also closely related to meteorological conditions, which depend on the large-scale circulation field. The former study shows that PM2.5 and PM10 concentrations are high in spring and winter. Therefore, this section selects the spring and winter of 2016 for the study. The changes in other years are similar and are not examined here.
It has been mentioned in previous studies that the circulation situation during severe pollution in the Beijing–Tianjin–Hebei region can be classified as westerly and high-pressure ridge type with weak cold air input at middle and high latitudes [16]. There is a high-pressure system simultaneously exists in southeastern and northwestern Beijing in spring, and southwestern airflow and weak westerly wind produce convergence, resulting in the transport of particulate matter from southern Beijing to the northern. Wang et al. [40] revealed that northwest wind dominates in Beijing during periods of low pollutant concentrations, while southwest wind dominates when pollution occurs, followed by southeast wind, and almost all pollutants in Beijing had reduced under the influence of relatively strong northwesterly prevailing wind.
In spring, sand and dust originate from the source, and their concentrations increase due to the return flow effect of the weak high-pressure system in the Bohai Sea, resulting in high PM2.5 and PM10. As demonstrated in Figure 8c,d, Beijing is in the westerly circulation at the height fields of 900 hPa and 700 hPa. Especially the westerly circulation at the 700 hPa level is flatter, without obvious low-pressure trough or high-pressure ridge, which is conducive to the formation of stationary weather.
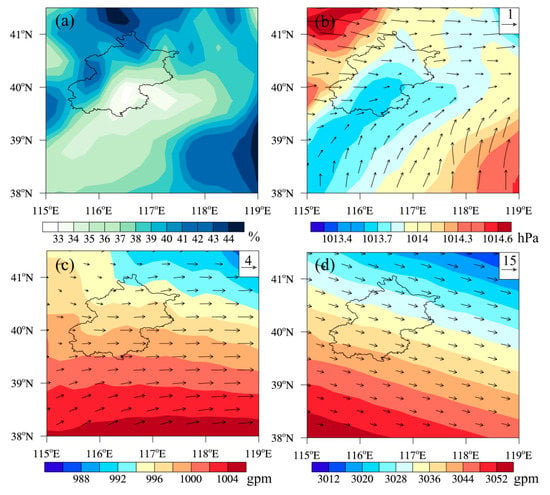
Figure 8.
Circulation situation in spring 2016. (a) Near-surface relative humidity (unit: %); (b) Sea level pressure (unit: hPa) and near-surface wind field (unit: m/s); (c,d) 900 hPa and 700 hPa geopotential height field (unit: gpm) and wind field (unit: m/s).
In winter, the prevailing wind direction in Beijing is weak north-westerly at near-surface level and 900 hPa level, but the particulate matter concentrations are still high in the south and low in the north (Figure 9). This is related to the boundary layer height, which is caused by the elevated thermal inversion [29]. Moreover, the sinking of the airflow is more pronounced in winter.
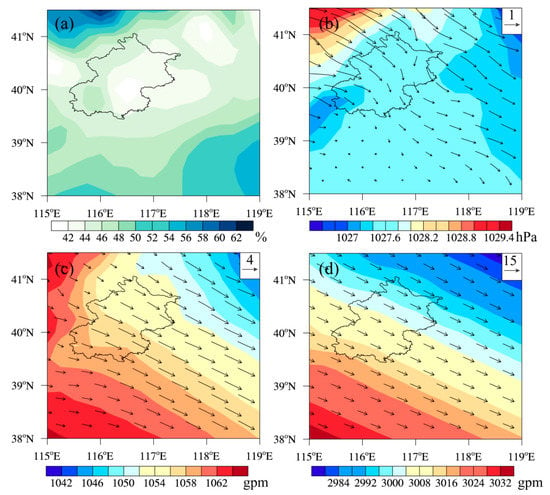
Figure 9.
Circulation situation in winter 2016. (a) Near-surface relative humidity (unit: %); (b) Sea level pressure (unit: hPa) and near-surface wind field (unit:m/s); (c,d) 900 hPa and 700 hPa geopotential height field (unit: gpm) and wind field (unit: m/s).
In general, there is a tendency for particulate matter to spread from the southeastern of Beijing to the northwestern due to regional transport, topography and wind direction.
Weak wind and humidity in the lower troposphere are critical for the formation of particulate matter, and vertical mixing also provides the dynamical conditions for the accumulation and dispersion of atmospheric pollutants [19,41]. To reflect that the dynamical mechanisms of PM2.5 and PM10 during transport vary across seasons, Figure 10 shows the vertical profiles of meridional wind, dispersion and vertical velocity in Beijing in spring and winter of 2016. In spring, wind speeds below 975 hPa levels in the troposphere are low and the airflow is predominantly converging and sinking (negative scatter and positive vertical velocity), which together drive PM2.5 and PM10 to aggregate near the ground, leading to an increase in particulate matter concentrations in spring. Similar to spring, wind speeds are very low in 975–1000 hPa geopotential height fields in winter, and the airflow is weakly dispersed and sinking, leading to the accumulation of pollutants.
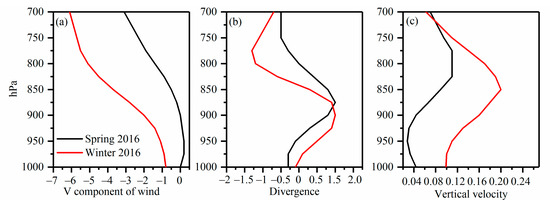
Figure 10.
Regional mean vertical profiles for Beijing in spring and winter 2016. (a) refers to the meridional wind (unit: m/s), (b) is the dispersion(unit:10−5/s), and (c) is the vertical velocity (unit: Pa/s).
4. Discussion
In terms of annual average levels, PM2.5 concentrations are 74 μg/m3, 60.6 μg/m3, 52.4 μg/m3, 43.5 μg/m3, 38.4 μg/m3 and 34.8 μg/m3 in Beijing from 2016 to 2021, respectively. Compared to 2013 (89.5 μg/m3) [31], there is a significant downward trend. The United States exhibits similar characteristics [10]. Spatially, PM2.5 and PM10 concentrations have also been decreasing in various regions of Beijing in recent years, which is closely related to a number of policies introduced by the central and local governments. These include the implementation of the Air Pollution Prevention and Control Action Plan in September 2013, the regulatory Air Pollution Prevention and Control Law in 2016, the “Three-Year Action Plan for Winning the Blue Sky” from 2018 to 2020, and several policies to reduce pollutants. The spatial distribution of PM2.5 and PM10 in Beijing from 2016 to 2019 show a spatial pattern “higher in the south and low in the north”, and the spatial variability of particulate matter concentrations is less in summer than in winter, which is consistent with the findings of Yang et al. [42]. On the one hand, the spatial pattern is mainly influenced by energy-intensive and highly polluting industries in the southern part of Beijing, where pollutant emissions are high, and the influence of regional transport. Central and western Mongolia, eastern Xinjiang, central and western Inner Mongolia, northern Shanxi Province, Hebei and northern Shandong Province are important sources of pollutants in Beijing [43]. On the other hand, unfavorable meteorological conditions such as southerly wind direction near the ground, low wind speed, predominantly converging and sinking airflow, and special geographical location are not conducive to the dispersion of pollutants. Studies have shown that pollutant concentrations transition from the lower level to the higher level when the prevailing wind direction changes from north to south, and the prevailing wind direction for severe pollution is usually south with wind speed less than 3 m/s [13]. Cai et al. [44] suggested that variations in circulation caused by changes in global greenhouse gases have led to the frequent occurrence of severe haze in Beijing in the context of global warming. However, regional differences in PM2.5 and PM10 in Beijing in the last 2 years are not significant, especially since PM2.5 concentrations are low in all regions of the city in different seasons.
The factors of the spatial distribution of PM2.5 and PM10 are the result of the combined effect of human and natural factors. In this paper, the natural factors of PM2.5 and PM10 spatial distribution in Beijing are mainly illustrated. Still, the differences in PM2.5 and PM10 spatial patterns are closely related to the level of urbanization and local economic development. Additionally, residential heating, vehicle exhaust, industrial pollution and dust are all important contributors to the increase in particulate matter concentrations [45]. Therefore, regional control and prevention are critical to improving air pollution conditions [46]. For example, pollutant concentrations were maintained at high values for short periods or did not cause air pollution even under unfavorable dispersion conditions at special times such as the 9.3 military parade may be related to the role of anthropogenic pollution control and abatement in Beijing [47,48].
Particle reduction has high health and economic benefits [49,50]. The synergistic effects between anthropogenic emissions and atmospheric processes must be considered to reduce PM2.5 and PM10 concentrations. Zhang et al. [51] showed that favorable meteorological conditions reduced PM2.5 concentrations by 9% and 5% in 2016 and 2017, respectively, in the Beijing–Tianjin–Hebei region, compared to 2013. Beijing did not show a significant decrease in particulate matter concentrations during the COVID-19 epidemic lockdown, and a similar conclusion was reached by Yin et al. [52]. This is closely related to the weaker intensity of cold air in Beijing during the epidemic control period, with an 8% increase in the probability of southerly and easterly winds. Although meteorological conditions were poor compared to the same period in history, the epidemic blockade led to a reduction in emissions, which offset 53% of the effect of unfavorable meteorological conditions [52]. However, pollutant concentrations in New Delhi, the capital of India, declined during the COVID-19 blockade (March–May 2020) [53]. Some studies have shown integrated assessment of air pollutants in indoor and outdoor microenvironments for effective air quality management [54].
5. Conclusions
This paper investigates the spatial and temporal distribution of PM2.5 and PM10 concentrations and the influence of meteorological conditions on these two particulate matters using hourly data at Beijing air quality monitoring stations from 2016–2021, and the following conclusions are drawn:
- Analyzed on a monthly scale, the changes in PM2.5 and PM10 concentrations in Beijing over the past six years have behaved similarly. PM2.5 concentrations are high in January–March and December, PM10 concentrations peak in March and both concentrations are at their lowest values for the year in August. The average PM2.5 and PM10 concentrations decrease from 2016 to 2021. Additionally, PM2.5 and PM10 concentrations in Beijing shift spatially “high in the south and low in the north” to less regional convergence. Both concentrations are lower in summer. Regarding PM10, the concentrations are obviously higher in spring than in other seasons. The PM2.5/PM10 ratio is lower in spring in all regions, ranging from 0.3 to 0.6. The ratio is larger in winter, with significant performance in winter 2016 and 2019, with ratios exceeding 0.85 in most regions.
- The first EOF pattern exhibits spatial consistency in the variation of PM2.5 and PM10 concentrations, with higher loading values in the southeast than in the northwest. The second EOF pattern shows a spatially heterogeneous variation, which pattern has the effect of impairing PM2.5 concentrations in the southeast from 2016 to 2018.
- PM2.5 and PM10 concentrations show a stable anti-correlation with wind speed in spring and winter. The spring is also influenced by precipitation, while the particulate matter concentrations are positively correlated with temperature in winter. Southwesterly airflow converges with the westerly wind in spring, and particulate matter diffuses from the south to the north, resulting in higher concentrations in the south than in the north. It is influenced by flatter westerly airflow at 700 hPa geopotential height, which is conducive to the formation of stationary weather. The airflow in the vertical direction is converging and sinking, resulting in the particulate matter not being easily dispersed.
Author Contributions
Data curation, Q.X.; formal analysis: Q.X.; funding acquisition, M.S., methodology, Q.X.; writing—original draft, Q.X.; writing—review and editing, Q.X. and M.S. All authors have read and agreed to the published version of the manuscript.
Funding
This research was funded by the National Natural Science Foundation of China, grant numbers 42161027 and 41861013.
Institutional Review Board Statement
Not applicable.
Informed Consent Statement
Not applicable.
Data Availability Statement
Hourly PM2.5 and PM10 concentration data are available from http://www.bjmemc.com.cn/, (accessed on 28 February 2022). CN05.1 gridded observation dataset is provided by Wu et al. The ERA5 reanalysis data are available online from https://cds.climate.copernicus.eu/cdsapp#!/search?text=ERA5 (accessed on 28 February 2022).
Acknowledgments
We are grateful to Beijing Municipal Ecological and Environmental Monitoring Center, European Center and Wu et al. for the data. We also gratefully thank the reviewers.
Conflicts of Interest
The authors declare no conflict of interest.
References
- Wang, Z.B.; Liang, L.W.; Wang, X.J. Spatio-temporal evolution patterns and influencing factors of PM2.5 in Chinese urban agglomerations. Acta Geogr. Sin. 2015, 70, 1720–1734. [Google Scholar]
- Peng, J.F.; Hu, M.; Guo, S.; Du, Z.F.; Zheng, J.; Shang, D.J.; Zamora, M.L.; Zeng, L.M.; Shao, M.; Wu, Y.S.; et al. Markedly enhanced absorption and direct radiative forcing of black carbon under polluted urban environments. Proc. Natl. Acad. Sci. USA 2016, 113, 4266–4271. [Google Scholar] [CrossRef] [Green Version]
- Wang, Y.; Khalizov, A.; Levy, M.; Zhang, R.Y. New Directions: Light absorbing aerosols and their atmospheric impacts. Atmos. Environ. 2013, 81, 713–715. [Google Scholar] [CrossRef]
- Zhang, X.Y.; Sun, J.Y.; Wang, Y.Q.; Li, W.J.; Zhang, Q.; Wang, W.G.; Quan, J.N.; Cao, G.L.; Wang, J.Z.; Yang, Y.Q.; et al. Factors contributing to haze and fog in China. Chin. Sci. Bull. 2013, 58, 1178–1187. [Google Scholar]
- Chen, R.J.; Zhao, Z.H.; Kan, H.D. Heavy Smog and Hospital Visits in Beijing, China. Am. J. Respir. Crit. Care Med. 2013, 188, 1170–1171. [Google Scholar] [CrossRef]
- Cohen, A.J.; Brauer, M.; Burnett, R.; Anderson, H.R.; Frostad, J.; Estep, K.; Balakrishnan, K.; Brunekreef, B.; Dandona, L.; Dandona, R.; et al. Estimates and 25-year trends of the global burden of disease attributable to ambient air pollution: An analysis of data from the Global Burden of Diseases Study 2015. Lancet 2017, 389, 1907–1918. [Google Scholar] [CrossRef] [Green Version]
- Zeng, Y.Y.; Jaffe, D.A.; Qiao, X.; Miao, Y.C.; Tang, Y. Prediction of Potentially High PM2.5 Concentrations in Chengdu, China. Aerosol Air Qual. Res. 2020, 20, 956–965. [Google Scholar] [CrossRef] [Green Version]
- Guo, J.Y.; Zhang, Y.J.; Zheng, H.T.; Wang, Z.F.; Sun, Y.L. Characteristics of spatial distribution and variations of atmospheric fine particles in Beijing in 2015. Acta Sci. Circum. 2017, 37, 2409–2419. [Google Scholar]
- Carmona, J.M.; Gupta, P.; Lozano-Garcia, D.F.; Vanoye, A.Y.; Yepez, F.D.; Mendoza, A. Spatial and Temporal Distribution of PM2.5 Pollution over Northeastern Mexico: Application of MERRA-2 Reanalysis Datasets. Remote Sens. 2020, 12, 2286. [Google Scholar] [CrossRef]
- Colmer, J.; Hardman, I.; Shimshack, J.; Voorheis, J. Disparities in PM2.5 air pollution in the United States. Science 2020, 369, 575–578. [Google Scholar] [CrossRef]
- Qu, C.; Chen, T.T.; Liu, J.; Li, Y.D. Spatio-Temporal Characteristics of PM2.5 and Influence Factors in Typical Cities of China. Res. Environ. Sci. 2019, 32, 1117–1125. [Google Scholar]
- Jiang, Q.; Wang, F.; Zhang, H.D.; Lü, M. Analysis of temporal variation characteristics and meteorological conditions of reactive gas and PM2. 5 in Beijing. China Environ. Sci. 2017, 37, 829–837. [Google Scholar]
- An, Z.S.; Huang, R.J.; Zhang, R.Y.; Tie, X.X.; Li, G.H.; Cao, J.J.; Zhou, W.J.; Shi, Z.G.; Han, Y.M.; Gu, Z.L.; et al. Severe haze in northern China: A synergy of anthropogenic emissions and atmospheric processes. Proc. Natl. Acad. Sci. USA 2019, 116, 8657–8666. [Google Scholar] [CrossRef] [Green Version]
- Wei, J.; Li, Z.Q.; Lyapustin, A.; Sun, L.; Peng, Y.R.; Xue, W.H.; Su, T.N.; Cribb, M. Reconstructing 1-km-resolution high-quality PM2.5 data records from 2000 to 2018 in China: Spatiotemporal variations and policy implications. Remote Sens. Environ. 2021, 252, 112136. [Google Scholar] [CrossRef]
- Wu, G.X.; Li, Z.Q.; Fu, C.B.; Zhang, X.Y.; Zhang, R.Y.; Zhang, R.H.; Zhou, T.J.; Li, J.P.; Li, J.D.; Zhou, D.G.; et al. Advances in studying interactions between aerosols and monsoon in China. Sci. China Earth. Sci. 2016, 59, 1–16. [Google Scholar] [CrossRef]
- Li, J.D.; Hao, X.; Liao, H.; Wang, Y.H.; Cai, W.J.; Li, K.; Yue, X.; Yang, Y.; Chen, H.S.; Mao, Y.H.; et al. Winter particulate pollution severity in North China driven by atmospheric teleconnections. Nat. Geosci. 2022, 15, 349–355. [Google Scholar] [CrossRef]
- Chen, Q.X.; Huang, C.L.; Yuan, Y.; Tan, H.P. Influence of COVID-19 Event on Air Quality and their Association in Mainland China. Aerosol Air Qual. Res. 2020, 20, 1541–1551. [Google Scholar] [CrossRef]
- Zhao, Y.; Wang, L.; Huang, T.; Tao, S.; Liu, J.F.; Gao, H.; Luo, J.M.; Huang, Y.F.; Liu, X.R.; Chen, K.J.; et al. Unsupervised PM2.5 anomalies in China induced by the COVID-19 epidemic. Sci. Total Environ. 2021, 795, 148807. [Google Scholar] [CrossRef]
- Xue, W.B.; Shi, X.R.; Yan, G.; Wang, J.N.; Xu, Y.L.; Tang, Q.; Wang, Y.L.; Zheng, Y.X.; Lei, Y. Impacts of meteorology and emission variations on the heavy air pollution episode in North China around the 2020 Spring Festival. Sci. China Earth Sci. 2021, 64, 329–339. [Google Scholar] [CrossRef]
- Sulaymon, I.D.; Zhang, Y.X.; Hopke, P.K.; Hu, J.L.; Zhang, Y.; Li, L.; Mei, X.D.; Gong, K.J.; Shi, Z.H.; Zhao, B.; et al. Persistent high PM2.5 pollution driven by unfavorable meteorological conditions during the COVID-19 lockdown period in the Beijing-Tianjin-Hebei region, China. Environ. Res. 2021, 198, 111186. [Google Scholar] [CrossRef]
- Liu, C.; Hua, C.; Zhang, H.D.; Zhang, B.H.; Wang, G.; Zhu, W.H.; Xu, R. A severe fog-haze episode in Beijing-Tianjin-Hebei region: Characteristics, sources and impacts of boundary layer structure. Atmos. Pollut. Res. 2019, 10, 1190–1202. [Google Scholar] [CrossRef]
- Liu, Y.L.; Shi, G.M.; Zhan, Y.; Zhou, L.; Yang, F.M. Characteristics of PM2.5 spatial distribution and influencing meteorological conditions in Sichuan Basin, southwestern China. Atmos. Environ. 2021, 253, 118364. [Google Scholar] [CrossRef]
- Yao, Q.; Cai, Z.Y.; Liu, J.L.; Wang, X.J.; Hao, T.Y.; Han, S.Q. Effects of meteorological conditions on PM2.5 concentration in Tianjin from 2009 to 2018. Acta Sci. Circumst. 2020, 40, 65–75. [Google Scholar]
- Huang, X.G.; Shao, T.J.; Zhao, J.B.; Cao, J.J.; Sun, L.L. Influence factors and spillover effect of PM2.5 concentration on Fen-wei Plain. China Environ. Sci. 2019, 39, 3539–3548. [Google Scholar]
- Gopalakrishnan, V.; Hirabayashi, S.; Ziv, G.; Bakshi, B.R. Air quality and human health impacts of grasslands and shrublands in the United States. Atmos. Environ. 2018, 182, 193–199. [Google Scholar] [CrossRef] [Green Version]
- Zhao, X.J.; Zhao, P.S.; Xu, J.; Meng, W.; Pu, W.W.; Dong, F.; He, D.; Shi, Q.F. Analysis of a winter regional haze event and its formation mechanism in the North China Plain. Atmos. Chem. Phys. 2013, 13, 5685–5696. [Google Scholar] [CrossRef] [Green Version]
- Huang, X.; Ding, A.J.; Gao, J.; Zheng, B.; Zhou, D.R.; Qi, X.M.; Tang, R.; Wang, J.P.; Ren, C.H.; Nie, W.; et al. Enhanced secondary pollution offset reduction of primary emissions during COVID-19 lockdown in China. Nat. Sci. Rev. 2021, 8, nwaa137. [Google Scholar] [CrossRef]
- Sun, Z.B.; Zhao, X.J.; Li, Z.M.; Tang, G.Q.; Miao, S.G. Boundary layer structure characteristics under objective classification of persistent pollution weather types in the Beijing area. Atmos. Chem. Phys. 2021, 21, 8863–8882. [Google Scholar] [CrossRef]
- Miao, Y.C.; Liu, S.H.; Huang, S.X. Synoptic pattern and planetary boundary layer structure associated with aerosol pollution during winter in Beijing, China. Sci. Total Environ. 2019, 682, 464–474. [Google Scholar] [CrossRef]
- Wu, P.; Ding, Y.H.; Liu, Y.J. Atmospheric circulation and dynamic mechanism for persistent haze events in the Beijing-Tianjin-Hebei region. Adv. Atmos. Sci. 2017, 34, 429–440. [Google Scholar] [CrossRef] [Green Version]
- Wang, Z.S.; Li, Y.T.; Chen, T.; Zhang, D.W.; Sun, F.; Pan, L.B. Spatial-temporal characteristics of PM2.5 in Beijing in 2013. Acta Geogr. Sin. 2015, 70, 110–120. [Google Scholar]
- Zhou, X.; Zhang, T.J.; Li, Z.Q.; Tao, Y.; Wang, F.T.; Zhang, X.; Xu, C.H.; Ma, S.; Huang, J. Particulate and gaseous pollutants in a petrochemical industrialized valley city, Western China during 2013–2016. Environ. Sci. Pollut. Res. 2018, 25, 15174–15190. [Google Scholar] [CrossRef]
- Wu, J.; Gao, X.J.; Giorgi, F.; Chen, D.L. Changes of effective temperature and cold/hot days in late decades over China based on a high-resolution gridded observation dataset. Int. J. Climatol. 2017, 37, 788–800. [Google Scholar] [CrossRef]
- Xu, X.H.; Zhang, T.C. Spatial-temporal variability of PM2.5 air quality in Beijing, China during 2013–2018. J. Environ. Manag. 2020, 262, 110263. [Google Scholar] [CrossRef]
- Xu, X.D.; Zhou, X.J.; Shi, X.H. Spatial structure and scale feature of the atmospheric pollution source impact of city agglomeration. Sci. China (Ser. D) 2005, 35, 1–24. [Google Scholar]
- An, X.X.; Cao, Y.; Wang, Q.; Fu, J.M.; Wang, C.J.; Jing, K.; Liu, B.X. Chemical Characteristics and Source Apportionment of PM2. 5 in Urban Area of Beijing. Chin. J. Environ. Sci. 2022, 43, 2251–2261. [Google Scholar] [CrossRef]
- North, G.R.; Bell, T.L.; Cahalan, R.F.; Moeng, F.J. Sampling errors in the estimation of empirical orthogonal functions. Mon. Weather Rev. 1982, 110, 699–706. [Google Scholar] [CrossRef]
- Yu, C.X.; Deng, X.L.; Shi, C.E.; Wu, B.W.; Zhai, J.; Yang, G.Y.; Huo, Y.F. The scavenging effect of precipitation and wind on PM2.5 and PM10. Acta Sci. Circum. 2018, 38, 4620–4629. [Google Scholar]
- Li, K.F.; Zhang, H.D.; Xie, Y.H. Analysis on precipitation scavenging on PM10 and PM2.5 in central and south of Beijing-Tianjin-Hebei region. J. Arid Land Resour. Environ. 2019, 33, 69–74. [Google Scholar]
- Wang, C.; An, X.Q.; Zhang, P.Q.; Sun, Z.B.; Cui, M.; Ma, L. Comparing the impact of strong and weak East Asian winter monsoon on PM2.5 concentration in Beijing. Atmos. Res. 2019, 215, 165–177. [Google Scholar] [CrossRef]
- Yu, Y.; Xu, H.H.; Jiang, Y.J.; Chen, F.; Cui, X.D.; He, J.; Liu, D.T. A modeling study of PM2.5 transboundary transport during a winter severe haze episode in southern Yangtze River Delta, China. Atmos. Res. 2021, 248, 105159. [Google Scholar] [CrossRef]
- Yang, W.T.; Yao, S.Q.; Deng, M.; Wang, Y.J. Spatio-temporal Distribution Characteristics of PM2.5 and Spatio-temporal Variation Characteristics of the Relationship Between PM2.5 and PM10 in Beijing. Chin. J. Environ. Sci. 2018, 39, 684–690. [Google Scholar]
- Wang, G.C.; Wang, D.Q.; Chen, Z.L. Characteristics and transportation pathways and potential sources of a severe PM2.5 episodes during winter in Beijing. China Environ. Sci. 2016, 36, 1931–1937. [Google Scholar]
- Cai, W.J.; Li, K.; Liao, H.; Wang, H.J.; Wu, L.X. Weather conditions conducive to Beijing severe haze more frequent under climate change. Nat. Clim. Chang. 2017, 7, 257–262. [Google Scholar] [CrossRef]
- Guo, D.P.; Wang, R.; Zhao, P. Spatial distribution and source contributions of PM2.5 concentrations in Jincheng, China. Atmos. Pollut. Res. 2020, 11, 1281–1289. [Google Scholar] [CrossRef]
- Liu, Y.S.; Li, Y.H.; Chen, C. Pollution: Build on success in China. Nature 2015, 517, 145. [Google Scholar] [CrossRef] [Green Version]
- Li, W.T.; Gao, Q.X.; Liu, J.R.; Li, L.; Gao, W.K.; Su, B.D. Comparative Analysis on the Improvement of Air Quality in Beijing During APEC. China Environ. Sci. 2015, 36, 4340–4347. [Google Scholar] [CrossRef]
- Nie, T.; Li, X.; Wang, Z.S.; Qi, J.; Zhou, Z. Spatial and temporal distribution and process analysis of PM2.5 pollution over Beijing during APEC. China Environ. Sci. 2016, 36, 349–355. [Google Scholar]
- Mo, Y.Z.; Booker, D.; Zhao, S.Z.; Tang, J.; Jiang, H.X.; Shen, J.; Chen, D.H.; Li, J.; Jones, K.C.; Zhang, G. The application of land use regression model to investigate spatiotemporal variations of PM2.5 in Guangzhou, China: Implications for the public health benefits of PM2.5 reduction. Sci. Total Environ. 2021, 778, 146305. [Google Scholar] [CrossRef]
- Cui, Y.; Cao, W.; Ji, D.S.; Gao, W.K.; Wang, Y.S. Estimated contribution of vehicular emissions to carbonaceous aerosols in urban Beijing, China. Atmos. Res. 2021, 248, 105153. [Google Scholar] [CrossRef]
- Zhang, X.Y.; Xu, X.D.; Ding, Y.H.; Liu, Y.J.; Zhang, H.X.; Wang, Y.Q.; Zhong, J.T. The impact of meteorological changes from 2013 to 2017 on PM2.5 mass reduction in key regions in China. Sci. China Earth Sci. 2019, 62, 1885–1902. [Google Scholar] [CrossRef]
- Yin, X.M.; Li, Z.M.; Qiao, L.; Liu, X.X.; Guo, H.; Wu, J.; Zhu, X.W.; Qiu, Y.L.; Wang, J.K.; Zhang, X.Y. Effect analysis of meteorological conditions on air quality during the winter COVID-19 lockdown in Beijing. China Environ. Sci. 2021, 41, 1985–1994. [Google Scholar]
- Pandey, M.; George, M.P.; Gupta, R.K.; Gusain, D.; Dwivedi, A. Impact of COVID-19 induced lockdown and unlock down phases on the ambient air quality of Delhi, capital city of India. Urban Clim. 2021, 39, 100945. [Google Scholar] [CrossRef]
- Adam, M.G.; Tran, P.T.M.; Balasubramanian, R. Air quality changes in cities during the COVID-19 lockdown: A critical review. Atmos. Res. 2021, 264, 105823. [Google Scholar] [CrossRef]
Publisher’s Note: MDPI stays neutral with regard to jurisdictional claims in published maps and institutional affiliations. |
© 2022 by the authors. Licensee MDPI, Basel, Switzerland. This article is an open access article distributed under the terms and conditions of the Creative Commons Attribution (CC BY) license (https://creativecommons.org/licenses/by/4.0/).