Article

Solar Ultraviolet Radiation Temporal Variability Analysis from 2-Year of Continuous Observation in an Amazonian City of Brazil

1
LACy, Laboratoire de l’Atmosphère et des Cyclones, UMR 8105 CNRS, Université de La Réunion, Météo-France, 97744 Saint-Denis de La Réunion, France
2
Postgraduate Program in Nature, Development and Society, Federal University of Western Pará, Santarém 68035110, Brazil
3
Postgraduate Program in Natural Resources of the Amazon, Federal University of Western Pará, Santarém 68035110, Brazil
4
National Institute Space Research, São José dos Campos 12227010, Brazil
5
Institute of Engineering and Geosciences, Federal University of Western Pará, Santarém 68035110, Brazil
6
Chemical Engineering Department, Federal University of Santa Maria, Santa Maria 97105900, Brazil
*
Author to whom correspondence should be addressed.
Atmosphere 2022, 13(7), 1054; https://doi.org/10.3390/atmos13071054
Submission received: 10 June 2022 / Revised: 28 June 2022 / Accepted: 30 June 2022 / Published: 2 July 2022
(This article belongs to the Section Biometeorology)

Abstract

:
Solar ultraviolet radiation (UVR) is a highly energetic component of the solar spectrum that needs to be monitored because of the effects on human health and on the ecosystems. In Brazil, few cities monitor UVR, especially in the Amazon region which is particularly poor in observation. This work is the first to address the short-term (2-year) time variability of UVR in Santarém (2°25′ S, 54°44′ W, 51 m) using ground-based measurements. The irradiance in the wavelength range of 250–400 nm was investigated on different time scales. Furthermore, to understand how the UVR varies without the influence of clouds, the hours corresponding to the clear sky condition were analyzed as well as the hours in all sky conditions. Regarding the averages, there is a slight variation over the year. In all sky and clear sky conditions, the dry season had a higher average than the rainy season, despite the slight difference. Also, both in all-sky and clear-sky conditions the maximums occurred around local solar noon, and reached a maximum of 87 W / m 2 in the dry season under the clear sky condition. Further understanding of the radiative effects of the clouds in UVR time variability is considered essential for future research. This study can serve as a reference for UVR levels in this region where no other ground-based UVR measurements are made.

1. Introduction

Solar Ultraviolet Radiation (UVR) comprises a set of electromagnetic waves with wavelengths between 100 and 400 nm that represents a small fraction (5%) of the solar radiation that reaches the terrestrial surface [1,2,3]. This spectrum of solar radiation has a direct effect on human health, terrestrial and aquatic ecosystems, and the degradation of materials [4,5]. The amount of UVR reaching the Earth’s surface depends on solar variations (such as Schwabe solar cycle), on the variations in the Earth’s position relative to the Sun, on atmospheric, geographical, and temporal parameters which include the angle of incoming UVR (affected by latitude, season and time of day), altitude, albedo, clouds, aerosols, and others atmospheric constituents [6,7,8].
For a better understanding and research, UVR is divided into three bands, depending on its transmission capability in the atmosphere and its biological effects: UVA (320–400 nm) that makes up most of the UVR received on the terrestrial surface; UVB (280–320 nm) which is partially absorbed into the atmosphere and UVC (100–280 nm) which is completely absorbed by stratospheric ozone [9].
In humans, exposure of the skin to solar radiation in the UV (ultraviolet) band results in the production of vitamin D, and it is the main source of this type of vitamin for most of the world’s population [10]. Increasing evidence is identified for a range of other benefits; for example, for systemic autoimmune diseases (such as multiple sclerosis) [11], in the prevention of myopia [12] in addition, recent research suggests that adequate UVR exposure, may be substantial in reducing mortality [13].
A sharp increase in the incidence of skin cancer has been observed in populations worldwide since the early 1970s, strongly associated with personal behavior regarding sun exposure and its ultraviolet component [14]. The Brazilian National Cancer Institute (INCA) estimated for the 2020–2022 triennium about 177 thousand new cases of non-melanoma skin cancer in Brazil. In the northern region, it is the second most incident type of cancer among men [15]. Among women, it is the most incident cancer in all regions of the country [15].
Natural factors such as solar activity (11-year solar cycle), dynamical atmospheric processes (e.g., quasi-biennial oscillation (QBO)) and ocean dynamics induce changes in the atmosphere varying from each location in the world [16]. Climate change, influenced by land use change, such as deforestation, agricultural transformations, urban and industrial development also influences, for example, altering cloud cover [16,17], which is one important regulator of the radiance balance of the earth-atmosphere system [18]. Clouds can reflect and scatter solar radiation and increased cloud cover generally tends to reduce UVR on surface, but in some cases, there is an enhancement of local radiation depending on the type of clouds [19,20].
Under cloudy conditions, the interactions of UVR with the Earth’s atmosphere are complex and for clear sky conditions, ozone is the main absorber and aerosols are the main contributors to UVR attenuation [21]. Every year the gas and particle emissions from tropical biomass burnings cover a large portion of South America originating from fires in the Amazon [22,23]. Aerosols reduce the direct solar radiation reaching the surface, while they increase the diffuse fraction of solar radiation [21]. Biomass-burning aerosols also act as cloud condensation nuclei affecting cloud microphysical properties and therefore change the radiation budget over disturbed areas [22,23,24].
In addition, it is increasingly apparent that the Amazon is under increasing threat from both climate change and human practices such as deforestation and biomass burning [24]. Amazonian cities such as Santarém, the study area of this research, may become a common pattern, thus representing a new challenge to understanding the atmosphere-biosphere interactions. For example, the presence of the urban region and the large rivers (such as the Tapajós and Amazon rivers, which pass through Santarém) alters the diurnal cycle of cloud formation and modifies the wind regime, which starts to lead to atmospheric pollution generated in cities, by burning fuels and industrial emissions, to distant regions, covered by forests or production areas [25].
Despite the importance of all these issues related to UVR for public health and sustainable development, there are knowledge deficits at local levels of UVR [19,25]. In Brazil, there are still few cities that monitor UVR and few are those that have been monitoring it continuously for more than 10 years [26]. The lack of UVR data is even greater when it comes to the Brazilian Amazon.
Therefore, given the importance of UVR, the lack of ground-based data, the uncertainty regarding the existence of trends, and both the increase or decrease in the incidence of surface UVR. The aim of this study is to characterize the temporal variability of surface UVR at different time scales (daily, monthly, seasonal) at Santarém-PA for the period of 2019–2020, a period for which we have ground-based measurement of UVR. Furthermore, in order to understand how the UVR varies without the influence of clouds, the hours corresponding to the clear sky condition were analyzed as well as the hours in all sky conditions. These findings are useful to improve the understanding of the UVR time variability at surface in an amazonian city in addition to serving as a first step for future study on the influence of cloud cover on surface UVR variability in the Amazon.

2. Materials and Methods

Santarém (2°25′ S, 54°44′ W) is situated in the western Pará, in the north of Brazil at approximately 51 m above sea level (Figure 1). The city fits into the climatic type Am, that is, the climate is humid equatorial with a well-defined dry and wet seasons [27]. The rainy season generally lasts from January to June and the dry season comprises the months between July and December [28]. It has little variability in relative humidity, air temperature, atmospheric pressure, and wind speed, due to being located in tropical latitudes close to the Equator [29].
Precipitations in the Amazon rain forest, where is Santarém, are dominated by convection with a summer rainy and a winter dry season [24]. During the nonpolluted periods in the rainy season, the atmosphere over this area has been described as a green ocean owing to very low aerosol concentrations and a maritime-like cloud regime [24,30]. In contrast, during the dry season, biomass-burning enhance aerosol concentrations [24,25].

2.1. Instruments and Data

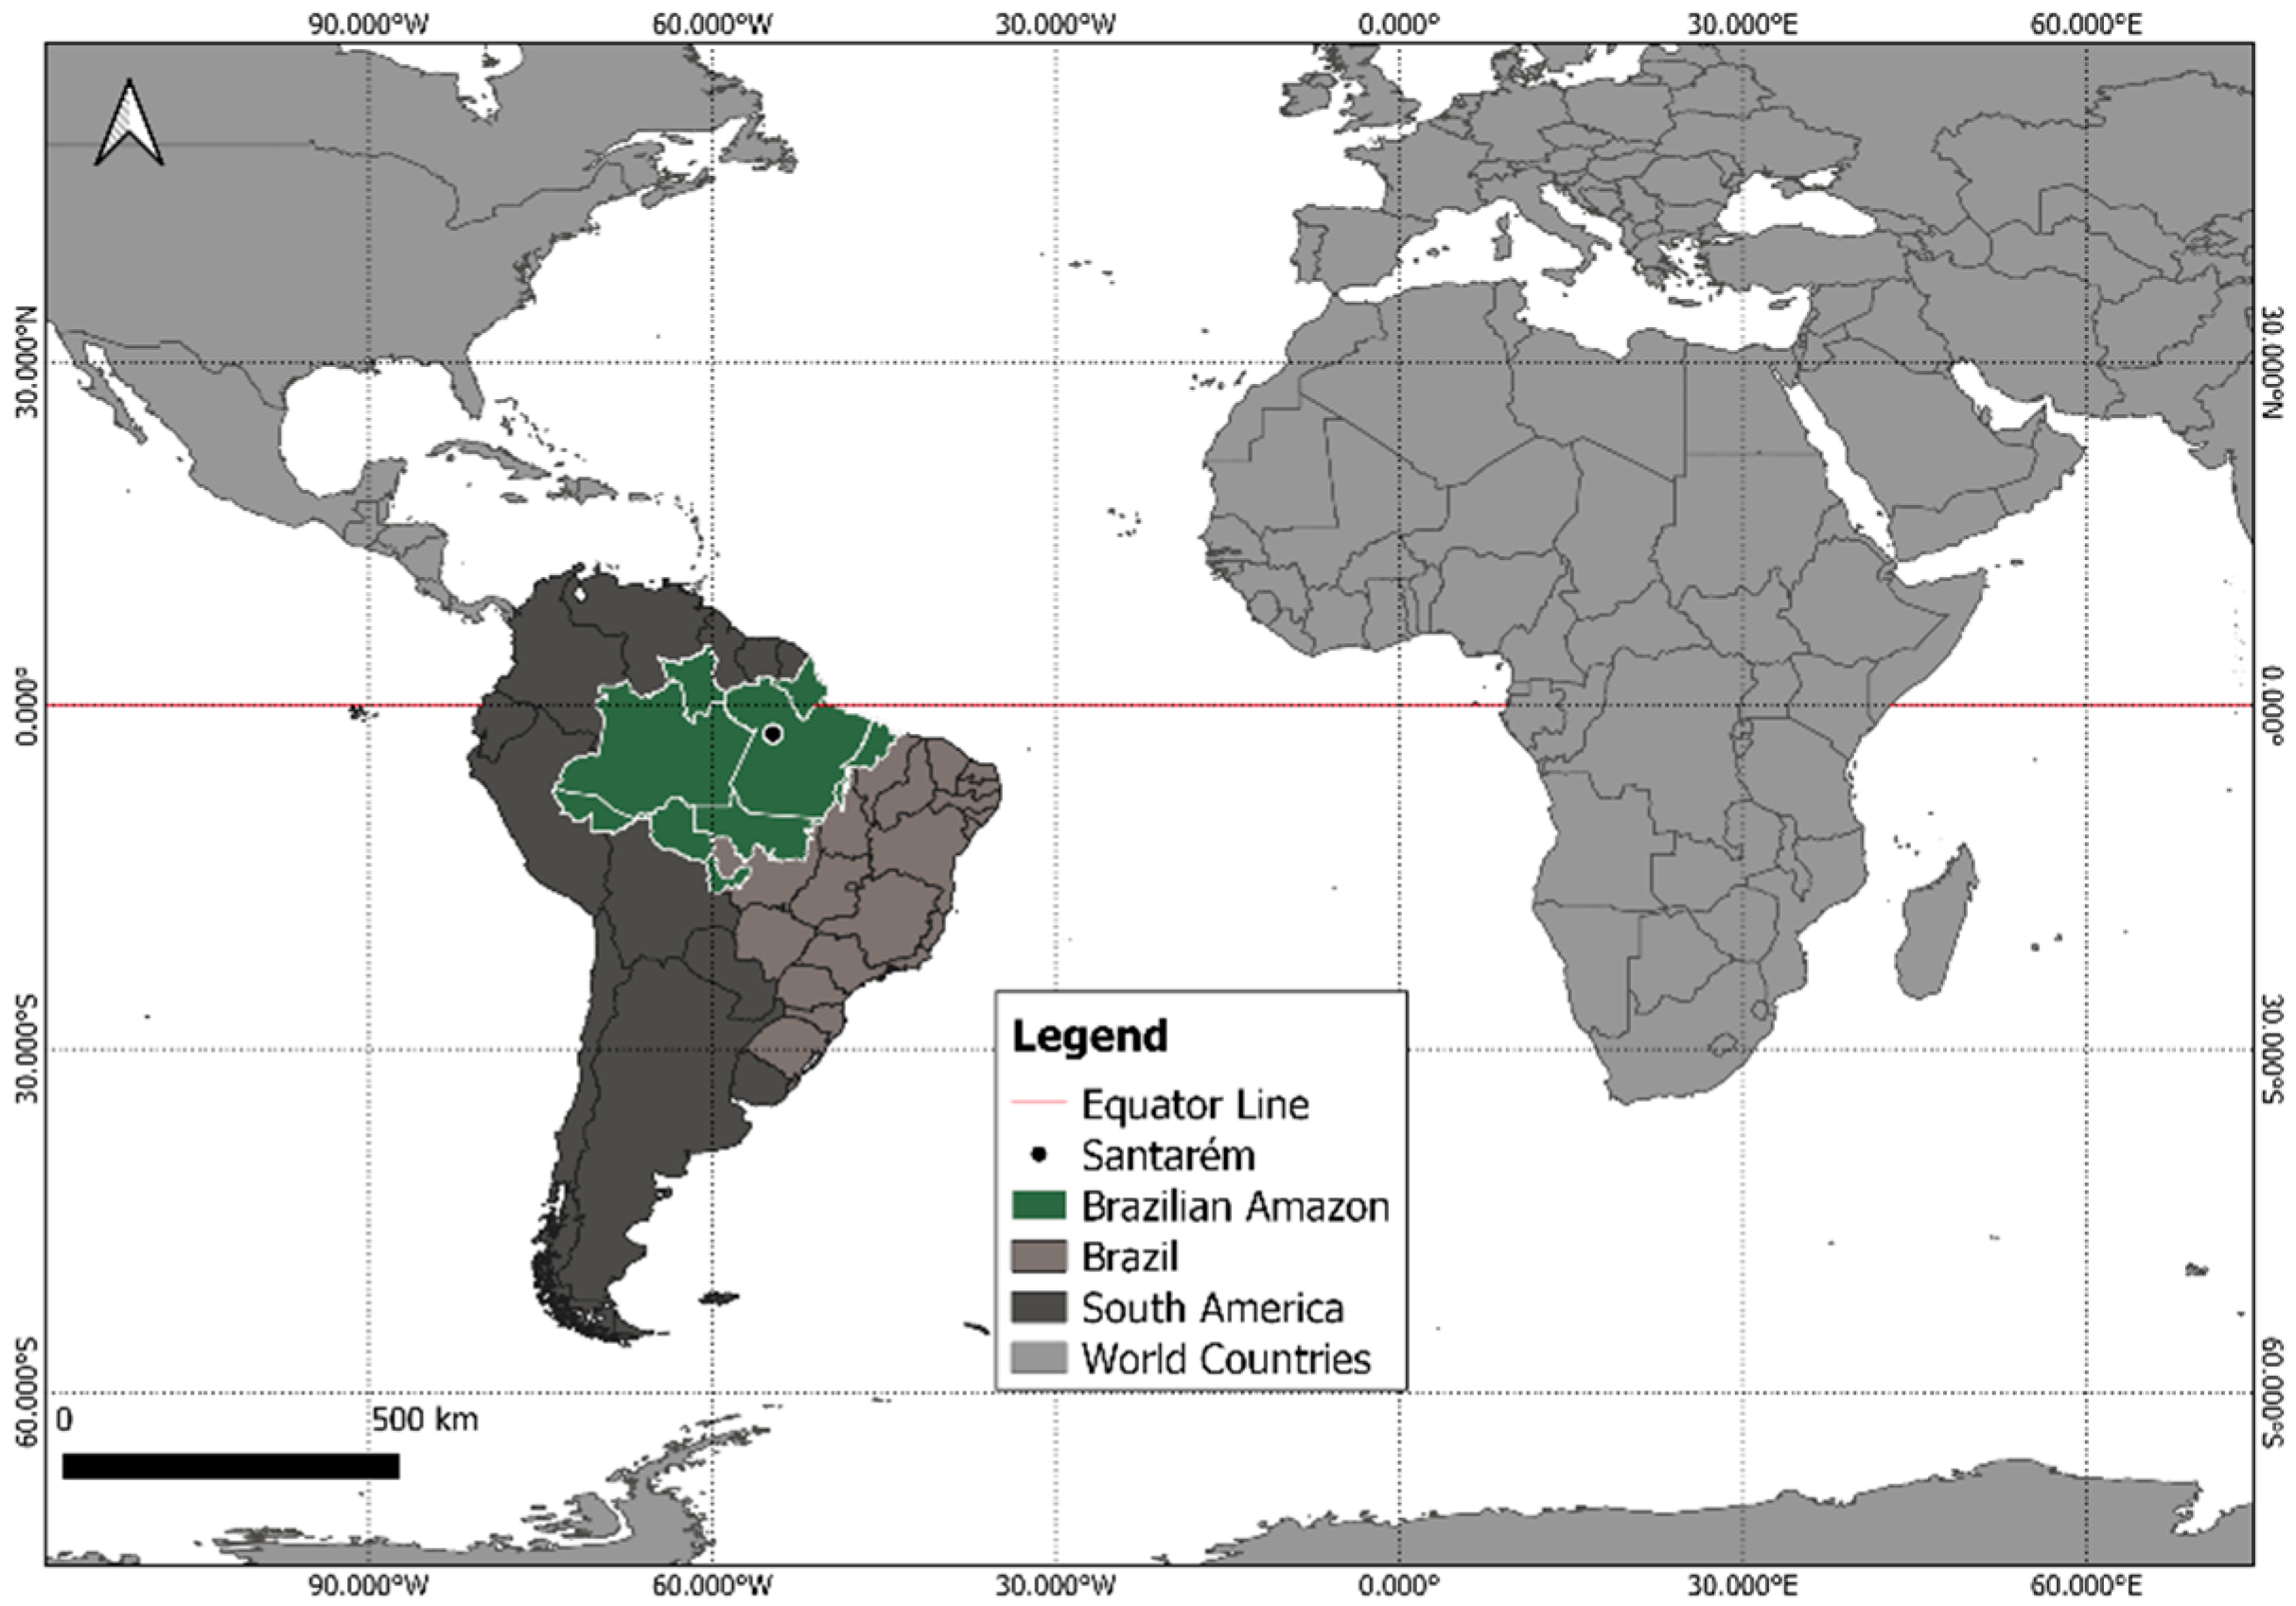
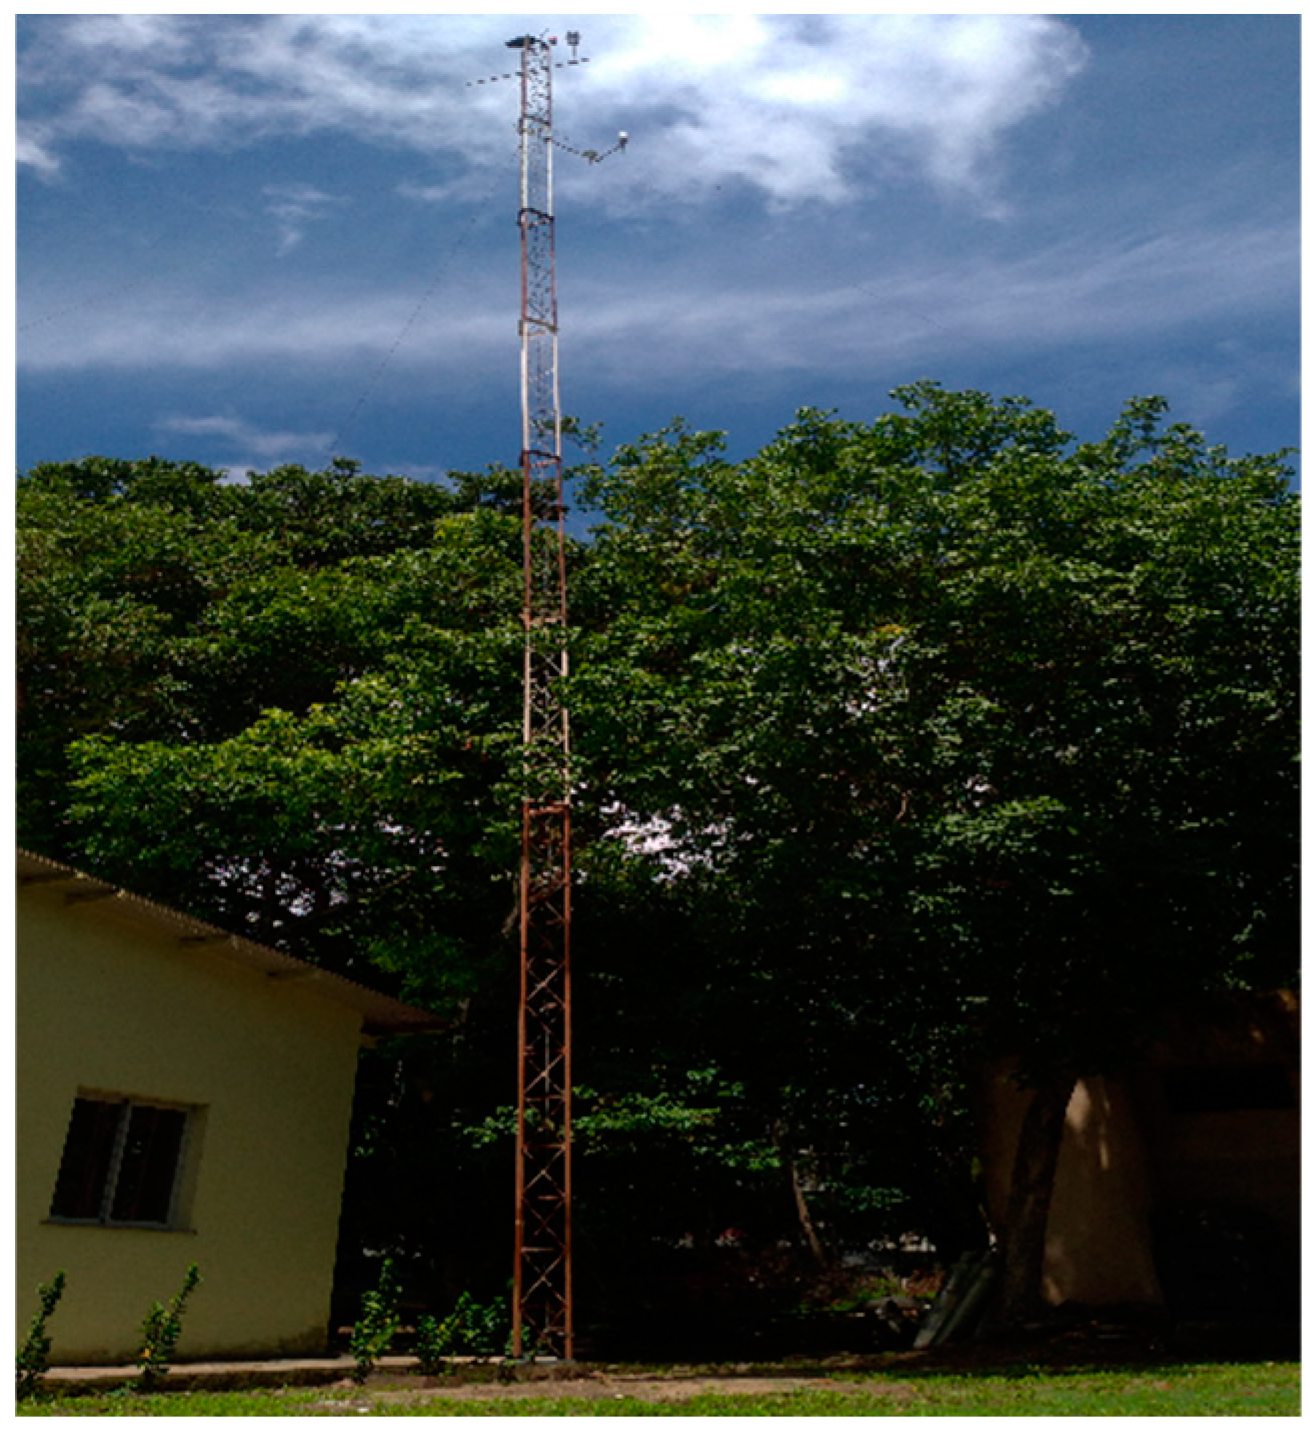
2.1.1. Ground-Based UVR Instrument at Santarém

The UVR sensor was installed at a height of 18 m above ground level in a tower located on the UFOPA (Federal University of Western Pará) campus in Santarém (Figure 2). It was a used a UVR sensor, model SU-100-ss, manufactured by Apogee Instruments. The sensor is a photodiode designed for UVR detection in photon flow units (μmoles s 1 m 2 ) and Wm 2 energy flow units. It has a spectrum range from 250 nm to 400 nm, that is, it comprises the entire UVA and UVB range. The calibration factors are 5 μmoles s 1 m 2 per mV and 1.65 Wm 2 per mV . The sensitivity of the SU-100-ss is 0.20 mV per 1 μmoles s 1 m 2 , 0.61 mV per 1 Wm 2 , stability of ±3% change over the period of one year and an operating temperature of −40 °C to 70 °C [31]. The UVR sensor was brand new and calibrated by Apogee.
A two-year period of data (April 2019 to November 2020) was measured. The UVR data were collected continuously with a sampling frequency of 1 Hz, in watts per square-meter unit, and using the Campbell Scientific model CR10X data logger. The missing days are due to the period in which the sensor had not arrived and due to some technical problems.

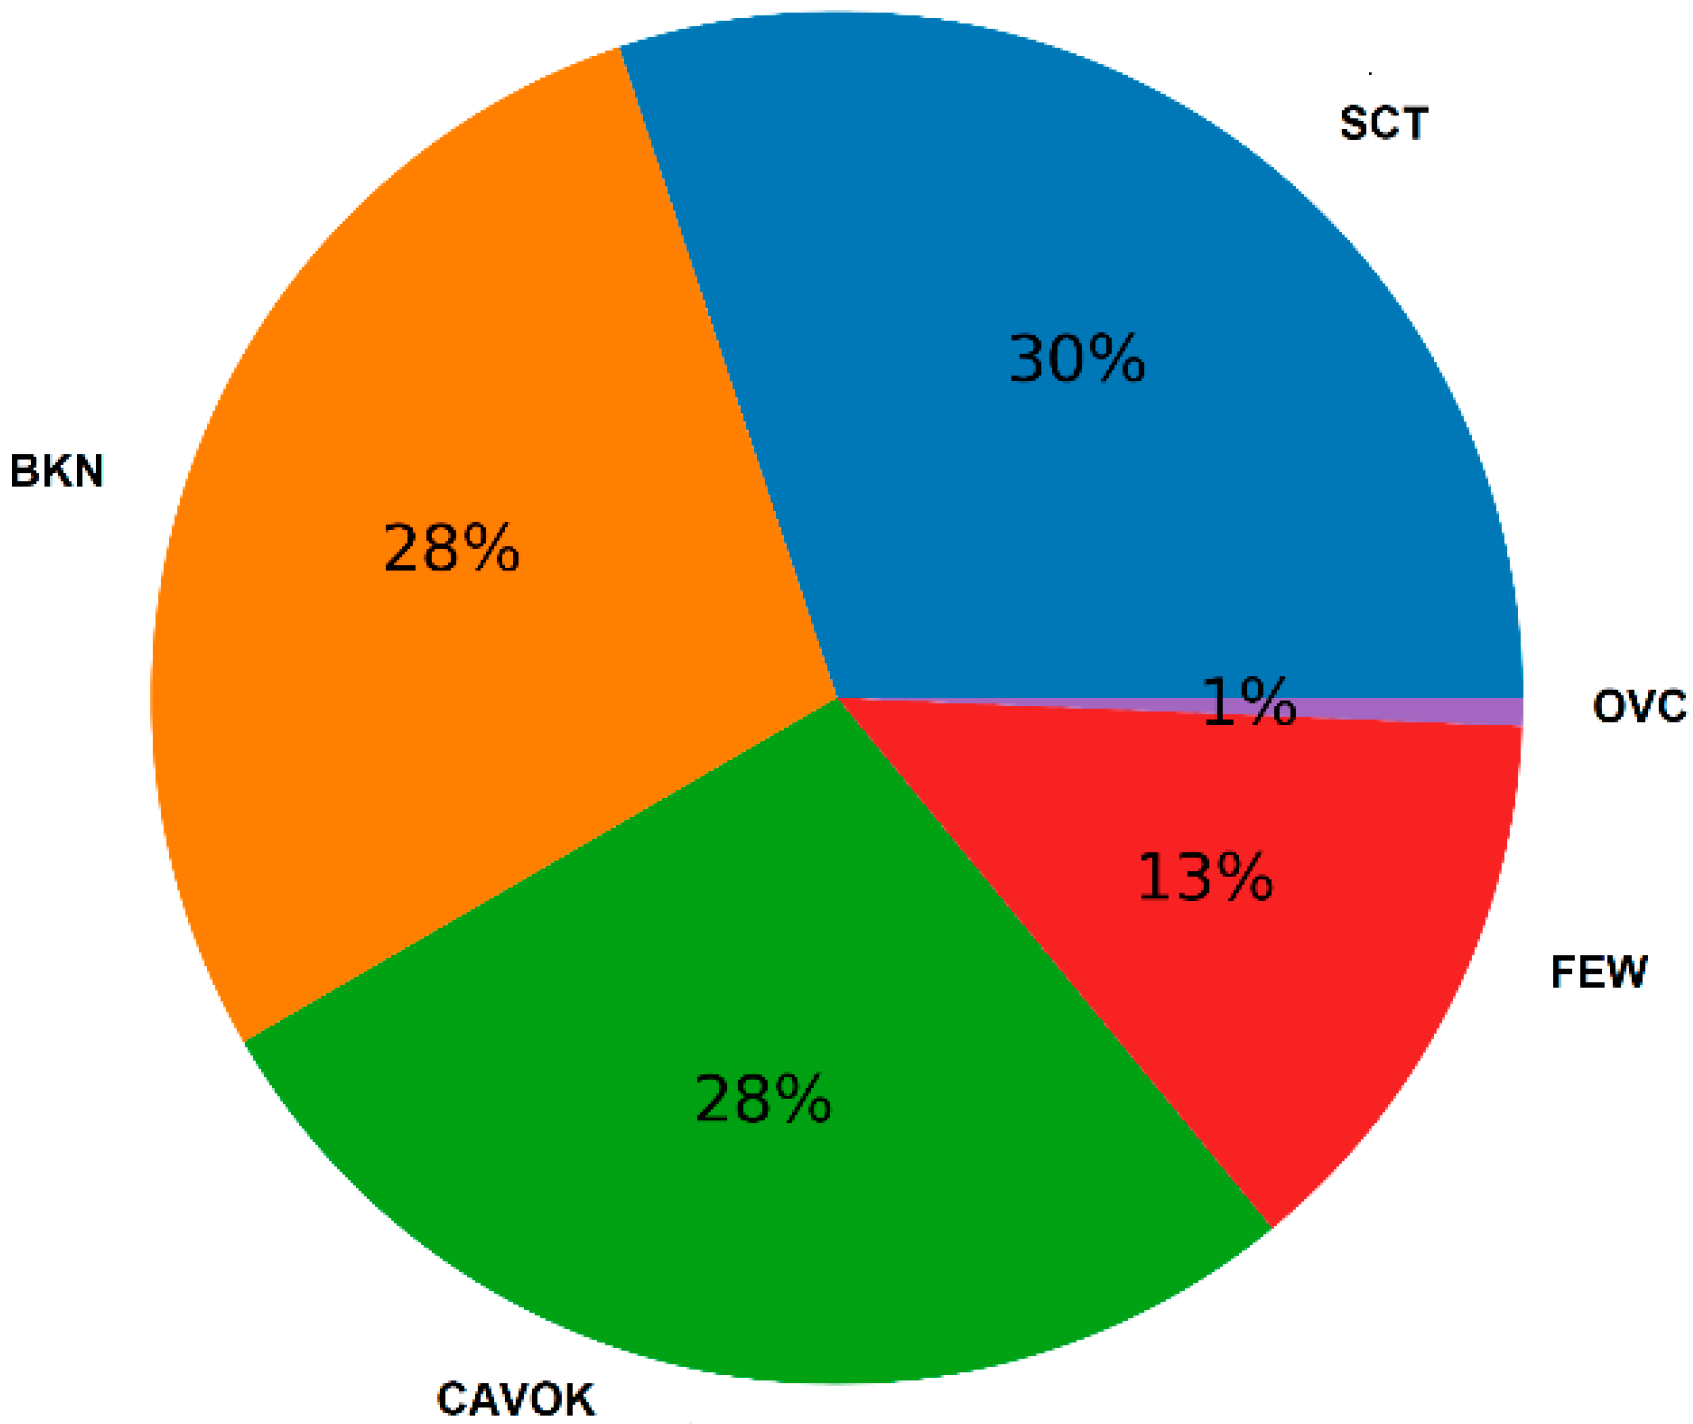
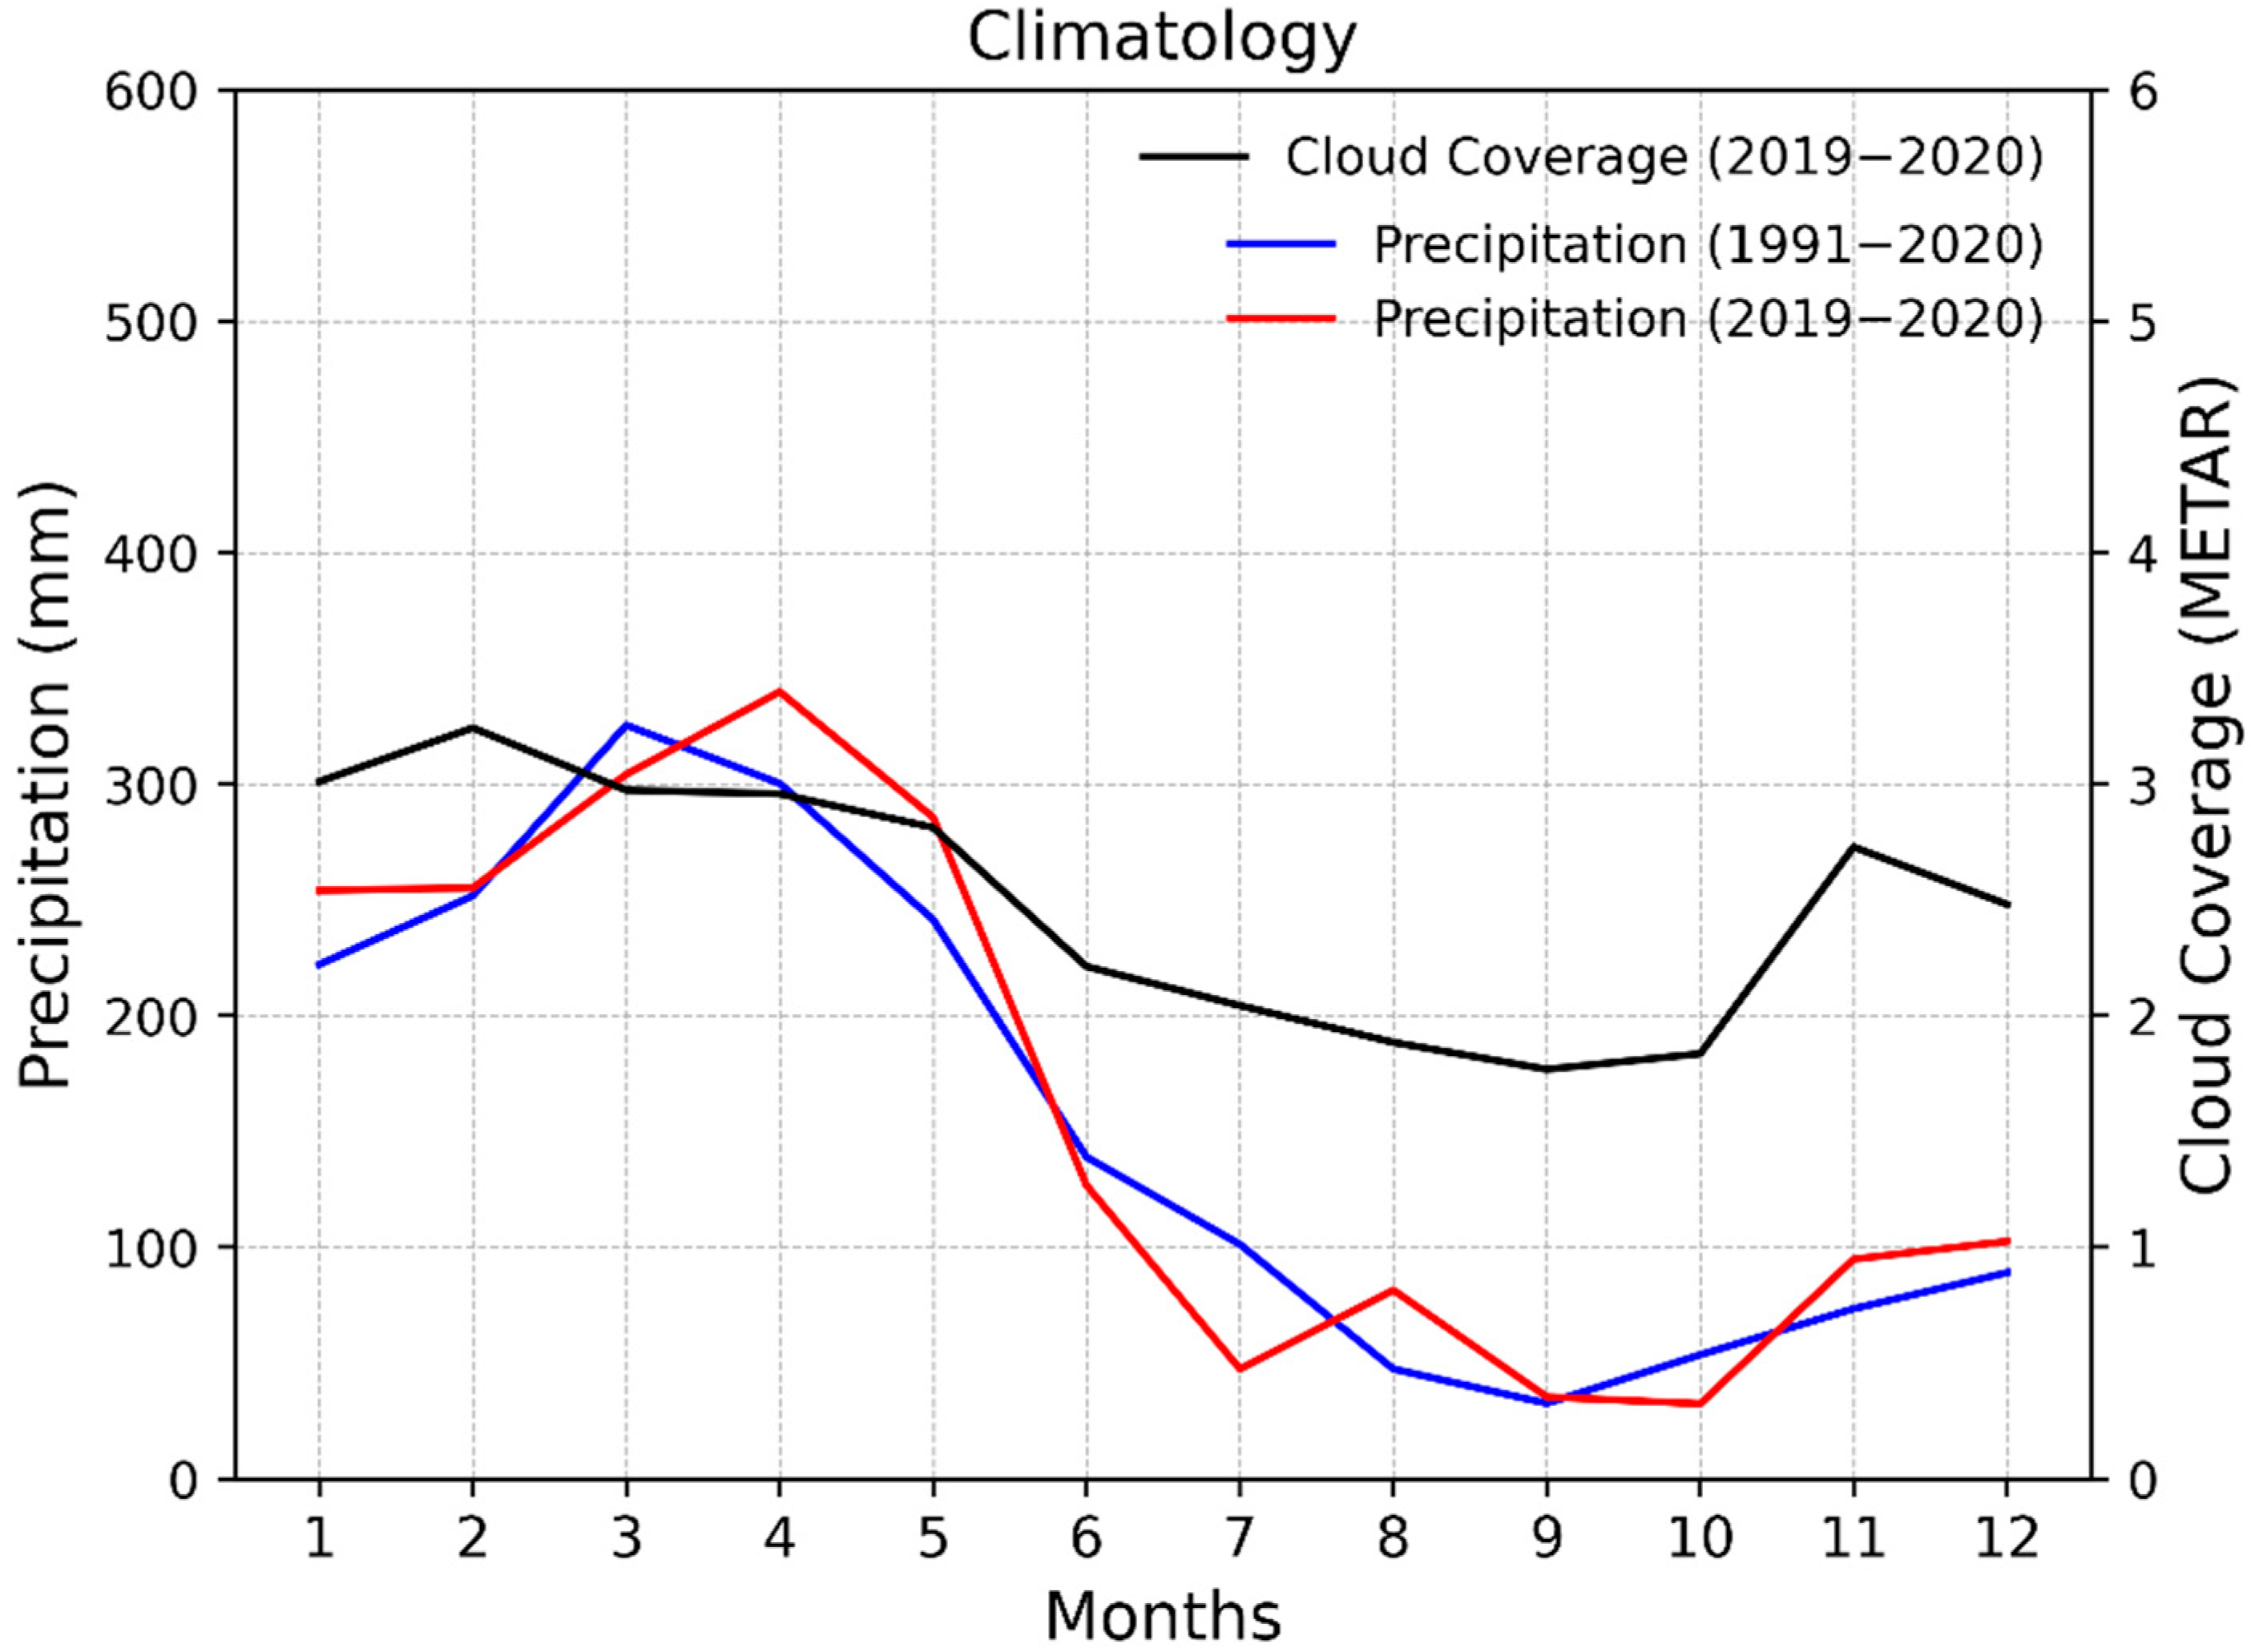
2.1.2. Cloud Clover Data from Santarem’s International Airport

Cloud cover data were obtained from METAR−data from the international airport of Santarém. Downloaded for free through the REDEMET (Air Force Command Meteorology Network) application [32] available in 1−h intervals. Metar data is the regular aerodrome weather report and contains elements such as wind, temperature, lightning, visibility, and others such as cloud height and cover [33].
Traditionally the cloud cover has been determined by human observers and The World Meteorological Organization (WMO) defines the rules for the register of cloud cover [34]. Observers estimate the cloud cover in oktas, dividing the sky into 8 regions and evaluating the regions covered by clouds (Table 1) [32,33]. Clear skies have 0 oktas, and overcast corresponds to 8 oktas [19,33,34].

2.2. Methods and Statistical Analysis

In order to understand how the UVR varies without the influence of clouds, the hours corresponding to the clear sky condition were analyzed as well as the hours in all sky conditions.
In this work, it is considered clear sky 0 oktas, denoted by the acronym CAVOK (“Ceiling in Visibility OK”) and 1 to 2 oktas, denoted by the acronym FEW. [35] used a threshold of 20% of a cloud fraction measured by an all-sky camera, with up to about 70% of the clear sky condition in their survey of the Inter-Comparison Campaign of UVR Instruments under Clear Sky Conditions at Reunion Island (21° S, 55° E). Therefore, 0, 1 and 2 oktas can be used to represent clear skies, as they represent less than 30% sky coverage.
As the cloud cover data were in hourly frequency, the UVR series were grouped according to the hourly average in order to select the hours corresponding to the clear sky condition. For the 2 years of study, hours of clear sky represented 37% of the total, however, due to gaps in UVR data, this percentage was larger, 41% (Figure 3), since only the hours of sky coverage with corresponding UVR data were analyzed.
In order to provide information about data variability, through the use of statistical measures, boxplots were prepared. The boxplot is a visual statistical method that composes a specific resource to detect trends and replace tables, besides contributing to better data interpretation, detection of outliers adend comparison of sample groups [36].
The monthly distribution of the data was also performed, as well as the seasonal distribution of the year: Rainy period (January, February, April, May, and June) and dry period (July, August, September, October, November, and December). The average over the study period for UVR in the two sky conditions was also calculated. Although the dataset does not cover a sufficient period to be climatologically significant, the monthly variability and the differences between clear sky and all-sky UVR present interesting results.
The climatology of the cloud cover using METAR data and precipitation using data obtained for free from the INMET (National Institute of Meteorology) website were also calculated (Figure 4) in order to illustrate the rainy and dry season divisions adopted in this work.

3. Results and Discussion

In this section, the UVR time variability in clear sky and all sky conditions patterns are presented to demonstrate how UVR varies without the influence of cloud cover, furthermore to understanding how seasonality influences the intensity of surface UVR in an Amazon city.

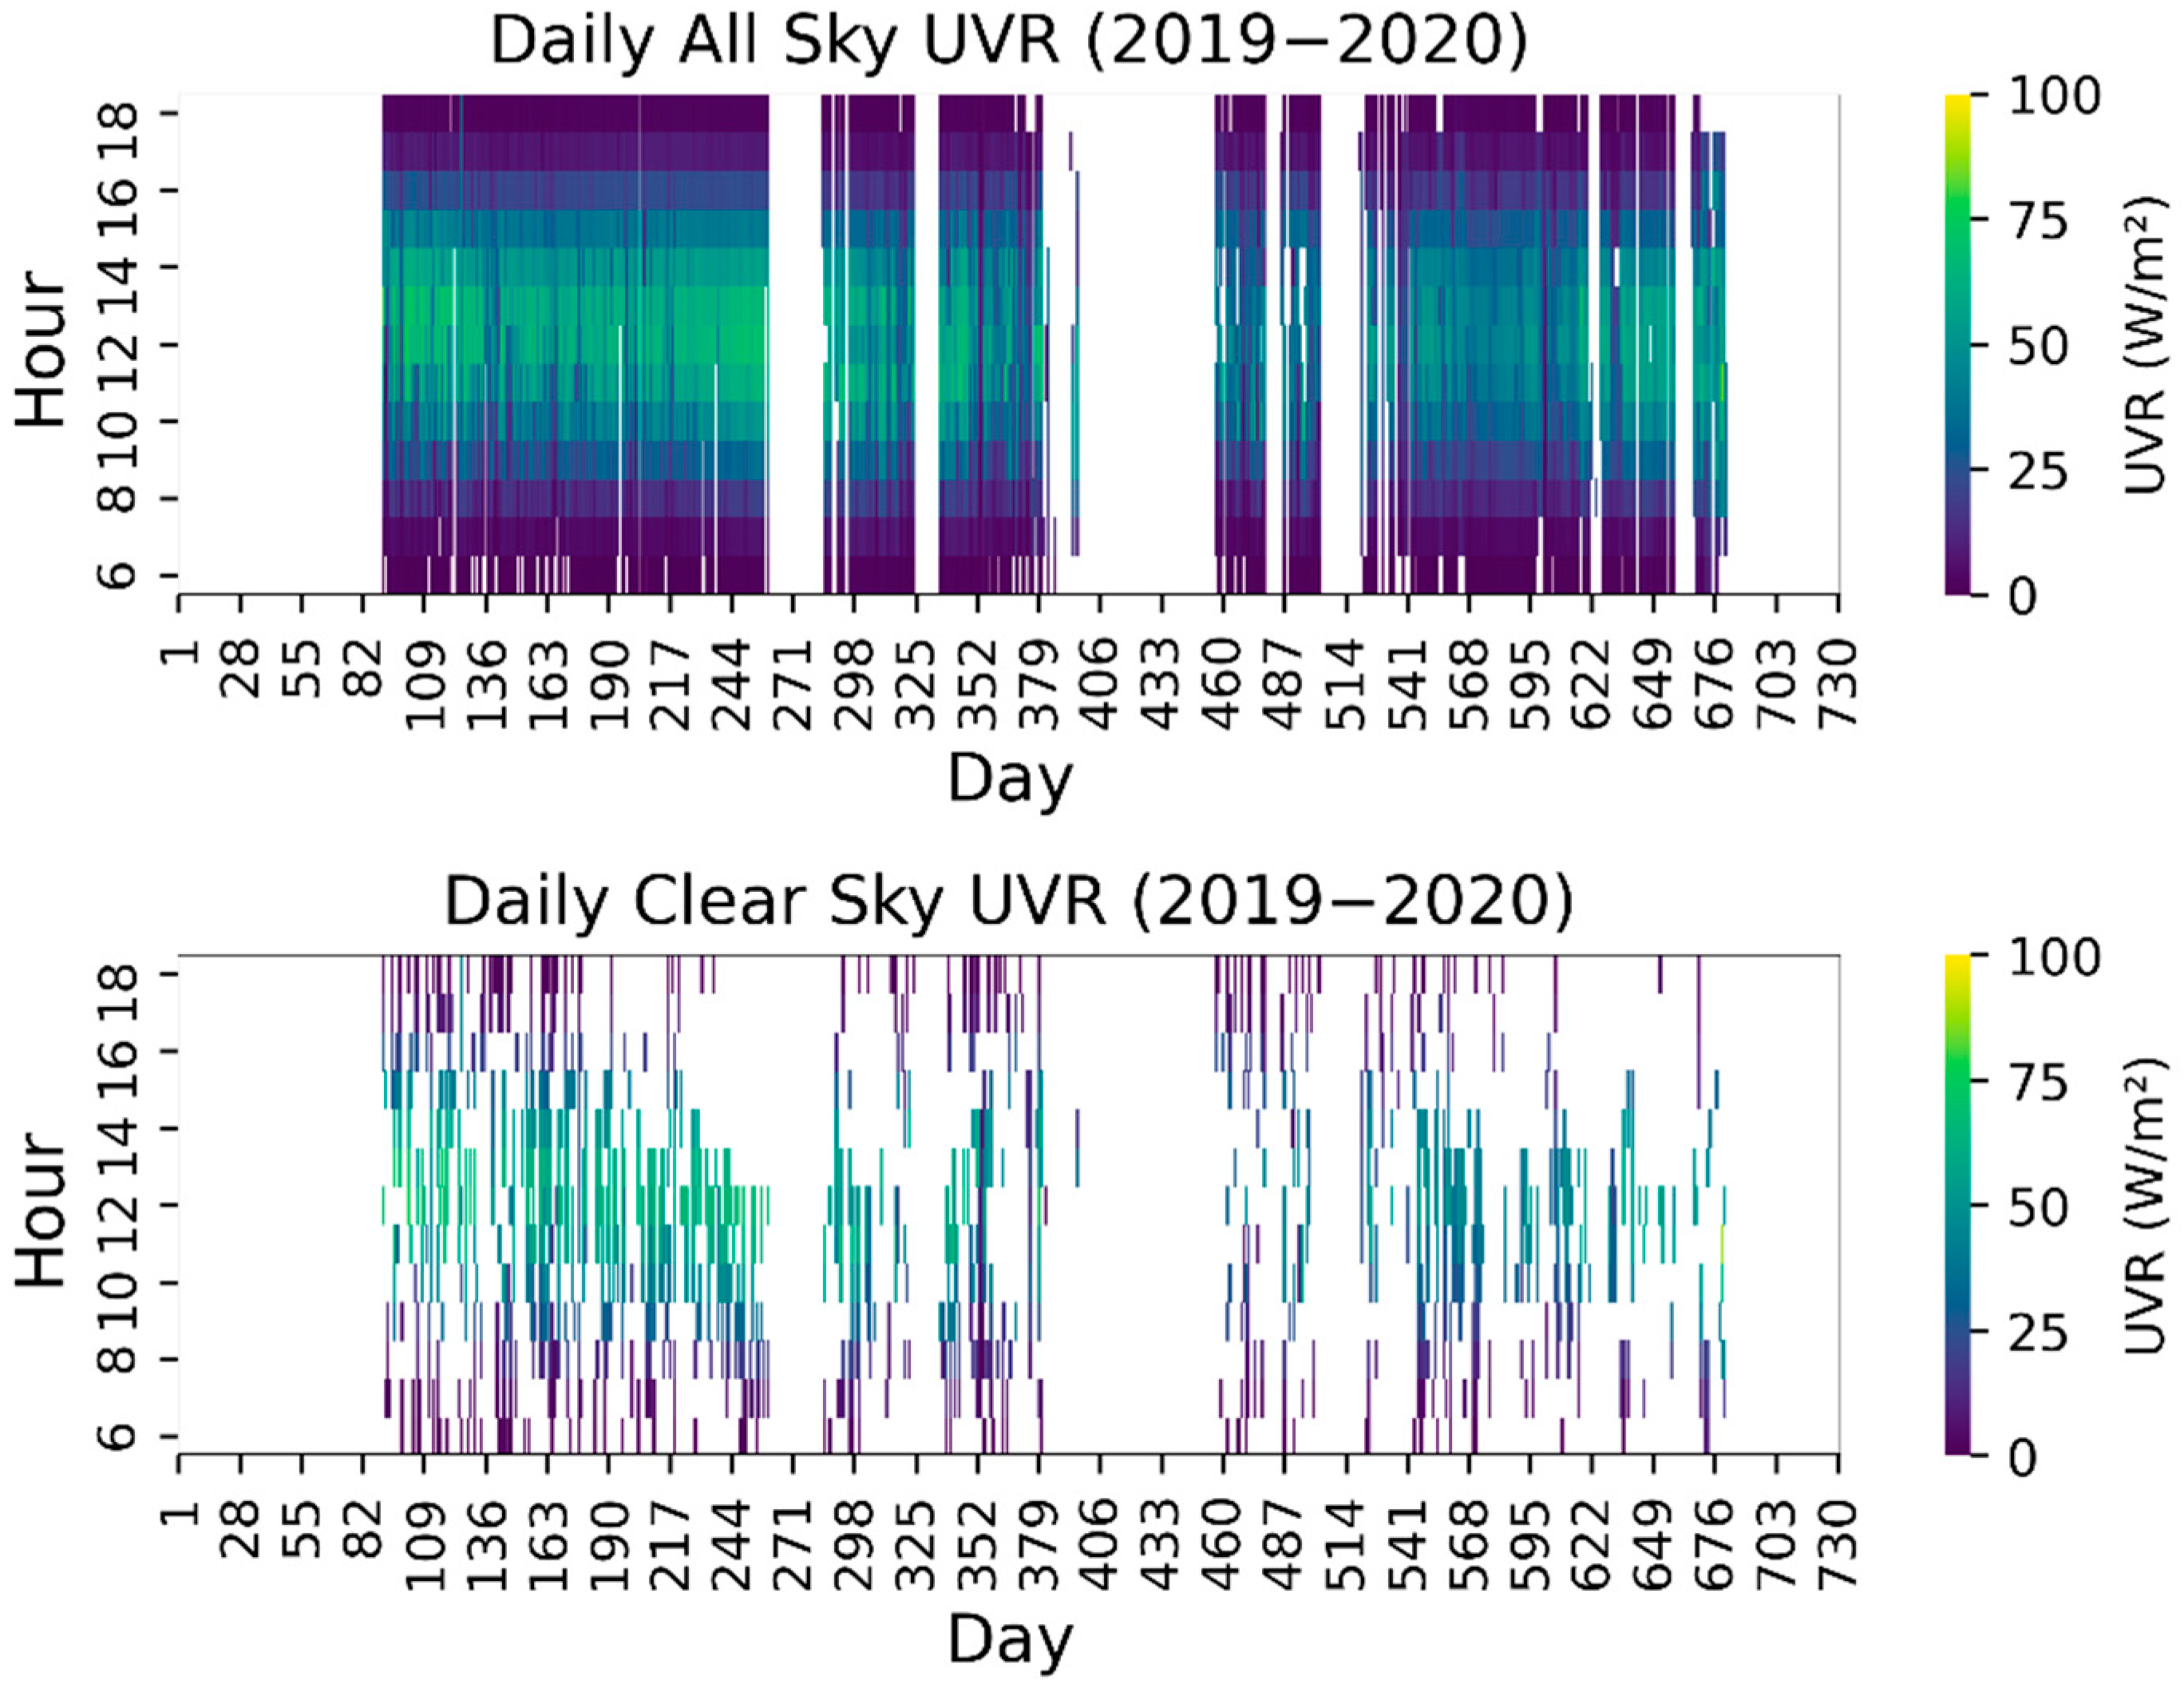
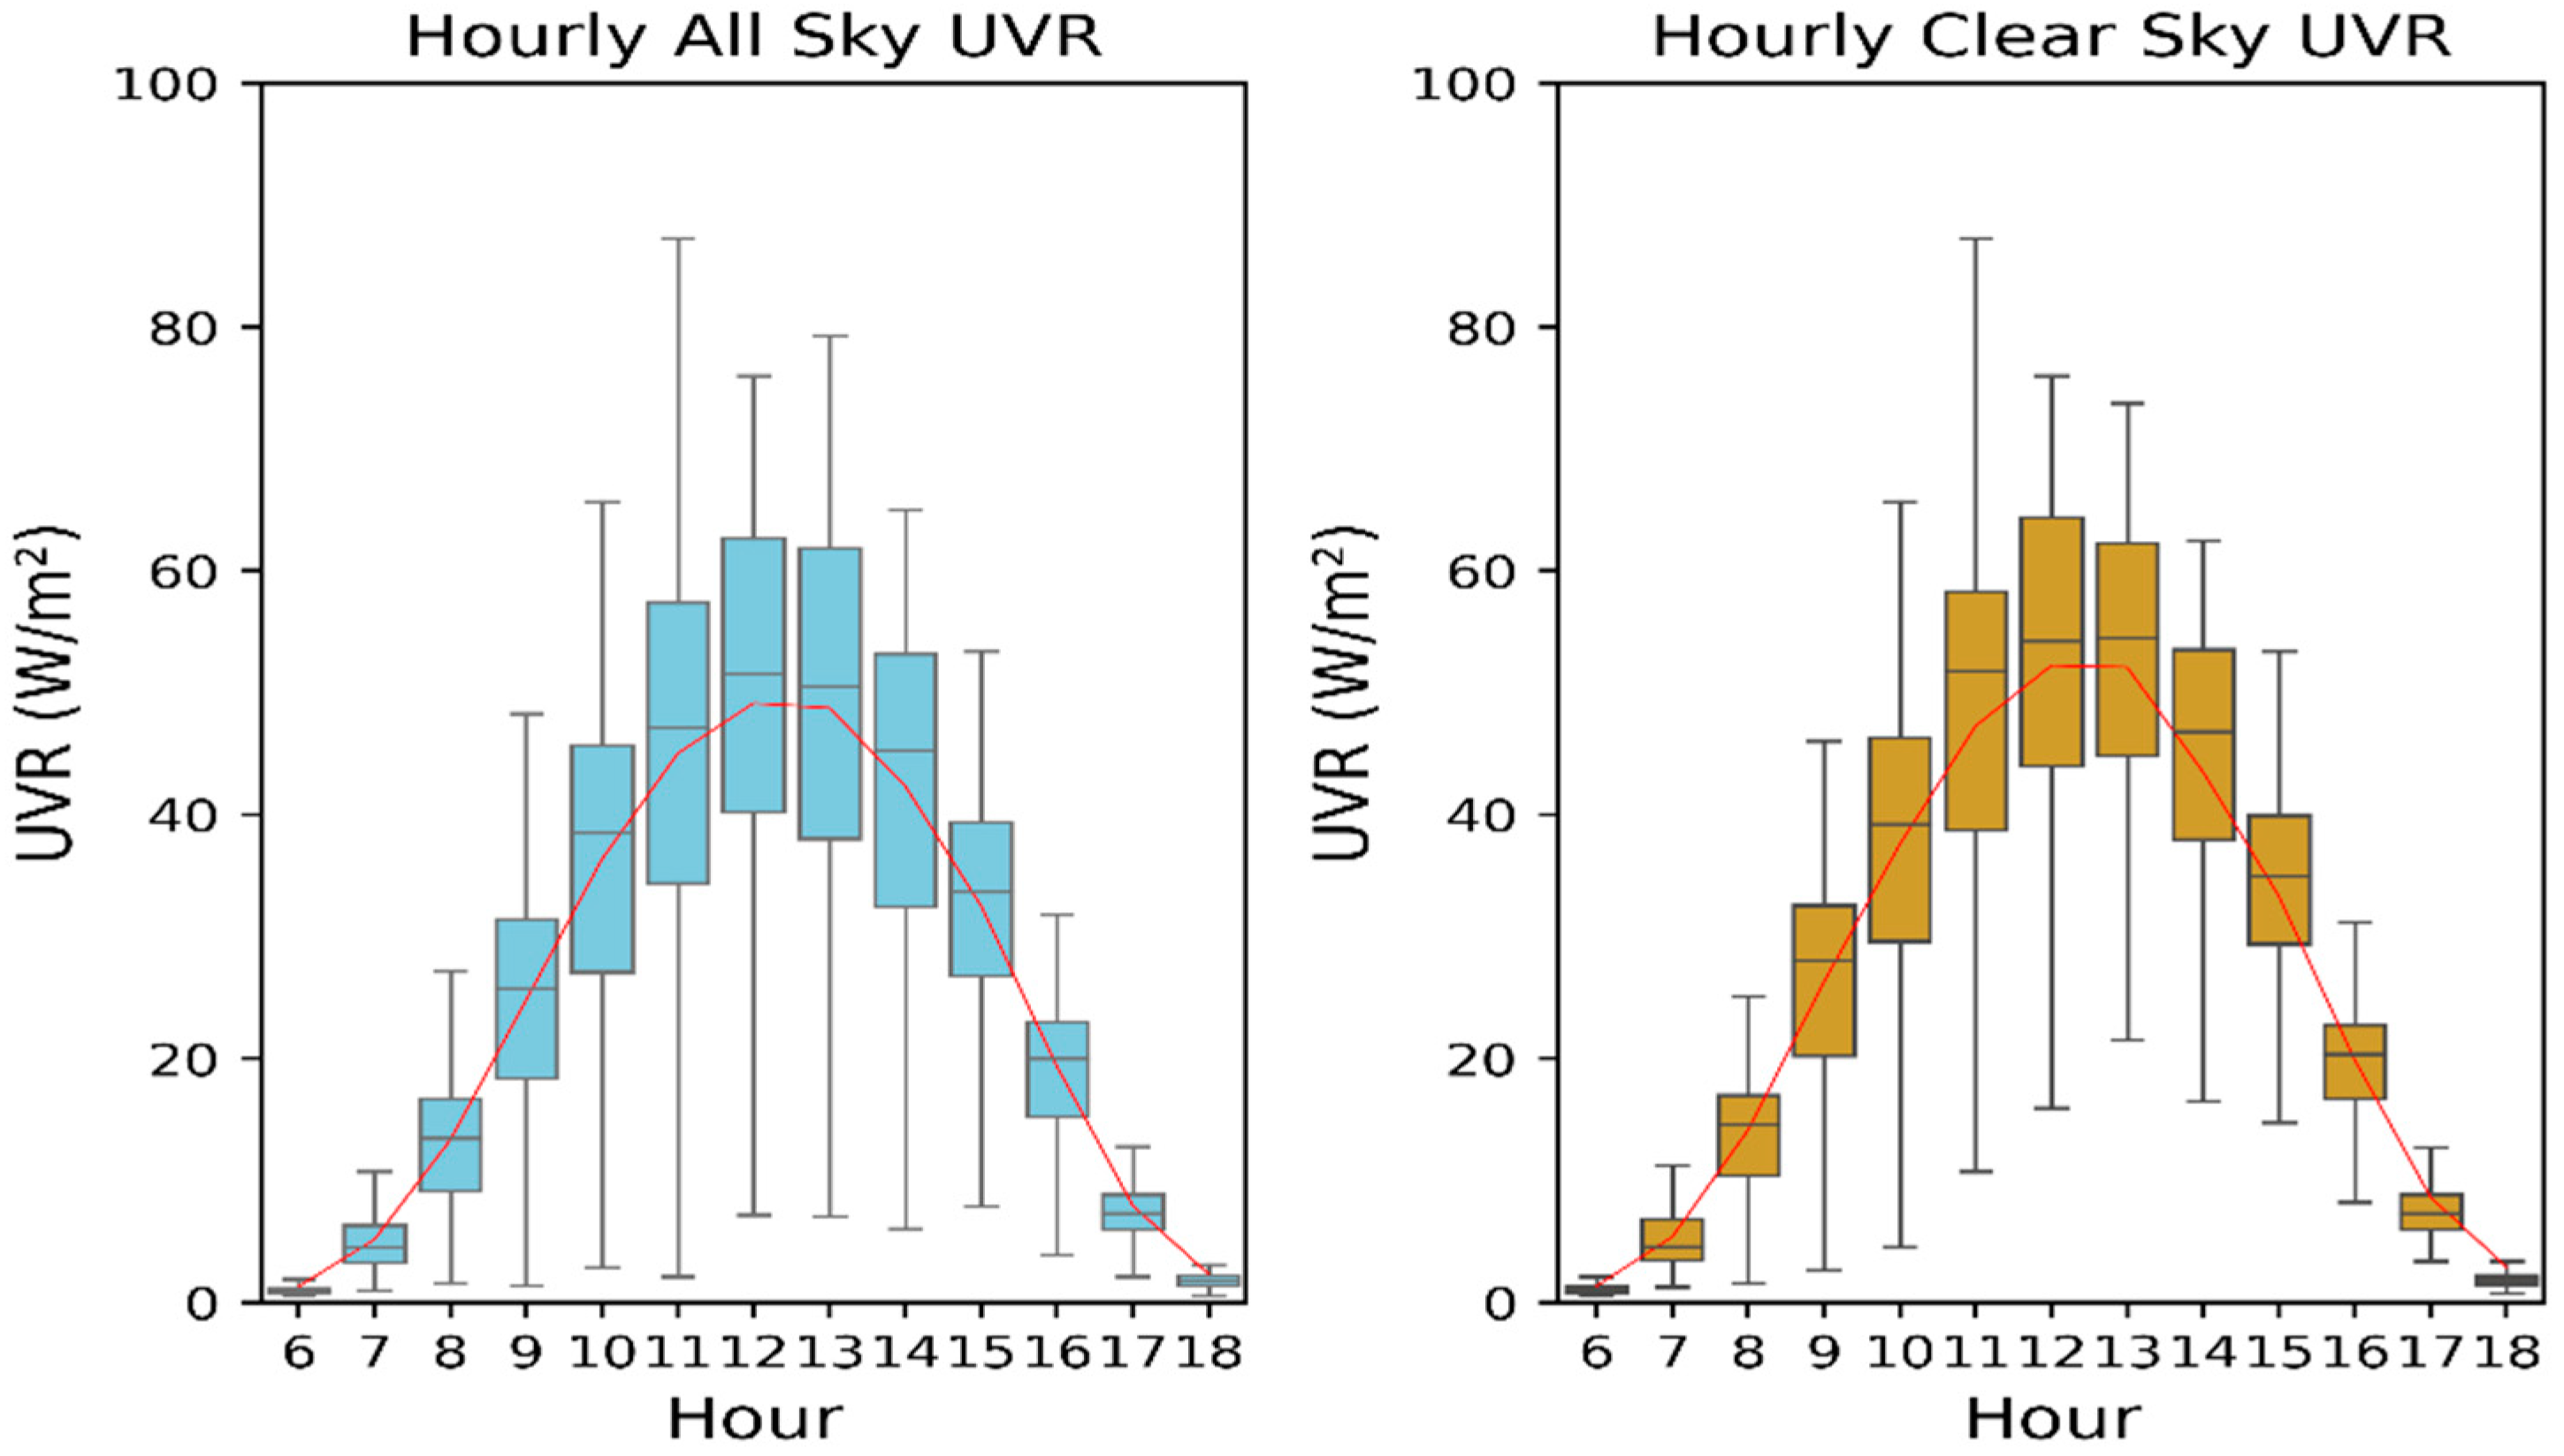
3.1. UVR Hour-Daily Series in Clear Sky and All Sky Conditions

Daily hourly averages of UVR from April 2019 to November 2020 are shown in Figure 5. Of the 731 days corresponding to the years 2019 and 2020, the UVR series obtained contains 443 days of data and thus 288 days without UVR data. Of all these days monitored, 333 had some hour of clear sky condition. A total of 3194 h of UVR data under all sky conditions and 1309 under a clear sky. In both all sky and clear sky conditions the maximums occurred around local solar noon (UTC−3) and reached a maximum of 87 W / m 2 at 11 am in November, in the dry period under clear sky condition. Although the maximum occurred at 11 am, the time of greatest intensity was at noon (Figure 6), with an average of 49.15 W / m 2 under all sky conditions and 52.24 W / m 2 under clear sky conditions. It can be observed that the hourly amplitude of UVR is greater under all sky conditions than under clear sky condition, mainly between 11 am and 3 pm. Also, intensity above 40   W / m 2 was recorded from 9 am to 3 pm, which indicates that even early in the morning (9 am) levels of UVR start being dangerous, requiring adequate sun protection. Between 6 pm and 7 pm when the sun sets, the average recorded was 2.33 W / m 2 and 2.91 W / m 2 under all sky conditions and clear sky conditions respectively.
Santarém is located in a tropical region, at a low latitude, close to the equator, therefore solar zenith angle (SZA) is lower throughout the year, which induces a higher UVR, smaller amplitude between the seasons, as well as a very low photoperiod variation. Predictably, the intensity of radiation on the ground is highest around solar noon when the SZA is minimum.
Global and UV irradiances had similar variation throughout the year and the maximum irradiances also occurred in the Spring/Summer months (dry period) at Maceió-Northeastern Brazil [37]. A maximum happening in months of transition to the dry period the rainy (December–January) was also reported by [4,38] in their studies of UVI variability at tropical latitudes. [4] found comparable characteristics by studying the variability of UVI at Indian Ocean stations located at different latitudes between the equator and 20° S. For example, they observed that Mahé, at 4.6° S, had a higher mean UVI than the cities more at the south and explained that the difference was due to latitude.

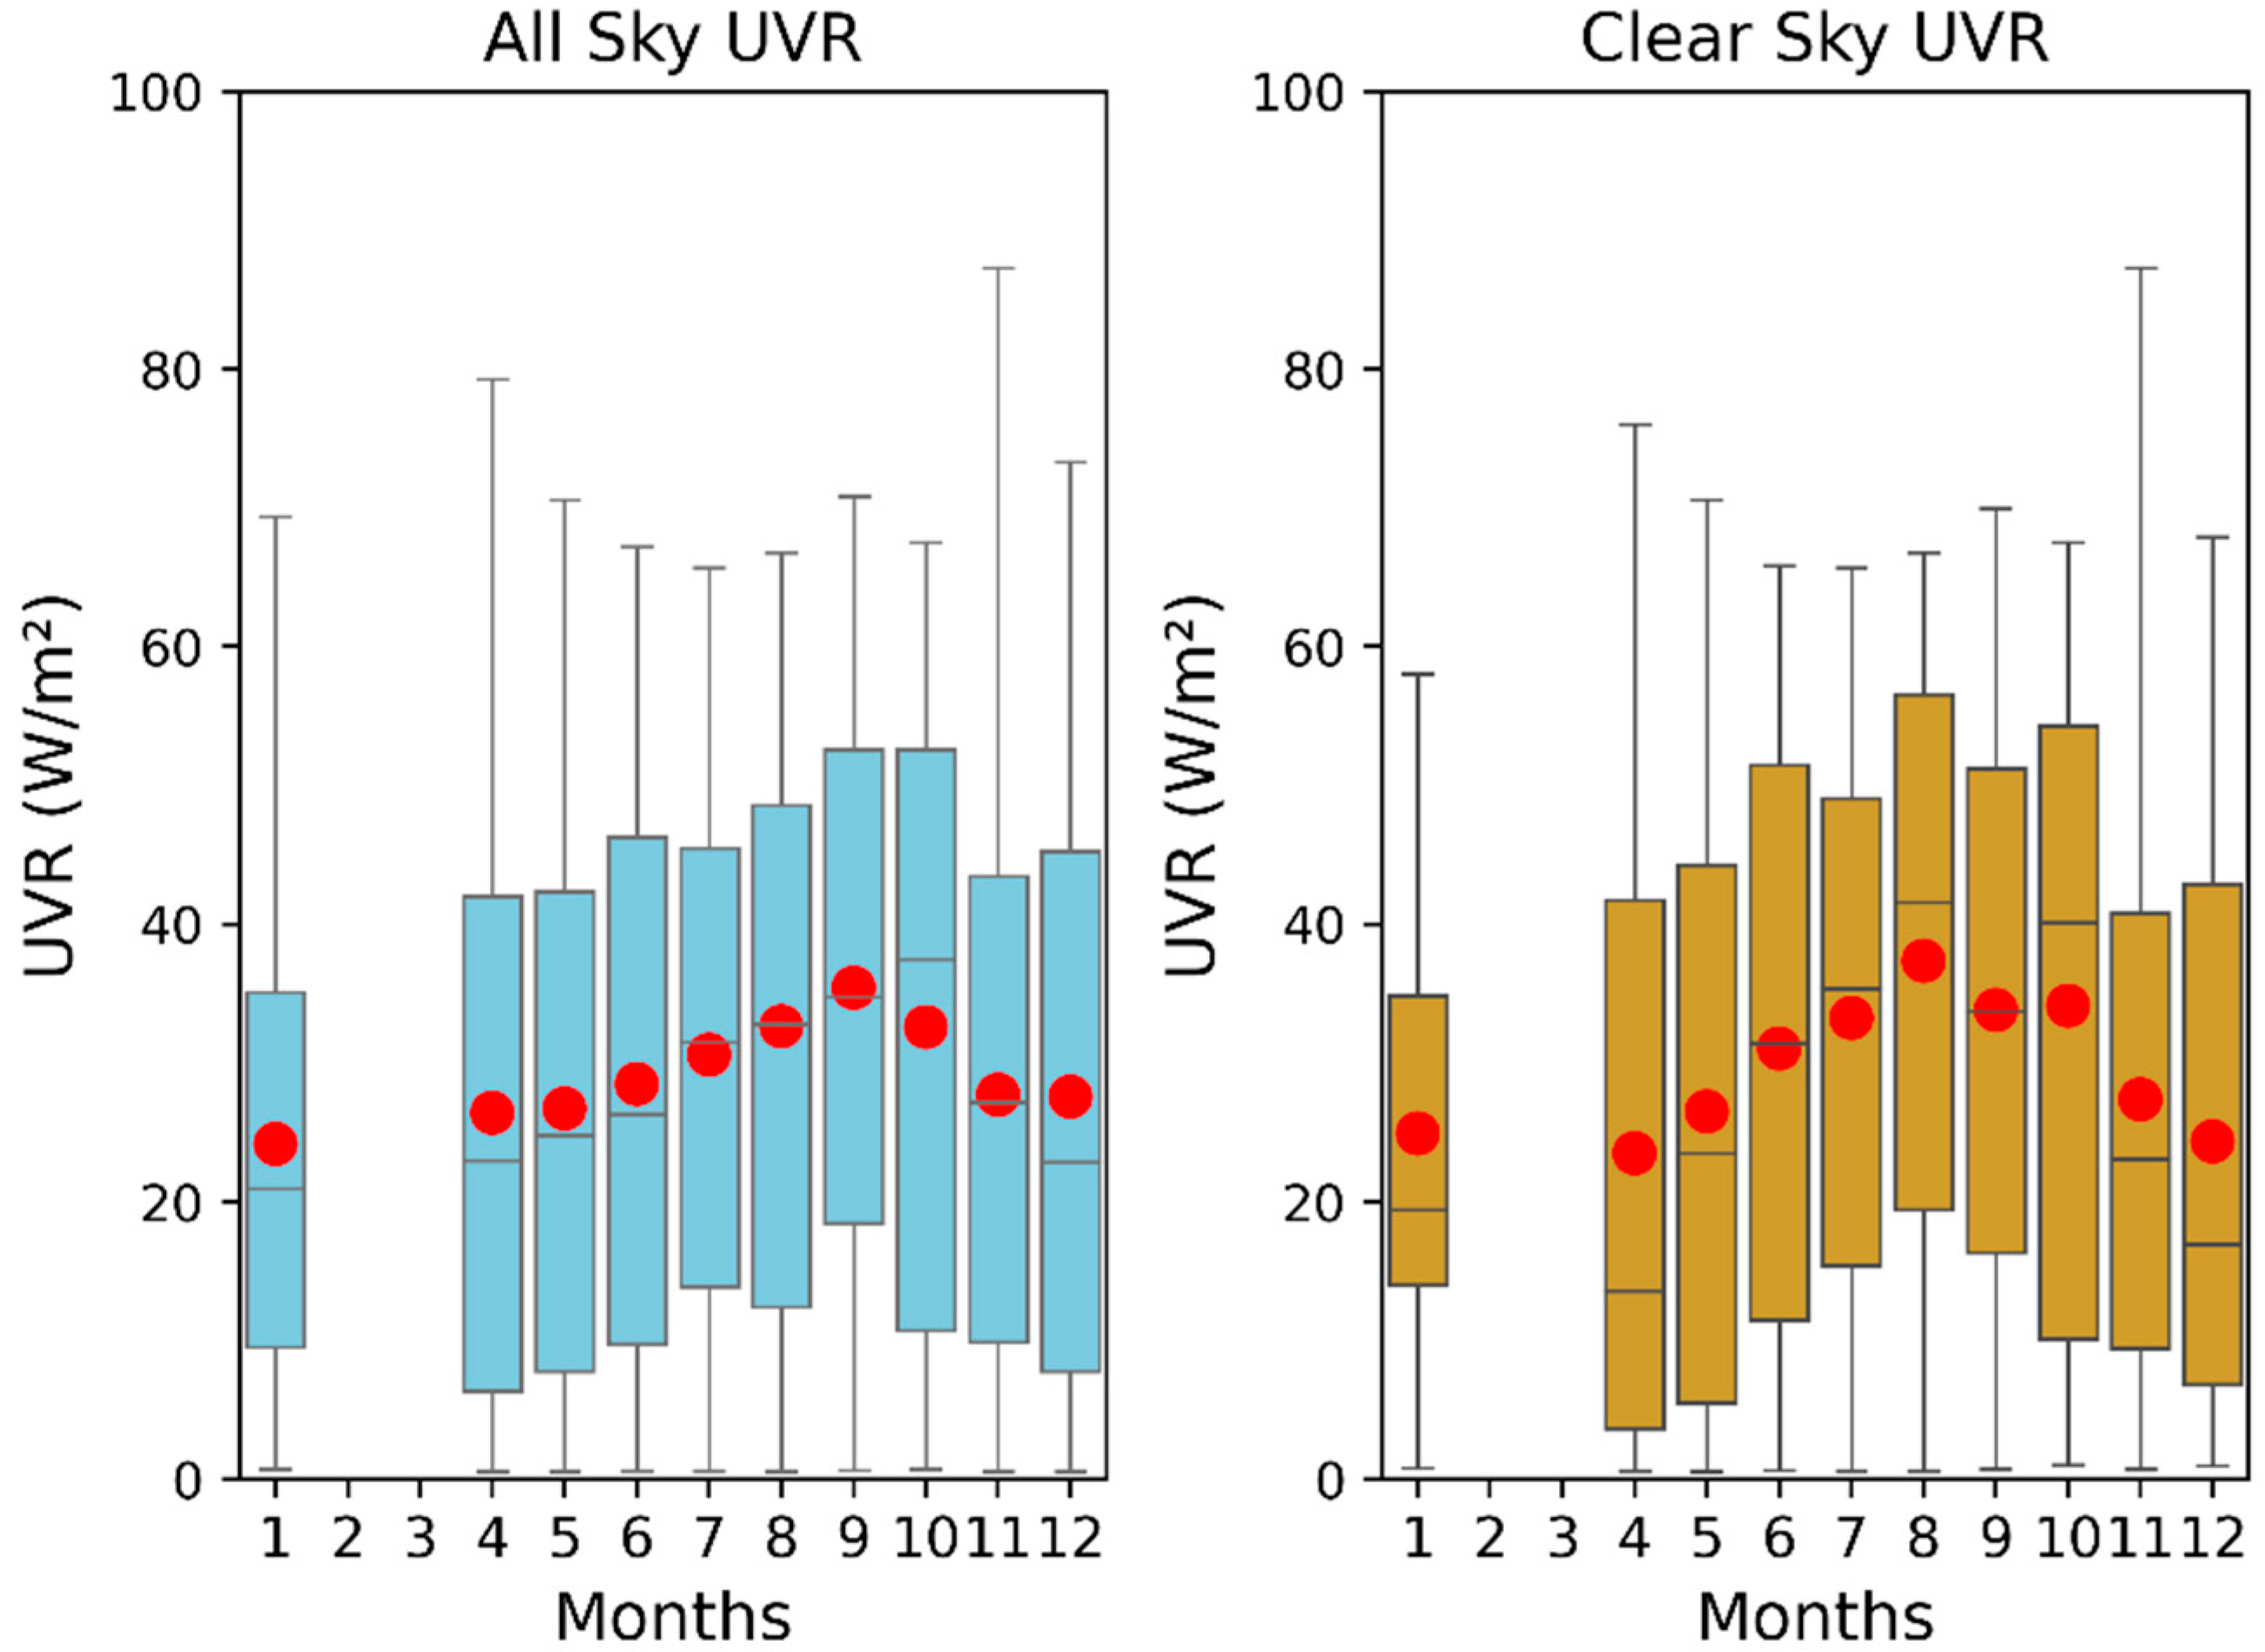
3.2. UVR Monthly Average in Clear Sky and All Sky Conditions

The monthly average for UVR in the two sky conditions (Figure 7) showed that, as can be seen from the boxplots, the UVR intensity is higher during the months that correspond to winter and spring in the south hemisphere, that is, between June and December, but especially between June and October. These months correspond to the dry period in this region and are characterised by less rainfall, higher temperature, and amount of aerosols in the atmosphere, due to the period of fires in the Amazon. Regarding the averages, the variation was smaller under all sky conditions. Ranging from 24.16 W / m 2 in January to 35.41 W / m 2 in September. Under clear sky condition the averages ranged from 23.49 W / m 2 in April to 37.35 W / m 2 in august. An interesting fact is that under clear sky conditions the averages were higher than at all sky conditions mostly in winter and early spring months (June to September) and presented greater amplitude in the transition between rainy and dry seasons. At a fixed latitude, the intensity of UVR depends on the season of the year: generally, in summer the sun is higher than in winter, resulting in more intense UVR in summer than in winter [39], even though, at Santarém’s latitude the four seasons’ characteristics are not predominantly, basic with just summer and winter divisions, indicating the dry (starting in winter in south hemisphere) and the rainy season (starting in summer). Also, the fact that under all sky condition the averages were higher than under clear conditon in some months, like in April, May, and December means that under all sky condition there is some factor that influences these higher averages, such as the presence of cumulus or deep cirrus clouds, which can produce multiple scatterings, increasing locally the UVR flux that reaches the surface [40].
Although the average, median, and third quartile are higher during the dry season months, with September being the month with more hours of higher UVR, the maximums occurred in November, followed by April, January, and December in all sky conditions. April and January are months of the rainy season, and December is a month of transition with cloud cover and pluviosity starting to increasing again, as can be seen in Figure 4. Therefore, cloud cover seems to play an important role in the variability of UV radiation, mostly by attenuation but sometimes by increasing the ground intensity. Besides, under clear sky condition, the maximums occurred in November, April, March, and September.
The fact that months of the rainy season have higher UVR intensity than months of the dry season under clear sky condition can be explained both by the fact that in rainy season there are fewer aerosols in the air than in the dry season, when is the burning season in the Amazon and, like explained before, due to the presence of cumulus or deep cirrus clouds. In this latitude, aerosols and clouds can be expected to have a significant impact on the variability of surface UVR. [37] Observed that in the city Antananarivo, the capital of Madagascar (18.279° S, 47.564° E), aerosols also have an important impact on surface UVI variability.
In addition, the sun passes through the zenith of Santarém (equator) about twice a year at the equinoxes and this is when the highest UVR is expected [41]. In the September equinox there is a greater flow of solar radiation, a fact that added up the atmospheric characteristics of the month of September, such as longer weather with clear skies and less cloud cover, form an explanation for the higher intensity of incident UVR recorded in September. Unfortunately, due to the missing data, in this work, it is not possible to confirm the expected semi-annual cycle on the clear sky UVR during march equinox, when it’s raining season and the heavy cloud cover is supposed to make the radiation levels on the ground drop.

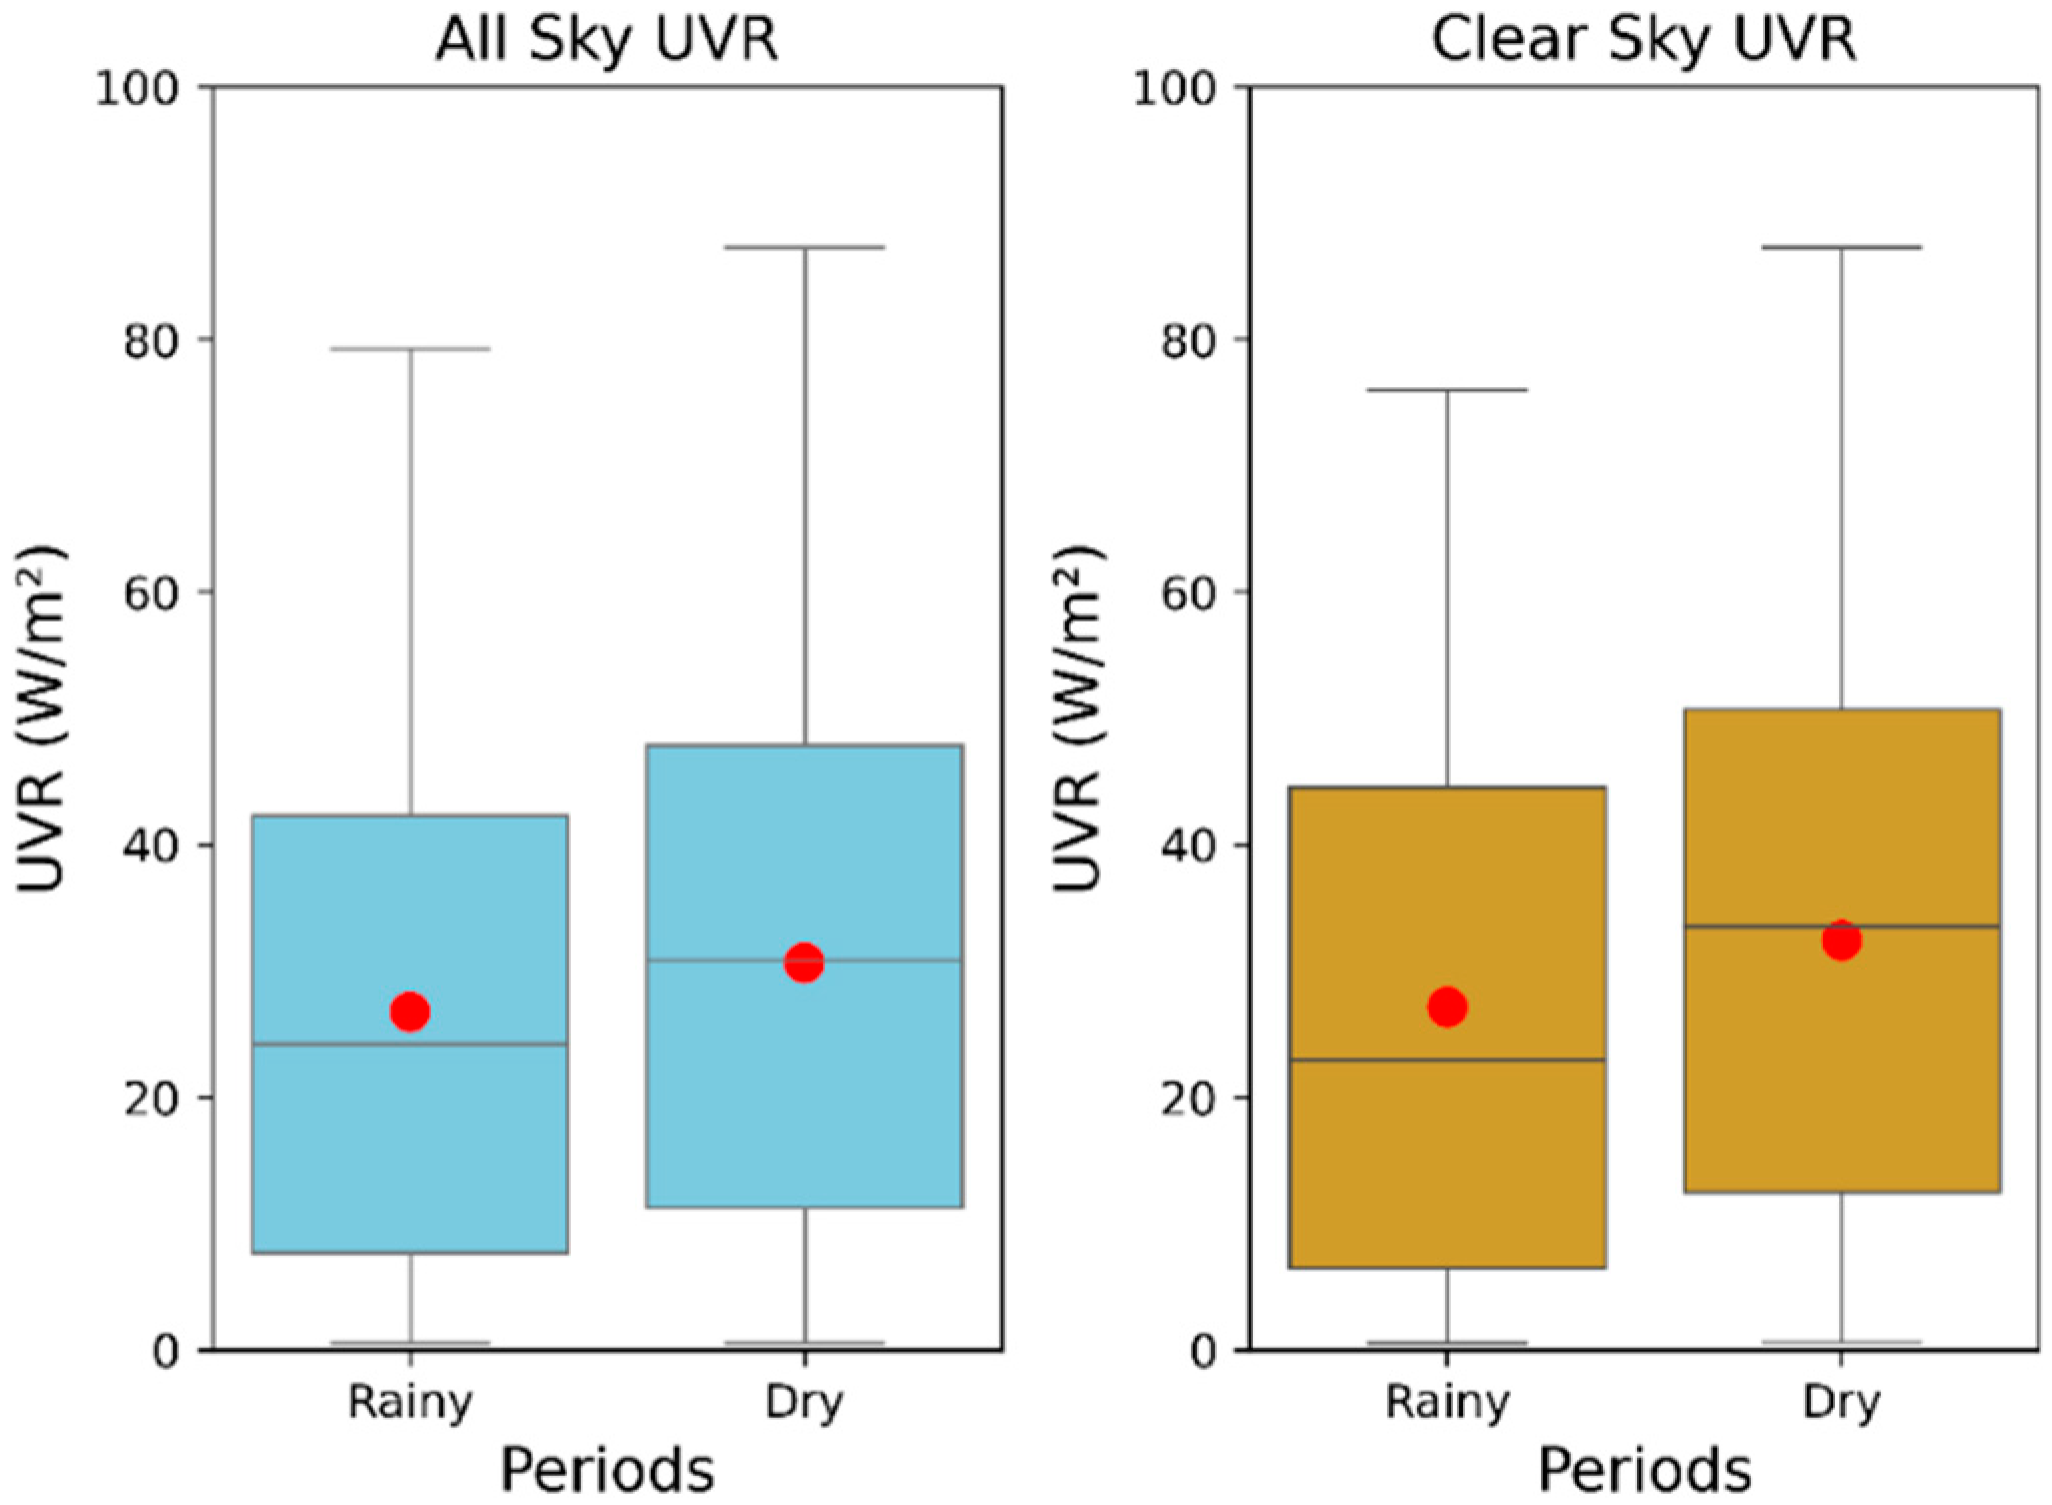
3.3. Average Level of UVR According to the Period in Clear Sky and All Sky Conditions

Figure 7 reinforces the characteristics of the incident surface UVR variability discussed in the previous topics. Figure 8 shows that both in all and clear sky conditions, the dry season had a higher average than the rainy season. In clear sky condition the maximum reached 76 W / m 2 and 87 W / m 2 in rainy and dry seasons, respectively. Under all sky conditions the maximum in the rainy period was 79 W / m 2 and reaching 87 W / m 2 in the dry period, the same of the clear sky condition because all sky conditions englobe it. The area between the first and third quartiles also starts and ends at higher UVR levels in the dry season than in the rainy season, in both sky conditions, which means once again that the surface UVR intensity in the dry period is higher.
In the rainy period under all sky conditions clouds can decrease direct radiation, and can also produce an increase in the amount of diffuse radiation reaching Earth’s surface leading to an enhancement in surface UVR intensity, which can explain the small variation between the maximums and averages in the periods in all sky conditions, together with the latitude factor.
It is important to note that due to the missing months (February and March) the difference in UVR intensity between the dry and rainy periods may not correctly represent reality. Although it is a good indicator of what the temporal variation of UVR is like between these periods at this Amazonian site.
The characteristics of the temporal variability of the incident surface UVR under clear sky condition show that the UVR at this latitude, in the Amazon region, presents slight variation during the year, even so, the months corresponding to the dry period presents the highest intensities, demonstrating that the influence of seasonality does not happen as expected, with highest intense of UVR not happening in summer months, but in months corresponding to winter and spring in the southern hemisphere. Another factor that can influence and needs to be analyzed in the future is also the influence of aerosols, since, as already published by other authors, in the Amazon region, biomass burning is the main driver of changes in atmospheric composition, accounting for a significant increase in the particle numbers concentration in the dry season [25,42,43]. In the dry season, where biomass burning emissions are widespread, the reduction in the ground-based flux of photosynthetic active radiation (PAR) can reach values of the order of 70% [44,45,46]. Therefore, it is expected that this variation in the amount of aerosols also acts as an important factor influencing UVR variability and needs to be taken into account.
In summary, there is a large variation in the incident solar radiation at many locations throughout the year because of the changing angle of inclination of the Earth with respect to the Sun [47]. At the equator there is little difference, as was shown for Santarém’s latitude here in this paper, with a slight UVR intensity difference between the periods. The results also indicate, as expected, that cloud cover has an influence on the variability of UVR in this region, both to dissipate and to intensify the incident UVR, for example, with the highest intensities recorded during summer months (less cloud cover) and the highest maximums in some rainy period months in all sky conditions, than in the same months in clear sky condition, indicating the presence of clouds with the characteristics to increase incident UVR. The same happens in relation to aerosols, which in months with more clear sky conditions, are the explanation for the decrease in incident UVR at the surface. The dynamics of aerosols, together with the behavior of cloud cover appears to be the main factors for the characteristics of the temporal variability of UVR at this site, under clear and under all sky conditions. In Amazonia, there are major gaps in understanding the complex relationship of biosphere-atmosphere interactions. Therefore, more long-term environmental measurements are necessary in order to substantiate the results of this first study.

4. Conclusions

Through this work, it was possible to start the monitoring of the surface UVR in Santarém and to characterize its temporal variability under clear and all sky conditions using ground-based UVR data and cloud cover METAR data.
In both all sky and clear sky conditions the maximums occurred around local solar noon. UVR showed slight variation throughout the year, even so, the months corresponding to the dry period presented the highest intensities. Of the entire study period, the maximum was reached under clear sky conditions in the dry period.
The results also indicate, as expected, that cloud cover has its influence on the variability of UVR in this region, both to dissipate and to intensify the incident UVR. These patterns are in agreement with what is reported in the literature for latitudes comparable to Santarém. Also, other factors that can influence and need to be analysed in the future are the influence of aerosols, and the influence of seasonality, which due to the missing data, in this work we could not confirm the semi-annual cycle of the clear sky.
This first study has made it possible to begin analysing the evolution of UVR on the ground at Santarém, in the Amazon region, over a period of 2 years. It will be necessary to extend the measurements over time to consolidate these results over several years and to obtain representative UVR climatologies for this site, but this first study already provides a reference for other studies requiring knowledge of UV irradiance. Examples are health studies or the influence of UVR on vegetation and forests. In the future, it will also be important to look at the influence of other factors on UVR variability. Among these important factors are aerosol loading, atmospheric ozone amounts or cloud cover.

Author Contributions

Conceptualization, R.S., G.R., L.P., T.P. and K.L.; methodology, G.R., L.P., T.P. and K.L.; software and hardware, R.S., H.N., S.S. and R.B.; formal analysis, G.R.; data curation, G.R., S.S. and H.N.; writing—Original draft preparation, G.R.; writing—Review & editing, G.R., T.P., H.B., K.L. and D.P.; funding acquisition, R.S., L.P., T.P., H.B. and D.P. All authors have read and agreed to the published version of the manuscript.

Funding

This research was funded by FAPESPA (Amazon Foundation for the Support of Studies and Research), CNPQ (National Council for Scientific and Technological Development) an entity linked to the Ministry of Science, Technology and Innovations to encourage research in Brazil, CAPES (Coordination for the Improvement of Higher Education Personnel) a foundation linked to the Brazilian Ministry of Education, CAPES project number 88887.130199/2017—01 and COFECUB (French Evaluation Committee of the University and Scientific Cooperation with Brazil).

Institutional Review Board Statement

Not applicable.

Informed Consent Statement

Not applicable.

Data Availability Statement

Data are available on request from G.R.

Acknowledgments

We acknowledge support and funding of this work by CNPQ (National Council for Scientific and Technological Development) during the main author’s master’s period in the post-graduate program in Natural Resources of the Amazon (PPGRNA) at the Federal University of Western Pará (UFOPA). Also, the FAPESPA for the PhD scholarship in the Post Graduate Program in Society Nature and Development. To CAPES (Coordination for the Improvement of Higher Education Personnel) and COFECUB (French Evaluation Committee of the University and Scientific Cooperation with Brazil) for the sandwich PhD scholarship awarded to the MESO project (Modeling and Prediction of the Secondary Effects of the Antarctic Ozone hole). To LACy (UMR 8105 CNRS, Météo-France) and the University of Réunion.

Conflicts of Interest

The authors declare not conflict of interest.

References

  1. Corrêa, M.D.P.; Pires, L.C. Doses of erythemal ultraviolet radiation observed in Brazil. Int. J. Dermatol. 2013, 52, 966–973. [Google Scholar] [CrossRef]
  2. Salas, L.F.S.; Rojas, J.L.F.; Filho, A.J.P.; Karam, H.A. Ultraviolet solar radiation in the tropical central Andes (12.0 °S). Photochem. Photobiol. Sci. 2017, 16, 954–971. [Google Scholar] [CrossRef] [PubMed]
  3. Cadet, J.-M.; Bencherif, H.; Cadet, N.; Lamy, K.; Portafaix, T.; Belus, M.; Brogniez, C.; Auriol, F.; Metzger, J.-M.; Wright, C. Solar UV Radiation in the Tropics: Human Exposure at Reunion Island (21° S, 55° E) during Summer Outdoor Activities. Int. J. Environ. Res. Public Health 2020, 17, 8105. [Google Scholar] [CrossRef] [PubMed]
  4. Lamy, K.; Portafaix, T.; Brogniez, C.; Lakkala, K.; Pitkänen, M.R.A.; Arola, A.; Forestier, J.-B.; Amelie, V.; Toihir, M.A.; Rakotoniaina, S. UV-Indien network: Ground-based measurements dedicated to the monitoring of UV radiation over the western Indian Ocean. Earth Syst. Sci. Data 2021, 13, 4275–4301. [Google Scholar] [CrossRef]
  5. Bernhard, G.H.; Neale, R.E.; Barnes, P.W.; Neale, P.J.; Zepp, R.G.; Wilson, S.R.; Andrady, A.L.; Bais, A.F.; McKenzie, R.L.; Aucamp, P.J.; et al. Environmental effects of stratospheric ozone depletion, UV radiation and interactions with climate change: UNEP Environmental Effects Assessment Panel, update 2019. Photochem. Photobiol. Sci. 2020, 19, 542–584. [Google Scholar] [CrossRef]
  6. De Oliveira, M.J.; Baptista, G.M.D.M.; Carneiro, C.D.R.; Vecchia, F.A.D.S. Ciclos climáticos e causas naturais das mudanças do clima. Terrae Didat. 2018, 13, 149–184. [Google Scholar] [CrossRef] [Green Version]
  7. Gholamnia, R.; Abtahi, M.; Dobaradaran, S.; Koolivand, A.; Jorfi, S.; Khaloo, S.S.; Bagheri, A.; Vaziri, M.H.; Atabaki, Y.; Alhouei, F.; et al. Spatiotemporal analysis of solar ultraviolet radiation based on Ozone Monitoring Instrument dataset in Iran, 2005–2019. Environ. Pollut. 2021, 287, 117643. [Google Scholar] [CrossRef]
  8. du Preez, D.; Bencherif, H.; Portafaix, T.; Lamy, K.; Wright, C. Solar Ultraviolet Radiation in Pretoria and Its Relations to Aerosols and Tropospheric Ozone during the Biomass Burning Season. Atmosphere 2021, 12, 132. [Google Scholar] [CrossRef]
  9. Foyo-Moreno, I.; Vida, J.; Alados-Arboledas, L. Ground based ultraviolet (290–385 nm) and broadband solar radiation measurements in south-eastern Spain. Int. J. Clim. 1998, 18, 1389–1400. [Google Scholar] [CrossRef] [Green Version]
  10. Bais, A.F.; Lucas, R.M.; Bornman, J.F.; Williamson, C.E.; Sulzberger, B.; Austin, A.; Wilson, S.R.; Andrady, A.L.; Bernhard, G.; McKenzie, R.L.; et al. Environmental effects of ozone depletion, UV radiation and interactions with climate change: UNEP Environmental Effects Assessment Panel, update 2017. Photochem. Photobiol. Sci. 2018, 17, 127–179. [Google Scholar] [CrossRef]
  11. Lucas, R.M.; Byrne, S.N.; Correale, J.; Ilschner, S.; Hart, P.H. Ultraviolet radiation, vitamin D and multiple sclerosis. Neurodegener. Dis. Manag. 2015, 5, 413–424. [Google Scholar] [CrossRef] [PubMed] [Green Version]
  12. Lindqvist, P.G.; Epstein, E.; Nielsen, K.; Landin-Olsson, M.; Ingvar, C.; Olsson, H. Avoidance of sun exposure as a risk factor for major causes of death: A competing risk analysis of the Melanoma in Southern Sweden cohort. J. Intern. Med. 2016, 280, 375–387. [Google Scholar] [CrossRef] [PubMed]
  13. Lindqvist, P.G.; Landin-Olsson, M. The relationship between sun exposure and all-cause mortality. Photochem. Photobiol. Sci. 2016, 16, 354–361. [Google Scholar] [CrossRef] [PubMed]
  14. World Health Organization; International Commission on Non-Ionizing Radiation Protection. Global Solar UV Index: A Practical Guide; World Health Organization: Geneva, Switzerland, 2002; Available online: https://apps.who.int/iris/handle/10665/42459 (accessed on 29 April 2021).
  15. Ministério da Saúde. Instituto Nacional de Câncer José Alencar Gomes da Silva. Estimativa 2020: Incidência de Câncer no Brasil. 2019. Available online: https://www.inca.gov.br/sites/ufu.sti.inca.local/files/media/document/estimativa-2020-incidencia-de-cancer-no-brasil.pdf (accessed on 12 June 2021).
  16. Fountoulakis, I.; Diémoz, H.; Siani, A.-M.; Laschewski, G.; Filippa, G.; Arola, A.; Bais, A.F.; De Backer, H.; Lakkala, K.; Webb, A.R.; et al. Solar UV Irradiance in a Changing Climate: Trends in Europe and the Significance of Spectral Monitoring in Italy. Environments 2019, 7, 1. [Google Scholar] [CrossRef] [Green Version]
  17. EEAP. Environmental Effects and Interactions of Stratospheric Ozone Depletion, UV Radiation, and Climate Change; 2018 Assessment Report; Environmental Effects Assessment Panel, United Nations Environment Programme (UNEP): Nairobi, Kenya, 2018; pp. 5–18. Available online: https://ozone.unep.org/science/assessment/eeap (accessed on 23 April 2022).
  18. Cadet, B.; Goldfarb, L.; Faduilhe, D.; Baldy, S.; Giraud, V.; Keckhut, P.; Réchou, A. A sub-tropical cirrus clouds climatology from Reunion Island (21°S, 55°E) lidar data set. Geophys. Res. Lett. 2003, 30, 1130. [Google Scholar] [CrossRef] [Green Version]
  19. Cazorla, A.; Olmo, F.J.; Alados-Arboledas, L. Development of a sky imager for cloud cover assessment. J. Opt. Soc. Am. A 2007, 25, 29–39. [Google Scholar] [CrossRef]
  20. Saiz-Lopez, A.; Lamarque, J.-F.; Kinnison, D.E.; Tilmes, S.; Ordóñez, C.; Orlando, J.J.; Conley, A.J.; Plane, J.M.C.; Mahajan, A.S.; Santos, G.S.; et al. Estimating the climate significance of halogen-driven ozone loss in the tropical marine troposphere. Atmos. Chem. Phys. 2012, 12, 3939–3949. [Google Scholar] [CrossRef] [Green Version]
  21. Estupiñán, J.G.; Raman, S.; Crescenti, G.H.; Streicher, J.J.; Barnard, W.F. Effects of clouds and haze on UV-B radiation. J. Geophys. Res. Earth Surf. 1996, 101, 16807–16816. [Google Scholar] [CrossRef]
  22. Moreira, D.S.; Longo, K.M.; Freitas, S.R.; Yamasoe, M.A.; Mercado, L.M.; Rosário, N.E.; Gloor, E.; Viana, R.S.M.; Miller, J.B.; Gatti, L.V.; et al. Modeling the radiative effects of biomass burning aerosols on carbon fluxes in the Amazon region. Atmos. Chem. Phys. 2017, 17, 14785–14810. [Google Scholar] [CrossRef] [Green Version]
  23. Chand, D.; Guyon, P.; Artaxo, P.; Schmid, O.; Frank, G.P.; Rizzo, L.V.; Mayol-Bracero, O.L.; Gatti, L.V.; Andreae, M.O. Optical and physical properties of aerosols in the boundary layer and free troposphere over the Amazon Basin during the biomass burning season. Atmos. Chem. Phys. 2006, 6, 2911–2925. [Google Scholar] [CrossRef] [Green Version]
  24. Bevan, S.L.; North, P.; Grey, W.M.F.; Los, S.O.; Plummer, S.E. Impact of atmospheric aerosol from biomass burning on Amazon dry-season drought. J. Geophys. Res. Earth Surf. 2009, 114, D09204. [Google Scholar] [CrossRef] [Green Version]
  25. Artaxo, P.; Dias, M.A.F.D.S.; Nagy, L.; Luizão, F.J.; da Cunha, H.B.; Quesada, C.A.N.; Marengo, J.A.; Krusche, A. Perspectivas de pesquisas na relação entre clima e o funcionamento da floresta Amazônica. Ciência e Cultura. 2014, 66, 41–46. [Google Scholar] [CrossRef] [Green Version]
  26. Teramoto, É.T.; Escobedo, J.F.; Martins, D. Modelos estatísticos para estimativa da irradiação solar UV horária em Botucatu/SP/Brasil. Rev. Bras. De Energ. Sol. 2014, 5, 44–51. Available online: https://rbens.emnuvens.com.br/rbens/article/view/107 (accessed on 15 April 2022).
  27. Alvares, C.A.; Stape, J.L.; Sentelhas, P.C.; Moraes, G.J.L.; Sparovek, G. Köppen’s climate classification map for Brazil. Meteorol. Z. 2013, 22, 711–728. [Google Scholar] [CrossRef]
  28. Jacinto, A.I.; Simas, M.T.M.; Bianchi, R.; Oliveira, K.N.; Rech, C.M.C.B. Aspectos Físicoterritoriais e Atrações Turísticas do Município de Santarém, Pará. 2006. Available online: http://www2.ifes.com.br/webifes/revista/REVIST (accessed on 11 May 2022).
  29. de Pádua Andrade, S.C.; de Jesus Corrêa, J.A.; Mestre em Meteorologia, U.A.D.; Grande, P.B.C. Estimativa do saldo de radiação instantâneo à superfície para a cidade de Santarém-PA, através de imagens do Landsat 5-TM. Rev. Bras. Geogr. Física 2014, 7, 653–661. [Google Scholar] [CrossRef]
  30. Williams, E. Contrasting Convective Regimes over the Amazon: Implications for Cloud Electrification. J. Geophys. Res. 2002, 107, 8082. [Google Scholar] [CrossRef] [Green Version]
  31. Apogee Instruments. Ultraviolet Sensor Model SU-100 Manual. Available online: https://www.apogeeinstruments.com/content/SU-100-spec-sheet.pdf (accessed on 11 March 2019).
  32. Redemet (n.d.). API Redemet. Available online: https://www.redemet.aer.mil.br/?i=facilidades&p=api-redemet) (accessed on 29 April 2021).
  33. Como Decodificar o METAR e o SPECI. Força Aérea Brasileira. Available online: https://ajuda.decea.mil.br/base-de-conhecimento/como-decodificar-o-metar-e-o-speci/ (accessed on 28 April 2021).
  34. Silva, A.A.; Souza-Echer, M.P. Ground-based observations of clouds through both ver automatic imager and human observation. Meteorol. Appl. 2015, 23, 150–157. [Google Scholar] [CrossRef] [Green Version]
  35. Cadet, J.-M.; Portafaix, T.; Bencherif, H.; Lamy, K.; Brogniez, C.; Auriol, F.; Metzger, J.-M.; Boudreault, L.-E.; Wright, C.Y. Inter-Comparison Campaign of Solar UVR Instruments under Clear Sky Conditions at Reunion Island (21°S, 55°E). Int. J. Environ. Res. Public Health 2020, 17, 2867. [Google Scholar] [CrossRef] [Green Version]
  36. Neto, J.V.; dos Santos, C.B.; Torres, É.M.; Estrela, C. Boxplot: Um recurso gráfico para a análise e interpretação de dados quantitativos. Odontológica Bras. Cent. 2017, 26, 1–6. Available online: https://www.robrac.org.br/seer/index.php/ROBRAC/article/view/1132/897 (accessed on 8 January 2022).
  37. Porfirio, A.C.S.; De Souza, J.L.; Lyra, G.B.; Lemes, M.A.M. An assessment of the global UV solar radiation under various sky conditions in Maceió-Northeastern Brazil. Energy 2012, 44, 584–592. [Google Scholar] [CrossRef]
  38. Lamy, K.; Portafaix, T.; Brogniez, C.; Godin-Beekmann, S.; Bencherif, H.; Morel, B.; Pazmino, A.; Metzger, J.M.; Auriol, F.; Deroo, C.; et al. Ultraviolet radiation modelling from ground-based and satellite measurements on Reunion Island, southern tropics. Atmos. Chem. Phys. 2018, 18, 227–246. [Google Scholar] [CrossRef] [Green Version]
  39. Sacchetti, F.Z.; Gisbert, R.F. La Radiacion Ultravioleta en Bolivia. 2003. Available online: https://iris.paho.org/handle/10665.2/31072 (accessed on 10 February 2022).
  40. Corrêa, M.D.P.; Godin-Beekmann, S.; Haeffelin, M.; Brogniez, C.; Verschaeve, F.; Saiag, P.; Pazmiño, A.; Mahé, E. Comparison between UV index measurements performed by research-grade and consumer-products instruments. Photochem. Photobiol. Sci. 2010, 9, 459–463. [Google Scholar] [CrossRef] [PubMed]
  41. Sentelhas, P.C.; Pereira, A.R.; Angelocci, L. Meteorologia agrícola. Departamento de Física e Meteorologia. ESALQ/USP. 2000. Available online: https://www.yumpu.com/pt/document/read/50581317/apostila-meteorologia-agra-cola-2007-leb-esalq-usp (accessed on 18 January 2022).
  42. Longo, K.M.; Freitas, S.R.; Andreae, M.O.; Yokelson, R.; Artaxo, P.; Rizzo, L.V.; Paixão, M.; De Lucca, S.; Oliveira, P.H.; Lara, L.L.; et al. Biomass burning in Amazonia: Emissions, long-range transport of smoke and its regional and remote impacts. In Amazonia and Global Change; American Geophysical Union: Washington, DC, USA, 2009; Volume 186, pp. 207–232. [Google Scholar] [CrossRef] [Green Version]
  43. de Sá, S.S.; Rizzo, L.V.; Palm, B.B.; Campuzano-Jost, P.; Day, D.A.; Yee, L.D.; Wernis, R.; Isaacman-VanWertz, G.; Brito, J.; Carbone, S.; et al. Contributions of biomass-burning, urban, and biogenic emissions to the concentrations and light-absorbing properties of particulate matter in central Amazonia during the dry season. Atmos. Chem. Phys. 2019, 19, 7973–8001. [Google Scholar] [CrossRef] [Green Version]
  44. Cirino, G.G.; Souza, R.A.F.; Adams, D.K.; Artaxo, P. The effect of atmospheric aerosol particles and clouds on net ecosystem exchange in the Amazon. Atmos. Chem. Phys. 2014, 14, 6523–6543. [Google Scholar] [CrossRef] [Green Version]
  45. Eck, T.F.; Holben, B.N.; Reid, J.S.; O’Neill, N.T.; Schafer, J.S.; Dubovik, O.; Smirnov, A.; Yamasoe, M.A.; Artaxo, P. High aerosol optical depth biomass burning events: A comparison of optical properties for different source regions. Geophys. Res. Lett. 2003, 30, 2003GL017861. [Google Scholar] [CrossRef] [Green Version]
  46. Procopio, A.S.; Artaxo, P.; Kaufman, Y.J.; Remer, L.A.; Schafer, J.S.; Holben, B.N. Multiyear analysis of amazonian biomass burning smoke radiative forcing of climate. Geophys. Res. Lett. 2004, 31, L03108. [Google Scholar] [CrossRef]
  47. Hatfield, J.L.; Sauer, T.; Prueger, J. Radiation Balance. In Encyclopedia of Soils in the Environment; Elsevier: Amsterdam, The Netherlands, 2005; pp. 355–359. [Google Scholar] [CrossRef]
Figure 1. Map showing the location of Santarém in north Brasil.
Atmosphere 13 01054 g001
Figure 2. Tower where the UVR sensor was installed.
Atmosphere 13 01054 g002
Figure 3. Cloud coverage at Santarém-PA for the 2019–2020 period.
Atmosphere 13 01054 g003
Figure 4. Cloud cover and precipitation monthly average at Santarém.
Atmosphere 13 01054 g004
Figure 5. UVR hour-daily series in all sky and in clear sky conditions.
Atmosphere 13 01054 g005
Figure 6. Hourly UVR variation under all sky and clear sky conditions, averaged over 2 years at Santarém.
Atmosphere 13 01054 g006
Figure 7. UVR monthly average in all sky and in clear sky condition.
Atmosphere 13 01054 g007
Figure 8. Variability of UVR according to the period considered (dry or wet).
Atmosphere 13 01054 g008
Table 1. Metar sky coverage oktas and codes.
OctasSky Coverage Code
0CAVOK
1FEW
2FEW
3SCT (Scattered)
4SCT (Scattered)
5BKN (Broken)
6BKN (Broken)
7BKN (Broken)
8OVC (Overcast)
Publisher’s Note: MDPI stays neutral with regard to jurisdictional claims in published maps and institutional affiliations.

