Abstract
Thanks to the large scope, high spatial resolution, and increasing data records, satellite-based precipitation products are playing an increasingly important role in drought monitoring. First, based on the data from ground sites, the long-term Multi-Source Weighted-Ensemble Precipitation (MSWEP) precipitation product was evaluated in respect to drought monitoring. Then, based on the MSWEP product, the drought trends and the spatiotemporal characteristics of the drought events in four major basins (Amu Darya Basin, Syr Darya Basin, Chu-Talas River Basin, and Ili River Basin) in Central Asia, which have relatively dense gauge sites, were studied. The Standardized Precipitation Index (SPI) and the run theory were used to identify drought events and describe their characteristics. The results showed that MSWEP can effectively capture drought events and their basic characteristics. In the past 40 years, the study area experienced 27 drought events, among which the severest one (DS = 15.66) occurred from June 2007 to September 2008. The drought event that occurred from June 1984 to October 1984 had a drought peak value of 3.39, with the largest drought area (99.2%). Since 1881, there appeared a drying trend and a wetting trend in the Amu Darya River basin and the Ili River basin, respectively. No obvious wetting or drying trend was found in both the Chu-Talas River basin and the Syr Darya basin. Since 2016, the drought area has been on the increase.
1. Introduction
Drought is one of the most serious natural disasters, with high frequency, long duration, and range-wide impact [1]. Against the background of climate change, the impact of drought on agriculture, the economy, and society has intensified in recent decades [2,3,4,5]. It is reported that the annual economic losses caused by drought worldwide are as high as USD 6–8 billion, far exceeding other meteorological disasters [6]. Summarizing various definitions of drought, the American Meteorological Society classifies drought into four categories: meteorological, agricultural, hydrological, and socio-economic droughts [7,8,9]. Meteorological drought, which is defined as a long-term negative precipitation deficit, is the first mover of other types [1]. The characteristics of hydrological droughts are influenced by meteorological droughts [10].
Central Asia suffers from water scarcity and drought. The collapse of the Soviet Union left the region with aged water and agricultural infrastructure, low-level planting techniques, and inefficient and extensive management strategies. Central Asia is a major user of agricultural water, whose agricultural water consumption accounts for more than 90% of the total water consumption. Nevertheless, the water resources in Central Asia suffer a wide range of problems in space, such as insufficient total amount, uneven distribution, serious cross-border water resource conflict, low efficiency, and high consumption [11,12]. Meteorological drought in this region may pose a severe impact on agriculture and economy and may increase the ecological vulnerability of Central Asia [13]. Studies have shown that a series of drought events have occurred in Central Asia in recent decades. The drought event in 1975–1977 was regarded as the most serious one in the past 100 years [14]. Meanwhile, droughts in 1997–1998 [15], 2000–2001 [16], and 2010 [17] also caused severe economic losses. Therefore, drought monitoring tools are essential for drought risk management.
Global warming and intensified human activities are likely to further aggravate the drought problem in Central Asia, with increasing impacts on agricultural production, animal husbandry, economy, and human health [18]. Therefore, drought in Central Asia is a serious problem and drought-monitoring research is urgently needed. However, drought research in Central Asia is full of difficulties and challenges. Central Asia has complex terrain and sparse and uneven distribution of ground observation sites. Affected by the disintegration of the Soviet Union, most sites’ data were missing and incomplete. Based on the existing site data, it is difficult to carry out drought monitoring research with comprehensive coverage, strong representativeness, and high-accuracy data [19]. With the development of remote sensing technology, precipitation data records based on remote sensing can reach up to 40 years. Compared with ground site data, satellite-based precipitation products (referred to as SPPs) have the advantages of high spatial resolution, continuous observation, strong timeliness, and wide coverage, which can provide raster precipitation estimation data for areas with no data or few in situ data [20].
Currently, there are many satellite-based precipitation products. The main SPPs in the current moment are as follows: Global Precipitation Measurement (GPM), Multi-Source Weighted-Ensemble Precipitation (MSWEP), Climate Hazards Group InfraRed Precipitation with Stations (CHIRPS), Global Satellite Mapping of Precipitation (GSMaP), Precipitation Estimation from Remotely Sensed Information using Artificial Neural Networks-Climate Data Record (PERSIANN-CDR), the Climate Prediction Center morphing technique with corrected bias (CMORPH-CRT), and the Tropical Rainfall Measuring Mission (TRMM). Based on the above SPPs, many researchers have conducted drought monitoring studies on global and regional scales [21,22,23,24,25,26,27,28,29,30]. Relevant studies mostly focus on China [20,24,31,32,33,34,35], the United States [4,36], India [37], and other regions [22,23,25,26,27,28] with relatively dense sites. However, few studies were found on drought monitoring based on SPPs in Central Asia [38,39,40]. The MSWEP product has not been evaluated and applied in drought monitoring in Central Asia.
Drought monitoring requires more than a 30-year data record for a stable calculation of drought indexes like SPI and SPEI [29,41]. There are numerous SPPs at present; however, only some of them have a record length more than 30 years, which is the basic requirement for climatological applications like drought monitoring. The record length of many SPPs such as TRMM, GPM, and CMORPH is less than 20 years. CHIRPS has recorded the precipitation since 1983; however, it has a spatial coverage within 50° N–50° S, which cannot cover the whole Central Asian area. PERSIANN-CDR has a long precipitation record (>30 years) and large scope (60° N–60° S), but has a large amount of missing values in the north part of Central Asia. MSWEP has long-term precipitation records (1981–present) and large enough coverage to cover Central Asia. In addition, it has relatively high spatial resolution (0.1°), which could provide more detailed drought information. Nevertheless, in our previous studies in northwest China, we found that MSWEP performed well in estimating spatial patterns and temporal changes of precipitation, and is superior to PERSIANN-CDR and CHIRPS in identifying drought events and characterizing drought characteristics [20]. The good performance of MSWEP in drought monitoring in northwestern China motivates us to evaluate MSWEP’s performance in capturing drought characteristics in Central Asia with similar semi-arid and arid climates and limited ground observations. Based on the analysis of the accuracy of the MSWEP V2.8 data, this study aims to explore the drought development trend, drought events, and their temporal and spatial characteristics in four basins in Central Asia, where the ground sites are relatively dense.
The rest of the paper is organized as follows: Section 2 introduces the study area, ground observation datasets, MSWEP data, statistical metric, drought index, run theory, Sen slope, modified Mann–Kendall test, and LOESS local fitting function. In Section 3, the reliability of MSWEP in capturing precipitation and SPI3 was evaluated based on the ground site data, and MSWEP data were applied to drought trend analysis, drought area change analysis, and temporal and spatial distribution of drought events. Section 4 is the conclusions.
2. Materials and Methods
2.1. Study Area
Central Asia is located in the heart of Eurasia, comprising Kazakhstan, Kyrgyzstan, Tajikistan, Turkmenistan, and Uzbekistan. Rivers in Central Asia include the Amu Darya, Syr Darya, Chu River, Talas River, Ili River, etc. Central Asia is deeply inland, far from the oceans. It has a semi-arid and arid climate, with low annual precipitation and strong evaporation [42,43]. According to the IPCC report, the temperature in Central Asia continues to increase, and the precipitation pattern also tends to vary enormously [44]. Due to the high drought risk and vulnerability, a drought-monitoring study in this region is particularly important. However, drought monitoring in these regions suffers from sparse and uneven gauges with a large number of missing values. Therefore, this paper mainly focuses on the four major river basins where there are relatively dense gauge sites. As Figure 1 shows, the four basins are the (1) Amu Darya basin, (2) Syr Darya basin, (3) Chu-Talas River basin, and (4) Ili River basin.
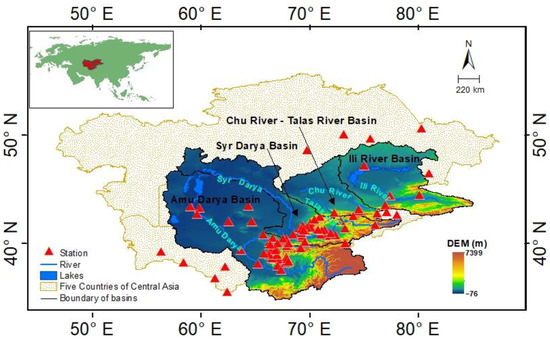
Figure 1.
Distribution map of four basins in Central Asia.
The Amu Darya originates from the Tianshan Mountains and is located between the Karakum Desert and the Kyzyl-Kum Desert. As the largest river in Central Asia, it flows through Tajikistan, Afghanistan, Uzbekistan, and Turkmenistan before emptying into the Aral Sea. The fact that it is far away from the Pacific Ocean and the Indian Ocean, combined with its terrain, makes the summer monsoon from the Pacific Ocean and the Indian Ocean hard to reach the Amu Darya basin. Since the western terrain is relatively flat, the westerly winds from the Atlantic can bring some precipitation. For brevity, the Amu Darya basin is named Basin I.
The Basin II in the study refers to the Syr Darya basin. The Syr Darya is the second-longest river in Central Asia (shorter than the Amu Darya) and flows through the three countries of Uzbekistan, Tajikistan, and Kazakhstan. The river’s water supply comes mainly from snowmelt, followed by glaciers. It is fast flowing and rich in water resources, including the Toktogul hydropower station in Kyrgyzstan and the Kayrakkum hydropower station in Tajikistan. There are narrow oases along the whole middle and lower reaches of the river, which are among the important irrigated agricultural areas in Kazakhstan, with an irrigated area of more than 2.2 million hectares. However, because of the large amount of water needed for irrigation and the arid climate in the middle and lower reaches of the river, no tributaries flow into the Syr Darya. The amount of water flowing into the Aral Sea from the Syr Darya decreases year by year, resulting in the continuous retreat of the Aral Sea.
The Chu River is a transnational river in Central Asia flowing northwest from the Kyrgyz province of Talas into Kazakhstan. Between the Syr Darya to the east of the Aral Sea and the Irtysh River to the northwest of the Tianshan mountains, it rises from the Terskai and Kyrgyz mountains, merges the Dzhuvanaryk and Kochkor rivers, and turns northwest through the Boam Gorge and the Chon-Kyomin River. Passing through the fertile Chu River basin (a large amount of river water is used for irrigation), it finally disappears into the Muyunkum Desert. The Talas River is a transnational river in Central Asia flowing northwest from the Talas oblast of Kyrgyzstan to Kazakhstan. The upper Talas River is formed by the confluence of the Caracol and Ukikeshoy rivers. The Chu River basin and the Talas River basin are collectively referred to as the Chu-Talas River basin and are represented by Basin III in this study.
The Ili River basin is low in the north and high in the south, with the Tianshan Mountains in the far south and Balkhash Lake in the far north. In addition to the water vapor supply from the Atlantic Ocean in the north, glaciers and permanent snow are widely distributed in the basin because of the high mountain ranges of the Tianshan Mountains on the southern and northern sides. In this study, the Ili River basin is named Basin IV.
2.2. Datasets
2.2.1. Ground-Based Observations
The precipitation data in this paper is collected from Global Historical Climatology Network Daily (GHCND), Global Historical Climatology Network Monthly (GHCNM), and Global Surface Summary of the Day (GSOD). Due to the complex terrain in Central Asia and insufficient site data, this study screened the site data as follows: (1) only data from 1981 to 1999 (19 years) were adopted because of site data discontinuity after 2000; (2) sites were excluded with missing data for more than 10 days in daily-scale data and more than 1 month in monthly-scale data; (3) performed linear interpolation to fix missing values for daily precipitation data and unmeasured monthly precipitation data of selected sites; and (4) by adding the daily scale data to the monthly scale, finally, the monthly observation precipitation data of 88 sites were obtained. There were 33, 34, 3, and 4 site data in Basin I, Basin II, Basin III, and Basin IV, respectively. It is mentioned that 14 sites beyond the four basin boundaries are also adopted to ensure a better validation effect.
2.2.2. MSWEP
MSWEP was produced by integrating ground site data, satellite data, and reanalysis data. As a global precipitation product, MSWEP has a temporal resolution of 3 h and a spatial resolution of 0.1 degrees. At present, MSWEP has been upgraded to the second version, namely MSWEP V2. When compared with MSWEP V1, MSWEP V2 introduces cumulative distribution function and precipitation frequency correction, and the accuracy of data is significantly improved [45]. This study uses version 2.8 of MSWEP. This version has the following advantages: (1) new data source; (2) improved weight diagram; (3) less estimation of peak precipitation; (4) longer data records; (5) near-real-time estimation; and (6) compatibility with multi-weather. Previous studies have found that in some areas, the accuracy of MSWEP data is higher than that of other SPPs [19,24,26,46]. In this study, monthly-scale MSWEP data from 1981 to 2020 were downloaded from the official website (http://www.gloh2o.org/mswep/ (accessed on 1 July 2021)).
2.3. Statistics Evaluation Metrics
Continuity indicators used in this study include relative bias (RB), root mean square error (RMSE), and the Pearson linear correlation coefficient (CC). The CC reflects the correlation between satellite observations and site observations. The stronger the correlation, the closer its value approaches 1. RB represents the difference between satellite observations and site observations. The smaller the difference, the closer the error is to 0. The RMSE shows the degree of dispersion between satellite observations and site observations. The smaller the dispersion degree is, the closer its value reaches 0. The calculation formula and optimal value of RB, CC, and RMSE are shown in Table 1.

Table 1.
Statistical metrics used in this study.
2.4. Drought Index and Drought Characteristics
SPI can convert the probability of precipitation into an index, and then measure the precipitation anomaly (McKee et al. [47]). SPI is routinely classified into different categories to reflect the dry/wet level (Table 2).
Table 2.
Drought classification according to SPI values.
Compared with other drought indices, SPI has the following advantages: (1) low requirements on data, with precipitation data as its only data input; (2) multiple time scales can be calculated, such as SPI1, SPI3, SPI6, and SPI12, etc.; and (3) spatial comparability, comparisons of SPI across regions do not require renormalization.
Yevjevich [48] first proposed the run theory, which has become an important tool for identifying and describing drought events. According to McKee et al. [47], a drought event is defined as a period with SPI values lower than 0 and the lowest value is less than −1. In this study, only drought events with a duration of more than two months are considered. Once drought events are identified, they can be represented by run theory. A run refers to the part of the time series where the value is continuously lower or higher than a certain threshold. The higher part is the positive run, which indicates that the period is relatively wet; the part below the threshold is the negative run, indicating that the period is relatively dry. The following figure (Figure 2) depicts a drought event and its basic characteristics [49].
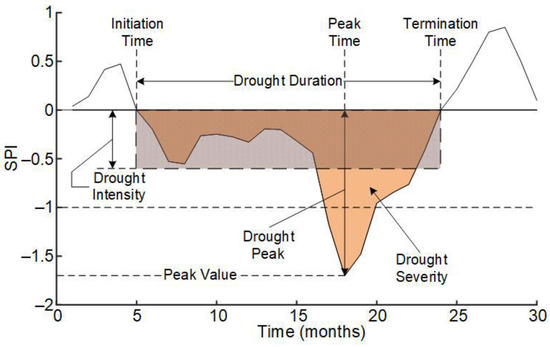
Figure 2.
The map of run theory and characteristics of a drought event.
In the drought-monitoring part, drought events and their basic characteristics were calculated for each grid cell in the study area, with emphasis on drought duration (DD), drought severity (DS), drought intensity (DI), and drought peak (DP). DD refers to the number of months between the time the drought began and the time the drought ended. DS refers to the absolute value of SPI cumulative value during the drought event, and the calculation method is shown in Equation (1). DI refers to the average value of SPI during the drought event, which is the ratio of the DS to the DD, as shown in Equation (2). DP, shown in Equation (3), refers to the absolute value of the minimum SPI value during the drought event, and its corresponding time is the drought peak time (DPT).
In the formula, SPIi refers to the SPI value of the i-th month.
2.5. Trend Analysis Methods
In this paper, Sen slope estimation, modified Mann–Kendall trend test (MMK), and local regression (LOESS) are used to analyze the drought trend.
Sen slope [50] is a non-parametric method (Equation (4)). It represents the slope of time series by calculating the median value of the sequence, but it cannot judge the significance of the data.
In Equation (4), Sen is the estimated slope value; xi and xj are the i-th and j-th rank slope values, respectively, where 1 ≤ i ≤ j ≤ n, and n is the length of the order column. The Sen slope estimation method has been widely applied in meteorology- and hydrology-related studies [51,52].
This study adopted the MMK [53] proposed by Hamed and Rao to analyze the significance of trends in sample time series. Based on the effective or equivalent sample size, the MMK method adds a correction factor to the original variance calculation to avoid the influence of data autocorrelation. The MMK test has been widely used in drought trend analysis [54,55,56].
The significance level of the MMK test is measured by the Z-value, which is calculated as follows:
where n/ns stand for data autocorrelation, whose calculation method is as follows:
where n is the length of time series and is the autocorrelation function of grade data, whose autocorrelation function is:
The LOESS [57,58] method can perform local segmental fitting on the data series to analyze the local change trend of the data series. This study uses the LOESS curve to analyze the local variation trend of SPI time series and drought areas. For detailed LOESS calculation steps, please refer to Cleveland and Devlin [57].
3. Results
3.1. Evaluation of Precipitation
3.1.1. Evaluation of Precipitation from MSWEP
To analyze the precipitation bias of MSWEP in different basins, this study calculated the time series of domain-averaged precipitation (Figure 3) and the annual precipitation distribution (Figure 4) of the four Central Asian basins from January 1981 to December 1999. It can be seen from Figure 3 that the MSWEP data in Basin I and Basin II agree perfectly with the ground-based observations in respect to both frequency and amplitude of fluctuations. Overestimations prevailed in Basin III and, after 1994, the overestimation amplitude increased. This is possibly due to the small number of sites in Basin III. In Basin IV, there were continuous underestimations of precipitation, which were more obvious in the month with more precipitation. Figure 4 shows the comparison of annual precipitation distributions. It can be seen from the figure that data from MSWEP products had a high overall consistency with the observed values of the sites, and underestimation was not obvious. However, there was a significant underestimation of precipitation in March, with an underestimated value of about 17 mm/month.
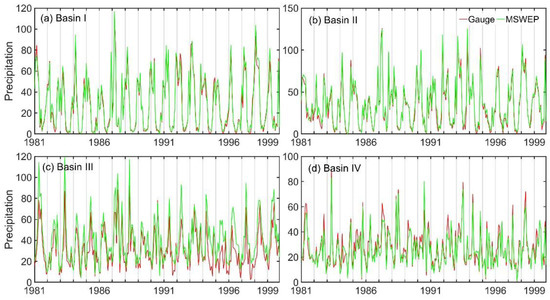
Figure 3.
The precipitation temporal evolution of ground sites and MSWEP in each basin.
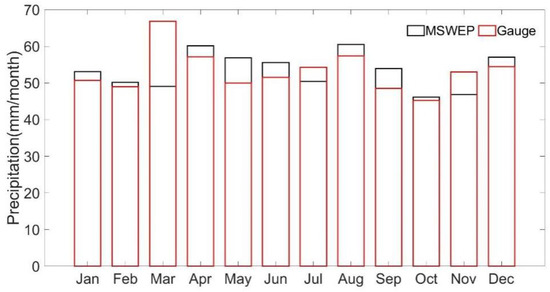
Figure 4.
Multi-year precipitation maps of the sites and MSWEP.
Figure 5 shows the spatial distribution of RB, CC, and RMSE of MSWEP and ground site data from January 1981 to December 1999. On the whole, the correlation between MSWEP data and ground site data is strong. The average CC of all sites reaches 0.81, the average RMSE is 28.22, and the stations with CC values above 0.8 account for 72% of the total sites. In the four basins, MSWEP in Basin I (average CC = 0.71, RB = 14.76, RMSE = 32.86) and Basin II (average CC = 0.89, RB = 15.18, RMSE = 27.45) outperformed those in Basin III and Basin IV. It is worth noting that the performance of MSWEP in some sites is poor, such as the outer and the southeastern of Basin I, and some sites in the upper Basin III all show obvious overestimation. This may be related to the fact that topographic rain produced by local complex terrain cannot be effectively captured by remote sensing data.
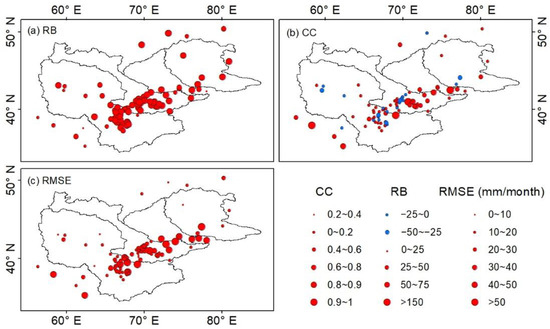
Figure 5.
The precipitation spatial patterns of RB, CC, and RMSE of ground sites and MSWEP.
3.1.2. Evaluation of SPI Calculated from MSWEP
The SPI3 can effectively capture the drought and wet changes on the seasonal scale, and it can offer excellent feedback on how the vegetation growth in the region is affected by the drought [49]. To further evaluate the applicability of MSWEP in drought monitoring, SPI3 was calculated site by site based on ground site data and MSWEP data. It was then utilized to evaluate the ability of MSWEP to reflect drought and wet conditions. Figure 6 shows the time variation of domain-averaged SPI3 of ground sites and MSWEP in four basins. It can be seen from the figure that SPI3 calculated based on MSWEP (SPI3_mswep) is closely consistent with the SPI3 calculated based on ground site data (SPI3_stn). MSWEP is effective in capturing all drought and wet months across basins, but there is some bias in degree. For example, in Basin I, Basin II, and Basin IV, MSWEP data were overestimated to some extent. In Basin III, there appeared significant overestimations in MSWEP products in the drought months before 1992, as opposed to the wet months after 1992. This is consistent with the underestimation of precipitation before 1992 and overestimation of precipitation after 1992, as shown in Figure 3.
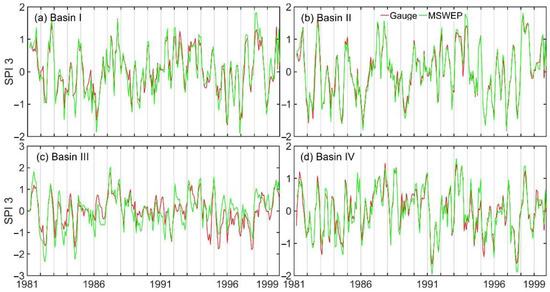
Figure 6.
The SPI3 temporal evolution of ground sites and MSWEP in each basin. To analyze the capability of MSWEP to capture drought and wet conditions, this study calculated the CC, RB, and RMSE of SPI3_mswep site by site (Figure 7) by using SPI3_stn as a benchmark. It can be seen that the correlation between MSWEP and site data is relatively high, with the average values reaching 0.79 and the highest CC value reaching 0.99. MSWEP showed an underestimation of SPI3 at most sites in the four basins, with only eight sites in Basin II and five sites in/around Basin I being overestimated. There are no obvious variations between the four basins in respect to RMSE.
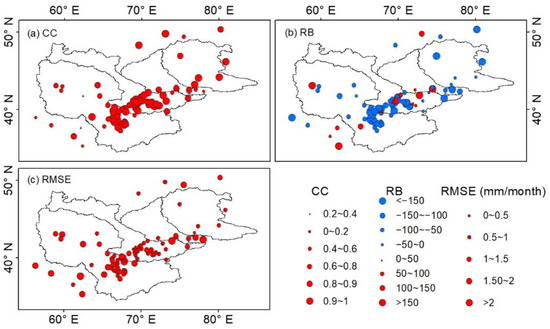
Figure 7.
The SPI3 spatial patterns of CC, RB, and RMSE between sites and MSWEP.
MSWEP can effectively capture precipitation and dry/wet changes, considering the temporal–spatial changes of precipitation and the dry/wet changes reflected by SPI3. However, there is still a certain degree of overestimation or underestimation of precipitation, which further leads to the overestimation and underestimation of drought conditions in some regions, but they are not significant. In conclusion, MSWEP can basically meet the needs in drought monitoring.
3.2. Application of MSWEP for Drought Monitoring
3.2.1. Dry/Wet Evolution
The SPI3 of the four basins was calculated pixel by pixel based on the MSWEP data from 1981 to 2020 (40 years) to analyze the dry/wet change in four basins of Central Asia. Convenient for comparison, domain-averaged values of SPI3 were calculated to reflect time variations. Figure 8 shows the time variations of domain-averaged values of SPI3 for the four basins. This study used the Sen slope and the LOESS trend line with a 5-year span and a 10-year span to detect the overall trend in dry/wet changes in 40 years and the local trend in 5 years and 10 years, respectively. At the same time, the local turning points of the LOESS curve were found as the segmentation point of trend change. In Figure 8, The 1981–2020 linear trend line, 5-year LOESS curve, and 10-year LOESS curve are respectively marked with blue solid line, green solid line, and red solid line, while the symbols of the upper triangle and lower triangle represent positive peak value (peak value) and negative peak value (valley value), respectively.
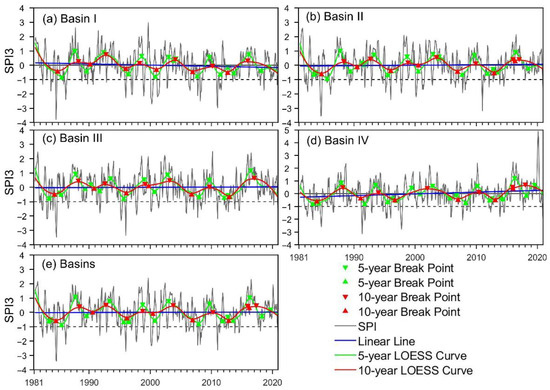
Figure 8.
Temporal evolution of domain-averaged SPI3 in the study area and each basin (a–e). In this study, Sen slope and MMK significance tests were performed based on the domain-averaged SPI3, so as to further quantitatively analyze the drought trend from 1981 to 2020.
Considering the four basins as a whole (Figure 8e), the linear trend line of SPI3 from 1981 to 2020 coincides with the zero line, indicating that the study area shows no signs of drought or wetness. According to the LOESS curve and its turning points, the four basins showed periodic fluctuations of 3–5 years’ scale and a certain degree of drying after 2013. From 1981 to 2020, Basin II (a slope of 2.76) and Basin III (a slope of 6.79) displayed no significant dry/wet changes. Basin I showed a slight drying trend (a slope of −4.55), while Basin IV demonstrated a slight wet trend (slope of 7.91), and both passed the 0.01 significance level test. According to the 5-year local trend line, around 1984, 1995, and 2013, each basin had a trend of wetting, but the fluctuation range was small. Consequently, each of them remained in a drought state. After 2018, the smooth trend lines of Basin I (Figure 8a) and Basin II (Figure 8b) tended to flatten out, indicating that drought in the study area gradually grew stable and the impact of drought became increasingly insignificant. It can be seen from the 10-year smoothing trend line that the local smoothing curve tended to flatten out. It fluctuated at 0 around 1990 and 2010, indicating that the drought trend was relatively stable during this period. After 2013, it showed a drying trend.
3.2.2. Temporal Evolution of Drought Area
Drought area is one of the key indicators for describing drought. To analyze the temporal variation characteristics of drought areas, the area percentages of moderate, severe, and extreme drought conditions from 1981 to 2020 were calculated month by month according to the drought classification standard (Table 2). In Figure 9, the LOESS local regression lines for the 5-year and 10-year spans are represented by the solid green line and the solid red line, respectively, and moderate drought, severe drought, and extreme drought are represented by yellow, red, and brown areas, respectively.
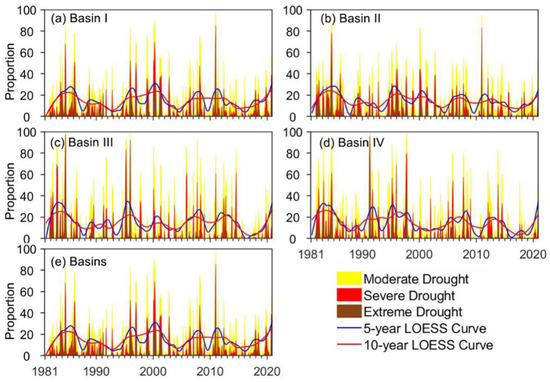
Figure 9.
Temporal evolution of drought areas in the study area and each basin.
It can be seen from Figure 9 that the four basins all experienced a high proportion of drought in the 1980s. In addition, the percentage of the drought area in Basin I, Basin II, and Basin III had the same temporal variation, with a relatively high percentage around 1996, 2000, and 2011 (the percentage of moderately dry area is 40–90%, 50–70%, and 60–80%, respectively). Different from the other three basins, the drought area of Basin IV was rather small around 2011. Nevertheless, its drought area accounted for a relatively large proportion in the 1990s, indicating that this region was seriously affected by drought during this period. This coincided perfectly with the results in Figure 8. Generally speaking, the proportion of drought area in the four basins showed a decreasing trend, but after 2016, the drought areas in Basin I (a slope of 0.0015) and Basins (a slope of 0.0015) displayed an increasing trend, and the slope of the Basins passed the 0.1 significance test, the slope of the Basin I passed the 0.05 significance test.
3.2.3. Drought Events and Their Characteristics
Based on domain-averaged SPI3 and run theory, the characteristics of all drought events in the four basins were identified. They then underwent quantitative analyses in respect to start time, end time, duration, intensity, severity, and the peak. Table 3 lists the drought characteristics in order of severity from highest to lowest.
Table 3.
Drought events and their characteristics in the study area.
From 1981 to 2020, 27 drought events occurred in the four basins of Central Asia. The duration mainly included 3, 5, 6, and 7 months and above, with corresponding frequencies of 6, 5, 6, and 9, respectively. The most severe drought events have been reported by different studies. For example, the 2007–2008 drought event (D1) with the highest severity was also reported by the FAO report [59] and the study of Sommer et al. [60]. The 2010 drought event (D2) was also widely identified and found that the drought had great impacts on local vegetation and water supply [17,61,62]. It is reported that 3 million people in Tajikistan and 6 million people in Uzbekistan were impacted by the drought events that occurred in 2000 and 2001 [63]. The majority of drought events (about 81.5%) lasted between 3 and 8 months, with only one drought event lasting longer than a year, which is generally consistent with the study of Guo et al. [64]. The frequency of drought events was higher in 1981–1985, the 1990s, and 2005–2010, but the number of drought events has decreased since 2010. It can be seen from Table 3 that 12 of the 27 drought events started in autumn, while only 3 began in summer. It shows that the time distribution of drought events in the four basins is uneven. Among all drought events, the severity of drought events from June 2007 to September 2009 was highest, reaching 15.66 [52]. Drought events with high severity all have a long duration, except D4, indicating that duration is one of the important factors causing the severity of drought. Although the duration of D4 is short, the drought intensity is great and the peak value is high, hence the high drought severity.
3.2.4. Analysis of Typical Drought Events
Spatial distribution helps to understand the characteristics of drought events. MSWEP data, with their high spatial resolution, can provide relatively detailed information on the spatial distribution of drought. In this study, three typical drought events were first selected according to drought severity, intensity, and duration, and then their characteristics of spatial distribution were analyzed. D1 has a long duration and the highest severity; D4 is a drought event with a short duration but relatively high drought severity (i.e., relatively great intensity); D7 has a long duration and relatively high severity. Figure 10 shows the spatial distribution of DS, DP, DI, and DA in the three typical drought events.
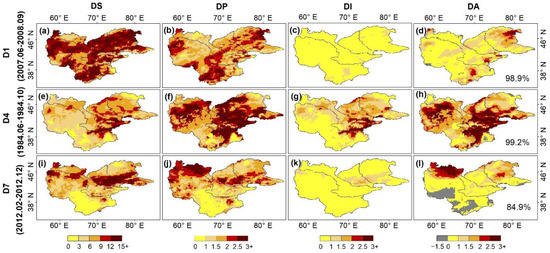
Figure 10.
Spatial distribution of DS, DI, DP, and DA of the three drought events for (a–d) D1, (e–h) D4, (i–l) D7.
The three drought events vary in their spatial characteristics. D1, lasting for 16 months, was the severest drought event. As shown in Figure 10a, there was a severe drought in the whole study area, especially in the southern and northern parts of Basin I and the northern part of Basin IV. Despite its highest severity, D1 had lower DP and DI than those of similar drought events. This suggested that the higher DS of this drought event was mainly caused by the long duration. According to the DP spatial distribution of the three drought events, the DP of D4 was largest, which was attributed to the relatively high DS value and the relatively low DD value. Except for the middle part of Basin I and the northeastern part of Basin IV, the DP was high in the rest of the areas. This indicates that in spite of the short DD, the drought occurred with great severity. The DS of D7 was relatively high among all drought events. Nevertheless, compared with drought events with similar DS, D7 had a relatively lower DI, which was due to its longer DD (11 months). According to the map of the spatial distribution of DS, this drought event mainly occurred in the southern part of Basin III and the southern part of Basin IV. As can be seen in Figure 10l, some places of the southern and western parts of Basin I experienced a wet period during the maximum drought area month, whereas severe drought was occurring in the northernmost parts of Basin I and Basin II.
4. Conclusions
There are multiple drought events in the four basins in Central Asia. However, the scarcity of ground sites and lack of data have hindered the research on drought characteristics in this region. Thanks to its high spatial resolution and long time series, MSWEP provides an opportunity for drought assessment and application. Based on the ground site data, the bias of MSWEP was evaluated in precipitation and dry/wet variation. In addition, by use of 40 years of MSWEP data, the four basins in Central Asia were analyzed for the drying/wetting trend, drought events, and their spatio-temporal characteristics from January 1981 to December 2020. The main conclusions of this study are as follows:
- MSWEP data show a high correlation with ground site data (CC > 0.81, RMSE < 28.22), which can offer effective feedback on precipitation information. Meanwhile, MSWEP has the ability to capture dry/wet changes and characterize drought events. Compared with ground site data, its domain-averaged SPI3 values are highly correlated (CC > 0.79, RMSE < 1.08).
- On the whole, the four basins in Central Asia have been in a relatively stable dry/wet state in the past 40 years. However, after 2016, the drought areas of the four basins have been on the increase. The Amu Darya basin displays a slight drying trend (a slope of −4.55), while the Ili River basin shows a slight wetting trend (a slope of 7.91). There is no obvious trend change in both the Syr River basin and Chu-Talas River basin.
- In the past 40 years, a total of 27 drought events occurred in the four basins in Central Asia, most of which (about 81.5%) lasted between three and eight months, with only one lasting more than one year. The frequency of drought events was relatively higher during 1981–1985, the 1990s, and 2005–2010, but after 2010, the number of drought events decreased. Among all the drought events, 12 of them started in autumn, while only 3 began in summer. It shows that the time distribution of drought events in the four basins is uneven.
Satellite-based precipitation products provide valuable data sources for drought monitoring in regions with limited ground observations like Central Asia. In our future study, we will continue the study on the drought monitoring based on MSWEP, as well as other satellite-based precipitation products over semi-arid and arid regions. First, the application of MSWEP and other satellite-based precipitation products will be further evaluated by using different drought indices and drought event identification methods. Then, the potential drought impacts on agriculture and the local ecosystem will be further assessed to provide a scientific reference for drought impact reduction.
Author Contributions
Conceptualization, H.G.; methodology, H.G. and M.L.; software, X.L. and M.L.; validation, L.Z., H.G. and X.L.; formal analysis, F.U.O. and M.L.; investigation, X.L.; resources, H.G.; data curation, L.Z.; writing—original draft preparation, M.L.; writing—review and editing, H.G. and F.U.O.; visualization, X.L.; supervision, H.G.; project administration, H.G.; funding acquisition, H.G. All authors have read and agreed to the published version of the manuscript.
Funding
This research was jointly funded by the National Natural Science Foundation of China (Grant No. 42001363) and the Third Xinjiang Scientific Expedition Program (Grant No. 2021XJKK140304).
Institutional Review Board Statement
Not applicable.
Informed Consent Statement
Not applicable.
Data Availability Statement
Not applicable.
Acknowledgments
We thank the National Tibetan Plateau Data Center for providing the basin boundary data. Great thanks to Lianzhen Zhao from the China Pharmaceutical University for his help to improve the paper.
Conflicts of Interest
The authors declare no conflict of interest.
References
- Wilhite, D.A. Drought as a Natural Hazard: Concepts and Definitions. Drought A Glob. Assess. 2000, 1, 3–18. [Google Scholar]
- Wilhite, D.A.; Svoboda, M.D.; Hayes, M.J. Understanding the complex impacts of drought: A key to enhancing drought mitigation and preparedness. Water Resour. Manag. 2007, 21, 763–774. [Google Scholar] [CrossRef] [Green Version]
- Council, N.R. Grasslands and Grassland Sciences in Northern China; National Academies Press: Washington, DC, USA, 1992. [Google Scholar]
- Zambreski, Z.T.; Lin, X.; Aiken, R.M.; Kluitenberg, G.J.; Pielke Sr, R.A. Identification of hydroclimate subregions for seasonal drought monitoring in the U.S. Great Plains. J. Hydrol. 2018, 567, 370–381. [Google Scholar] [CrossRef]
- Orimoloye, I.R. Agricultural Drought and Its Potential Impacts: Enabling Decision-Support for Food Security in Vulnerable Regions. Front. Sustain. Food Syst. 2022, 6, 15. [Google Scholar] [CrossRef]
- Yan, G.; Wu, Z.; Li, D. Comprehensive Analysis of the Persistent Drought Events in Southwest China. Disaster Adv. 2013, 6, 306–315. [Google Scholar]
- Kao, S.-C.; Govindaraju, R.S. A copula-based joint deficit index for droughts. J. Hydrol. 2010, 380, 121–134. [Google Scholar] [CrossRef]
- John Keyantash, J.A.D. The Quantification of Drought: An Evaluation of Drought Indices. Bull. Am. Meteorol. Soc. 2002, 83, 1167–1180. [Google Scholar] [CrossRef]
- Heim, R.R., Jr. A review of twentieth-century drought indices used in the United States. Bull. Am. Meteorol. Soc. 2002, 83, 1149–1165. [Google Scholar] [CrossRef] [Green Version]
- Lee, J.; Kim, Y.; Wang, D. Assessing the characteristics of recent drought events in South Korea using WRF-Hydro. J. Hydrol. 2022, 607, 127459. [Google Scholar] [CrossRef]
- Karthe, D.; Abdullaev, I.; Boldgiv, B.; Borchardt, D.; Chalov, S.; Jarsjö, J.; Li, L.; Nittrouer, J.A. Water in Central Asia: An integrated assessment for science-based management. Environ. Earth Sci. 2017, 76, 690. [Google Scholar] [CrossRef] [Green Version]
- Berndtsson, R.; Tussupova, K. The Future of Water Management in Central Asia. Water 2020, 12, 2241. [Google Scholar] [CrossRef]
- Kuzmits, B. Cross-bordering water management in Central Asia. ZEF Work. Pap. Ser. 2006, 66, 1–20. [Google Scholar]
- Sheffield, J.; Wood, E.F. Drought: Past problems and future scenarios. Int. J. Digit. Earth 2011, 5, 2456–2459. [Google Scholar] [CrossRef]
- Zou, X.; Zhai, P.; Zhang, Q. Variations in droughts over China: 1951–2003. Geophys. Res. Lett. 2005, 32, 353–368. [Google Scholar] [CrossRef]
- Lioubimtseva, E.; Henebry, G.M. Climate and environmental change in arid Central Asia: Impacts, vulnerability, and adaptations. J. Arid Environ. 2009, 73, 963–977. [Google Scholar] [CrossRef]
- de Beurs, K.M.; Henebry, G.M.; Owsley, B.C.; Sokolik, I. Using multiple remote sensing perspectives to identify and attribute land surface dynamics in Central Asia 2001–2013. Remote Sens. Environ. 2015, 170, 48–61. [Google Scholar] [CrossRef]
- He, B.; Lü, A.; Wu, J.; Zhao, L.; Liu, M. Drought hazard assessment and spatial characteristics analysis in China. J. Geogr. Sci. 2011, 21, 235–249. [Google Scholar] [CrossRef]
- Zhang, R.; Zhao, C.; Ma, X.; Karthikeyan, B.; Han, Q.; Li, C.; Zhao, X. Projected Spatiotemporal Dynamics of Drought under Global Warming in Central Asia. Sustainability 2019, 11, 4421. [Google Scholar] [CrossRef] [Green Version]
- Guo, H.; Li, M.; Nzabarinda, V.; Bao, A.; Meng, X.; Zhu, L.; De Maeyer, P. Assessment of Three Long-Term Satellite-Based Precipitation Estimates against Ground Observations for Drought Characterization in Northwestern China. Remote Sens. 2022, 14, 828. [Google Scholar] [CrossRef]
- Bhuvanamitra, S.; Deka, P.C. Evaluating the performance of CHIRPS satellite rainfall data for streamflow forecasting. Water Resour. Manag. 2019, 33, 3913–3927. [Google Scholar] [CrossRef]
- Duan, Z.; Liu, J.; Tuo, Y.; Chiogna, G.; Disse, M. Evaluation of eight high spatial resolution gridded precipitation products in Adige Basin (Italy) at multiple temporal and spatial scales. Sci. Total Environ. 2016, 573, 1536–1553. [Google Scholar] [CrossRef] [PubMed] [Green Version]
- Sahlu, D.; Moges, S.A.; Nikolopoulos, E.I.; Anagnostou, E.N.; Hailu, D. Evaluation of High-Resolution Multisatellite and Reanalysis Rainfall Products over East Africa. Adv. Meteorol. 2017, 2017, 4957960. [Google Scholar] [CrossRef]
- Guo, H.; Bao, A.; Liu, T.; Chen, S.; Ndayisaba, F. Evaluation of PERSIANN-CDR for Meteorological Drought Monitoring over China. Remote Sens. 2016, 8, 379. [Google Scholar] [CrossRef] [Green Version]
- Alijanian, M.; Rakhshandehroo, G.R.; Mishra, A.; Dehghani, M. Evaluation of remotely sensed precipitation estimates using PERSIANN-CDR and MSWEP for spatio-temporal drought assessment over Iran. J. Hydrol. 2019, 579, 124189. [Google Scholar] [CrossRef]
- Suliman, A.H.A.; Awchi, T.A.; Al-Mola, M.; Shahid, S. Evaluation of remotely sensed precipitation sources for drought assessment in Semi-Arid Iraq. Atmos. Res. 2020, 242, 105007. [Google Scholar] [CrossRef]
- Alijanian, M.; Rakhshandehroo, G.R.; Mishra, A.K.; Dehghani, M. Evaluation of satellite rainfall climatology using CMORPH, PERSIANN-CDR, PERSIANN, TRMM, MSWEP over Iran. Int. J. Climatol. 2017, 37, 4896–4914. [Google Scholar] [CrossRef]
- Brasil Neto, R.M.; Santos, C.A.G.; Silva, J.; da Silva, R.M.; Dos Santos, C.A.C.; Mishra, M. Evaluation of the TRMM product for monitoring drought over Paraiba State, northeastern Brazil: A trend analysis. Sci. Rep. 2021, 11, 1097. [Google Scholar] [CrossRef]
- Sahoo, A.K.; Sheffield, J.; Pan, M.; Wood, E.F. Evaluation of the Tropical Rainfall Measuring Mission Multi-Satellite Precipitation Analysis (TMPA) for assessment of large-scale meteorological drought. Remote Sens. Environ. 2015, 159, 181–193. [Google Scholar] [CrossRef]
- Tan, X.; Ma, Z.; He, K.; Han, X.; Ji, Q.; He, Y. Evaluations on gridded precipitation products spanning more than half a century over the Tibetan Plateau and its surroundings. J. Hydrol. 2020, 582, 124455. [Google Scholar] [CrossRef]
- Chen, T.; Ren, L.; Yuan, F.; Tang, T.; Yang, X.; Jiang, S.; Liu, Y.; Zhao, C.; Zhang, L. Merging ground and satellite-based precipitation data sets for improved hydrological simulations in the Xijiang River basin of China. Stoch. Environ. Res. Risk Assess. 2019, 33, 1893–1905. [Google Scholar] [CrossRef]
- Guo, H.; Chen, S.; Bao, A.; Hu, J.; Yang, B.; Stepanian, P. Comprehensive Evaluation of High-Resolution Satellite-Based Precipitation Products over China. Atmosphere 2015, 7, 6. [Google Scholar] [CrossRef] [Green Version]
- Jiang, S.; Liu, R.; Ren, L.; Wang, M.; Shi, J.; Zhong, F.; Duan, Z. Evaluation and Hydrological Application of CMADS Reanalysis Precipitation Data against Four Satellite Precipitation Products in the Upper Huaihe River Basin, China. J. Meteorol. Res. 2020, 34, 1096–1113. [Google Scholar] [CrossRef]
- Su, J.; Lü, H.; Wang, J.; Sadeghi, A.; Zhu, Y. Evaluating the Applicability of Four Latest Satellite–Gauge Combined Precipitation Estimates for Extreme Precipitation and Streamflow Predictions over the Upper Yellow River Basins in China. Remote Sens. 2017, 9, 1176. [Google Scholar] [CrossRef] [Green Version]
- Wu, Z.; Xu, Z.; Wang, F.; He, H.; Zhou, J.; Wu, X.; Liu, Z. Hydrologic Evaluation of Multi-Source Satellite Precipitation Products for the Upper Huaihe River Basin, China. Remote Sens. 2018, 10, 840. [Google Scholar] [CrossRef] [Green Version]
- Beck, H.E.; Wood, E.F.; Pan, M.; Fisher, C.K.; Miralles, D.G. MSWEP V2 global 3-hourly 0.1° precipitation: Methodology and quantitative assessment. Bull. Am. Meteorol. Soc. 2018, 100, 473–500. [Google Scholar] [CrossRef] [Green Version]
- Suryavanshi, S.; Pandey, A.; Chaube, U.C.; Joshi, N. Long-term historic changes in climatic variables of Betwa Basin, India. Theor. Appl. Climatol. 2013, 117, 403–418. [Google Scholar] [CrossRef]
- Guo, H.; Bao, A.; Liu, T.; Ndayisaba, F.; Jiang, L.; Zheng, G.; Chen, T.; De Maeyer, P. Determining variable weights for an Optimal Scaled Drought Condition Index (OSDCI): Evaluation in Central Asia. Remote Sens. Environ. 2019, 231, 111220. [Google Scholar] [CrossRef]
- Guo, H.; Bao, A.; Ndayisaba, F.; Liu, T.; Kurban, A.; De Maeyer, P. Systematical Evaluation of Satellite Precipitation Estimates Over Central Asia Using an Improved Error-Component Procedure. J. Geophys. Res. Atmos. 2017, 122, 10906–10927. [Google Scholar] [CrossRef]
- Guo, H.; Chen, S.; Bao, A.; Hu, J.; Gebregiorgis, A.; Xue, X.; Zhang, X. Inter-Comparison of High-Resolution Satellite Precipitation Products over Central Asia. Remote Sens. 2015, 7, 7181–7211. [Google Scholar] [CrossRef] [Green Version]
- AghaKouchak, A.; Farahmand, A.; Melton, F.S.; Teixeira, J.; Anderson, M.C.; Wardlow, B.D.; Hain, C.R. Remote sensing of drought: Progress, challenges and opportunities. Rev. Geophys. 2015, 53, 452–480. [Google Scholar] [CrossRef] [Green Version]
- Jiaguo, Q. An overview of environmental issues in Central Asia. Environmental. Nato Sci. Peace Secur. 2008, 3–14. [Google Scholar]
- Qi, J.; Bobushev, T.S.; Kulmatov, R.; Groisman, P.; Gutman, G. Addressing global change challenges for Central Asian socio-ecosystems. Front. Earth Sci. 2012, 6, 115–121. [Google Scholar] [CrossRef]
- Mandel, I.; Lipovetsky, S. Climate Change Report IPCC 2021–A Chimera of Science and Politics; Social Science Electronic Publishing: Rochester, NY, USA, 2021. [Google Scholar]
- Beck, H.E.; van Dijk, A.I.J.M.; Levizzani, V.; Schellekens, J.; Miralles, D.G.; Martens, B.; de Roo, A. MSWEP: 3-hourly 0.25° global gridded precipitation (1979–2015) by merging gauge, satellite, and reanalysis data. Hydrol. Earth Syst. Sci. 2017, 21, 589–615. [Google Scholar] [CrossRef] [Green Version]
- Beck, H.E.; Vergopolan, N.; Pan, M.; Levizzani, V.; van Dijk, A.I.J.M.; Weedon, G.; Brocca, L.; Pappenberger, F.; Huffman, G.J.; Wood, E.F. Global-scale evaluation of 22 precipitation datasets using gauge observations and hydrological modeling. Hydrol. Earth Syst. Sci. 2017, 21, 6201–6217. [Google Scholar] [CrossRef] [Green Version]
- Mckee, T.B.; Doesken, N.J.; Kleist, J. The Relationship of Drought Frequency and Duration to Time Scales. In Proceedings of the 8th Conference on Applied Climatology, Anaheim, CA, USA, 17–22 January 1993. [Google Scholar]
- Yevjevich, V. Objective Approach to Define and Investigations of Contienntal Hydrologic Droughts. 1967. Available online: http://www.sciencedirect.com/science/article/pii/0022169469901103 (accessed on 1 July 2021).
- Guo, H.; Bao, A.; Liu, T.; Ndayisaba, F.; He, D.; Kurban, A.; De Maeyer, P. Meteorological Drought Analysis in the Lower Mekong Basin Using Satellite-Based Long-Term CHIRPS Product. Sustainability 2017, 9, 901. [Google Scholar] [CrossRef] [Green Version]
- Sen, P.K. Estimates of the Regression Coefficient Based on Kendall’s Tau. J. Am. Stat. Assoc. 1968, 63, 1379–1389. [Google Scholar] [CrossRef]
- da Silva, R.M.; Santos, C.A.G.; Moreira, M.; Corte-Real, J.; Silva, V.C.L.; Medeiros, I.C. Rainfall and river flow trends using Mann–Kendall and Sen’s slope estimator statistical tests in the Cobres River basin. Nat. Hazards 2015, 77, 1205–1221. [Google Scholar] [CrossRef]
- Guo, H.; Bao, A.; Ndayisaba, F.; Liu, T.; Jiapaer, G.; El-Tantawi, A.M.; De Maeyer, P. Space-time characterization of drought events and their impacts on vegetation in Central Asia. J. Hydrol. 2018, 564, 1165–1178. [Google Scholar] [CrossRef]
- Hamed Khaled, H.; Ramachandra, R.A. A modifiedMann-Kendall trend test for autocorrelated data. J. Hydrol. 1998, 204, 182–196. [Google Scholar] [CrossRef]
- Joshi, N.; Gupta, D.; Suryavanshi, S.; Adamowski, J.; Madramootoo, C.A. Analysis of trends and dominant periodicities in drought variables in India: A wavelet transform based approach. Atmos. Res. 2016, 182, 200–220. [Google Scholar] [CrossRef]
- Merino, A.; López, L.; Hermida, L.; Sánchez, J.L.; García-Ortega, E.; Gascón, E.; Fernández-González, S. Identification of drought phases in a 110-year record from Western Mediterranean basin: Trends, anomalies and periodicity analysis for Iberian Peninsula. Glob. Planet. Chang. 2015, 133, 96–108. [Google Scholar] [CrossRef]
- Huang, Q.; Zhang, Q.; Singh, V.P.; Shi, P.; Zheng, Y. Variations of dryness/wetness across China: Changing properties, drought risks, and causes. Glob. Planet. Chang. 2017, 155, 1–12. [Google Scholar] [CrossRef]
- Cleveland, W.S.; Devlin, S.J. Locally Weighted Regression: An Approach to Regression Analysis by Local Fitting. J. Am. Stat. Assoc. 1988, 83, 596–610. [Google Scholar] [CrossRef]
- Cleveland, W.S. Robust Locally Weighted Regression and Smoothing Scatterplots. J. Am. Stat. Assoc. 1979, 74, 829–836. [Google Scholar] [CrossRef]
- Patrick, E. Drought characteristics and management in Central Asia and Turkey. FAO Water Rep. 2017, 44, 114. [Google Scholar]
- Sommer, R.; Djanibekov, N.; Salaev, O. Optimization of Land and Resource Use at Farm-Aggregated Level in the Aral Sea Basin of Uzbekistan with the Integrated Model FLEOM–Model Description and First Application; J. ZEF–Discussion Papers on Development Policy: Bonn, Germany, 2010; p. 102. [Google Scholar]
- Xu, H.J.; Wang, X.P.; Zhang, X.X. Decreased vegetation growth in response to summer drought in Central Asia from 2000 to 2012. Int. J. Appl. Earth Obs. 2016, 52, 390–402. [Google Scholar] [CrossRef]
- Wright, C.K.; de Beurs, K.M.; Henebry, G.M. Land surface anomalies preceding the 2010 Russian heat wave and a link to the North Atlantic oscillation. Environ. Res. Lett. 2014, 9, 124015. [Google Scholar] [CrossRef]
- Pollner, J.; Krypsin-Watson, J.; Nieuwejaar, S. Climate change adaptation in Europe and Central Asia: Disaster risk management. World Bank 2008, 22, 258598. [Google Scholar]
- Guo, H.; Bao, A.; Liu, T.; Jiapaer, G.; Ndayisaba, F.; Jiang, L.; Kurban, A.; De Maeyer, P. Spatial and temporal characteristics of droughts in Central Asia during 1966–2015. Sci. Total Environ. 2018, 624, 1523–1538. [Google Scholar] [CrossRef]
Publisher’s Note: MDPI stays neutral with regard to jurisdictional claims in published maps and institutional affiliations. |
© 2022 by the authors. Licensee MDPI, Basel, Switzerland. This article is an open access article distributed under the terms and conditions of the Creative Commons Attribution (CC BY) license (https://creativecommons.org/licenses/by/4.0/).