Article

Evaluation of TROPOMI and OMI Tropospheric NO2 Products Using Measurements from MAX-DOAS and State-Controlled Stations in the Jiangsu Province of China

1
School of Computer and Information Engineering, Henan University, Kaifeng 475004, China
2
Henan Key Laboratory of Big Data Analysis and Processing, Kaifeng 475004, China
3
State Key Laboratory of Remote Sensing Science, Aerospace Information Research Institute, Chinese Academy of Sciences, Beijing 100101, China
4
Earth Observation System and Data Center, CNSA, Department of Achievement Transformation, Beijing 100101, China
5
Key Laboratory of Radiometric Calibration and Validation for Environmental Satellites, National Satellite Meteorological Center, China Meteorological Administration, Beijing 100101, China
6
School of Geospatial Engineering and Science, Sun Yat-sen University, Zhuhai 519082, China
7
Laboratory of Environmental Optical and Technology, Anhui Institute of Optics and Fine Mechanics, Chinese Academy of Sciences, Hefei 230031, China
*
Authors to whom correspondence should be addressed.
Atmosphere 2022, 13(6), 886; https://doi.org/10.3390/atmos13060886
Submission received: 19 April 2022 / Revised: 27 May 2022 / Accepted: 27 May 2022 / Published: 30 May 2022

Abstract

:
The tropospheric vertical column density of NO2 (Trop NO2 VCD) can be obtained using satellite remote sensing, but it has been discovered that the Trop NO2 VCD is affected by uncertainties such as the cloud fraction, terrain reflectivity, and aerosol optical depth. A certain error occurs in terms of data inversion accuracy, necessitating additional ground observation verification. This study uses surface NO2 mass concentrations from the China National Environmental Monitoring Center (CNEMC) sites in Jiangsu Province, China in 2019 and the Trop NO2 VCD measured by MAX-DOAS, respectively, to verify the Trop NO2 VCD product (daily and monthly average data), that comes from the TROPOspheric Monitoring Instrument (TROPOMI) and Ozone Monitoring Instrument (OMI). The results show that the spatial distributions of NO2 in TROPOMI and OMI exhibit a similar tendency and seasonality, showing the characteristics of being high in spring and winter and low in summer and autumn. On the whole, the concentration of NO2 in the south of Jiangsu Province is higher than that in the north. The Pearson correlation coefficient (r) between the monthly average TROPOMI VCD NO2 and the CNEMC NO2 mass concentration is 0.9, which is greater than the r (0.78) between OMI and CNEMC; the r (0.69) between TROPOMI and the MAX-DOAS VCD NO2 is greater than the r (0.59) between OMI and the MAX-DOAS. As such, the TROPOMI is better than the previous generation of OMI at representing the spatio-temporal distribution of NO2 in the regional scope. On the other hand, the uncertainties of the satellite products provided in this study can constrain regional air quality forecasting models and top-down emission inventory estimation.

1. Introduction

The NO2 level in the atmosphere is rising due to the rapid development of the social economy and industrialization. As an important atmospheric trace gas, NO2 is one of the main pollutants monitored by environmental protection agencies in China, Europe, and North and South America [1,2]. NO2 causes the photochemical reaction of O3 and the formation of secondary aerosols, as well as influencing the lifespan of CH4 and other greenhouse gases, altering the Earth’s radiation balance and, ultimately, profoundly impacting human health and causing environmental changes [3,4]. As a result, the monitoring of NO2 concentrations is crucial for the determination of their source and the development of pollution control strategies. Currently, NO2 measurements are primarily carried out using ground-based and satellite remote sensing monitoring methods. In 2012, NO2 was added to the Chinese Ambient Air Quality Standard as a criterion for air pollutants. The Ministry of Environmental Protection (MEP) of China started to publish the monitored mass concentrations of NO2 at CNEMCs located in major Chinese cities in January 2013 [5,6]. The monitored data have the advantages of high accuracy, high reliability, and all-weather monitoring capabilities. However, the monitored data might not be representative because of the limited number and spatial distribution of the monitors; as well as the uneven station distribution, NO2 cannot be monitored in real time via large-scale ground-based observations [7]. Satellites have been widely used in environmental remote sensing since the 1990s, and an increasing number of atmospheric components can be observed by satellites [8,9]. In comparison to the limited ground or ground-based remote sensing observations, satellite remote sensing has the advantages of covering a wide area, providing macro-level change information, reflecting pollutant transport at a large scale and a regional scale, and can make up for the deficiency in the spatial and temporal distribution of ground monitoring sites, etc. [10].
Therefore, satellites are becoming increasingly important in NO2 monitoring. The advancement of satellite sensor technology has resulted in the launch of a series of satellites which are capable of detecting NO2. The Global Ozone Monitoring Experiment (GOME) instrument was launched by the European Space Agency (ESA) in 1995 [11]. It was the first satellite capable of performing global air-scale observations, greatly advancing atmospheric research [12,13]. The ENVISAT-1 satellite, launched by the ESA in 2002, is equipped with a scanning imaging absorption spectrometer (SCIAMACHY) for atmospheric mapping, which is specifically used to monitor trace gases such as NO2 and SO2 in the troposphere and stratosphere [14]. The AURA satellite, which was launched in 2004, is outfitted with the OMI. The OMI is a subsatellite point solar backscattering spectrometer that measures ultraviolet (UV)–visible light [15]. In general, its transit time is 13:40–13:50 local time. It obtains daily global atmospheric tropospheric O3 and various other trace measurement results from which the distribution of gases such as NO2 and SO2 can be determined [16]. OMI data are widely used in the dynamic real-time monitoring of atmospheric trace gases and pollutants in urban areas, air quality forecasting, and pollutant emission source inventory estimation. On 13 October 2017, the ESA successfully launched Sentinel-5P, an atmospheric measurement satellite with high temporal and spatial resolutions that was outfitted with the TROPOMI. The TROPOMI has advantages similar to those of SCIAMACHY, OMI, and other advanced technologies, as well as significantly improved sensitivity and spectral, spatial, and temporal resolutions (https://sentinels.copernicus.eu/web/sentinel/missions/sentinel-5p, accessed on 1 May 2021). On 17 April 2019, the In-orbit Demonstrator-1 Global Environmental Monitoring System (IOD-1 GEMS) satellite was launched. Satellite sensors have collected global NO2 observations for nearly 25 years since the launch of GOME in 1995.
However, satellite observations also have some basic uncertainties due to the instruments themselves and the retrieval algorithm; as such, the satellite products must be verified in order to ensure their applicability [17,18]. The gold standard for the verification of the results of satellite NO2 inversion is ground-based MAX-DOAS monitoring. From sunrise to sunset, MAX-DOAS instruments measure the UV–visible radiance scattered in several directions and elevation angles, from which the Trop VCD can be retrieved through different techniques [19]. They provide an adequate source of reference data for the validation of satellite nadir trace gas measurements [20]. For example, Xu Jin et al. [21] used ground-based MAX-DOAS to monitor Trop NO2 VCD over Olympic venues during the Beijing Olympics, and compared it with the result of OMI. This showed that the result of MAX-DOAS was higher than that of OMI, and the maximum was 2.4 times the result of OMI; both instruments had good accordance (r = 0.64) when it was clear, and when it was rainy or cloudy there was more difference between the results of both instruments due to the existence of cloud, with a correlation coefficient of 0.19. Mu Fusheng et al. [22] measured NO2 VCD based on MAX-DOAS in Hefei City during the open stalk-burning period, and showed that the NO2 concentration measured by MAX-DOAS was 1.9 times higher than that measured by OMI, and both instruments had good accordance during clear days. Kramer et al. [23] employed the ground-based MAX-DOAS approach to conduct experiments at the University of Leicester (52.38° N, 1.08° W), and a correlation coefficient of r = 0.64 was discovered with the OMI Trop NO2 VCD data. Chan et al. [24] used the MAX-DOAS to measure the Trop NO2 VCD in Nanjing (April 2014 to February 2017); the NO2 VCD obtained by OMI show a good correlation with MAX-DOAS, with an r of 0.91, but the average OMI-observed value is 30% lower than that of the MAX-DOAS.
MAX-DOAS, on the other hand, has yet to establish a large-scale conventional ground observation network. Since 2013, China has established nearly 1500 CNEMC sites on a national scale. The majority of NO2 emitted by human activities stays in the troposphere, which is closest to the surface; studies have shown that about 80% of NO2 in the troposphere comes from human activities [25,26]. As such, the CNEMC NO2 mass concentrations are used for comparison with satellite data Trop NO2 VCD derived from satellites. Zhang Ying et al. [27] used linear fitting to discover that the NO2 concentration measured at the CNEMC in Beijing-Tianjin-Hebei and the Trop NO2 VCD obtained by the OMI are significantly and highly correlated overall. The r values in Shijiazhuang, Xingtai, Baoding, and Cangzhou all exceed 0.8. The TROPOMI sensor has a significant advantage over the OMI sensor in terms of its signal-to-noise ratio and spatial resolution, and it is expected to gain greater application potential in further checklist verification and mode input [28].
Furthermore, compared with the validation of OMI products, TROPOMI verifications have been limited; current studies have reported the performance and verification of TROPOMI NO2 products. Griffin et al. [29] presented the first results of the validation of TROPOMI NO2 retrievals over the Canadian oil sands using air-mass factors calculated with the high-resolution GEM-MACH model; they show that the TROPOMI NO2 VCD are highly correlated with the aircraft and surface in situ NO2 observations, as well as the ground-based remote-sensing measurements, with a low bias (15–30%). Ialongo et al. [30] compared TROPOMI NO2 observations with ground-based measurements in Helsinki, and found a high correlation (r = 0.68) between satellite and ground-based data. Zhao et al. [31] assessed TROPOMI tropospheric NO2 data with Pandora spectrometers NO2 measurements methods in the Greater Toronto area; they found that these current TROPOMI tropospheric NO2 products met the TROPOMI design bias requirement (<10%). Ialongo et al. [30], Judd et al. [32] and Chan et al. [33] all assessed TROPOMI NO2 data with different methods focused on various regions. In contrast, there are few evaluations of TROPOMI in China. Wang et al. [17] presented comparisons between TROPOMI tropospheric NO2, total SO2 products, ground-based MAX-DOAS at a single site (Xianghe), and OMI products over the North China Plain in China; TROPOMI Trop NO2 VCD are generally underestimated compared with collocated MAX-DOAS and OMI data, by about 30–60%. The inversion accuracy of TROPOMI NO2 data has some errors, which require additional ground observation verification. Due to the large difference in the global spatial and temporal distribution of NO2, validation in different regions will provide support for the further improvement of the TROPOMI NO2 algorithm.
Adequate verification is the key to evaluating and improving the quality of satellite products. This study evaluated the accuracy of OMI and TROPOMI NO2 products in the region by referring to the NO2 concentration observed at 87 CNEMC sites and a single MAX-DOAS in Jiangsu, which is of great significance to the application of satellite NO2 products in this region. In addition, the comparative analysis of the accuracy of OMI and TROPOMI NO2 products further indicates that, with the improvement of the load performance, the TROPOMI load is better than the previous generation of the OMI load at representing the spatio-temporal distribution of NO2 in the regional scope. On the other hand, the uncertainties of the satellite products provided in this study can constrain regional air quality forecasting models and top-down emission inventory estimation.

2. Research Area and Data
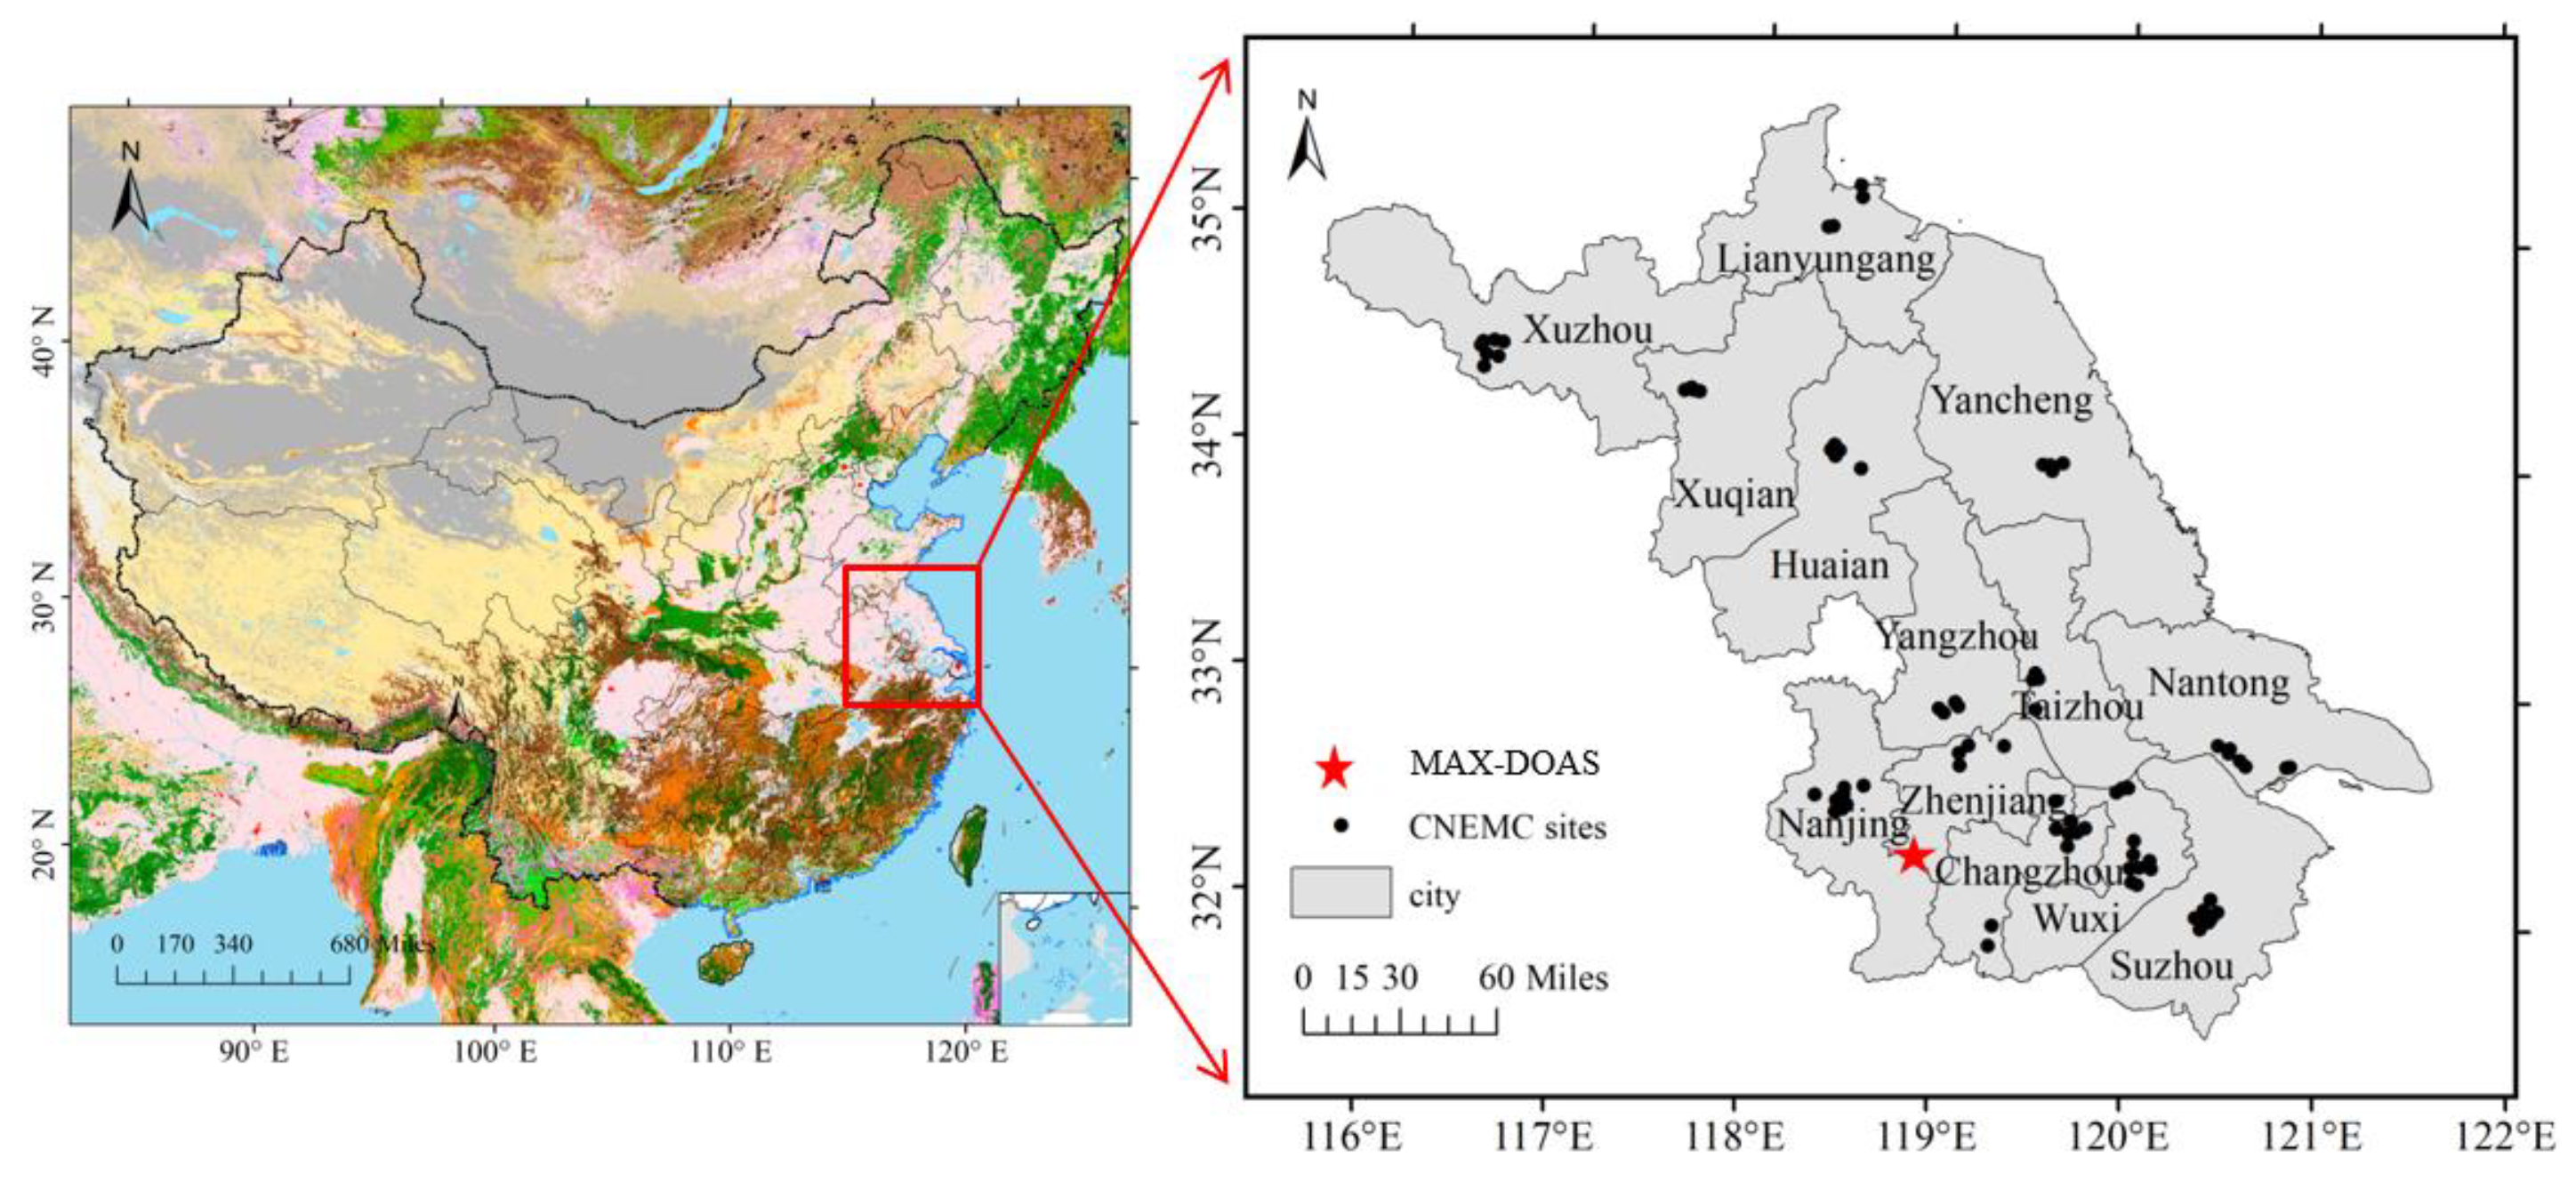
2.1. Research Area

Jiangsu Province is located in East China, and is one of the important parts of the Yangtze River Delta Economic Zone (Figure 1). This region is dominated by plains, which cover more than 70% of the province’s land area, and there are numerous rivers and lakes. This region features a mild climate, moderate rainfall, and four distinct seasons as it transitions from the temperate zone to the subtropical zone. The ground-based MAX-DOAS test site is on the Nanjing University Campus (32.14° N, 119.04° E), which is located in the Qixia Scenic Area of Nanjing, with many pastures, forest areas, and industrial parks to the east. In this area, urbanization has only recently begun.

2.2. Data and Processing Method

2.2.1. CNEMC NO2 Products

The Chinese government established the CNEMC, the main functions of which are state environmental monitoring and the development of state environmental monitoring methods. The CNEMC has been monitoring ground-level NO2 concentrations in China since the beginning of 2013 [34]. By the end of 2017, China had established 1497 monitoring stations for atmospheric pollution [35]. Every hour, the monitoring sites release observations of ground NO2 and fine particulate matter (PM10). Although the CNEMC measures NO2 mass concentrations very accurately, the construction and maintenance costs are high, and it is difficult to meet the requirements of real-time and accurate large-scale NO2 monitoring. The stations are primarily located in China’s central and eastern regions, with little monitoring taking place in the country’s western development areas. The NO2 mass concentration data from 87 sites in Jiangsu Province released by the CNEMC in 2019 were used in this study. Figure 1 depicts the distribution of the sites. In this paper, the obtained site NO2 mass concentration data were imported into the SQL Server for processing. The NO2 mass concentration measured at environmental monitoring sites is expressed in µg/m3, with a one-hour monitoring interval. Values with poor continuity in terms of observation time were removed from the environmental monitoring site data, specifically those from certain ground stations with fewer than 20 observations per day. Due to the satellite transit time being approximately 13:00 local time, the daily average was chosen as the average of the ground station observation data between 13:00 and 14:00.

2.2.2. MAX-DOAS NO2 Products

MAX-DOAS provides ground-based observations to assess and determine the degree of atmospheric pollution. It has been widely used in the field of atmospheric environmental monitoring in recent years due to its continuous, non-contact, and high-spatial-resolution characteristics [36]. It provides more accurate pollution distribution in the monitored area than satellite equipment. MAX-DOAS data have been used extensively for tropospheric NO2 satellite validation, for instance for OMI and GOME-2 [37], and ground-based MAX-DOAS tropospheric gas observations can be used to verify the accuracy of TROPOMI data [38]. The ground-based MAX-DOAS instrument receives light from various directions based on the telescope direction in order to acquire the spatial distribution information of the absorbed gas. The telescope receives absorbed and scattered sunlight through the MAX-DOAS reception mirror, which is then transferred to the spectrometer via optical fiber, and is lastly received by the charge-coupled device (CCD) to produce the spectral signal. The MAX-DOAS spectral range of 300–500 nm is useful for spectrum collection, system control, and calibration automation, whereas sky-scattered light from the zenith and other observation directions is used for NO2, SO2, and O3 measurements [39]. The ground-based MAX-DOAS data used for analysis are from the Chinese Academy of Sciences’ Anhui Institute of Optics and Fine Mechanics (Figure 1), and test data is available for 196 days, from March to November 2019. The monitoring interval is approximately15 min. In order to match the transit time of the satellite, the daily average value was chosen as the average value of the observation data from 13:00 to 14:00.

2.2.3. OMI NO2 Products

The OMI is equipped with three independent detectors [40], namely UV-1, UV-2, and VIS detectors. NO2 has a spectral range of 350–510 nm, and the VIS detector covers the majority of the wavelength range required for NO2 retrieval. Push-broom imaging is used by the OMI. Each push-broom row has 60 pixels, with each pixel representing the ground width perpendicular to the orbit, ranging from 24 km at the subsatellite point to 128 km at the pixel edge. The width is about 2600 km, and the length of the track along the ground is approximately 13 km [41]. The OMI data used in this study were obtained from the NASA website (https://disc.gsfc.nasa.gov, accessed on 1 January 2020), and are satellite remote sensing data for public use. The Trop NO2 VCD product, version number OMNO2 v003, in ESRI grid format, was utilized in this study; this spans from January to December 2019. The row anomaly problem in OMI data affects the quality of level 1B radiance data at all wavelengths for a specific viewing direction of OMI. Since 5 July 2011, the abnormality of this line has frequently shown only minor changes. As a result, comparisons for data in 2019 are unaffected by the row anomaly. The following are the data selection criteria [42]: (1) Clouds have a significant impact on gas retrieval. Excessive cloud cover will affect satellite pollutant detection and increase the light absorption intensity of pollutants by clouds, thus increasing the gas retrieval error, and the cloud fraction is <0.3. (2) Too high a solar zenith angle will greatly increase the atmospheric optical path observed by satellites, and the solar zenith angle is <85. (3) Too much surface reflectivity will increase backscattering and the inversion error, and the terrain reflectivity of the data should be below 0.3.

2.2.4. TROPOMI NO2 Products

Every day, the TROPOMI crosses the equator at around 13:30 local time, providing nearly global coverage [15,43]. The TROPOMI UV-VIS spectral range begins at 270 nm and extends to 495 nm. In comparison to the OMI, which was launched in 2004 and is still in orbit, the TROPOMI has fine-resolution NO2 detection capability. Using NO2 products as an example, the resolution of OMI NO2 products is 13 × 24 km2, while TROPOMI NO2 products have a resolution of 5 × 3.5 km2. Furthermore, the TROPOMI NO2 data are based on the DOMINO-2 product algorithm and a prototype of the OMI EUQA4ECV NO2 product algorithm, which has been further optimized. The NO2 profile in the inversion algorithm is based on the TM5-MP chemical transmission mode’s 1° × 1° latitude–longitude resolution product, which is an improvement over the 2° × 3° latitude–longitude resolution profile data used in the previous generation algorithm [29]. The daily TROPOMI data used in this study can be downloaded from the Tropospheric Emission Monitoring Network (http://www.temis.nl/, accessed on 1 January 2020); the version is TM5-MP-DOMINO v1.2.× & v1.3.× OFFLINE, in ESRI grid format, and the period is January to December 2019. The data-filtering criteria are as follows: qa value > 75, solar zenith angle < 85, surface albedo < 0.3, and cloud_fraction_crb_nitrogendioxide_window < 0.3.

2.3. Validation Method

The matching accuracies vary depending on the spatiotemporal matching method used. The average value measured by the state-controlled monitoring stations and ground-based MAX-DOAS instrument from 13:00 to 14:00 were used as the ground measurement value for matching based on the TROPOMI and OMI transit times. When matching data from state-controlled monitoring sites, data from the smallest pixel range at the matching site were chosen, and the average value was used as the satellite measurement value. Given the difference in resolution between the TROPOM and OMI, pixel averages were chosen in different ranges when matching the ground-based MAX-DOAS data. Accuracy and errors were reported using the r, the mean absolute percentage error (MAPE, Equation (1), and root mean square error (RMSE, Equation (2)); these three indicators were compared to determine the most suitable pixel range. The slope (β, Equation (3)) and intercept (α, Equation (4)) between the collocated satellite (OMI, TROPOMI) and ground (CNEMC, MAX-DOAS) NO2 data were calculated using the reduced major axis (RMA) regression, which incorporates errors in both the independent (Ground) and dependent (Satellite) variables [44].
MAPE = i = 1 n | X ( Satellite , i ) X ( Ground , i ) X ( Ground , i ) | n × 100 %
RMSE = i = 1 n ( X ( Satellite , i ) X ( Ground , i ) ) 2 n
β = σ Satellite   NO 2 σ Ground   NO 2
α = Satellite   NO 2 ¯ ( σ Satellite   NO 2 σ Ground   NO 2 ) × Ground   NO 2 ¯

3. Results and Discussion

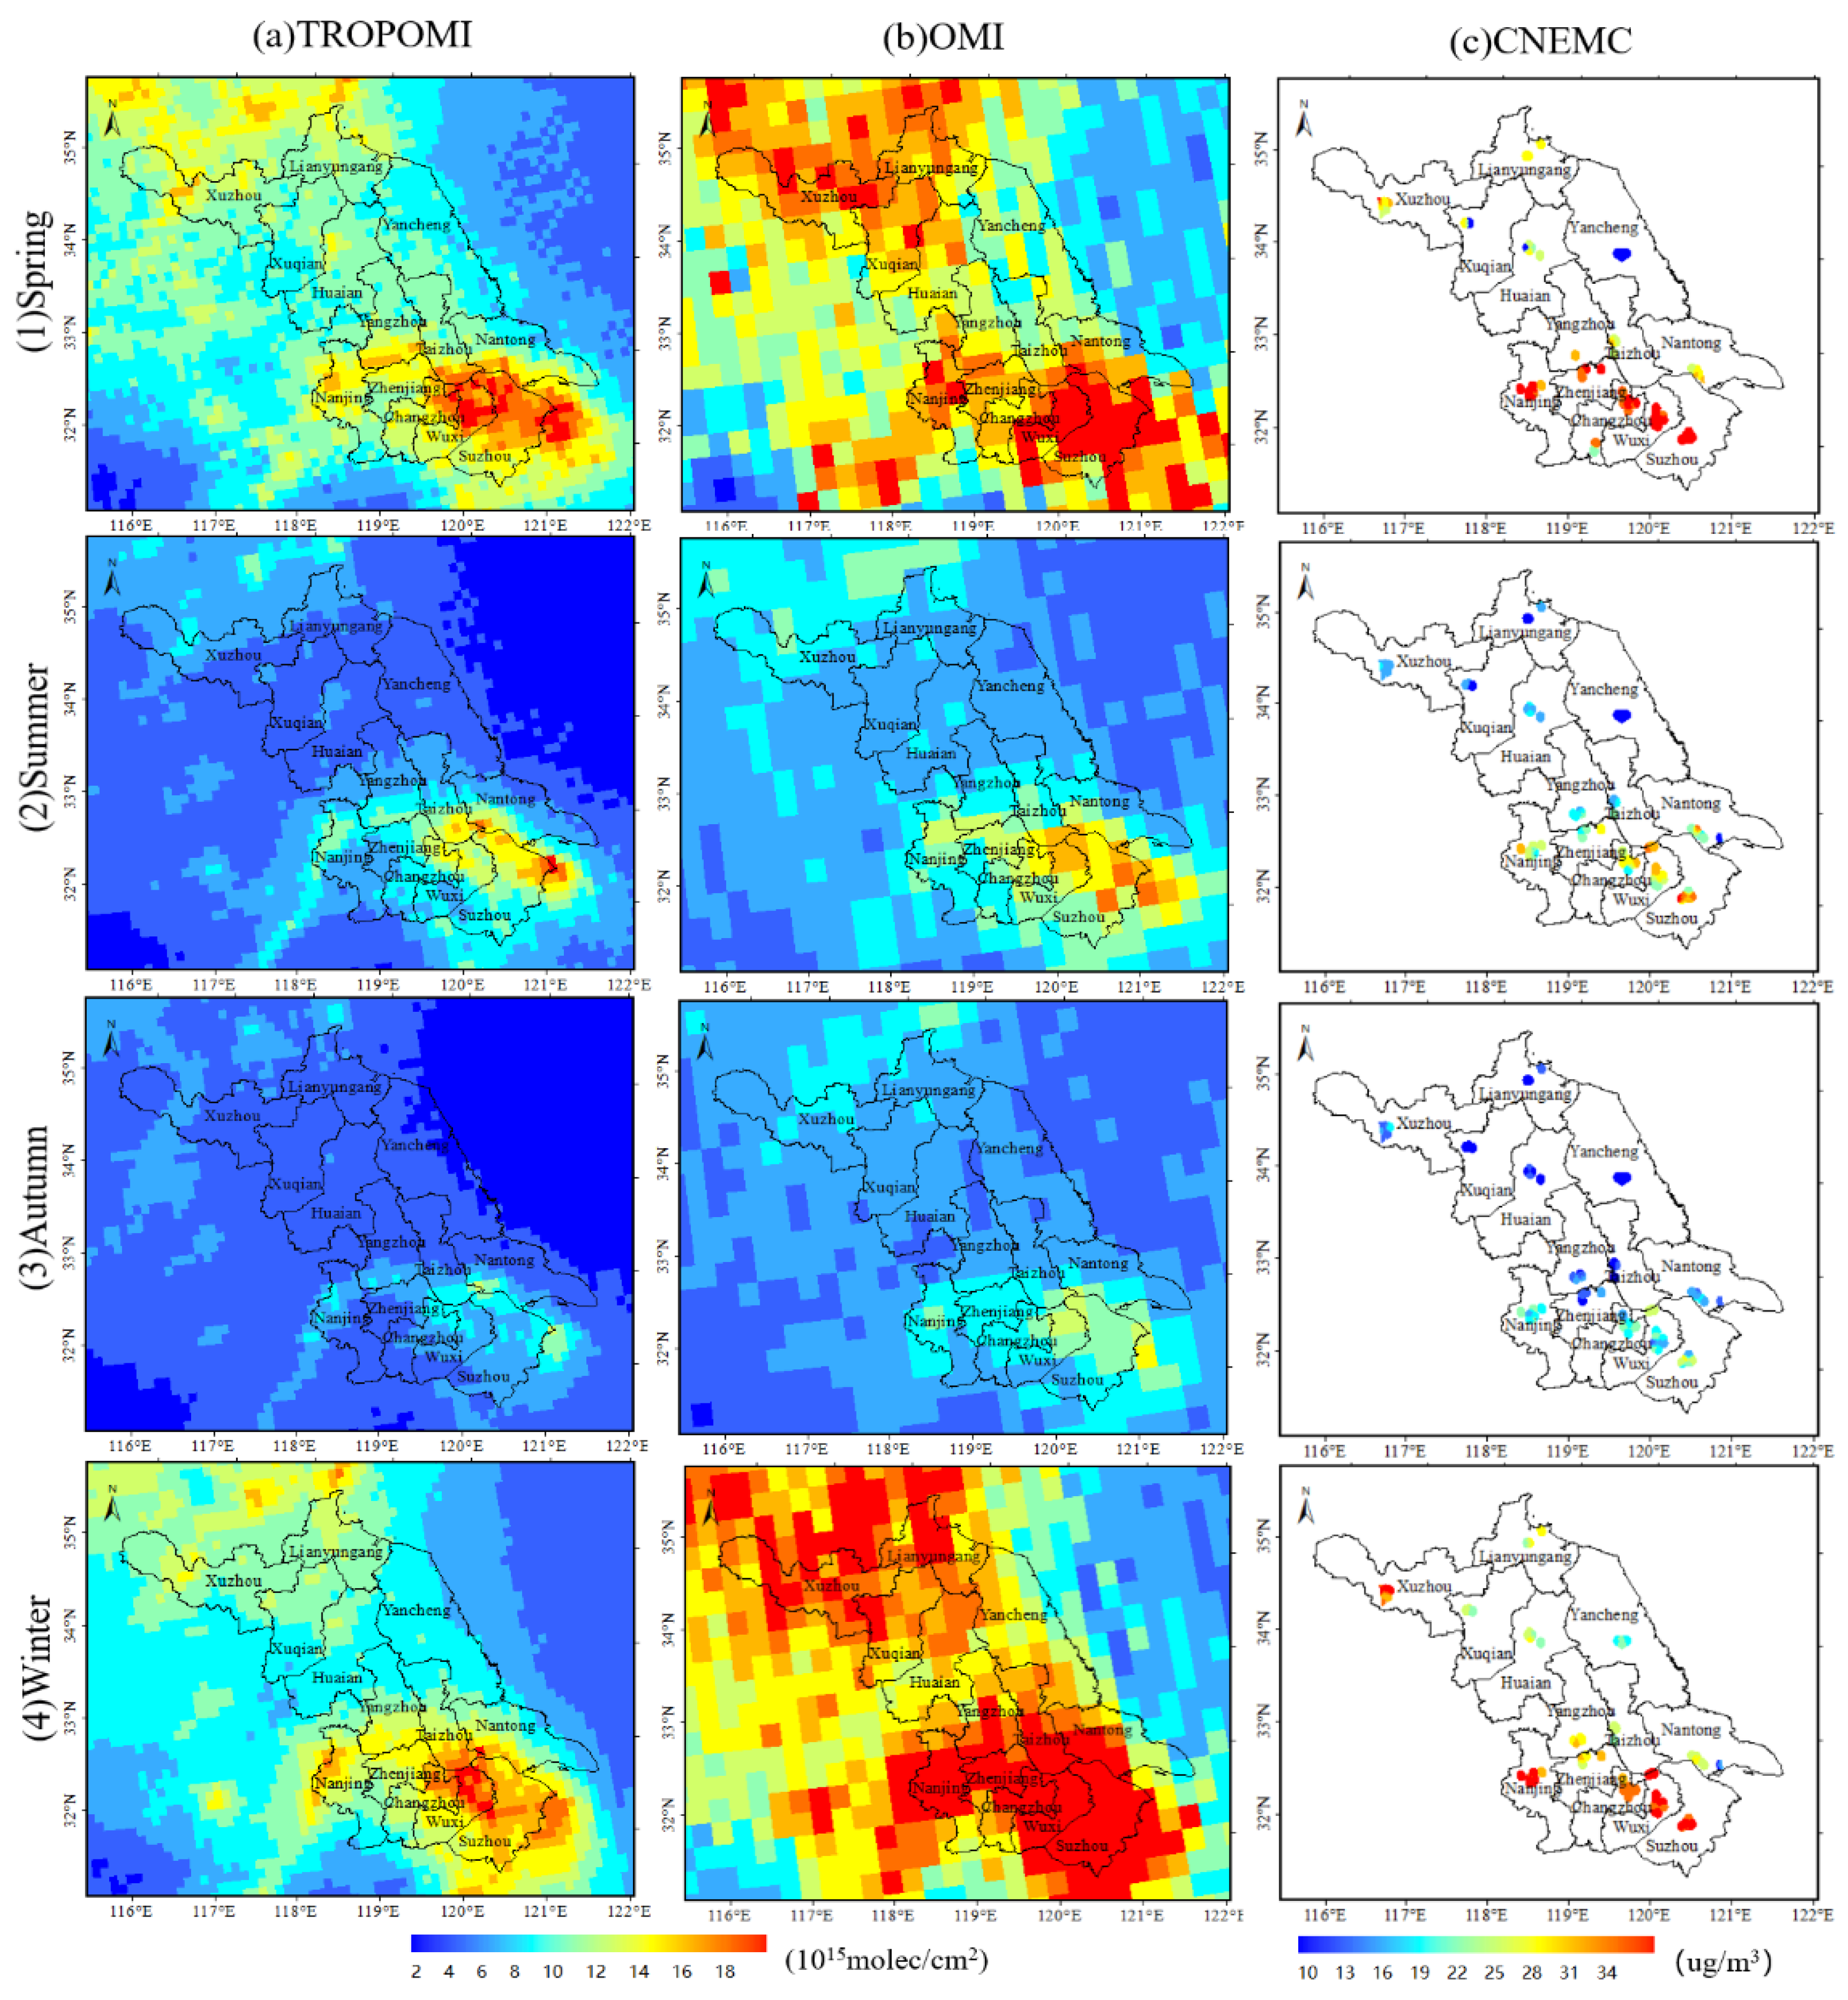
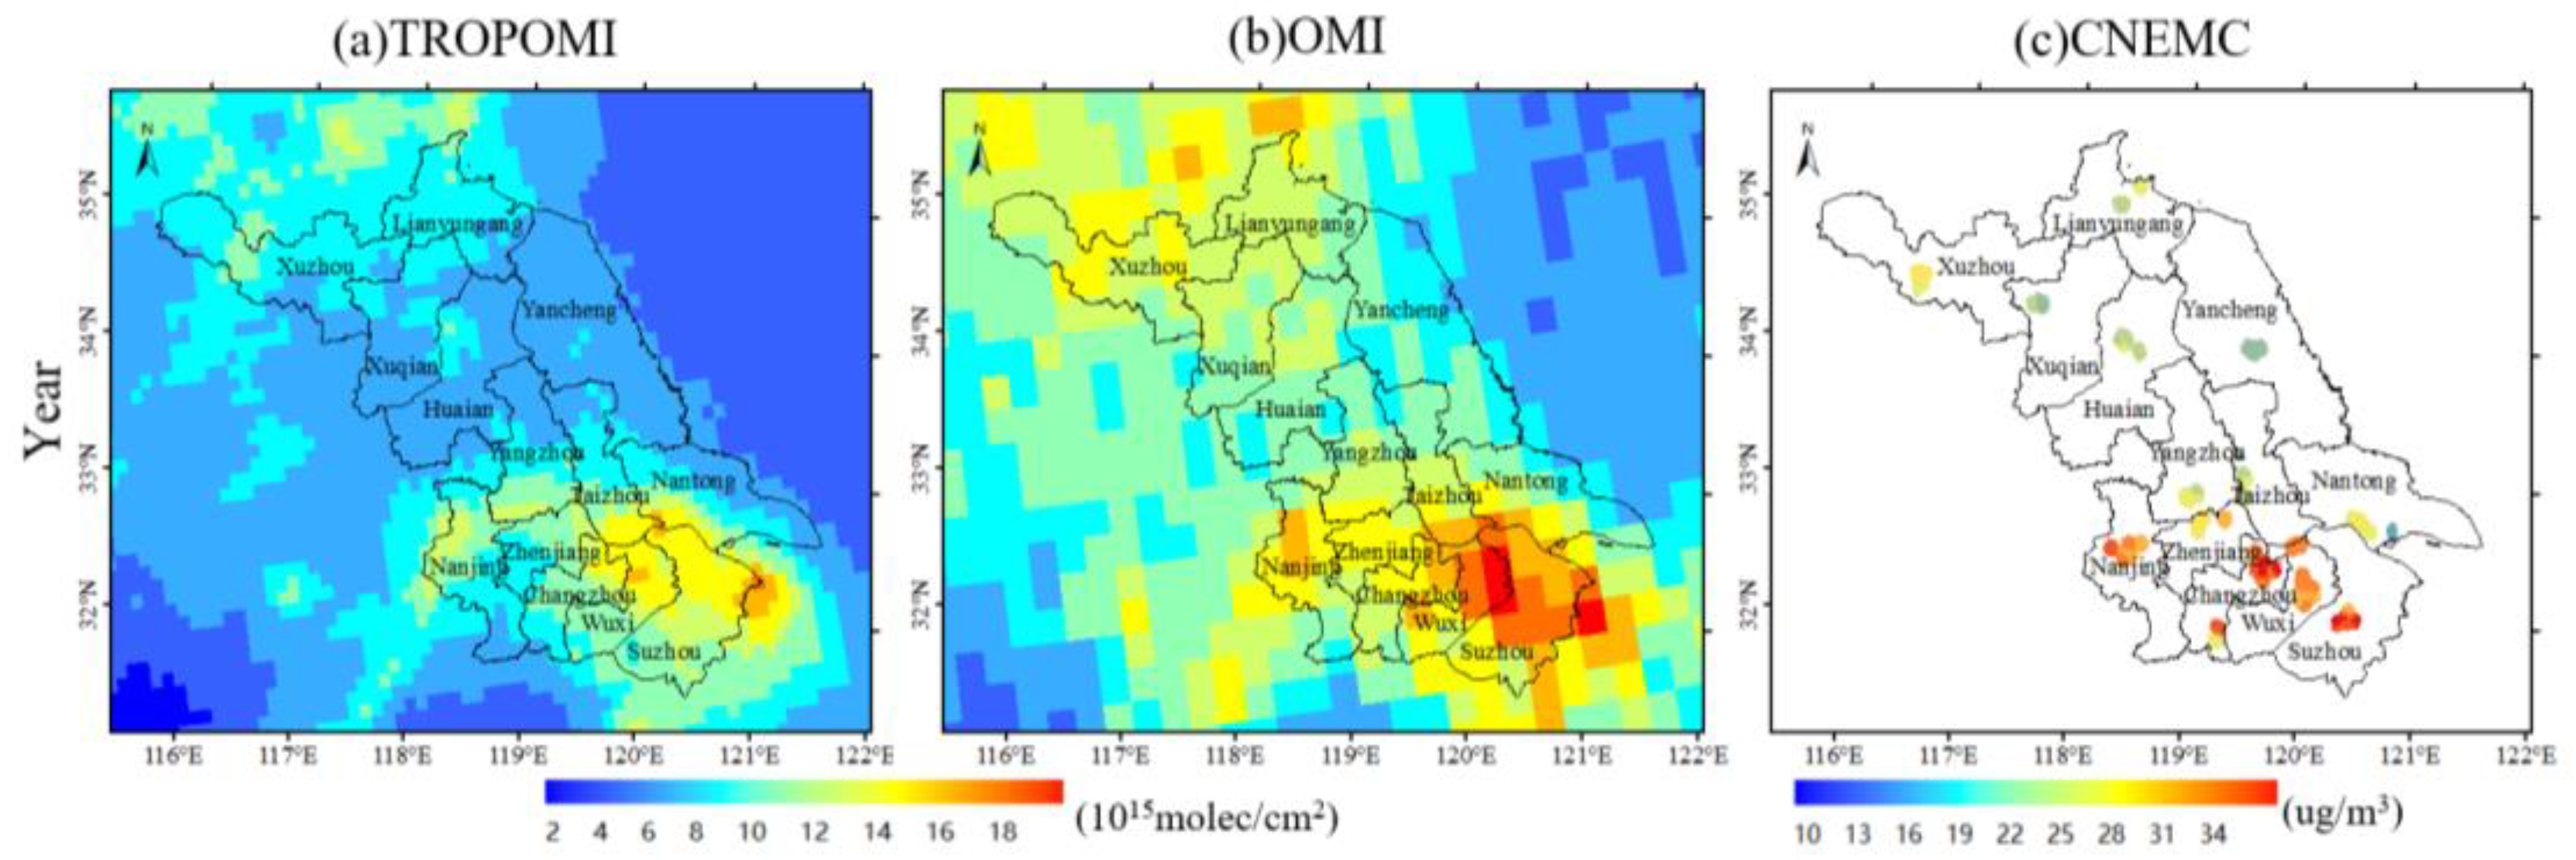
3.1. Spatial Distribution of Satellites’ Trop NO2 VCD and CNEMC NO2

NO2 seasonal variation and product discrepancy can be better investigated using spatial analysis. We used ArcGIS software to draw the seasonal distribution map of TROPOMI data, OMI data, and CNEMC data in Jiangsu Province in 2019 (Figure 2). According to the resolution of the different sensors, the simultaneous interpretation of TROPOMI data is 0.1° × 0.1°, and the average of the OMI data is 0.25° × 0.25° grid averaging. Due to the limited number of CNEMC sites, the CNEMC NO2 distribution only shows the concentration of some areas, which is also the biggest drawback of CNEMC monitoring, i.e., only monitoring the near-ground NO2 concentration in some locations. In order to observe the data consistency in the time dimension, the data are divided into four seasons, including spring (January, February, and March), summer (April, May, and June), autumn (July, August, and September) and winter (October, November, and December). From the TROPOMI data (a1–a4), Figure 2 shows that the three NO2 dates (TROPOMI, OMI, and CNEMC) in Jiangsu Province exhibit a similar tendency and seasonality, with higher concentrations in spring and winter, and lower concentrations in summer and autumn. Because TROPOMI has a higher spatial resolution than OMI, TROPOMI retrievals are valuable to complement the ground-based CNEMC data (available with high temporal resolution) for the description of the spatio-temporal variability of NO2, even on a city scale. Overall, the results all show that the NO2 concentration in the southern part of Jiangsu Province is higher than that in the northern part.
Figure 3 depicts the annual average distribution of TROPOMI, OMI, and CNEMC data in Jiangsu Province, China in 2019. The spatial distribution of the three types of data is similar, and all show that the NO2 concentration in the southern part of Jiangsu Province is higher than that in the northern part. Among them, the concentrations in the southern cities of Suzhou, Wuxi, and Nanjing are significantly higher than those in other cities. This is due to various factors, such as the population, economy, and industrial development of these three cities. They are the total economic volume of Jiangsu Province in 2019. The top three cities have higher polluting gas emissions than other cities due to related reasons, such as high population density and good industrial development. Comparing (a), (b), and (c), the Trop NO2 VCD retrieved from the OMI is significantly higher than that from the TROPOMI, indicating that the monitoring value of OMI is higher than that of TROPOMI. Looking at the OMI monitoring data (b1–b4), compared with the ground-truth data, the monitoring values in southern Jiangsu Province are abnormally high. The comparative analysis of the distribution of OMI and TROPOMI NO2 products further indicates that with the improvement of the load performance, the TROPOMI is better than the previous generation of OMI load at representing the spatio-temporal distribution of NO2 in the regional scope.

3.2. Validation Analysis of the TROPOMI and OMI Trop NO2 VCD

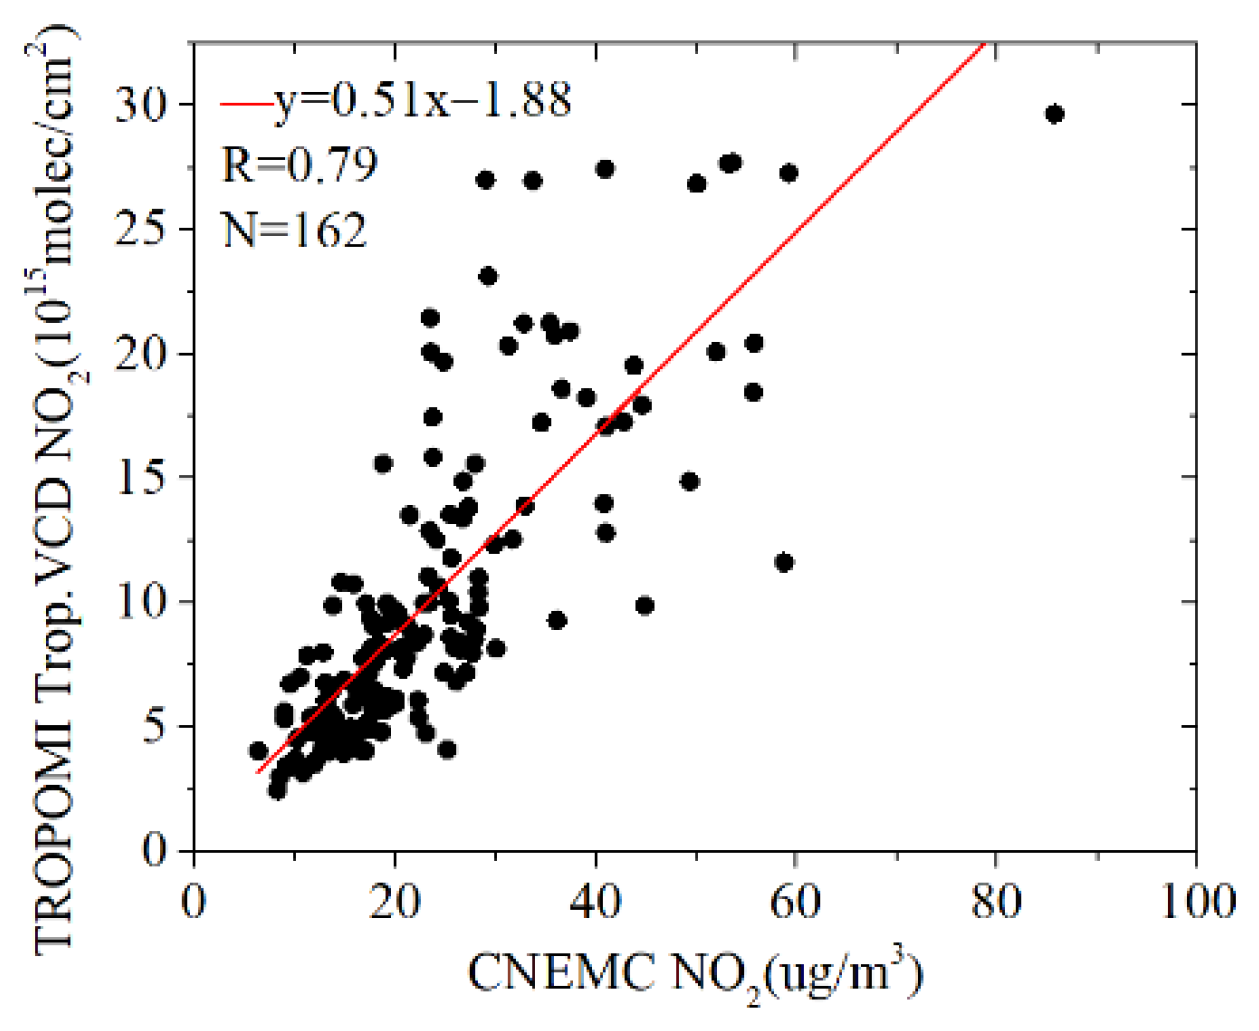
3.2.1. Background Correction for the Comparison of TROPOMI and CNEMC Sites

The NO2 mass concentration data of the 87 sites in Jiangsu Province released by the CNEMC from January to December 2019 were averaged every month, and the monthly average value of the TROPOMI Trop NO2 VCD was extracted. Linear fitting was performed in order to verify the accuracy of the TROPOMI data. Figure 4 shows a scatterplot of the monthly average TROPOMI Trop NO2 VCD and the monthly average monitoring values at various CNEMC sites in 13 prefecture-level cities in Jiangsu Province. The fitting results show that the r between the TROPOMI Trop NO2 VCD and the CNEMC NO2 in Nanjing, Changzhou, Lianyungang, Nantong, Suzhou, Taizhou, Wuxi, Suqian, Yan-cheng, and Zhenjiang are all greater than 0.9. Suqian and Zhenjiang had the strongest correlation, with an r of 0.97. In Xuzhou, the lowest r was 0.81 and the p-value was 1.27975 × 10−72 < 0.05, indicating a highly significant correlation. The agricultural economy dominates in Zhenjiang and Suqian, whereas heavy industry dominates in Xuzhou. Figure 5 shows a scatterplot of the TROPOMI Trop NO2 VCD and CNEMC sites’ daily average in Nanjing, with an r of 0.79. The Trop NO2 VCD derived from the TROPOMI is significantly correlated with the near-surface NO2 measured by the CNEMC sites, and the correlation is quite high.

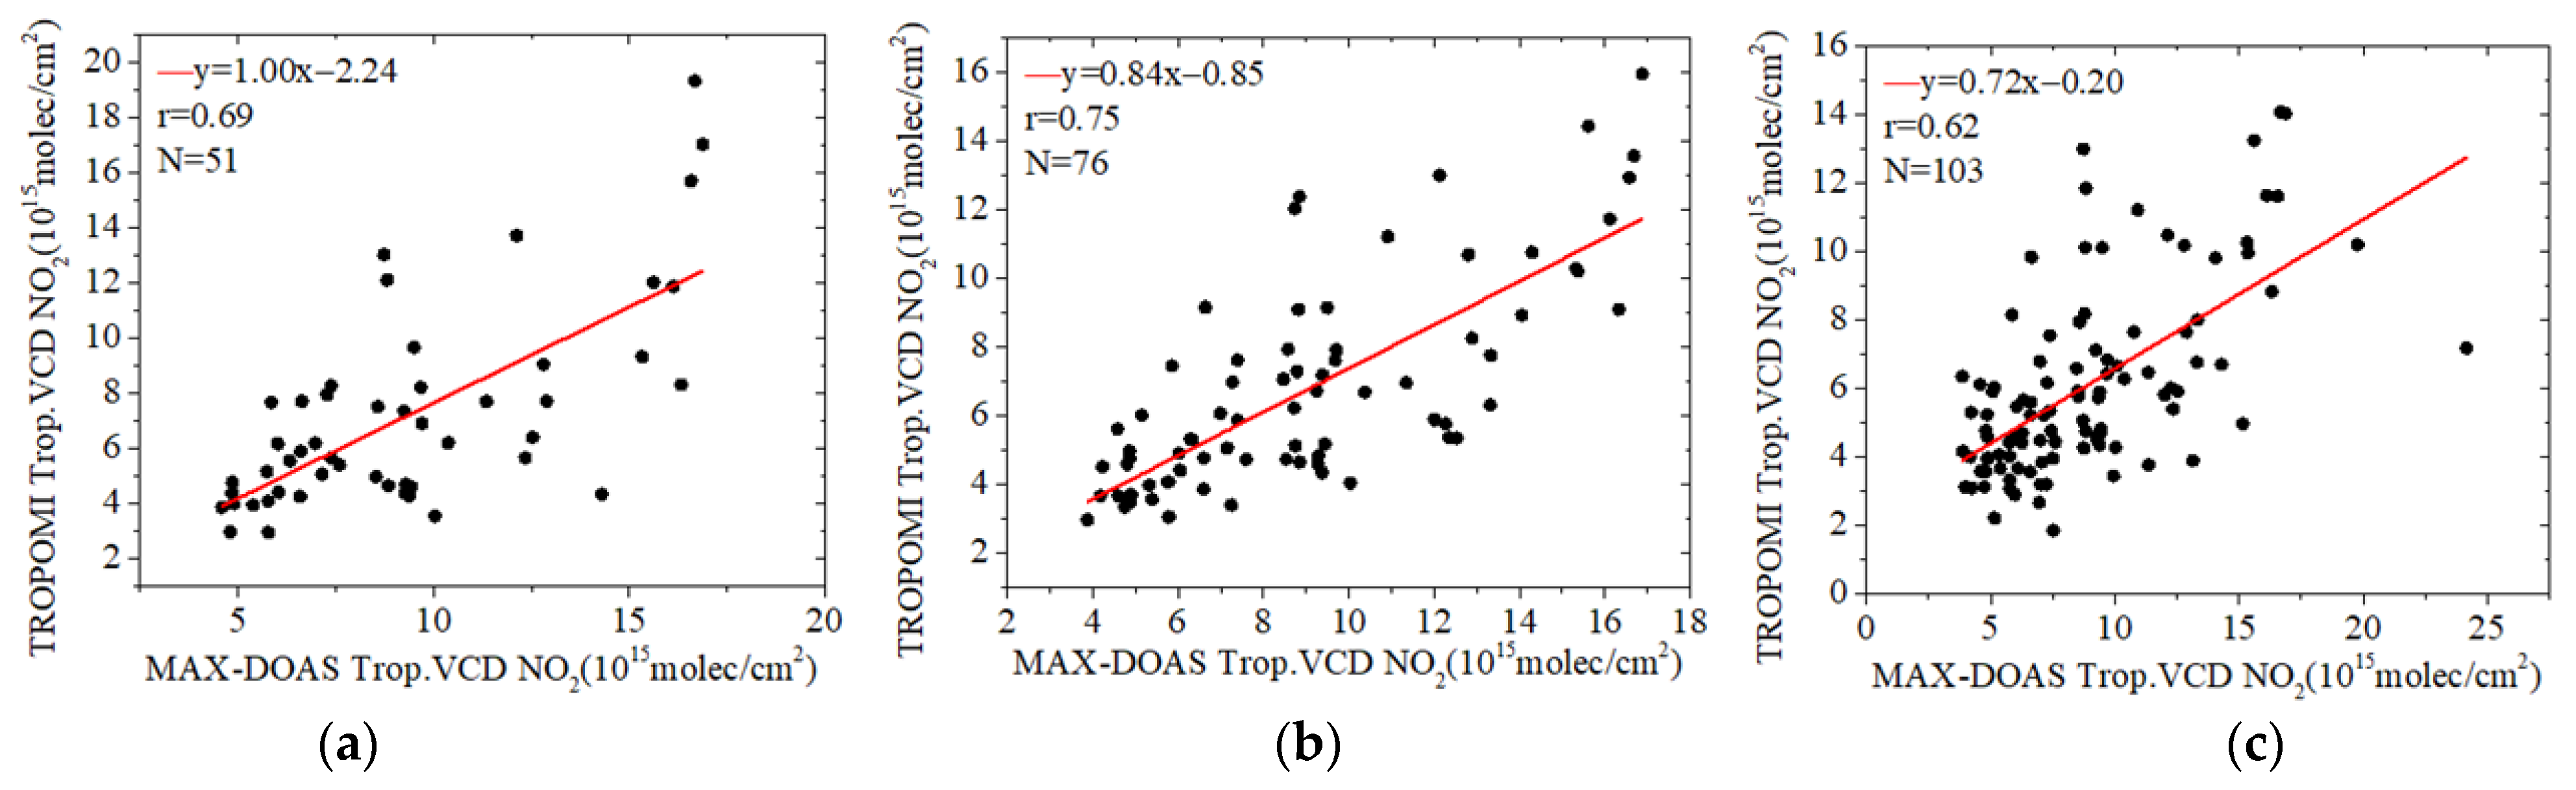
3.2.2. Comparison of the Trop VCD Retrieved from TROPOMI and MAX-DOAS

In order to compare the MAX-DOAS and TROPOMI more accurately, this paper adopted the ground-based MAX-DOAS test point (32.14° N, 119.04° E) as the center to match the TROPOMI data in the 0.05°, 0.1°, and 0.2° grids, and different matching results were obtained, as depicted in Table 1. Based on Table 1 and Figure 6, it was found that the r of the TROPOMI in the 0.05° grid is 0.69, the number of matching points is 51, the RMSE mean is 2.03 × 10¹⁵ molec/cm2, and the MAPE mean is 0.22. The r of the TROPOMI matched in the 0.1° grid is 0.75, the number of matching points is 76, the RMSE mean is 2.26 × 10¹⁵ molec/cm2, and the MAPE mean is 0.24. The r of the TROPOMI matched in the 0.2° grid is 0.62, the number of matching points is 103, the RMSE mean is 2.82 × 10¹⁵ molec/cm2, and the MAPE mean is 0.29. In terms of the MAX-DOAS and TROPOMI data, the RMSE and MAPE values of the 0.05° grid are the lowest, the r is high, and the matching result is more accurate. As a result, the matching result of the MAX-DOAS and TROPOMI data in the 0.05° grid was chosen as the final result, from March to November.
TROPOMI Trop NO2 VCD are generally underestimated compared with collocated MAX-DOAS, by about 8–46%. This is in line with previous verification results [26]. Because of their spatial differences, satellite observation results are generally lower than MAX-DOAS observation data. The ground-based MAX-DOAS instrument has a small measurement area, whereas the TROPOMI has a spatial resolution of 5 × 3.5 km2, and the TROPOMI represents the average results over a larger area. Owing to the test site’s location in the suburbs and the troposphere’s contribution over the suburbs at lower concentrations [28,33], the TROPOMI results have been consistently lower than those of the MAX-DOAS. According to the MAX-DOAS, the Trop NO2 VCD gradually decreased and then gradually increased from March to November. Furthermore, the highest monthly average value was 13.47 × 10¹⁵ molec/cm2 in March, and the lowest was 6.63 × 10¹⁵ molec/cm2 in June. The NO2 column concentration in March was twice that of June, indicating that Nanjing has less air pollution in the summer and more in the winter.

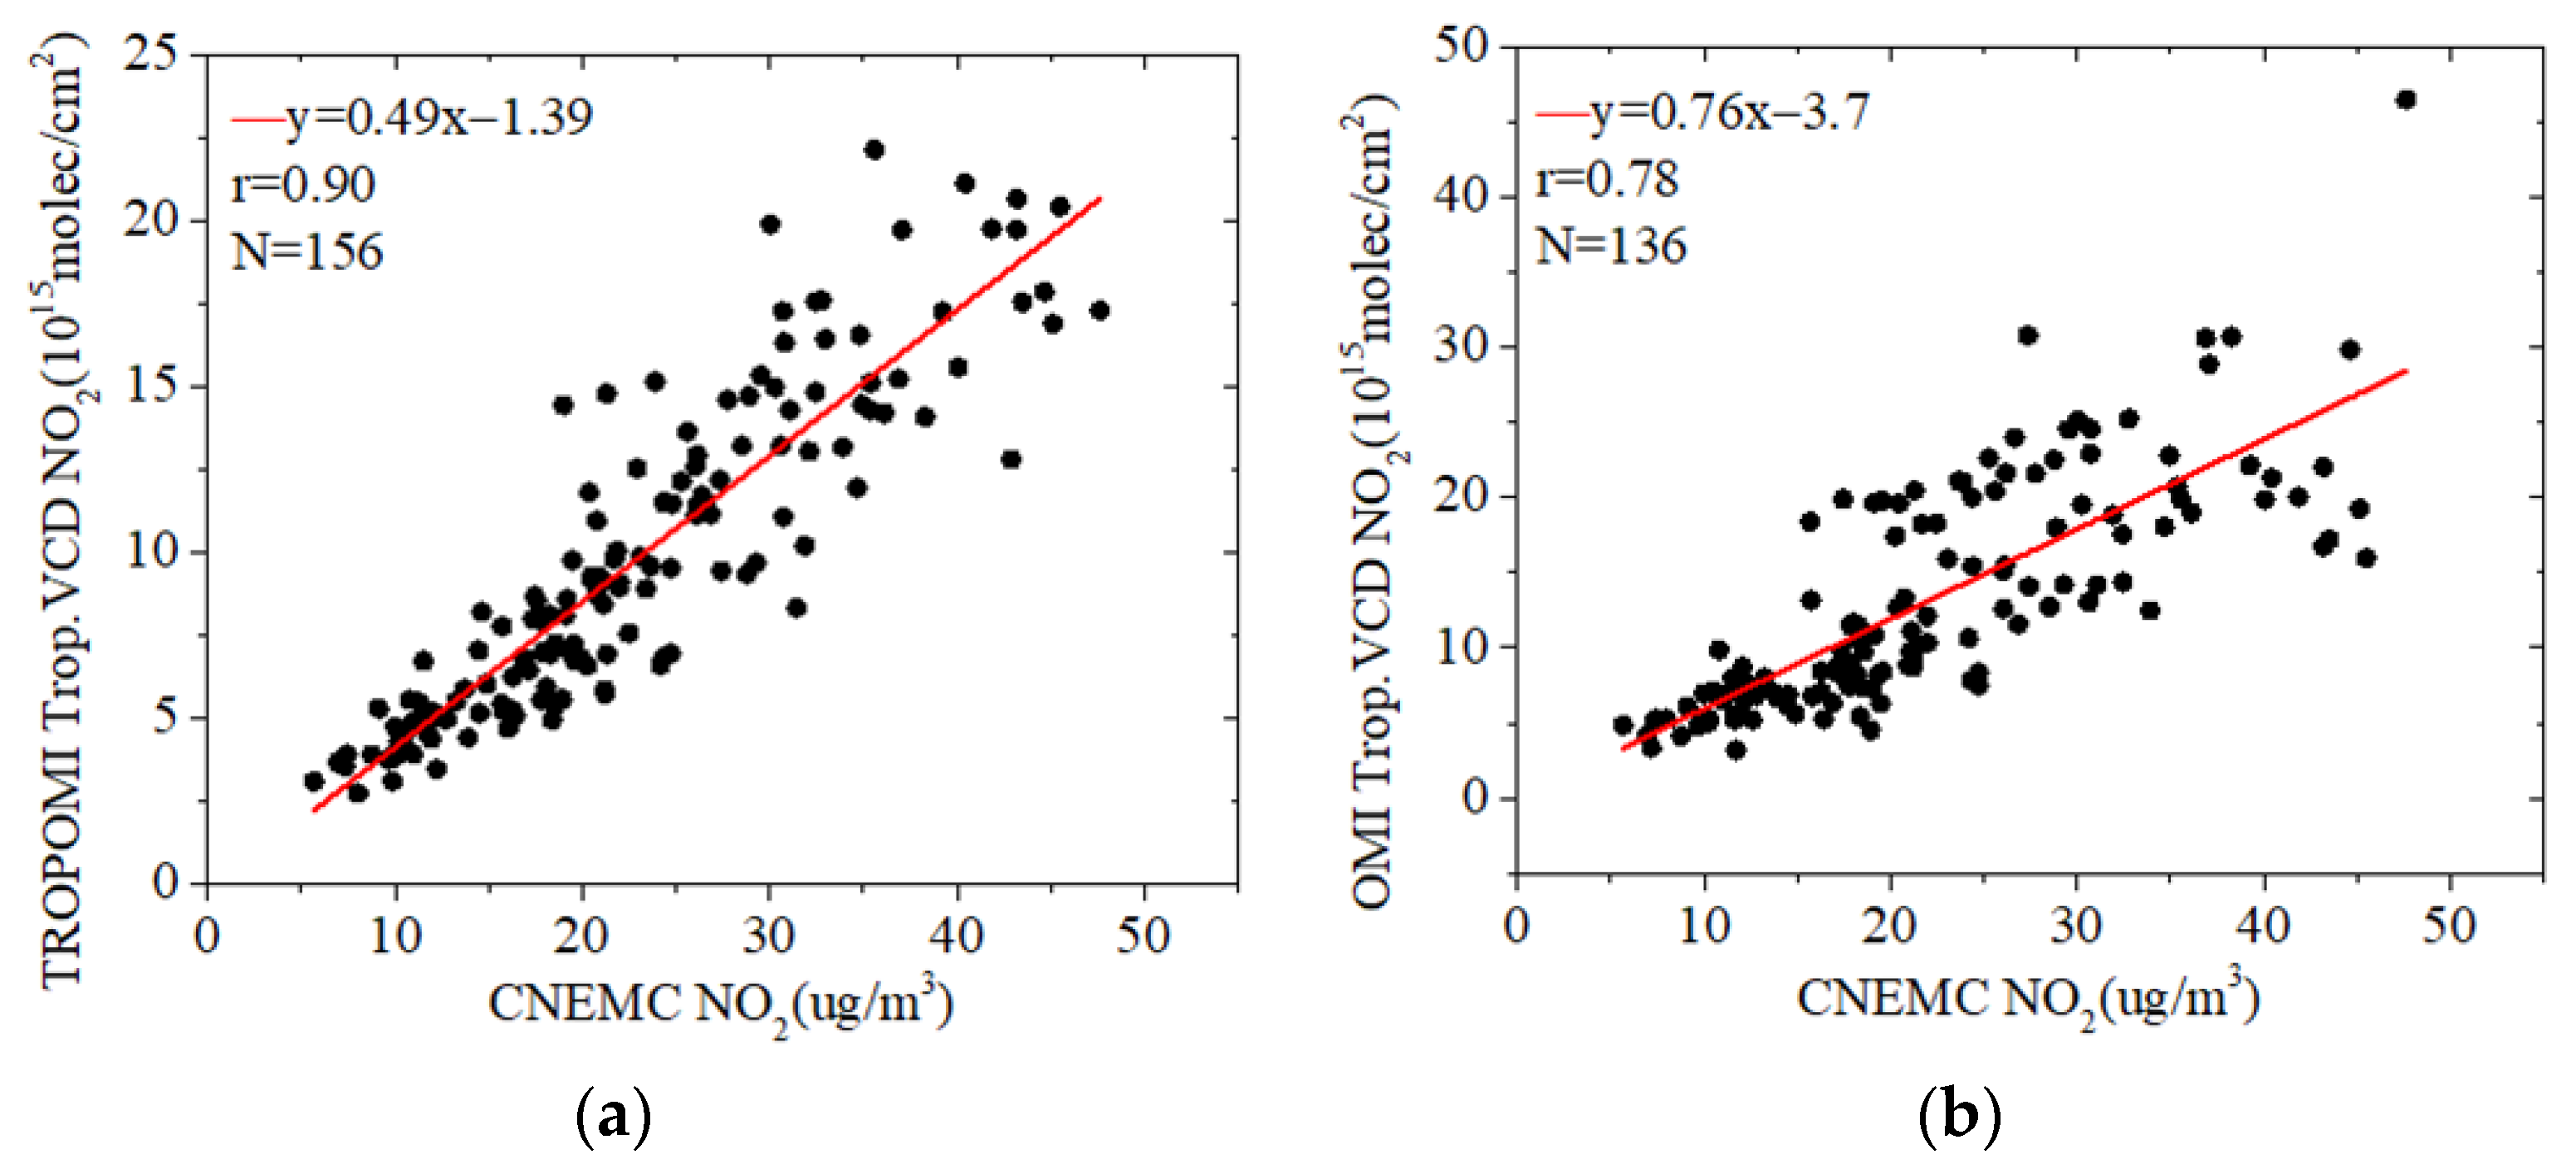
3.2.3. Comparison of the TROPOMI and OMI

Figure 7 shows that the monthly averaged Trop NO2 VCD from the TROPOMI and OMI is essentially the same as that of the NO2 concentration from CNEMC sites, with consistent seasonal periodic changes. In urban areas, the concentration value of OMI is higher than that of TROPOMI. The NO2 concentration in Jiangsu is high in spring and winter, and low in summer and autumn. Jiangsu had the highest monthly average concentrations in January, which were 38.67 ug/m3 (CNEMC), 17.35 × 10¹⁵ molec/cm2 (TROPOMI), and 20.04 × 10¹⁵ molec/cm2 (OMI). The lowest concentrations in August were 13.39 ug/m3 (CNEMC), 5.2 × 10¹⁵ molec/cm2 (TROPOMI) and 7.03 × 10¹⁵ molec/cm2 (OMI). Jiangsu’s air quality improved greatly in February compared to January and March. This could be attributed to Jiangsu’s reduced pollution emissions during the Spring Festival. The air quality has improved as a result of the ban on fireworks and firecrackers, the usage of fewer cars during the Spring Festival, and the reduction in the production of industrial and mining operations. When CNEMC, TROPOMI, and OMI measurement results are compared, it is evident that the two datasets are highly correlated, and that TROPOMI and OMI data can be used to reflect the concentration and pollution in areas that are not monitored.
Figure 8a shows the scatterplot between the monthly average values of the NO2 concentration and TROPOMI Trop NO2 VCD of 13 prefectural-level cities in Jiangsu Province. The number of matching points is 156, and the r is 0.90. Figure 8b depicts the scatterplot of monthly monitoring values of the NO2 concentration at the CNEMC sites and the monthly average OMI Trop NO2 VCD. The number of matching points and the r are 137 and 0.78, respectively. The number of matching points with the CNEMC data varies due to the different pixel sizes of the TROPOMI and OMI sensors. Because TROPOMI has a higher resolution than OMI, it has more matching results.
The r between the TROPOMI Trop NO2 VCD and CNEMC NO2 in Jiangsu Province in 2019 was 0.90, which was higher than the 0.78 between the OMI Trop NO2 VCD and CNEMC NO2. This demonstrates that the TROPOMI outperforms the OMI in terms of monitoring the tropospheric NO2 VCD. Table 2 compares the monthly average NO2 values measured by the MAX-DOAS to the OMI. The grid size is matched with 0.1°-, 0.2°-, and 0.25° grids based on the OMI resolution. Table 2 and Figure 9 show that the 0.1° grid matching r is 0.56, and the number of matching points is 12, with an RMSE of 3.03 × 10¹⁵ molec/cm2 and an MAPE of 0.29. The 0.2° grid matching r is 0.59, and the number of matching points is 34, with an RMSE of 2.43 × 10¹⁵ molec/cm2 and MAPE of 0.23. The 0.25° grid matching r is 0.58, and the number of matching points is 46, with an RMSE of 2.85 × 10¹⁵ molec/cm2 and MAPE of 0.25. When the matching results are compared, the OMI data matched in the 0.2° grid has the lowest deviation and MSE values, and the highest r, indicating a more accurate matching result. As a result, the MAX-DOAS and OMI data matching result in the 0.2° grid was chosen as the final result. For March to November, the OMI Trop NO2 VCD are generally underestimated compared with collocated MAX-DOAS, except in March, October, and November.
The number of matching points shared with the CNEMC sites and MAX-DOAS data differs due to the difference in pixel size between the TROPOMI and OMI. The TROPOMI has a higher resolution than the OMI, covers more sites, and is more consistent with national control monitoring site data in terms of matching results. According to Table 2, OMI observations are generally higher than TROPOMI observations. This is possible because the OMI grid unit partially covers the test site’s southwest, which is more affected by pollution flows from urban areas [24]. The MB between the TROPOMI and MAX-DOAS is 2.03 × 10¹⁵ molec/cm2, which is lower than that between the OMI and MAX-DOAS at 2.43 × 10¹⁵ molec/cm2. The MSE between the TROPOMI and MAX-DOAS is 1.44 × 10¹⁵ molec/cm2, which is smaller than that between the OMI and MAX-DOAS at 1.72 × 10¹⁵ molec/cm2. The r between the TROPOMI and MAX-DOAS is 0.69, which is larger than that between the OMI and MAX-DOAS at 0.59. In 2019, the r between the TROPOMI Trop NO2 VCD and the CNEMC NO2 mass concentration in Jiangsu Province was 0.90, which was greater than that between the OMI Trop NO2 VCD and the CNEMC NO2 mass concentration at 0.78. This shows that the TROPOMI outperforms the OMI in terms of monitoring tropospheric NO2 concentrations.

4. Conclusions

This paper utilized ground-measured NO2 data from various CNEMC sites in Jiangsu Province in 2019 and Nanjing ground-based MAX-DOAS measurement results for comparison, analysis, and cross-validation, in order to verify the Trop NO2 VCD of the TROPOMI and OMI. The major conclusions are summarized below:
(1)
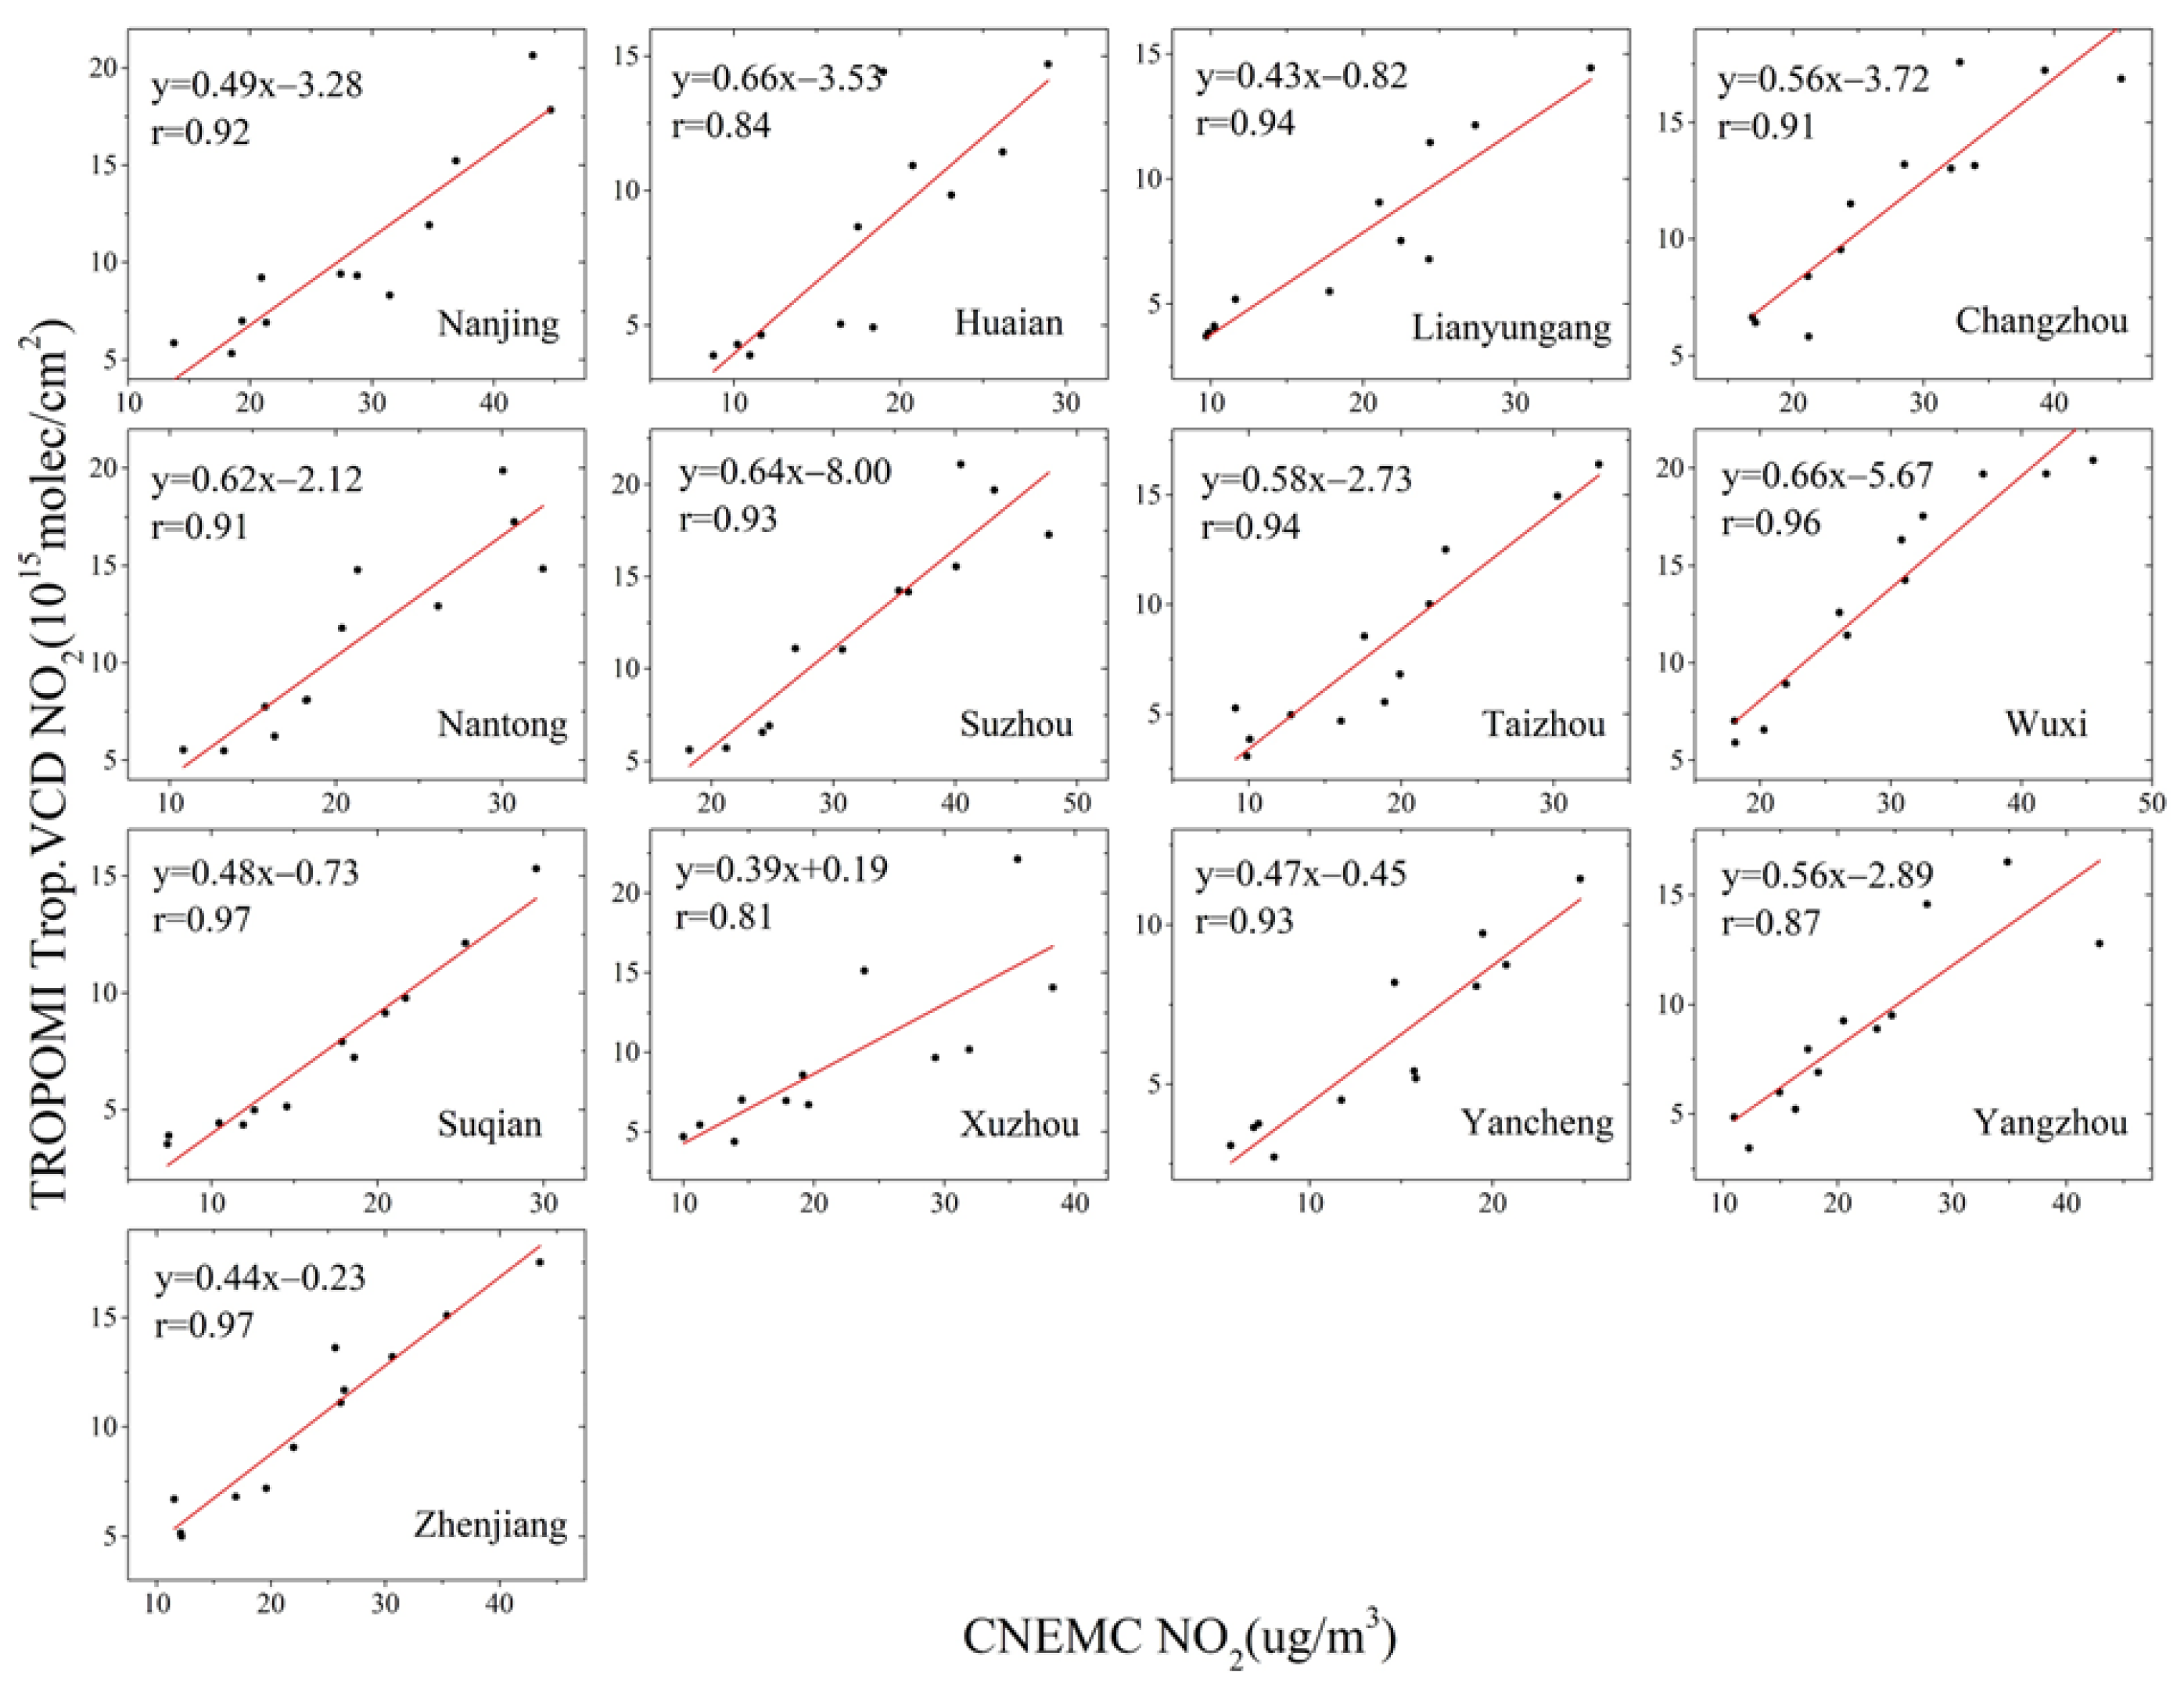
At the urban level, the mass concentration of NO2 in 13 prefecture-level cities of Jiangsu Province was highly correlated with the monthly average of the Trop NO2 VCD given by TROPOMI, with the value of r ranging from 0.81 to 0.97, which shows that TROPOMI provides an assessment of its applicability in monitoring urban pollution levels. At the provincial level, the r between TROPOMI and the CNEMC sites is 0.9. It further indicates that TROPOMI data can better reflect NO2 concentration pollution in areas without ground station monitoring.
(2)
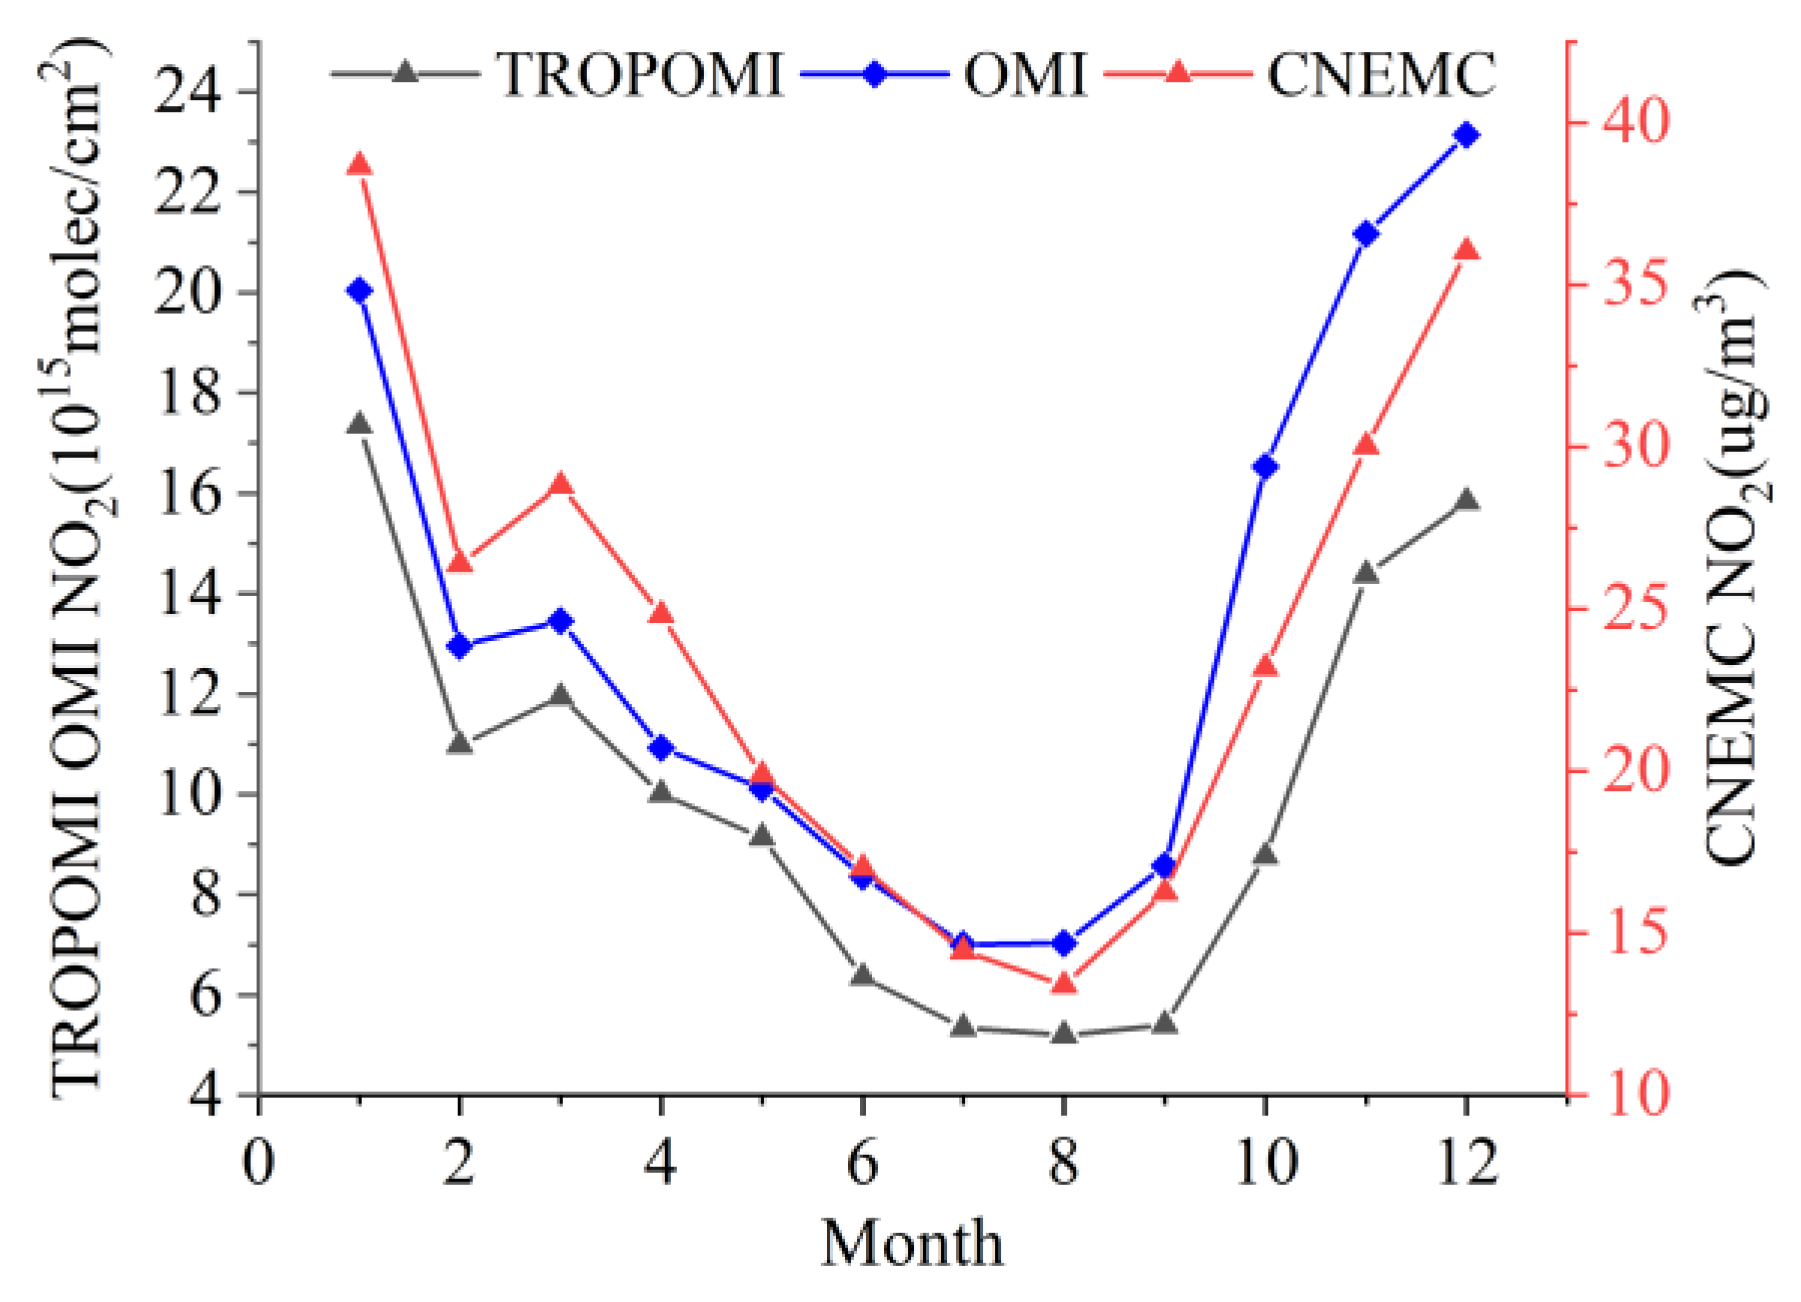
Three NO2 dates (TROPOMI, OMI and CNEMC) in Jiangsu Province exhibit a similar tendency and seasonality. The TROPOMI monthly averaged Trop NO2 VCD has been consistently lower than the ground-based MAX-DOAS observation results, whereas the OMI values are higher than the TROPOMI values. This is possibly because the OMI grid unit partially covers the southwest area of the test site, which is more affected by pollution flows from urban areas.
(3)
The RMSE between the TROPOMI monthly average Trop NO2 VCD and MAX-DOAS data is 2.03 × 10¹⁵ molec/cm2, which is lower than that between the OMI and MAX-DOAS data at 2.43 × 10¹⁵ molec/cm2. The MAPE value between the TROPOMI and MAX-DOAS data is 0.22, which is lower than that between the OMI and MAX-DOAS data 0.23. The r between the TROPOMI and MAX-DOAS data is higher than that between the OMI and MAX-DOAS data (r = 0.69 > 0.59). Moreover, the r between the TROPOMI and CNEMC data is higher than that between the OMI and CNEMC (r = 0.9 > 0.78). The comparative analysis of the accuracy of OMI and TROPOMI NO2 products further indicates that with the improvement of the load performance, the TROPOMI load is better than the previous generation of OMI load at representing the distribution of NO2 in the regional scope.

Author Contributions

Conceptualization, K.C.; methodology, S.L.; validation, Y.X.; formal analysis, Y.X. and J.L.; data curation, A.L.; writing—original draft preparation, K.C.; writing—review and editing, Y.W. and X.H.; visualization, Y.X.; funding acquisition, S.L.; All authors have read and agreed to the published version of the manuscript.

Funding

This research was funded by the National Key Research and Development Program (2019YFC0214603), the National Natural Science Foundation of China (Grant Nos. 42071409 and 62176087) and Key Research and Promotion Projects of Henan Province (Grant No. 212102210079).

Informed Consent Statement

Informed consent was obtained from all subjects involved in the study.

Conflicts of Interest

The authors declare no conflict of interest.

References

  1. Zheng, X.X.; Li, L.J.; Zhao, W.J.; Zhao, W.H. Spatial and temporal characteristics of atmospheric NO2 in the Beijing-Tianjin-Hebei region. Ecol. Environ. Sci. 2014, 23, 1938–1945. [Google Scholar]
  2. Lu, X.; Zhang, S.; Xing, J.; Wang, Y.; Chen, W.; Ding, D.; Wu, Y.; Wang, S.; Duan, L.; Hao, J. Progress of Air Pollution Control in China and Its Challenges and Opportunities in the Ecological Civilization Era. Engineering 2020, 6, 1423–1431. [Google Scholar] [CrossRef]
  3. Gu, J.; Chen, L.; Yu, C.; Li, S.; Tao, J.; Fan, M.; Xiong, X.; Wang, Z.; Shang, H.; Su, L. Ground-level NO2 concentrations over China inferred from the satellite OMI and CMAQ model simulations. Remote Sens. 2017, 9, 519. [Google Scholar] [CrossRef] [Green Version]
  4. Turner, M.C.; Krewski, D.; Diver, W.R.; Pope, C.A., III; Burnett, R.T.; Jerrett, M.; Marshall, J.D.; Gapstur, S.M. Ambient Air Pollution and Cancer Mortality in the Cancer Prevention Study II. Environ. Health Perspect. 2017, 125, 087013. [Google Scholar] [CrossRef] [Green Version]
  5. Wang, Y.; Ying, Q.; Hu, J.; Zhang, H. Spatial and temporal variations of six criteria air pollutants in 31 provincial capital cities in China during 2013–2014. Environ. Int. 2014, 73, 413–422. [Google Scholar] [CrossRef]
  6. Zhao, S.; Yu, Y.; Yin, D.; He, J.; Liu, N.; Qu, J.; Xiao, J. Annual and diurnal variations of gaseous and particulate pollutants in 31 provincial capital cities based on in situ air quality monitoring data from China National Environmental Monitoring Center. Environ. Int. 2016, 86, 92–106. [Google Scholar] [CrossRef]
  7. Cai, K.; Li, S.; Zheng, F.; Yu, C.; Zhang, X.; Liu, Y.; Li, Y. Spatio-temporal variations in NO2 and PM2. 5 over the central plains economic region of China during 2005–2015 based on satellite observations. Aerosol Air Qual. Res. 2018, 18, 1221–1235. [Google Scholar] [CrossRef]
  8. Zhang, X.; Zhang, P.; Fang, Z.; Qiu, H.; Li, X.; Zhang, Y. The progress in trace gas remote sensing study based on the satellite monitoring. Meteorol. Mon. 2007, 7, 3–14. [Google Scholar]
  9. Zhang, X.; Wang, F.; Wang, W.; Huang, F.; Chen, B.; Gao, L.; Wang, S.; Yan, H.; Ye, H.; Si, F.; et al. The development and application of satellite remote sensing for atmospheric compositions in China. Atmos. Res. 2020, 245, 105056. [Google Scholar] [CrossRef]
  10. Cai, K.; Zhang, Q.; Li, S.; Li, Y.; Ge, W. Spatial-Temporal Variations in NO2 and PM2.5 over the Chengdu-Chongqing Economic Zone in China during 2005–2015 Based on Satellite Remote Sensing. Sensors 2018, 18, 3950. [Google Scholar] [CrossRef] [Green Version]
  11. Velders, G.J.; Granier, C.; Portmann, R.W.; Pfeilsticker, K.; Wenig, M.; Wagner, T.; Platt, U.; Richter, A.; Burrows, J.P. Global tropospheric NO2 column distributions: Comparing three-dimensional model calculations with GOME measurements. J. Geophys. Res. Atmos. 2001, 106, 12643–12660. [Google Scholar] [CrossRef]
  12. Richter, A.; Burrows, J. A multi wavelength approach for the retrieval of tropospheric NO2 from GOME measurements. In Proceedings of the ERS ENVISAT Symposium, Gothenburg, Sweden, 16–20 October 2000. [Google Scholar]
  13. Richter, A.; Burrows, J. Tropospheric NO2 from GOME measurements. Adv. Space Res. 2002, 29, 1673–1683. [Google Scholar] [CrossRef]
  14. Meyer, J.; Schlesier, A.; Rozanov, A.; Bovensmann, H.; Burrows, J. Towards O3 and NO2 vertical profile retrieval from SCIAMACHY solar occultation measurements: First results. Adv. Space Res. 2004, 34, 744–748. [Google Scholar] [CrossRef]
  15. Veefkind, J.P.; Aben, I.; McMullan, K.; Förster, H.; De Vries, J.; Otter, G.; Claas, J.; Eskes, H.J.; De Haan, J.F.; Kleipool, Q.; et al. TROPOMI on the ESA Sentinel-5 Precursor: A GMES mission for global observations of the atmospheric composition for climate, air quality, and ozone layer applications. Remote Sens. Environ. 2012, 120, 70–83. [Google Scholar] [CrossRef]
  16. Levelt, P.F.; Hilsenrath, E.; Leppelmeier, G.W.; van den Oord, G.H.; Bhartia, P.K.; Tamminen, J.; de Haan, J.F.; Veefkind, J.P. Science objectives of the ozone monitoring instrument. IEEE Trans. Geosci. Remote Sens. 2006, 44, 1199–1208. [Google Scholar] [CrossRef]
  17. Wang, C.; Wang, T.; Wang, P.; Wang, W. Assessment of the Performance of TROPOMI NO2 and SO2 Data Products in the North China Plain: Comparison, Correction, and Application. Remote Sens. 2022, 14, 214. [Google Scholar] [CrossRef]
  18. Lin, W.-L.; Xu, X.-B. The demands on atmosphere background observations in China to meet the validations of NO2 satellite remote sensing data. Meteorol. Mon. 2011, 37, 571–575. [Google Scholar]
  19. Verhoelst, T.; Compernolle, S.; Pinardi, G.; Lambert, J.C.; Eskes, H.J.; Eichmann, K.U.; Fjæraa, A.M.; Granville, J.; Niemeijer, S.; Cede, A.; et al. Ground-based validation of the Copernicus Sentinel-5P TROPOMI NO2 measurements with the NDACC ZSL-DOAS, MAX-DOAS, and Pandonia global networks. Atmos. Meas. Tech. 2021, 14, 481–510. [Google Scholar] [CrossRef]
  20. Wang, C.; Wang, T.; Wang, P.; Rakitin, V. Comparison and Validation of TROPOMI and OMI NO2 Observations over China. Atmosphere 2020, 11, 636. [Google Scholar] [CrossRef]
  21. Xu, J.; Xie, P.-H.; Si, F.-Q.; Li, A.; Dou, K.; Liu, Y.; Qin, M.; Wang, M.-H.; Zhang, Y.; Shi, P.; et al. Comparison of OMI and Ground-Based MAX-DOAS Measurements of Tropospheric Nitrogen Dioxide in Beijing During the Olympic Games. J. Atmos. Environ. Opt. 2009, 4, 347–355. [Google Scholar]
  22. Mou, F.; Li, A.; Xie, P.; Wang, Y.; Xu, J.; Zhang, J.; Chen, H.; Wu, F. Measurement and retrieval of tropospheric NO2 and aerosol optical depth based on MAX-DOAS. J. Atmos. Environ. Opt. 2015, 10, 231–238. [Google Scholar]
  23. Kramer, L.J.; Leigh, R.J.; Remedios, J.J.; Monks, P.S. Comparison of OMI and ground-based in situ and MAX-DOAS measurements of tropospheric nitrogen dioxide in an urban area. J. Geophys. Res. Atmos. 2008, 113, D16. [Google Scholar] [CrossRef]
  24. Chan, K.L.; Wang, Z.; Ding, A.; Heue, K.P.; Shen, Y.; Wang, J.; Zhang, F.; Shi, Y.; Hao, N.; Wenig, M. MAX-DOAS measurements of tropospheric NO2 and HCHO in Nanjing and a comparison to ozone monitoring instrument observations. Atmos. Chem. Phys. 2019, 19, 10051–10071. [Google Scholar] [CrossRef] [Green Version]
  25. Guo, F.; Ju, X.; Bao, M.; Lu, G.; Liu, Z.; Li, Y.; Mu, Y. Relationship between lightning activity and tropospheric nitrogen dioxide and the estimation of lightning-produced nitrogen oxides over China. Adv. Atmos. Sci. 2017, 34, 235–245. [Google Scholar] [CrossRef]
  26. Miyazaki, K.; Eskes, H.J.; Sudo, K.; Zhang, C. Global lightning NOx production estimated by an assimilation of multiple satellite data sets. Atmos. Chem. Phys. 2014, 14, 3277–3305. [Google Scholar] [CrossRef] [Green Version]
  27. Zhang, Y.; Yuan, J.; Wang, Y.; Yu, S. remote sensing monitoring of tropospheric NO2 density in Beijing-Tianjin-Hebei region based on OMI data. Resour. Environ. Yangtze River Basin 2018, 27, 443–452. [Google Scholar]
  28. Liu, M.; Lin, J.; Kong, H.; Boersma, K.F.; Eskes, H.; Kanaya, Y.; He, Q.; Tian, X.; Qin, K.; Xie, P.; et al. A new TROPOMI product for tropospheric NO2 columns over East Asia with explicit aerosol corrections. Atmos. Meas. Tech. 2020, 13, 4247–4259. [Google Scholar] [CrossRef]
  29. Griffin, D.; Zhao, X.; McLinden, C.A.; Boersma, F.; Bourassa, A.; Dammers, E.; Degenstein, D.; Eskes, H.; Fehr, L.; Fioletov, V.; et al. High-Resolution Mapping of Nitrogen Dioxide With TROPOMI: First Results and Validation Over the Canadian Oil Sands. Geophys. Res. Lett. 2019, 46, 1049–1060. [Google Scholar] [CrossRef] [Green Version]
  30. Ialongo, I.; Virta, H.; Eskes, H.; Hovila, J.; Douros, J. Comparison of TROPOMI/Sentinel-5 Precursor NO2 observations with ground-based measurements in Helsinki. Atmos. Meas. Tech. 2020, 13, 205–218. [Google Scholar] [CrossRef] [Green Version]
  31. Zhao, X.; Griffin, D.; Fioletov, V.; McLinden, C.; Cede, A.; Tiefengraber, M.; Müller, M.; Bognar, K.; Strong, K.; Boersma, F.; et al. Assessment of the quality of TROPOMI high-spatial-resolution NO2 data products in the Greater Toronto Area. Atmos. Meas. Tech. 2020, 13, 2131–2159. [Google Scholar] [CrossRef]
  32. Judd, L.M.; Al-Saadi, J.A.; Szykman, J.J.; Valin, L.C.; Janz, S.J.; Kowalewski, M.G.; Eskes, H.J.; Veefkind, J.P.; Cede, A.; Mueller, M.; et al. Evaluating Sentinel-5P TROPOMI tropospheric NO2 column densities with airborne and Pandora spectrometers near New York City and Long Island Sound. Atmos. Meas. Tech. 2020, 13, 6113–6140. [Google Scholar] [CrossRef] [PubMed]
  33. Chan, K.L.; Wiegner, M.; van Geffen, J.; De Smedt, I.; Alberti, C.; Cheng, Z.; Ye, S.; Wenig, M. MAX-DOAS measurements of tropospheric NO2 and HCHO in Munich and the comparison to OMI and TROPOMI satellite observations. Atmos. Meas. Tech. 2020, 13, 4499–4520. [Google Scholar] [CrossRef]
  34. Si, Y.; Chen, L.; Xiong, X.; Shi, S.; Husi, L.; Cai, K. Evaluation of the MISR fine resolution aerosol product using MODIS, MISR, and ground observations over China. Atmos. Environ. 2020, 223, 117229. [Google Scholar] [CrossRef]
  35. Chi, Y.; Fan, M.; Zhao, C.; Yang, Y.; Fan, H.; Yang, X.; Yang, J.; Tao, J. Machine learning-based estimation of ground-level NO2 concentrations over China. Sci. Total Environ. 2022, 807, 150721. [Google Scholar] [CrossRef] [PubMed]
  36. Hönninger, G.; Von Friedeburg, C.; Platt, U. Multi axis differential optical absorption spectroscopy (MAX-DOAS). Atmos. Chem. Phys. 2004, 4, 231–254. [Google Scholar] [CrossRef] [Green Version]
  37. Wang, Y.; Beirle, S.; Lampel, J.; Koukouli, M.; De Smedt, I.; Theys, N.; Li, A.; Wu, D.; Xie, P.; Liu, C.; et al. Validation of OMI, GOME-2A and GOME-2B tropospheric NO2, SO2 and HCHO products using MAX-DOAS observations from 2011 to 2014 in Wuxi, China: Investigation of the effects of prior profiles and aerosols on the satellite products. Atmos. Chem. Phys. 2017, 17, 5007–5033. [Google Scholar] [CrossRef] [Green Version]
  38. Shi, R.; Mo, F.; Li, S.; Wei, M.; Luo, J. MAX-DOAS Observation and OMI Comparison of NO2 Column Concentration in Troposphere in Huaibei. J. Huaibei Norm. Univ. 2017, 38, 2. [Google Scholar]
  39. Guo, Y.; Qi, H.; Li, S.; Mou, F. MAX-DOAS Observation of NO2 Vertical Column Density in Huaibei Area. J. Atmos. Environ. Opt. 2021, 16, 107–116. [Google Scholar]
  40. Dobber, M.R.; Dirksen, R.J.; Levelt, P.F.; van den Oord, G.H.; Voors, R.H.; Kleipool, Q.; Jaross, G.; Kowalewski, M.; Hilsenrath, E.; Leppelmeier, G.W.; et al. Ozone monitoring instrument calibration. IEEE Trans. Geosci. Remote Sens. 2006, 44, 1209–1238. [Google Scholar] [CrossRef]
  41. Boersma, K.F.; Eskes, H.J.; Veefkind, J.P.; Brinksma, E.J.; Van Der A, R.J.; Sneep, M.V.; Van Den Oord, G.H.J.; Levelt, P.F.; Stammes, P.; Gleason, J.F.; et al. Near-real-time retrieval of tropospheric NO2 from OMI. Atmos. Chem. Phys. 2007, 7, 2103–2118. [Google Scholar] [CrossRef] [Green Version]
  42. Qin, K.; Rao, L.; Xu, J.; Bai, Y.; Zou, J.; Hao, N.; Li, S.; Yu, C. Estimating Ground Level NO2 Concentrations over Central-Eastern China Using a Satellite-Based Geographically and Temporally Weighted Regression Model. Remote Sens. 2017, 9, 950. [Google Scholar] [CrossRef] [Green Version]
  43. Hu, H.; Landgraf, J.; Detmers, R.; Borsdorff, T.; Aan de Brugh, J.; Aben, I.; Butz, A.; Hasekamp, O. Toward global mapping of methane with TROPOMI: First results and inter-satellite comparison to GOSAT. Geophys. Res. Lett. 2018, 45, 3682–3689. [Google Scholar] [CrossRef]
  44. Bilal, M.; Mhawish, A.; Nichol, J.E.; Qiu, Z.; Nazeer, M.; Ali, M.A.; de Leeuw, G.; Levy, R.C.; Wang, Y.; Chen, Y.; et al. Air pollution scenario over Pakistan: Characterization and ranking of extremely polluted cities using long-term concentrations of aerosols and trace gases. Remote Sens. Environ. 2021, 264, 112617. [Google Scholar] [CrossRef]
Figure 1. Distribution of the 87 CNEMC sites and MAX-DOAS in Jiangsu Province.
Atmosphere 13 00886 g001
Figure 2. Seasonal averaged NO2 in (1) spring, (2) summer, (3) autumn and (4) winter over Jiangsu from the (a) TROPOMI, (b) OMI and (c) CNEMC.
Atmosphere 13 00886 g002
Figure 3. Annual averaged NO2 in Jiangsu from (a) TROPOMI, (b) OMI and (c) CNEMC.
Atmosphere 13 00886 g003
Figure 4. Scatterplot of the monthly averaged NO2 from CNEMC and TROPOMI NO2 in the 13 prefecture-level cities in Jiangsu Province.
Atmosphere 13 00886 g004
Figure 5. Scatterplot of the daily averaged NO2 mass concentration at CNEMC sites in Nanjing and the TROPOMI Trop NO2 VCD.
Atmosphere 13 00886 g005
Figure 6. Comparison of the daily averaged MAX-DOAS and TROPOMI in the different matching grids in 2019. (a) 0.05° grid, (b) 0.1° grid, and (c) 0.2° grid.
Atmosphere 13 00886 g006
Figure 7. Comparison of the monthly averaged NO2 mass concentration at CNEMC compared with the TROPOMI and OMI Trop NO2 VCD in 2019.
Atmosphere 13 00886 g007
Figure 8. Scatterplot of the monthly averaged NO2 concentrations from CNEMC, TROPOMI and OMI NO2, respectively. (a) CNEMC and TROPOMI, (b) CNEMC and OMI.
Atmosphere 13 00886 g008
Figure 9. Comparison of the daily averaged MAX-DOAS and OMI in the different matching grids in 2019. (a) 0.1° grid, (b) 0.2° grid, and (c) 0.25° grid.
Atmosphere 13 00886 g009
Table 1. Comparison of the monthly averaged NO2 measured by MAX-DOAS to TROPOMI (unit: 1015 molec/cm2).
Precision 0.05° × 0.05° Grid 0.1° × 0.1° Grid 0.2° × 0.2° Grid
MonthMAX-DOASTROPOMIRMSEMAPEMAX-DOASTROPOMIRMSEMAPEMAX-DOASTROPOMIRMSEMAPE
313.4712.451.020.0813.4710.662.810.2113.4711.012.460.18
413.1411.022.120.1612.939.483.450.2713.959.124.830.35
57.957.510.440.067.237.960.730.17.238.180.950.13
67.085.561.520.216.755.171.580.236.875.291.580.23
78.394.513.880.468.195.522.670.338.524.943.580.42
88.325.053.270.397.945.092.850.367.014.752.260.32
96.634.831.80.276.144.601.540.257.574.203.370.45
1010.678.342.330.2210.327.582.740.2710.686.833.850.36
1110.949.031.910.1710.948.942.00.1810.948.432.510.23
Mean 2.030.22 2.260.24 2.820.29
Table 2. Comparison of the monthly averaged NO2 measured by MAX-DOAS to the OMI (unit: 1015 molec/cm2).
Precision0.1° × 0.1° Grid 0.2° × 0.2° Grid0.25° × 0.25° Grid
MonthMAX-DOASOMIRMSEMAPEMAX-DOASOMIRMSEMAPEMAX-DOASOMIRMSEMAPE
3 8.7412.944.20.4813.2520.497.240.55
415.3712.632.740.1813.7610.772.990.2214.1311.322.810.2
59.057.311.740.199.056.872.180.249.056.612.440.27
64.497.633.140.77.097.510.420.067.097.340.250.04
714.38.375.930.417.836.980.850.118.007.090.910.11
811.358.392.960.267.496.041.450.197.556.680.870.12
910.939.940.990.098.308.070.230.038.468.480.020.0
1014.9611.193.770.2513.0613.590.530.0411.6514.022.370.2
11 12.8921.929.030.711.0919.848.750.79
Mean 3.030.29 2.430.23 2.850.25
Publisher’s Note: MDPI stays neutral with regard to jurisdictional claims in published maps and institutional affiliations.

