Abstract
Crop yield stability and soil mineral nitrogen (Nmin) have rarely been evaluated from a long-term perspective in the extremely arid cropland regions of China. Therefore, a nationwide experiment aimed to optimize fertilizer application and increase productivity and nitrogen use efficiency in gray desert soils was initiated in 1990. Eight combinations of chemical fertilizers (CK, N, NK, NP, and NPK), straw return (NPKS), and manure amendments (NPKM and NPKM+) were tested for 24 years on spring wheat, winter wheat, and maize. The results displayed that the yield of three crops from balanced fertilizer treatments (NPK, NPKS, NPKM, and NPKM+) did not differ significantly after 24 years; however, reliable yield stability due to lower coefficient of variation (CV) and higher nitrogen harvest index (NHI) were recorded for manure amendment treatments. Compared to NPKM, NHI was lower for the NPKM+ treatment, but crop yield and stability did not improve, suggesting that the appropriate choice for manure amendment is important for guaranteeing food security in extremely arid regions. Balanced fertilizer treatments resulted in lower Nmin residual in the 300 cm soil profile, compared to unbalanced fertilizer treatments. The NPKS treatment gave the lowest value. In the 0–100 cm soil profile, Nmin was higher in NPKM than in the NPK treatment, suggesting that straw or manure amendment can effectively maintain Nmin in the topsoil undercurrent cropland management in arid areas. The NPKM treatment had the highest crop nitrogen recovery rate and the lowest nitrogen losses, further illustrating that manure amendment has higher N retention potential. Overall, although Nmin residues are relatively high in these regions, balanced fertilizer treatments, especially NPKM and NPKS, are the optimum strategies in extremely arid regions.
1. Introduction
Ensuring high crop yields while maintaining yield stability and reducing environmental risks have always been challenging issues in modern agriculture [1,2]. However, due to the intensification of global climate change [3,4,5], extreme meteorological conditions frequently occur, and under such conditions, the stability of food has increasingly become a hot issue of concern. For example, severe drought can cause plant water deficit, thereby affecting nitrogen (N) transport and metabolism, ultimately affecting crop yield, while excess rainfall may limit soil N retention and lead to mineral nutrients loss [2,6,7]; in this case, the crop yield is inevitably affected. At the same time, due to the continuous improvement of cropland management technology and the improvement of crop varieties, whether the traditional fertilization method can meet the current technical needs and ensure the continued stability of crop yield is also worth further discussion [8]. Furthermore, the developments in energy, transportation, and livestock and poultry farming have all significantly increased environmental N content [9,10]; for example, Liu et al. (2014) found that nitrogen deposition in the North China Plain has markedly increased over the past 20 years, with dry and wet N deposition reaching up to 80 kg N ha−1 yr−1 in Northwest China [11], and even 30 kg ha−1 yr−1, respectively, in extremely arid oasis areas [12,13], which inevitably affects the N input/output balance of the cropland ecosystem.
Excessive N use is well known to cause severe environmental problems, such as groundwater pollution and eutrophication of streams, rivers (nitrate leaching), and terrestrial ecosystems (NH3 volatilization) [14] and global-warming-related (NO and N2O) gas emissions [7,15,16]. Moreover, soil acidification [17,18,19] and depletion of soil structure [20,21] have also been reported after the improper application of inorganic fertilizers in the absence of organic manure inputs. Therefore, it is very important to evaluate yield stability, migration, and distribution of mineral nitrogen (Nmin) in different croplands from a long-term perspective under typical environmental conditions.
Over the last few decades, arid and extremely arid regions have become increasingly important for grain production in China [21,22], leading to a continuous overuse of chemical fertilization to achieve high crop yields, which in turn has resulted in detrimental effects on field crop production, soil quality, and nitrogen cycle [23]. For instance, Lv et al. (2016) reported that the use of chemical fertilizers (urea, phosphorus pentoxide, and potassium superoxide) has increased six to eight times from 1980 to 2014, and the environmental nitrogen from atmospheric dry and wet deposition and irrigation water can yield 33 kg N ha−1 and 13 kg N ha−1, respectively, due to the rapid development of agriculture and extensive use of irrigation water in extremely arid oasis cropland regions [23]. Concomitantly, drip irrigation and mulching have become prevalent since 2005 due to reduced water evaporation and improved N utilization efficiency, which has led to a significant improvement in water use efficiency of cropland in arid regions. In this case, the subsequent effects on crop yield, yield stability, N uptake, and migration and distribution of Nmin in the soil profile are not clearly understood. To date, only a few continuous long-term studies have been conducted on the oasis gray desert soil of Western China [24,25], and fewer studies have focused on the impact of chemical fertilizer, straw, and manure application on grain yield, yield stability, and Nmin distribution in the arid zone.
The objectives of this study were (1) to determine the impact of different fertilization treatments on maize–winter wheat–spring wheat production, biomass, and nutrient recovery efficiency based on long-term experiments in an oasis cropping system; (2) to study the concentration and distribution of NO3-N and NH4-N in the 300 cm soil profile of different treatments after 24 years of experimentation in the extremely arid oasis cropland areas; (3) to trace the migration dynamics of 15N-labeled urea in the 100 cm soil profile in two different crop seasons; and (4) to determine the urea-N recovery, soil residual, and other losses of different treatments for spring wheat and maize cropping seasons. Additionally, the long-term experiment reported herein began in 1990 and is one of the longest-running annual cropping system experiments in the arid regions of China. This research is based on supporting data gathered from 1990 to 2013, which represent the early and mid-term status of croplands in the extremely arid region of Northwestern China. Therefore, the research on soil mineral nitrogen’s effect on crop yield stability under fertilization management is typical and representative. Due to the long sequence, multiple parameters, a huge amount of data, and heavy workload of data collation, the experimental data collected from 2014 to 2021 are being analyzed, and follow-up research will progressively realize the complete time-series data for the research. All in all, this study systematically explored the effects of typical fertilization treatments on crop yield, crop yield stability, and nitrogen migration and distribution based on long time scales in extremely arid areas, which will provide a scientific basis for the future food security and efficient nitrogen use of cropland in arid or extremely arid areas.
2. Materials and Methods
2.1. Study Site
This study was conducted at Anningqu, a long-term experimental site located near Urumqi, capital of Xinjiang, Northwest China (43°56′ N, 87°28′ E). The site is a typical oasis farmland with a maize–winter wheat–spring wheat rotation system. The mean annual precipitation is 310 mm, 70% of which falls in winter and summer. Evaporation is approximately 2570 mm, and mean annual temperature is 7.7 °C (Figure 1). Sunlight amounts to an average of 2594 h per year. The annual frost-free period is approximately 156 d long [7]. According to the Chinese Soil Taxonomy Classification, the soil is gray desert soil, with topsoil layer (27 cm) clay, silt, and sand fractions of 30.3%, 52.5%, and 17.2%, respectively [24].
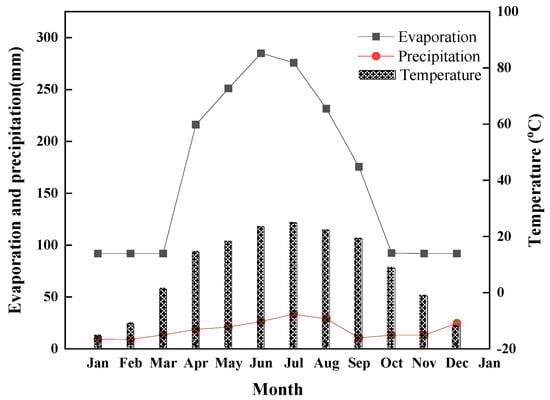
Figure 1.
Average evaporation, precipitation, and ambient temperature during a long-term experiment from 1990 to 2014 in a gray desert soil.
2.2. Long-Term Experiment
The experimental field was a wasteland before the start of the long-term experiment in April 1990, and thus the soil had retained its original quality. The 0–20 cm topsoil layer had an organic matter content of 16.7 g kg−1, total N, P, and K contents of 1.00, 0.35, and 18.18 g kg−1 and available P (Olsen-P) and K contents of 9 and 505 mg kg−1. Soil pH (1:1 for the ratio of water and soil) was 8.1 (Table 1).

Table 1.
Initial soil physicochemical characteristics at the experimental site in 1990.
The experiments included the following eight fertilization treatments:
- N: 240 kg N ha−1 yr−1 as urea.
- NP: 240 kg N ha−1 yr−1 as urea and 60.3 kg P ha−1 yr−1 as calcium superphosphate
- NK: 240 kg N ha−1 yr−1 as urea and 48.1 kg K ha−1 yr−1 as potassium sulfate.
- NPK: urea, calcium superphosphate, and potassium sulfate at 240 kg N, 60.3 kg P, and 48.1 kg K ha−1 yr−1.
- NPKM: 168 kg N ha−1 yr−1 as urea, 20.1 kg P ha−1 yr−1 as calcium superphosphate, and 16.3 kg K ha−1 yr−1 as potassium sulfate as above and an additional application of farmyard manure (30 t ha−1) containing 2.9 t C ha−1 yr−1 and 72 kg organic N ha−1 yr−1.
- NPKM+: 216 kg N ha−1 yr−1 as urea, 30.5 kg P ha−1 yr−1 as calcium superphosphate, and 24.7 kg K ha−1 yr−1 as potassium sulfate and an additional application of farmyard manure (60 t ha−1) that contained 5.9 t C ha−1 yr−1 and 144 kg organic N ha−1 yr−1.
- NPKS: 197 kg N ha−1 yr−1 as urea, 51.1 kg P ha−1 yr−1 as calcium superphosphate, and 42.3 kg K ha−1 yr−1 as potassium sulfate as above and the straw return (4.5–7 t ha−1) containing on average 1.5 t C ha−1 yr−1 and 43 kg organic N ha−1 yr−1).
- CK: without any fertilization.
Prior to 1995, the application rates of N, P, and K were 100.9, 35.8, and 18.8 kg ha−1, respectively, and 245, 60.3, and 48.1 kg ha−1, respectively, after 1995 to date (Table 2). Nitrogen fertilizer was split into two applications: 60% as basal fertilizer and 40% as topdressing in the N, NK, NP, NPK, NPKM, and NPKM+ treatment plots. Phosphorus, potassium, and organic fertilizers were applied as basal fertilizers. Organic fertilizer was obtained from sheep manure (see Table 2 for details). The experiment was laid in a randomized blocks design. Each 466.5 m2 plot was isolated by cement banks buried 70 cm deep and raised 10 cm above the soil surface to prevent leaching.
Table 2.
Quantity of fertilizers from the different fertilizer treatments in the long-term experiment in a gray desert soil.
Spring wheat was sown in late April and harvested in August. Winter wheat was sown in October and harvested in early June the following year. Maize was sown in late April and harvested in August. Drip irrigation was applied both in the wheat and maize seasons. Plastic mulching film was used only in the maize season. For the specific content, see Lv et al. (2016) [12]. The field was irrigated five to six times during the wheat season and four to five times during the maize season, depending on precipitation. The volume of water used for irrigation was 2850 m3 ha−1 yr−1. Herbicides and pesticides were used to control weeds and insect pests, respectively. Wheat and maize were harvested up to the level of the soil surface; thus, the stubble left in the field was negligible, but roots were left in the soil. All straw was removed from the field. Grain and straw were weighed separately after air-drying.
2.3. 15N-Labeled Urea Experiment
The 15N experiment was conducted in mid-April 2011 and 2013 to trace the fate of urea-N in winter wheat and summer maize. 15N-labeled treatments were as follows: N, NP, NK, NPK, NPKM, NPKS, and NPKM+ in the wheat cropping season, and NPK, NPKM, NPKS, and NPKM+ in the maize cropping season. Four microplots (0.7 × 0.6 m) were established on the northeastern side of each plot. A syringe was used to inject the urea solution into the microplots to ensure that the crops would receive even nutrition. Metal squares (0.35 m high) were driven 0.30 m deep into the soil to prevent surface runoff and lateral contamination. 15N-labeled urea (abundance: 5.2%, produced by the Institute of Chemical Industry in Shanghai, China) was applied to the soil at the same N rate. All P and K applications and field management practices in the microplots were the same as those in the corresponding large plots for winter wheat and summer maize. Soil samples from the microplots were air-dried and ground to pass a 150 mm (100-mesh) screen for total N and 15N isotope analysis. Grain, straw, and soil samples were analyzed for total N and 15N abundance using the micro-Kjeldahl procedure and isotope ratio mass spectrometry (Nimmo et al. 2013). Percentage of fertilizer N recovery in the grain and straw from the crops and the soil from all the microplots at harvest was determined using Equations (1)–(3), where all 15N was expressed as the atom% excess corrected for background abundance (0.37%).
N (kg N ha−1) derived from fertilizer treatment (Ndff) in plant = N uptake by plant × 15N atom% excess in plant/15N atom% excess in fertilizer
Ndff in the soil (kg N ha−1) = Total N in soil × 15N atom% excess in soil/15N atom% excess in fertilizer
Fertilizer N recovery (%) = Total labeled N in the aboveground biomass/labeled N applied × 100
2.4. Other Ancillary Measurements
Soil samples were collected with a 5 cm inner diameter auger tube from 0 to 100 cm depth from all plots and microplots and separated into 20 cm depth increments at the beginning of the experiment and after harvest of winter wheat and summer maize. Soil samples from 0 to 300 cm were collected after maize harvest in 2013 to determine the distribution of nitrate nitrogen (NO3-N) and ammoniacal nitrogen (NH4+-N) as Nmin in the soil profile after 24 years of experimentation. Soil samples were stored in an ice box immediately after sampling and transported to the laboratory for analysis. Within 12 h, all the fresh soil samples were extracted with 0.01 M CaCl2 solution (soil-to-solution ratio of 1:10). Soil extracts were analyzed for Nmin using continuous flow analysis (Bran and Luebbe TRAACS 2000, Hamburg, Germany). Plants were separated into grain and straw after harvest, and biomass, grain, and straw production were calculated. Grain and straw samples were subsequently oven-dried at 60 °C in a forced-air oven and ground to pass through a 150 mm screen.
2.5. Statistical Analysis
Coefficient of variation (CV) was used to assess the range of variation and stability. The CV of wheat and maize was calculated as follows:
where δsd represents the standard deviation of yield, and μave represents the average value of yield (kg ha−1).
CV = δsd/μave × 100%
The sustainable yield index (Isy) is typically used to assess production sustainability (Li et al., 2011).
where Y represents mean yield (kg ha−1), SD represents the standard deviation of the yield (kg ha−1), and Ymax represents maximum yield (kg ha−1).
Isy = (Y − SD)/Ymax
The N harvest index (NHI) is frequently used to assess N transport from the shoots and leaves to the grain (Li et al., 2011). NHI values for wheat and maize were calculated as follows:
where Ngrain and Naboveground-biomass are the N uptake in the grain and crop biomass in each treatment (CK, NPK, NPKS, NPKM, and NPKM+).
All statistical analyses were performed using SPSS 16. Prior to statistical analysis, the data (three replications) were examined for homogeneity of variance when required; however, untransformed means and standard errors are presented in figures and tables. Comparisons of the effects of the treatments on yield, yield stability, and Nmin were analyzed using one-way Analysis of Variance (ANOVA). Tukey’s honestly significant difference (HSD) test for multiple comparisons among means was employed to test for differences among the treatment means at p < 0.05.
3. Results
3.1. Crop Yields, CV, ISY, and NHI of Wheat and Maize
Statistical analyses of grain yield of spring wheat (cropped for four years), winter wheat (cropped for eight years), and maize (cropped for nine years) indicated that fertilizer treatments significantly affected grain yield (Table 3). During the 23-year planting process of the three crops, both crop yield and aboveground biomass showed a significant upward trend (except for individual years) due to the continuous improvement of cropland management level (Figure 2). For spring wheat and winter wheat, the combined application of N and P fertilizers (NP, NPK) led to a significant increase (p < 0.05) in biomass and yield compared to the treatments without N and P (control, N and NK). A comparison of the NPK and NPKS treatments for all three crops indicated that straw return did not have any significant effect on yield in the long-term experiment (p > 0.05). The NPKM and NPKM+ treatments did not show significant differences in yield during the study period (Table 3). Furthermore, a comparison of the CV of the treatments showed that NPKM and NPKM+ did not differ significantly in the wheat season but were significantly lower for the NPKM treatment in the maize season (p < 0.05), illustrating overuse of manure amendment is not conducive to the stability of crop yield in arid regions due to excess nutrients. Compared to the NPK treatments, the NPKM treatment showed significantly lower CV values in the winter wheat season. The NPKS treatment showed lower CV values in the maize season, suggesting that under the condition of equal nitrogen application, appropriate manure amendment and straw returning can better ensure the stability of crop yield. The results for sustainable yield index Isy were similar; the NPKM and NPKS treatments resulted in lower Isy values than those of other treatments in the wheat season, but not in the maize season, indicating that the yield stability of the different crops under study responded differently to different treatments in extremely arid cropland systems. A comparison of NHI for balanced fertilizer treatments showed a significantly higher NHI value for the NPKM treatment than those of other treatments in the wheat and maize seasons. The NHI of the NPK or NPKS treatment did not significantly differ in the wheat season, but it did in the maize season (p > 0.05), thus confirming that the addition of organic fertilizer is more conducive to the accumulation of N in the grain under the extreme-drought cropland management model.
Table 3.
Mean yield, coefficient of variation (CV), sustainable yield index (Isy), and nitrogen harvest index (NHI) of spring wheat, winter wheat, and maize and the ANOVA results showing ‘Groups’ of treatments from 24 years’ data.
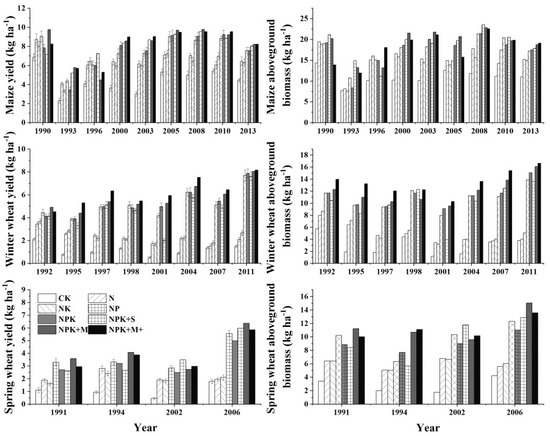
Figure 2.
Effect of fertilizer treatments on crop yield and aboveground biomass under long-term fertilization in 1990–2013.
3.2. Residual Mineral N in the Soil Profile under Different Fertilization Treatments
Fertilization treatments resulted in different distribution patterns of NH4+-N in the 300 cm soil profile after 24 years of experimentation. The CK treatment had the lowest NH4+-N concentration, with values in the range of 0.9–3.4 mg N kg−1; meanwhile, other treatments showed relatively high NH4+-N contents, especially for N and NK treatments, with values in the range of 6.8–12.8 and 4.1–15.6 mg N kg−1, respectively, in the 300 cm soil profile, while the NH4+-N concentration of other treatments was basically within the range observed for CK, N, and NK treatments. The distribution of NH4+-N across all treatments did not show any peaks in the soil profile. The distribution of NO3−-N in the soil differed from the NH4+-N concentration profile. The NPKM+ treatment resulted in the highest NO3−-N concentration, with a value of 118.9 mg N kg−1 in the 20 cm soil profile (Figure 3 shows the distribution after maize harvest), followed by a significant downward trend down to 150 cm into the soil profile. This was followed by the NPKM, NPK, and NPKS treatments, with the peak NO3−-N concentration in the 20–40 cm soil layer. The distribution pattern in the unbalanced treatments differed and peak values of NO3−-N concentration are seen between 200–250 cm, suggesting the nutrients that cannot be absorbed by the crop are more likely to migrate deep into the soil.
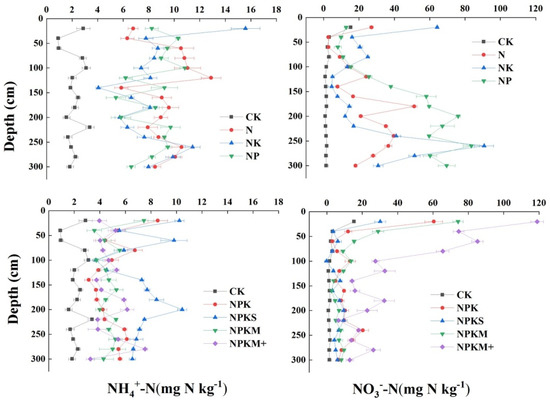
Figure 3.
Distribution of NO3−-N and NH4+-N after the maize harvest in 2014 in the 24 years of experimentation in a gray desert soil cropland. Bars indicate error of the mean, n = 3.
Comparing the residual Nmin in different soil layers, we found that the concentration of Nmin in the 300 cm soil profile for the CK treatment was minimum (Figure 4). In contrast, the highest levels of Nmin (mainly in the form of NO3−-N) were found in the N treatments, concentrated mainly in the 100–300 cm soil profile (Figure 4), followed by the NPKM+ treatment, with 64.5% NO3−-N accumulated in the 0–100 cm soil profile. NK and NP treatments also resulted in high NO3−-N, with 56.9% and 47.7% accumulated in the 200–300 cm soil profile, respectively. The NPK and NPKM treatments contributed to relatively low NO3−-N values of 585 and 617 kg ha−1, respectively, in the 300 cm soil profile, concentrating mainly in the 0–100 cm layer. NPKS showed the lowest NO3−-N (234 kg ha−1) in the 0–300 cm soil profile among all treatments. Overall, the stock of mineral N decreased in the order N > NPKM+ > NK > NP > NPK, NPKM > NPKS, which was expected in the unbalanced (N, NK, NP) or excessive fertilizer treatments due to P and K limitation or excess fertilizer input.
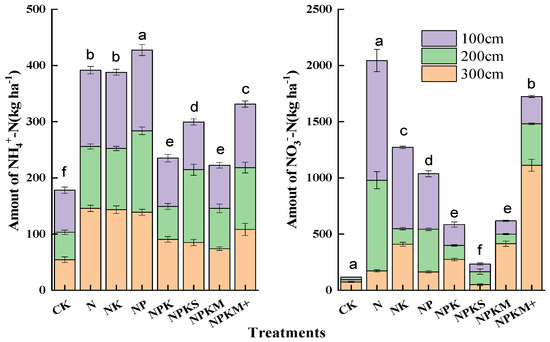
Figure 4.
Accumulation of NO3−-N and NH4+-N in the 300 cm soil profile under different fertilization treatments in 2013 (Different letters showed significantly different from LSD at the 0.05).
3.3. N Recovery, Residual N, and Other Losses in Winter Wheat and Summer Maize Seasons
The experiment with 15N-labeled urea to trace the fate of N in terms of crop uptake, soil residual, and other losses in 2011 and 2013 showed significant differences among the different long-term treatments (Table 4, Figure 5) (p < 0.05). In the case of winter wheat, 15N-labeled urea was applied only in the topdressing period, having missed the early stage of wheat growth. The results showed that 15N mainly accumulated in the topsoil (0–20 cm), while much less 15N-labeled urea reached the deeper soil profiles. However, in the maize season, although 15N-labeled urea was mainly concentrated in the topsoil, a large amount of 15N-labeled urea still migrated down to a depth of 100 cm, indicating that a significant amount of N is lost by leaching in gray desert soils undercurrent fertilization and irrigation schemes. Furthermore, the NPK and NPKM treatments showed the highest 15N crop uptake rates, with values of 46.4% and 49.4%, respectively, in the wheat season and 28.2% and 32.2%, respectively, in the maize season, followed by the NPKS treatment, in which case the uptake rate was 41.6% and 25.3% in the wheat and maize season, respectively. At the same time, NPKM showed the lowest 15N-labeled urea loss in the wheat season and a relatively low value in the maize season, illustrating that the combination treatment consisting of chemical fertilizer and manure is a relatively good choice for improving NUE while reducing environmental loss of nitrogen in extremely arid croplands.
Table 4.
The fate of fertilizer N in winter wheat in different long-term treatments using 15N tracer method in 2011–2013.
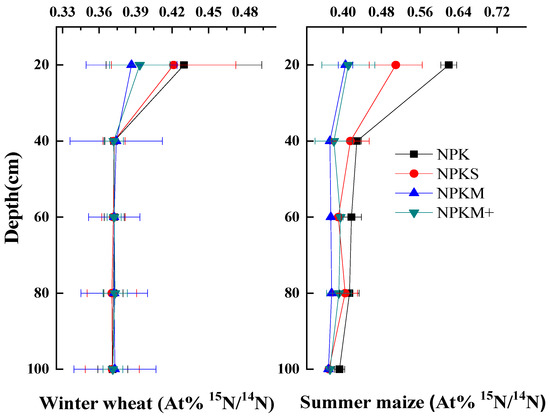
Figure 5.
Distribution of at %15N/14N along the 0–100 cm soil profile under different fertilization treatments in winter wheat and summer maize.
4. Discussion
4.1. Fertilization and Crop Yield
Crop yield potential is normally defined as the yield of a crop variety grown under optimal management conditions, where water and nutrient supply are optimum, and there is effective control of pests and diseases [26]. Further, yield potential is also affected by the intensity of incident solar radiation and ambient temperature [27,28]. In our long-term study, water was supplied by irrigation because of extreme drought and high evaporation rates; therefore, moisture was not a limiting factor for crop production. However, the various nutrient/fertilizer treatments resulted in different crop yields. Thus, NPK, NPKM, NPKM+, and NPKS provided long-lasting high crop productivity in the 24 years of experimentation in the selected gray desert soil area. Further, except for the first year, the CK treatment consistently rendered the lowest productivity. Balanced fertilizer treatments showed higher production potential than the unbalanced fertilizer application without NP, indicating that oasis gray desert soil was rich in K but deficient in N and P.
Crop yield after balanced fertilizer treatment did not show significant differences (p > 0.05), although the production was slightly higher in the NPKM treatment, as seen from the 24-year average. Our results differ from those of research conducted at the Huang-Huai-Hai Plain of China, where Cai et al. (2006) found that the NPK treatment resulted in higher production, compared to all other treatments [29]. This can be explained by the higher proportion of organic fertilizer input and microbial activity due to adequate irrigation, a significant temperature difference between day and night, and alternating freezing and thawing overall, leading to the rapid degradation of soil organic matter [23]. In addition, manure amendment treatments displayed higher yield stability (CV) and NHI than any other treatment in both wheat and maize seasons, which is consistent with the results of other long-term experiments in nonarid areas [1,20,28,30,31]. In addition, the NPKS treatment showed a significantly higher CV than the NPKM and NPK treatments, both in the spring and winter wheat seasons, but not in the summer maize season, as seen from the 24-year data. These findings indicated that straw return is more beneficial for yield stability in the summer maize season than in the winter or spring wheat seasons in extremely arid cropland regions, which might be attributed to the difficulty of decomposing straw under extreme drought and nonirrigated conditions due to its high cellulose content, thus affecting the wheat germination rate [30]. However, it is not clear whether straw return application can ensure crop yield stability.
4.2. Nmin Distribution in the Soil Profile over a 24-Year Nutrient Management Period
Nitrate leaching showed that NPKM+ might lead to a large residual N in the soil layers. This is attributed to the excessive input of manure N, which led to more mineralized N entering the deeper soil profile. However, the results showed that the Nmin after manure amendment treatments (NPKM+ and NPKM) accumulated mainly in the 100 cm soil profile and a low proportion leached deeper than the 100 cm soil profile, while treatments involving the application of chemical fertilizer (N, NK, NP, and NPK), resulted in a large amount of mineral N leaching 100 cm below the soil, reaching even down to a depth of 300 cm due to weak uptake by crops and high-volume irrigation in an extremely arid region. These results further demonstrate that manure amendment is more useful in preventing the downward migration of Nmin under extremely dry environmental conditions. The same phenomenon was observed in our 2-year study using 15N-labeled urea. In addition, the observations of some other studies were similar to our results [27,28,32]. The NPKS treatment showed the lowest N residual and N loss, compared with the other treatments; this finding may be explained by the following two reasons: first, compared with the NPK treatment, the NPKS treatment had less chemical fertilizer input due to the inclusion of N in the straw; second, the high carbon/nitrogen (C/N) ratio of straw holds mineral N more easily in the soil by increasing the microbial abundance and activity [31,33,34]. Comparedwith other nonaridcroplands [13,26,35,36], extremely arid croplands have a higher Nmin residual in the soil profile due to the high volume of irrigation water, which increases N deposition, and to overapplication of N fertilizers. Lv et al. reported that dry and wet N deposition in the arid oasis area of western China can reach up to 33 kg ha−1, while NO3-N goingintothe groundwater can be 8–17 kg N ha−1 yr−1 due to heavy irrigation [12]. The resulting input of environmental N in extremely arid areas is not lower than in other regions, such as North China [14]. Overall, although balanced fertilizers combined with manure and straw return can maintain a suitable concentration of mineral N in the 0–100 cm soil profile, excessive nitrogen input still exists in extremely arid region cropland systems due to neglect of the environmental nitrogen input.
4.3. Fertilizer N Recovery and Loss
The combined fertilizer treatments tested herein resulted in different fertilizer N recovery and loss rates. In gray desert croplands, unbalanced fertilization can result in high residual N in the soil due to insufficient absorption, as seen in our study using labeled 15N. The treatment with NPK showed a relatively lower 15N residual in the 100 cm soil profile than either the NP or the NK treatment. This finding clearly indicates that N absorption is higher when the supply of nutrients is balanced. Among the balanced fertilizer treatments, NPKM showed the highest proportion of residual 15N in both wheat and maize seasons, concomitant with other losses being significantly lower, thus illustrating that suitable manure amendment does help to retain mineral N in the soil and reduces other losses, due to N uptake and fixation by the abundant soil microorganisms [15,16,32,37]. Further, the NPK and NPKS treatments did not show significant differences in 15N soil residues or environmental losses, although there were slight variations in the different crop seasons, suggesting that straw return to the field did not significantly improve NUE, which might be attributed to the low efficiency of straw decomposition on account of the extremely arid environmental conditions and high C/N ratio, which in turn may account for the different results reported for nonarid areas [27,30,35,38]. In addition, the NPKM treatment resulted In the highest 15N-urea recovery in both wheat and maize seasons, with NUE of 49.4% and 32.2%, respectively, indicating that manure amendment may promote N absorption from the chemical fertilizer. Our results further demonstrate that the combined application of organic and inorganic fertilizers is an adequate choice to improve NUE in extremely arid cropland areas.
5. Conclusions
High organic fertilizer input (NPKM+) was not conducive to crop yield stability or nitrogen harvest index from the perspective of long-term application in extremely arid cropland regions. Crop yield under the NPKM treatment did not significantly differ from that of the NPK or NPKS treatments, but the coefficient of variation and NHI were lower under conditions of equal nitrogen input. Compared to the NPK treatment, the NPKM and NPKS treatments seemed to be more conducive to the accumulation of soil mineral nitrogen in the 0–100 cm soil profile and reduce nitrogen losses due to leaching under heavy irrigation in extremely arid regions. The highest recovery rate and the lowest unaccounted losses were observed in the NPKM treatment, indicating that the combined application of inorganic and organic fertilizers or straw return, such as treatments NPKM and NPKS, was commendable to ensure the yield security and environmental safety in extremely arid regions.
Author Contributions
Conceptualization, S.L., J.L.; Data curation: S.L., X.W.; Formal analysis: S.L.; Funding acquisition: J.L.; Investigation: S.L.; Methodology: S.L.; Project administration: J.L., J.G.; Resources: X.W.; Software: S.L., J.L.; Supervision: J.L., J.G., C.K.; Validation: J.L., J.G.; Visualization: S.L.; Writing—review and editing: S.L., J.L., J.G. All authors have read and agreed to the published version of the manuscript.
Funding
This work was funded by the Natural Science Foundation of China (Grant no. 41807098, 2019), and National Gray Desert Soil Fertility and Fertilizer Efficiency Monitoring Station of China.
Institutional Review Board Statement
Not applicable.
Informed Consent Statement
Not applicable.
Data Availability Statement
The data presented in this study are available on request from the corresponding authors.
Acknowledgments
We are thankful to all mumbers of staff from National Gray Desert Soil Fertility and Fertilizer Efficiency Monitoring Station of China for their contribution during the field experiments.
Conflicts of Interest
The authors declare no conflict of interest.
References
- Srinivasarao, C.; Kundu, S.; Venkateswarlu, B.; Lal, R.; Singh, A.K.; Balaguravaiah, G.; Vijayasankarbabu, M.; Vittal, K.P.R.; Reddy, S.; Rupendra Manideep, V. Long-term effects of fertilization and manuring on groundnut yield and nutrient balance of alfisols under rainfed farming in india. Nutr. Cycl. Agroecosyst. 2013, 96, 29–46. [Google Scholar] [CrossRef]
- Sainju, U.M.; Ghimire, R.; Mishra, U.; Jagadamma, S. Reducing nitrous oxide emissions and optimizing nitrogen-use efficiency in dryland crop rotations with different nitrogen rates. Nutr. Cycl. Agroecosyst. 2020, 116, 381–395. [Google Scholar] [CrossRef]
- Jiang, C.M.; Yu, W.T.; Ma, Q.; Xu, Y.G.; Zou, H. Alleviating global warming potential by soil carbon sequestration: A multi-level straw incorporation experiment from a maize cropping system in northeast china. Soil Tillage Res. 2017, 170, 77–84. [Google Scholar] [CrossRef]
- Yang, B.; Xiong, Z.; Wang, J.; Xu, X.; Huang, Q.; Shen, Q. Mitigating net global warming potential and greenhouse gas intensities by substituting chemical nitrogen fertilizers with organic fertilization strategies in rice–wheat annual rotation systems in china: A 3-year field experiment. Ecol. Eng. 2015, 81, 289–297. [Google Scholar] [CrossRef]
- Sainju, U.M.; Stevens, W.B.; Caesar-TonThat, T.; Liebig, M.A.; Wang, J. Net global warming potential and greenhouse gas intensity influenced by irrigation, tillage, crop rotation, and nitrogen fertilization. J. Environ. Qual. 2014, 43, 777–788. [Google Scholar] [CrossRef] [PubMed]
- Kundu, S.; Bhattacharyya, R.; Prakash, V.; Gupta, H.S.; Pathak, H.; Ladha, J.K. Long-term yield trend and sustainability of rainfed soybean–wheat system through farmyard manure application in a sandy loam soil of the indian himalayas. Biol. Fertil. Soils 2006, 43, 271–280. [Google Scholar] [CrossRef]
- Lv, J.; Yin, X.; Dorich, C.; Olave, R.; Wang, X.; Kou, C.; Song, X. Net field global warming potential and greenhouse gas intensity in typical arid cropping systems of china: A 3-year field measurement from long-term fertilizer experiments. Soil Tillage Res. 2021, 212, 105053. [Google Scholar] [CrossRef]
- Voss, M.; Hietanen, S. Biogeochemistry the depths of nitrogen cycling. Nature 2013, 493, 616–618. [Google Scholar] [CrossRef]
- Liu, X.J.; Duan, L.; Mo, J.M.; Du, E.Z.; Shen, J.L.; Lu, X.K.; Zhang, Y.; Zhou, X.B.; He, C.N.; Zhang, F.S. Nitrogen deposition and its ecological impact in china: An overview. Environ. Pollut. 2011, 159, 2251–2264. [Google Scholar] [CrossRef]
- Nosengo, N. Fertilized to death. Nature 2003, 425, 894–895. [Google Scholar] [CrossRef]
- Luo, X.S.; Wen, X.; Liu, X.J. An evaluation of atmospheric nr pollution and deposition in north china after the beijing olympics. Atmos. Environ. 2014, 74, 209–216. [Google Scholar] [CrossRef]
- Lv, J.; Liu, H.; Wang, X.; Li, K.; Tian, C.; Liu, X. Highly arid oasis yield, soil mineral n accumulation and n balance in a wheat-cotton rotation with drip irrigation and mulching film management. PLoS ONE 2016, 11, e0165404. [Google Scholar] [CrossRef]
- Li, K.H.; Liu, X.J.; Song, W.; Chang, Y.H.; Hu, Y.K.; Tian, C.Y. Atmospheric nitrogen deposition at two sites in an arid environment of central asia. PLoS ONE 2013, 8, e67018. [Google Scholar] [CrossRef] [PubMed][Green Version]
- Fan, M.S.; Lu, S.H.; Jiang, R.F.; Liu, X.J.; Zeng, X.Z.; Goulding, K.W.T.; Zhang, F.S. Nitrogen input, n-15 balance and mineral n dynamics in a rice-wheat rotation in southwest china. Nutr. Cycl. Agroecosyst. 2007, 79, 255–265. [Google Scholar] [CrossRef]
- Bah, H.; Ren, X.; Wang, Y.; Tang, J.; Zhu, B. Characterizing greenhouse gas emissions and global warming potential of wheat-maize cropping systems in response to organic amendments in eutric regosols, China. Atmosphere 2020, 11, 614. [Google Scholar] [CrossRef]
- Oladipo, D.G.; Wei, K.; Hu, L.; Medaiyese, A.; Bah, H.; Gbadegesin, L.A.; Zhu, B. Short-term assessment of nitrous oxide and methane emissions on a crop yield basis in response to different organic amendment types in sichuan basin. Atmosphere 2021, 12, 1104. [Google Scholar] [CrossRef]
- Zhang, X.; Guo, J.; Vogt, R.D.; Mulder, J.; Wang, Y.; Qian, C.; Wang, J.; Zhang, X. Soil acidification as an additional driver to organic carbon accumulation in major chinese croplands. Geoderma 2020, 366, 114234. [Google Scholar] [CrossRef]
- Hao, T.; Liu, X.; Zhu, Q.; Zeng, M.; Chen, X.; Yang, L.; Shen, J.; Shi, X.; Zhang, F.; de Vries, W. Quantifying drivers of soil acidification in three chinese cropping systems. Soil Tillage Res. 2022, 215, 105230. [Google Scholar] [CrossRef]
- Wu, Z.; Sun, X.; Sun, Y.; Yan, J.; Zhao, Y.; Chen, J. Soil acidification and factors controlling topsoil ph shift of cropland in central china from 2008 to 2018. Geoderma 2022, 408, 115586. [Google Scholar] [CrossRef]
- Steiner, C.; Teixeira, W.G.; Lehmann, J.; Nehls, T.; de Macêdo, J.L.V.; Blum, W.E.H.; Zech, W. Long term effects of manure, charcoal and mineral fertilization on crop production and fertility on a highly weathered central amazonian upland soil. Plant Soil 2007, 291, 275–290. [Google Scholar] [CrossRef]
- Ning, S.; Zhou, B.; Shi, J.; Wang, Q. Soil water/salt balance and water productivity of typical irrigation schedules for cotton under film mulched drip irrigation in northern xinjiang. Agric. Water Manag. 2021, 245, 106651. [Google Scholar] [CrossRef]
- Wu, L.; Zhou, X.; Zhao, D.; Feng, T.; Zhou, J.; Sun, T.; Wang, J.; Wang, C. Seasonal variation and exposure risk assessment of pesticide residues in vegetables from xinjiang uygur autonomous region of china during 2010–2014. J. Food Compos. Anal. 2017, 58, 1–9. [Google Scholar] [CrossRef]
- Lyu, J.; Liu, H.; Wang, X.; Olave, R.; Tian, C.; Liu, X. Crop yields and soil organic carbon dynamics in a long-term fertilization experiment in an extremely arid region of northern xinjiang, china. J. Arid Land 2017, 9, 345–354. [Google Scholar] [CrossRef]
- Lv, J.; Liu, X.; Liu, H.; Wang, X.; Li, K.; Tian, C.; Christie, P. Greenhouse gas intensity and net annual global warming potential of cotton cropping systems in an extremely arid region. Nutr. Cycl. Agroecosyst. 2014, 98, 15–26. [Google Scholar] [CrossRef]
- Kuang, W.; Gao, X.; Tenuta, M.; Gui, D.; Zeng, F. Relationship between soil profile accumulation and surface emission of N2O: Effects of soil moisture and fertilizer nitrogen. Biol. Fertil. Soils 2019, 55, 97–107. [Google Scholar] [CrossRef]
- Andruschkewitsch, R.; Koch, H.-J.; Ludwig, B. Effect of long-term tillage treatments on the temporal dynamics of water-stable aggregates and on macro-aggregate turnover at three german sites. Geoderma 2014, 217–218, 57–64. [Google Scholar] [CrossRef]
- Zheng, J.; Chen, J.; Pan, G.; Wang, G.; Liu, X.; Zhang, X.; Li, L.; Bian, R.; Cheng, K.; Zheng, J. A long-term hybrid poplar plantation on cropland reduces soil organic carbon mineralization and shifts microbial community abundance and composition. Appl. Soil Ecol. 2017, 111, 94–104. [Google Scholar] [CrossRef]
- van der Bom, F.; Magid, J.; Jensen, L.S. Long-term fertilisation strategies and form affect nutrient budgets and soil test values, soil carbon retention and crop yield resilience. Plant Soil 2018, 434, 47–64. [Google Scholar] [CrossRef]
- Cai, Z.C.; Qin, S.W. Dynamics of crop yields and soil organic carbon in a long-term fertilization experiment in the huang-huai-hai plain of china. Geoderma 2006, 136, 708–715. [Google Scholar] [CrossRef]
- Malhi, S.S.; Nyborg, M.; Goddard, T.; Puurveen, D. Long-term tillage, straw management and n fertilization effects on quantity and quality of organic c and n in a black chernozem soil. Nutr. Cycl. Agroecosyst. 2011, 90, 227–241. [Google Scholar] [CrossRef]
- Li, X.; Wen, Q.; Zhang, S.; Li, N.; Yang, J.; Romanyà, J.; Han, X. Long-term changes in organic and inorganic phosphorus compounds as affected by long-term synthetic fertilisers and pig manure in arable soils. Plant Soil 2022, 472, 239–255. [Google Scholar] [CrossRef]
- Vuaille, J.; Gravert, T.K.O.; Magid, J.; Hansen, M.; Cedergreen, N. Long-term fertilization with urban and animal wastes enhances soil quality but introduces pharmaceuticals and personal care products. Agron. Sustain. Dev. 2021, 42, 1. [Google Scholar] [CrossRef]
- Guo, J.; Wang, B.; Wang, G.; Myo, S.T.Z.; Cao, F. Effects of three cropland afforestation practices on the vertical distribution of soil organic carbon pools and nutrients in eastern china. Glob. Ecol. Conserv. 2020, 22, e00913. [Google Scholar] [CrossRef]
- Jiang, M.; Wang, X.; Liusui, Y.; Han, C.; Zhao, C.; Liu, H. Variation of soil aggregation and intra-aggregate carbon by long-term fertilization with aggregate formation in a grey desert soil. Catena 2017, 149, 437–445. [Google Scholar] [CrossRef]
- Congreves, K.A.; Hooker, D.C.; Hayes, A.; Verhallen, E.A.; Van Eerd, L.L. Interaction of long-term nitrogen fertilizer application, crop rotation, and tillage system on soil carbon and nitrogen dynamics. Plant Soil 2016, 410, 113–127. [Google Scholar] [CrossRef]
- Andruschkewitsch, R.; Geisseler, D.; Koch, H.J.; Ludwig, B. Effects of tillage on contents of organic carbon, nitrogen, water-stable aggregates and light fraction for four different long-term trials. Geoderma 2013, 192, 368–377. [Google Scholar] [CrossRef]
- Yi, B.; Zhang, Q.; Gu, C.; Li, J.; Abbas, T.; Di, H. Effects of different fertilization regimes on nitrogen and phosphorus losses by surface runoff and bacterial community in a vegetable soil. J. Soils Sediments 2018, 18, 3186–3196. [Google Scholar] [CrossRef]
- Begum, K.; Kuhnert, M.; Yeluripati, J.; Glendining, M.; Smith, P. Simulating soil carbon sequestration from long term fertilizer and manure additions under continuous wheat using the daily daycent model. Nutr. Cycl. Agroecosyst. 2017, 109, 291–302. [Google Scholar] [CrossRef]
Publisher’s Note: MDPI stays neutral with regard to jurisdictional claims in published maps and institutional affiliations. |
© 2022 by the authors. Licensee MDPI, Basel, Switzerland. This article is an open access article distributed under the terms and conditions of the Creative Commons Attribution (CC BY) license (https://creativecommons.org/licenses/by/4.0/).