Article

Pollution Indexing and Health Risk Assessment of Heavy-Metals-Laden Indoor and Outdoor Dust in Elementary School Environments in Riyadh, Saudi Arabia

1
Department of Biology, College of Science, Princess Nourah Bint Abdulrahman University, P.O. Box 84428, Riyadh 11671, Saudi Arabia
2
Department of Chemistry, College of Science, Princess Nourah Bint Abdulrahman University, P.O. Box 84428, Riyadh 11671, Saudi Arabia
3
Department of Silviculture, Faculty of Forestry, University of Khartoum, Khartoum North 13314, Sudan
4
Soil Sciences Department, College of Food & Agricultural Sciences, King Saud University, P.O. Box 2460, Riyadh 11451, Saudi Arabia
5
Department of Soil, Water and Environment, Faculty of Agriculture, Food and Environment, Sana’a University, Sana’a 31220, Yemen
*
Author to whom correspondence should be addressed.
Atmosphere 2022, 13(3), 464; https://doi.org/10.3390/atmos13030464
Submission received: 8 February 2022 / Revised: 9 March 2022 / Accepted: 10 March 2022 / Published: 13 March 2022
(This article belongs to the Special Issue Air Pollution and Children’s Health)

Abstract

:
The prevalence of potentially toxic heavy metals (HMs)-bearing dust in the environment is posing serious health risks to humans. Therefore, the occurrence of HMs in indoor and outdoor dust samples of elementary school’s environment in Riyadh, Saudi Arabia, were reported, and associated potential human health risks were estimated in this study. Dust samples were collected from outdoor and indoor environments from eighteen elementary schools using a soft plastic brush. The mean concentrations of Cd, Co, Cu, Ni, Pb, and Zn in collected indoor dust samples were much higher (0.08, 3.45, 59.20, 15.20, 4.99, and 94.10 mg kg−1, respectively) than that of outdoor dust samples (0.07, 3.07, 42.20, 13.60, 4.57, and 62.40 mg kg−1, respectively), due to fans operation, opened windows, and resuspension of dust by children’s activities. The values of estimated enrichment factor revealed that both the outdoor and indoor dusts were moderately contaminated with Zn and Cu, while highly contaminated with Cd and Pb. However, the estimated potential ecological risks associated with HMs were lower. Health risks (non-carcinogenic and carcinogenic) calculations exhibited no potential risks of HMs in the schools’ dust toward children. However, health risks for children were determined in the following order: up to 6 years > 6–12 years > adults. Therefore, assessing the potential health risks posed by HM-contaminated dust in school environments is necessary to avoid any possible children’s health concerns.

1. Introduction

Urban development and industrialization to fulfil infrastructure network, commercial, traffic, and residential needs have resulted in environmental degradation globally [1,2,3]. Anthropogenic activities due to rapid urbanization and industrialization have resulted in the release of high quantities of undesirable substances to the environment [4,5]. Among various environmental contaminants, heavy metals (HMs) are of the major concern due to their long-term persistency and non-degradability. From environmental point of view, As, Cd, Co, Hg, Mn, Se, Cr, Cu, Ni, Pb, and Zn are the most important HMs prevailing in different environmental matrices [6].
Dust is considered as one of the major sources for HMs pollution, which in turn is accumulating in topsoil through atmospheric deposition [6]. Heavy metals emitted by various natural and anthropogenic sources, such as industrial emissions, agricultural activities, road dust, traffic emissions, municipal waste incineration, construction activities, and oil combustion are being introduced into various environmental compartments via dust deposition [6,7,8]. Being close to busy roads, construction activities, and residential areas, schools are very susceptible to dust pollution, due to the transportation of dust to the indoor environment by ventilation as well as by open doors and windows [9,10,11]. For instance, Meza-Figueroa et al. [12] found that Zn, Pb, Cr, and Cd were among the most prominent HMs in indoor and outdoor dust in schools located in an industrial–urban area. Furthermore, Guo et al. [13] found that the air exchange rate was higher during school hours, owing to open windows leading to the indoor to outdoor (I/O) ratio exceeding 1.
Riyadh, a city in Saudi Arabia, is surrounded by desert and is known by its hot and dry climate, with the highest average maximum summer temperature in Saudi Arabia. Riyadh is characterized by vast desert, harsh weather conditions, higher traffic density, and industrial activities. Owing to the surrounding desert and higher mean temperature, Riyadh faces several dust storms in a year. Moreover, rapid development has resulted in the establishment of several industries including cement, chemicals, lead smelters, tanning, steel and iron mills, and many others. Thus, the storms, industrial activities, and traffic are major contributors of dust deposition in urban environments. It has been estimated that about 220 ton km2 year−1 of dust is being deposited in Riyadh [14]. In a study to investigate the levels of HMs in indoor and outdoor dust in Riyadh, Al-Rajhi et al. [15] reported that the old industrial area had higher levels of HMs and there were relatively higher Pb levels adjacent to motorways. Additionally, El-Desoky et al. [16] found a significant correlation between concentrations of Pb in outdoor and indoor dust. They found that the concentrations of Pb in blood samples of children were significantly higher than the safety limit (5 µg dL1 [17] and 3.5 µg dL1 [18]) allowed globally, and had a weak significant correlation with outdoor dust. Likewise, Praveena et al. [19] reported higher concentrations of Pb, Cd, and Cu (34.17–101.87 μg g1, 1.73–7.5 μg g1, and 20.27–82.13 μg g1, respectively) in indoor dust samples collected from primary schools and emphasized monitoring the indoor dust quality for health risk assessment. In another study, Rehman et al. [20] reported that the dust samples collected from school environments in Lahore, Pakistan, were prominently contaminated with toxic HM, such as Cd, Cr, Cu, Ni, Pb, and Zn, and thus, may lead to health concerns for school children. As children spend most of their activity time at school, it is very important to study the quality of the school environment. Heavy metals in urban environment are an important indicator of environmental quality in the risk assessment, while dust is the main pathway that exposes individuals to HMs through ingestion, dermal contact, and inhalation. Therefore, monitoring indoor and outdoor dust of school environments is of critical importance to avoid serious health concerns.
There are different routes of consumption of airborne HMs particulates by humans, including ingestion, dermal contact, and inhalation [21]. Therefore, HMs can move into the human body, which may cause an adverse effect on human health due to their accumulation in the human body over time [5,22]. Thus, the contamination of HMs in school dust is of concern for students’ health. However, very fewer studies have been conducted till now to investigate the levels of HMs in indoor and outdoor dust and their associated health risks [19,23]. Although several studies have found concerning concentrations of these HMs in outdoor and indoor dust from different countries, data from this region is missing. To date, there is no published study about the prevalence of HMs in outdoor and indoor dust in school environment in Riyadh. Therefore, this study was carried out to (1) determine the levels of HMs (Cd, Co, Cu, Fe, Mn, Ni, Pb, Ti, and Zn) in dust samples collected from both outdoor and indoor environments of different schools in Riyadh city; (2) identify the sources of HM using enrichment factor; (3) assess the pollution levels of HMs and associated ecological risks; and (4) assess the human health risk in the indoor and outdoor school environments.

2. Materials and Methods

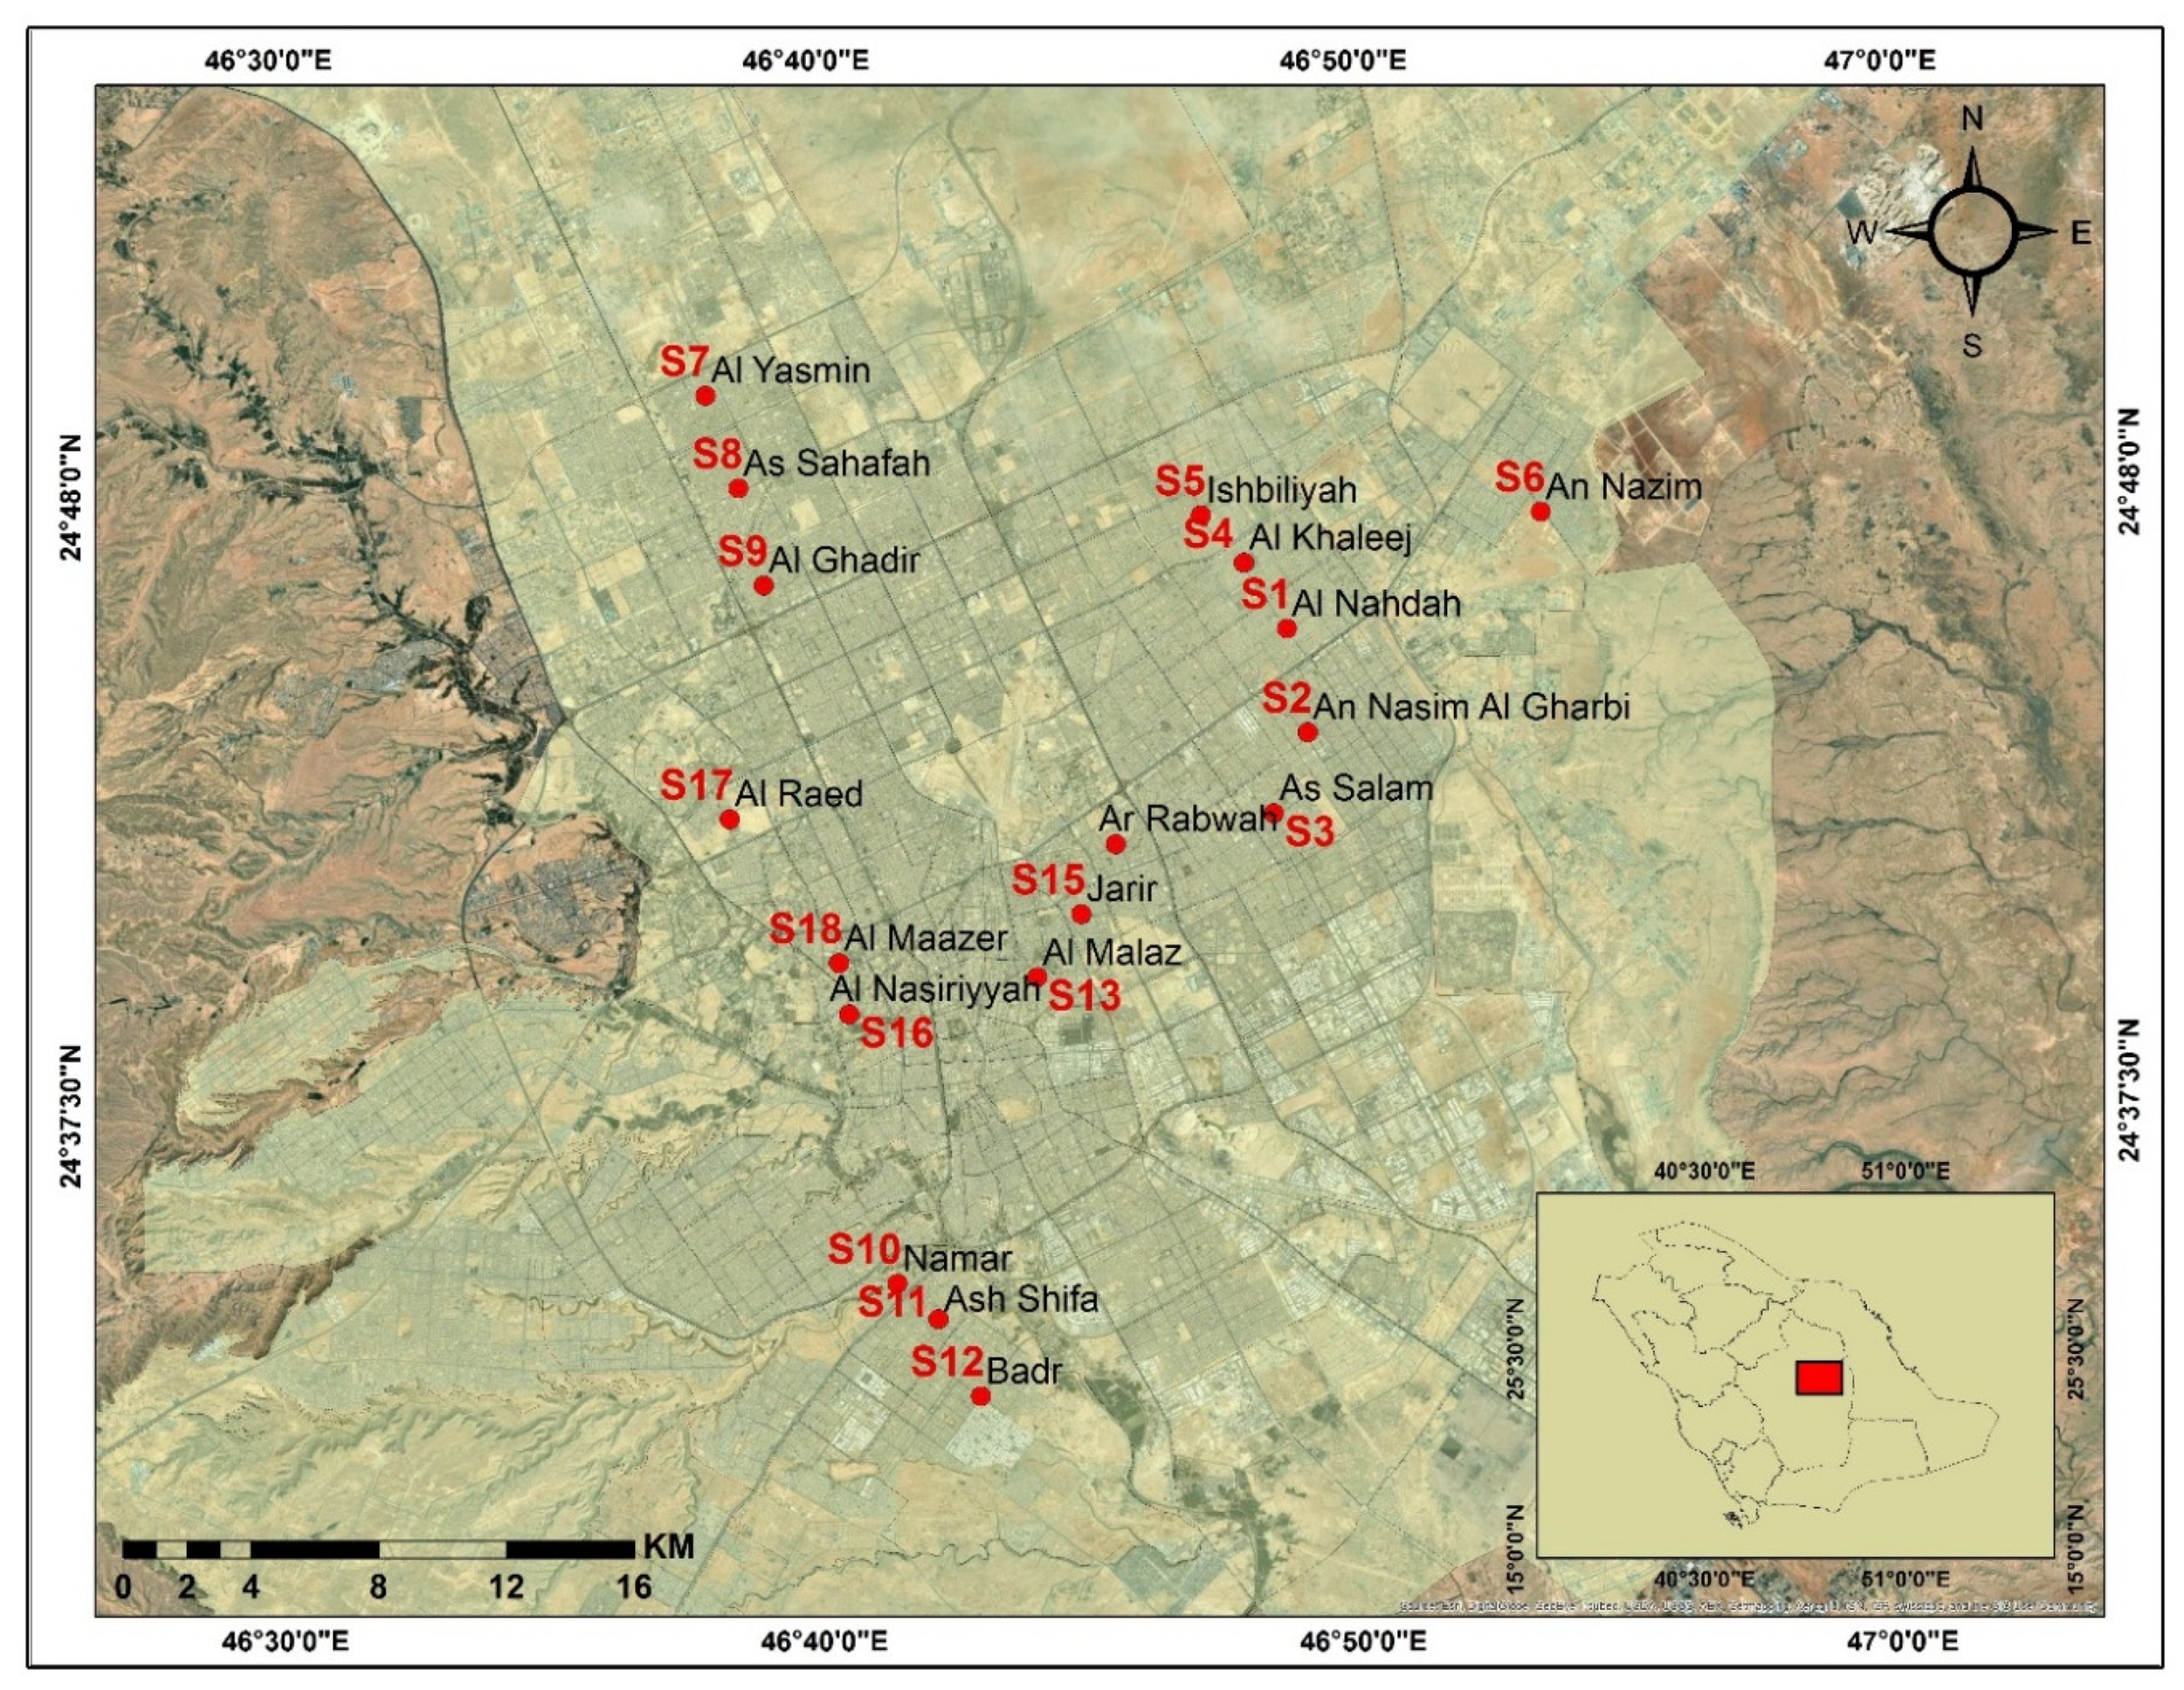
2.1. Dust Samples Collection and Analyses

Riyadh is situated in the center of Saudi Arabia (24°25′ N, 46°34′ E), at an elevation of 600 m, around 1000 km from the Red Sea and around 400 km from the Arabian Gulf to the east, with a population of about 5.2 million [24]. Dust samples were collected from 18 elementary school in Riyadh city (Figure 1). Riyadh city was divided into five areas in all directions, i.e., to the north, south, east, west, and middle of the city. Then, each region was represented by at least three schools. A total of 36 samples were collected, i.e., 18 from outdoor and 18 from indoor school environments, during summer 2018. The dust samples were collected using a soft plastic brush and stored in plastic bags, which were then transported to the laboratory for further analyses. The samples were air-dried at room temperature (24–25 °C), passed through 100 μm sieve, and digested according to USEPA 3051 method [25]. The digested samples were filtered through 0.45 µm membranes and then brought to a total volume of 50 mL with deionized water in a volumetric flask. The concentrations of HMs were then measured by the inductively coupled plasma spectrometry ICP-OES (ICP-OES, PerkinElmer Optima 4300 DV, Waltham, MA, USA). For precision, all the analyses were repeated three times.

2.2. Evaluation of HM Contamination Levels

The contamination levels of HM in dust samples were evaluated by pollution index (PI), integrated pollution index (IPI), geoaccumulation index (Igeo), and potential ecological risk index (RI). The PI and IPI were used to assess the environmental quality [26]. The PI was the rate of metal concentration in the study to the background content of the corresponding metal content in the lithosphere (content of earth crust). The PI can be classified as follows: PI ≤ 1 = low, 1< PI ≤ 3 = middle, and PI > 3 = high. The IPI values of all the measured metals for the sample were defined as the mean value of the metal’s PI. The classification of IPI is as follows: IPI ≤ 1 = low, 1 < IPI ≤ 2 = middle and IPI > 2 = high.
The Igeo method was used to calculate the metal pollution levels [27], and it can be computed by using Equation (1):
I geo = l o g 2 C i   1.5 B i
where, C i is the measured concentration of the metal, i, and Bi is the geochemical background value of the metal. In this study, Bi is the background content of the metal, i (background in shale) [28]). The constant 1.5 is introduced to minimize the variation of background values. The Igeo can be classified as: unpolluted (Igeo ≤ 0), unpolluted–moderately polluted (0 ˂ Igeo ≤ 1), moderately polluted (1 ˂ Igeo ≤ 2), moderately–strongly polluted (2 ˂ Igeo ≤ 3), strongly polluted (3 ˂ Igeo ≤ 4), strongly–extremely polluted (4 ˂ Igeo ≤ 5), and extremely polluted (5 ˂ Igeo) [27].
The RI originally mentioned by Hakanson [29] is also calculated to assess the degree of HM pollution in dust samples by using Equations (2)–(4):
RI = i = 1 n E i  
E i = T i × f i
f i = C i B i
where, RI is the sum of all six risk factors for HMs; Ei is the monomial potential ecological risk factor; Ti is the metal toxic factor; the values for each metal are in the order of Zn = 1 ˂ Cr = 2 ˂ Cu = Ni = Pb = 5 ˂ Cd = 30; fi is the metal pollution factor; Ci is the concentration of metals in the dust; and Bi is a reference value for metals. Different RI classifications of metal pollution are low ecological risk (RI ≤ 150), moderated ecological risk (150 ≤ RI ˂ 300), considerable ecological risk (300 ≤ RI ˂ 600), and high ecological risk (RI ≥ 600).
The EF is a convenient measure for assessing the degree of metal pollution and determination of probable natural and/or anthropogenic sources [30]. For normalization, a reference Fe concentration is used due to its natural abundance. The EF was calculated by using Equation (5) [30]:
EF m = [ C m ( s o i l   s a m p l e ) C F e ( s o i l   s a m p l e ) ] / [ C m ( e a r t h   c r u s t ) C F e ( e a r t h   c r u s t )   ]
where, Cm(dust sample) is content of the examined metal in the dust sample; CFe(dust sample) is content of the reference metal (Fe) in the dust sample; Cm(earth crust) is content of the examined metal in the earth crust; and CFe(earth crust) is content of the referenced metal (Fe) in the earth crust. In general, EF values higher than 2 are mainly considered to have anthropogenic sources, while values less than 2 predominantly originate from background soil material. Moreover, EF also assists in determining the degree of metal contamination. A total of 5 contamination categories are recognized on the basis of the enrichment factor, i.e., EF ˂ 2 indicates deficient–minimal enrichment, EF = 2–5 indicates moderate enrichment, EF = 5–20 indicates significant enrichment, EF = 20–40 indicates very high enrichment, and EF ˃ 40 indicates extremely high enrichment.

2.3. Risk Assessment

2.3.1. Exposure Assessment

Risk assessment is a multi-step procedure of estimating the nature and probability of adverse human’s health effects that are occurred by HMs in an environmental media [27]. Risk assessment is based on consideration of human exposure to dust via three different pathways: oral intake (ingestion), intake via inhalation, and intake through skin exposure (dermal intake). The average daily dose (ADD) contacted through ingestion and dermal contact for dust were calculated according to Equations (6) and (7):
ADD ingestion = C d u s t × I R i n g e s t i o n × F × E F × E D B W × A T  
ADD dermal = C d u s t × S A × A F × A B S × F × E F × E D B W × A T  
All the definitions of the parameters and values of the variables for the human health risk assessments are presented in Table 1.

2.3.2. Non-Cancer Risk Assessment

Non-carcinogenic quotient of exposure to HM in dust samples was calculated. Non-cancer risks are expressed as a hazard quotient (HQ). The HQ is the quotient of the ADD divided by the reference dose (RFD) of specific HM for each pathways exposure. The HQ of each metal is determined by using Equation (8) [31]:
HQ = ADD RFD
To assess the overall potential of non-cancer risk, a hazard index (HI) was calculated by using Equation (9) [32]:
HI = Σ HQ = HQ ingestion +   HQ dermal
The value of HI ≤ 1 refers that no significant risk of non-carcinogenic effects is to occur. On the other hand, there is a chance that non-carcinogenic effects may occur when HI > 1, and the probability increase with increasing the value of HI [31].

2.3.3. Cancer Risk Assessment

The incremental lifetime cancer risk (ILCR) for an individual is estimated by multiplying the slope factor (SF) with the ADD over a lifetime exposure as determined by using Equation (10).
ILCR = ADD × SF
The value of ILCR less than 1.0 × 10⁻⁶ is considered small, whereas ILCR of 1.0 × 10⁻⁶ to 1.0 × 10⁻⁴ is in the range of the acceptable limit, and ILCR of higher than 1.0 × 10⁻⁴ is likely to be harmful to human beings.

3. Results and Discussion

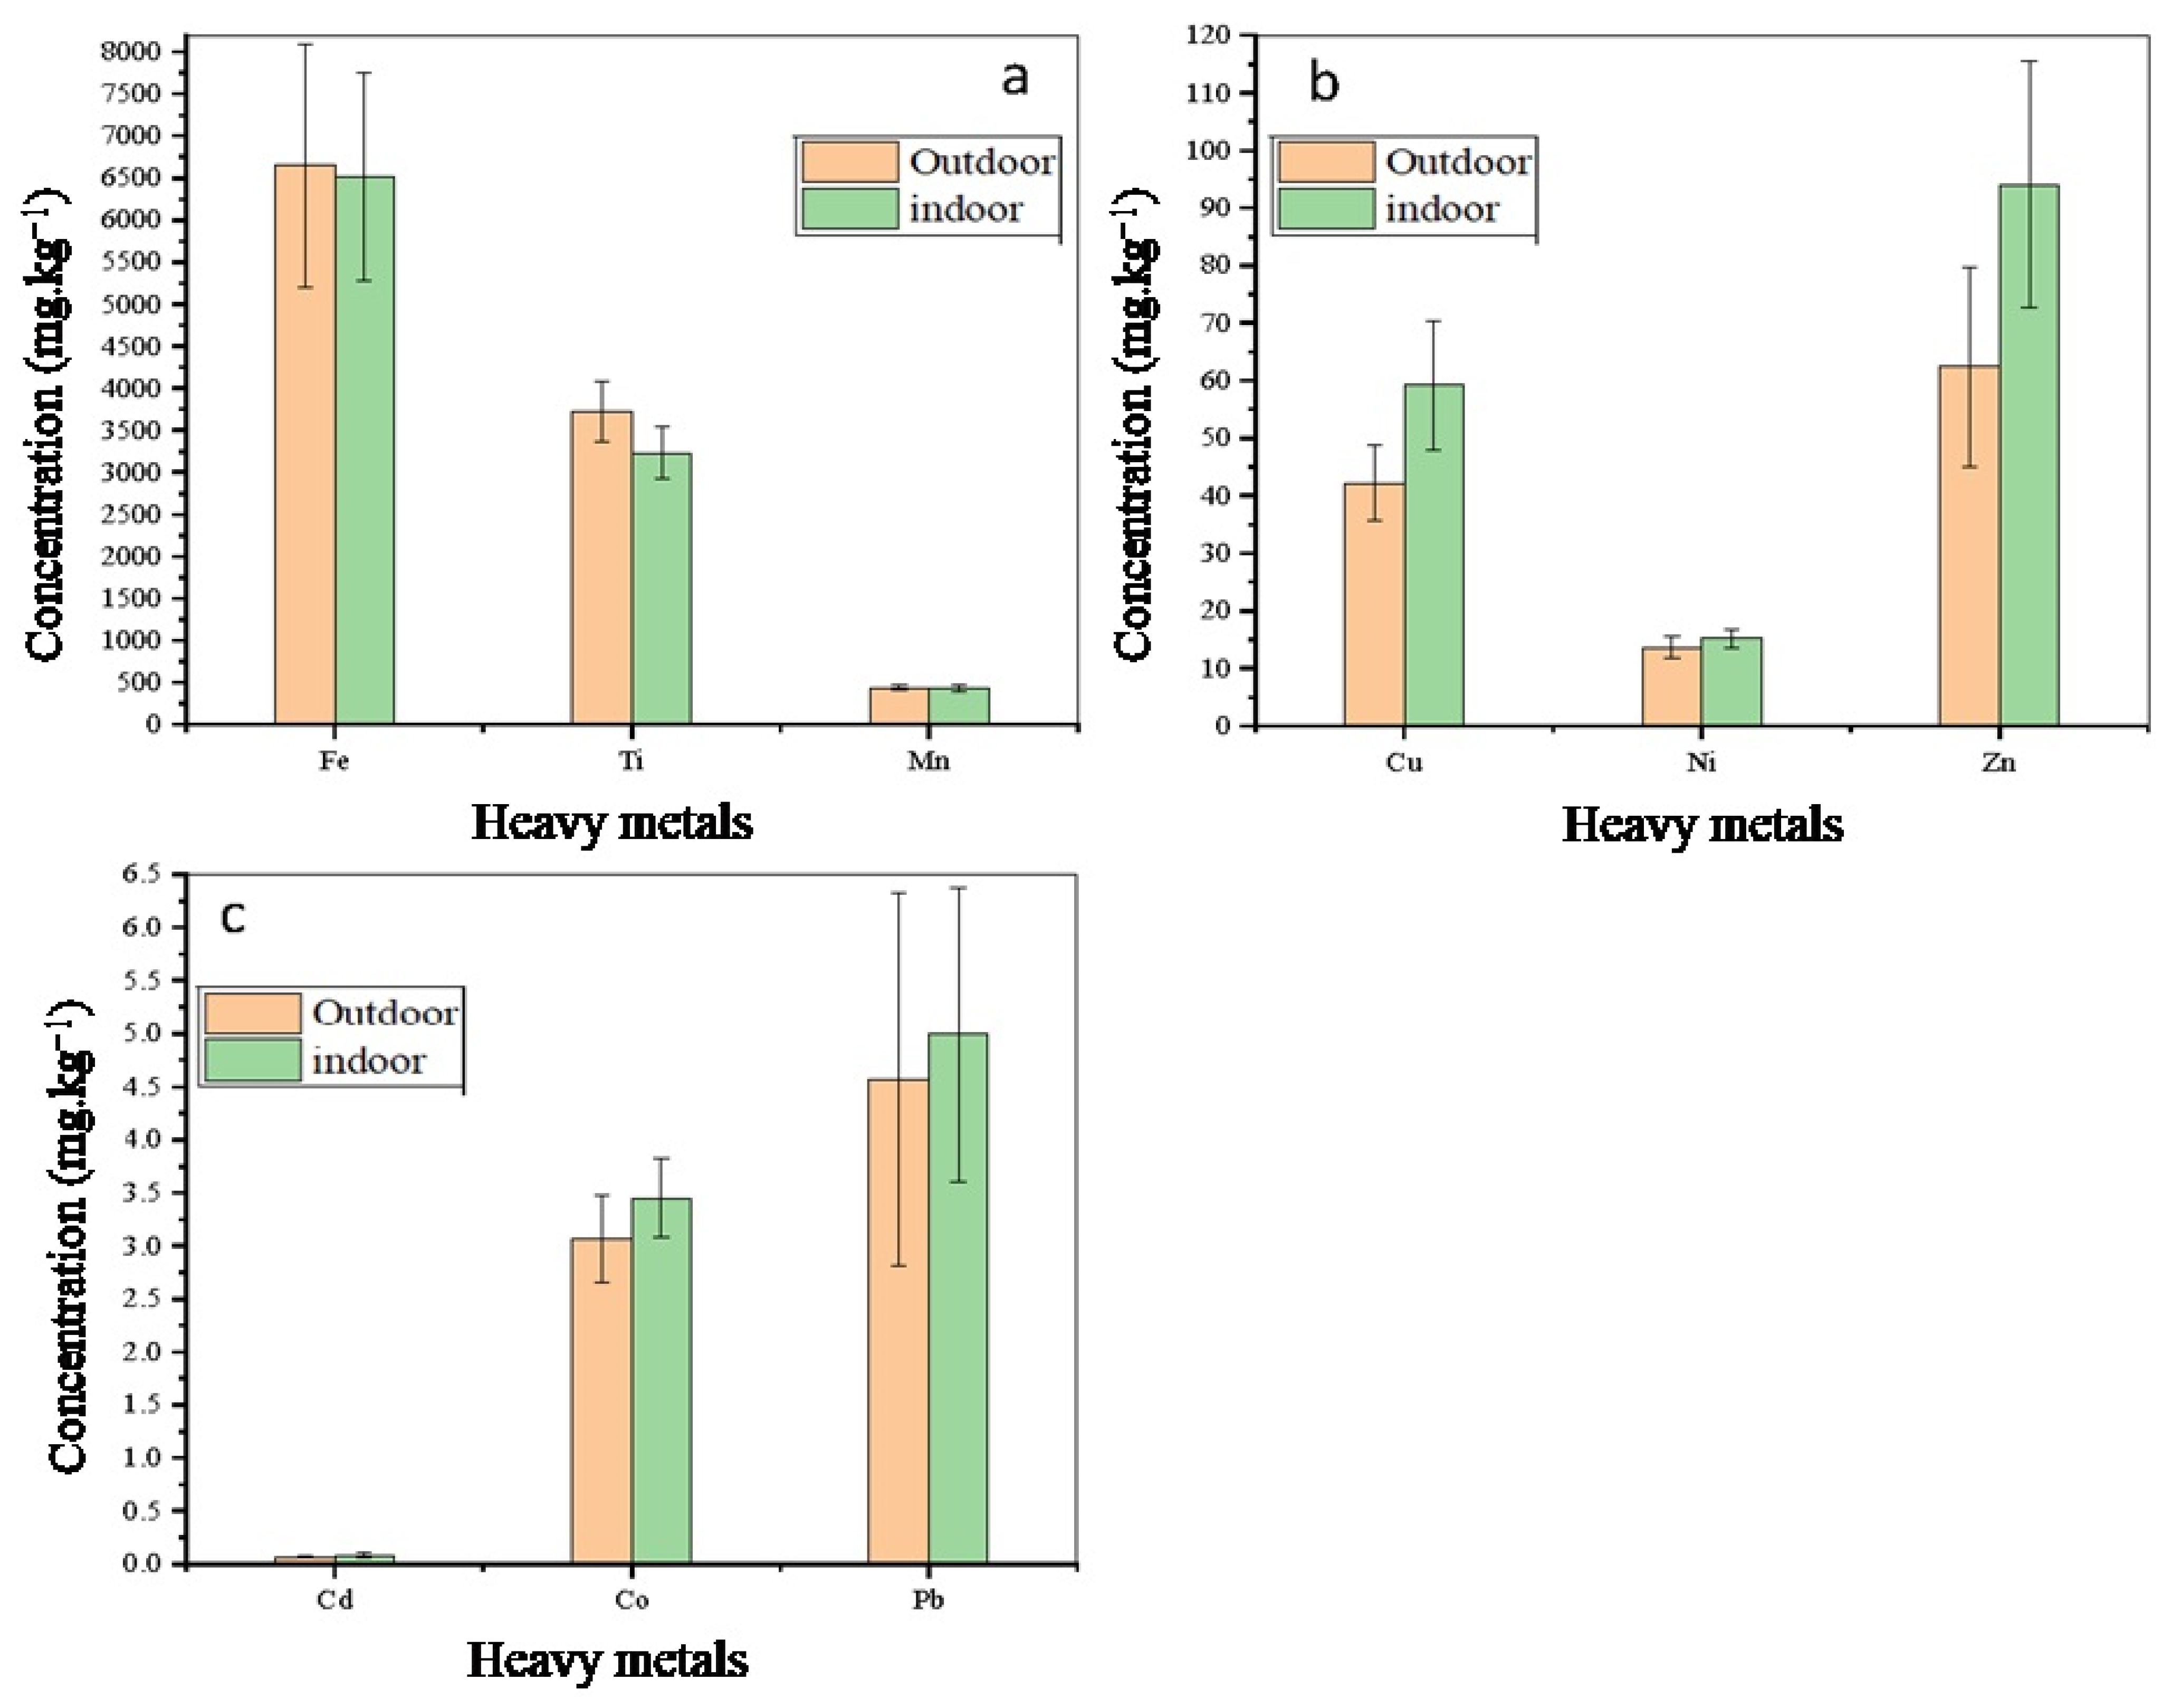
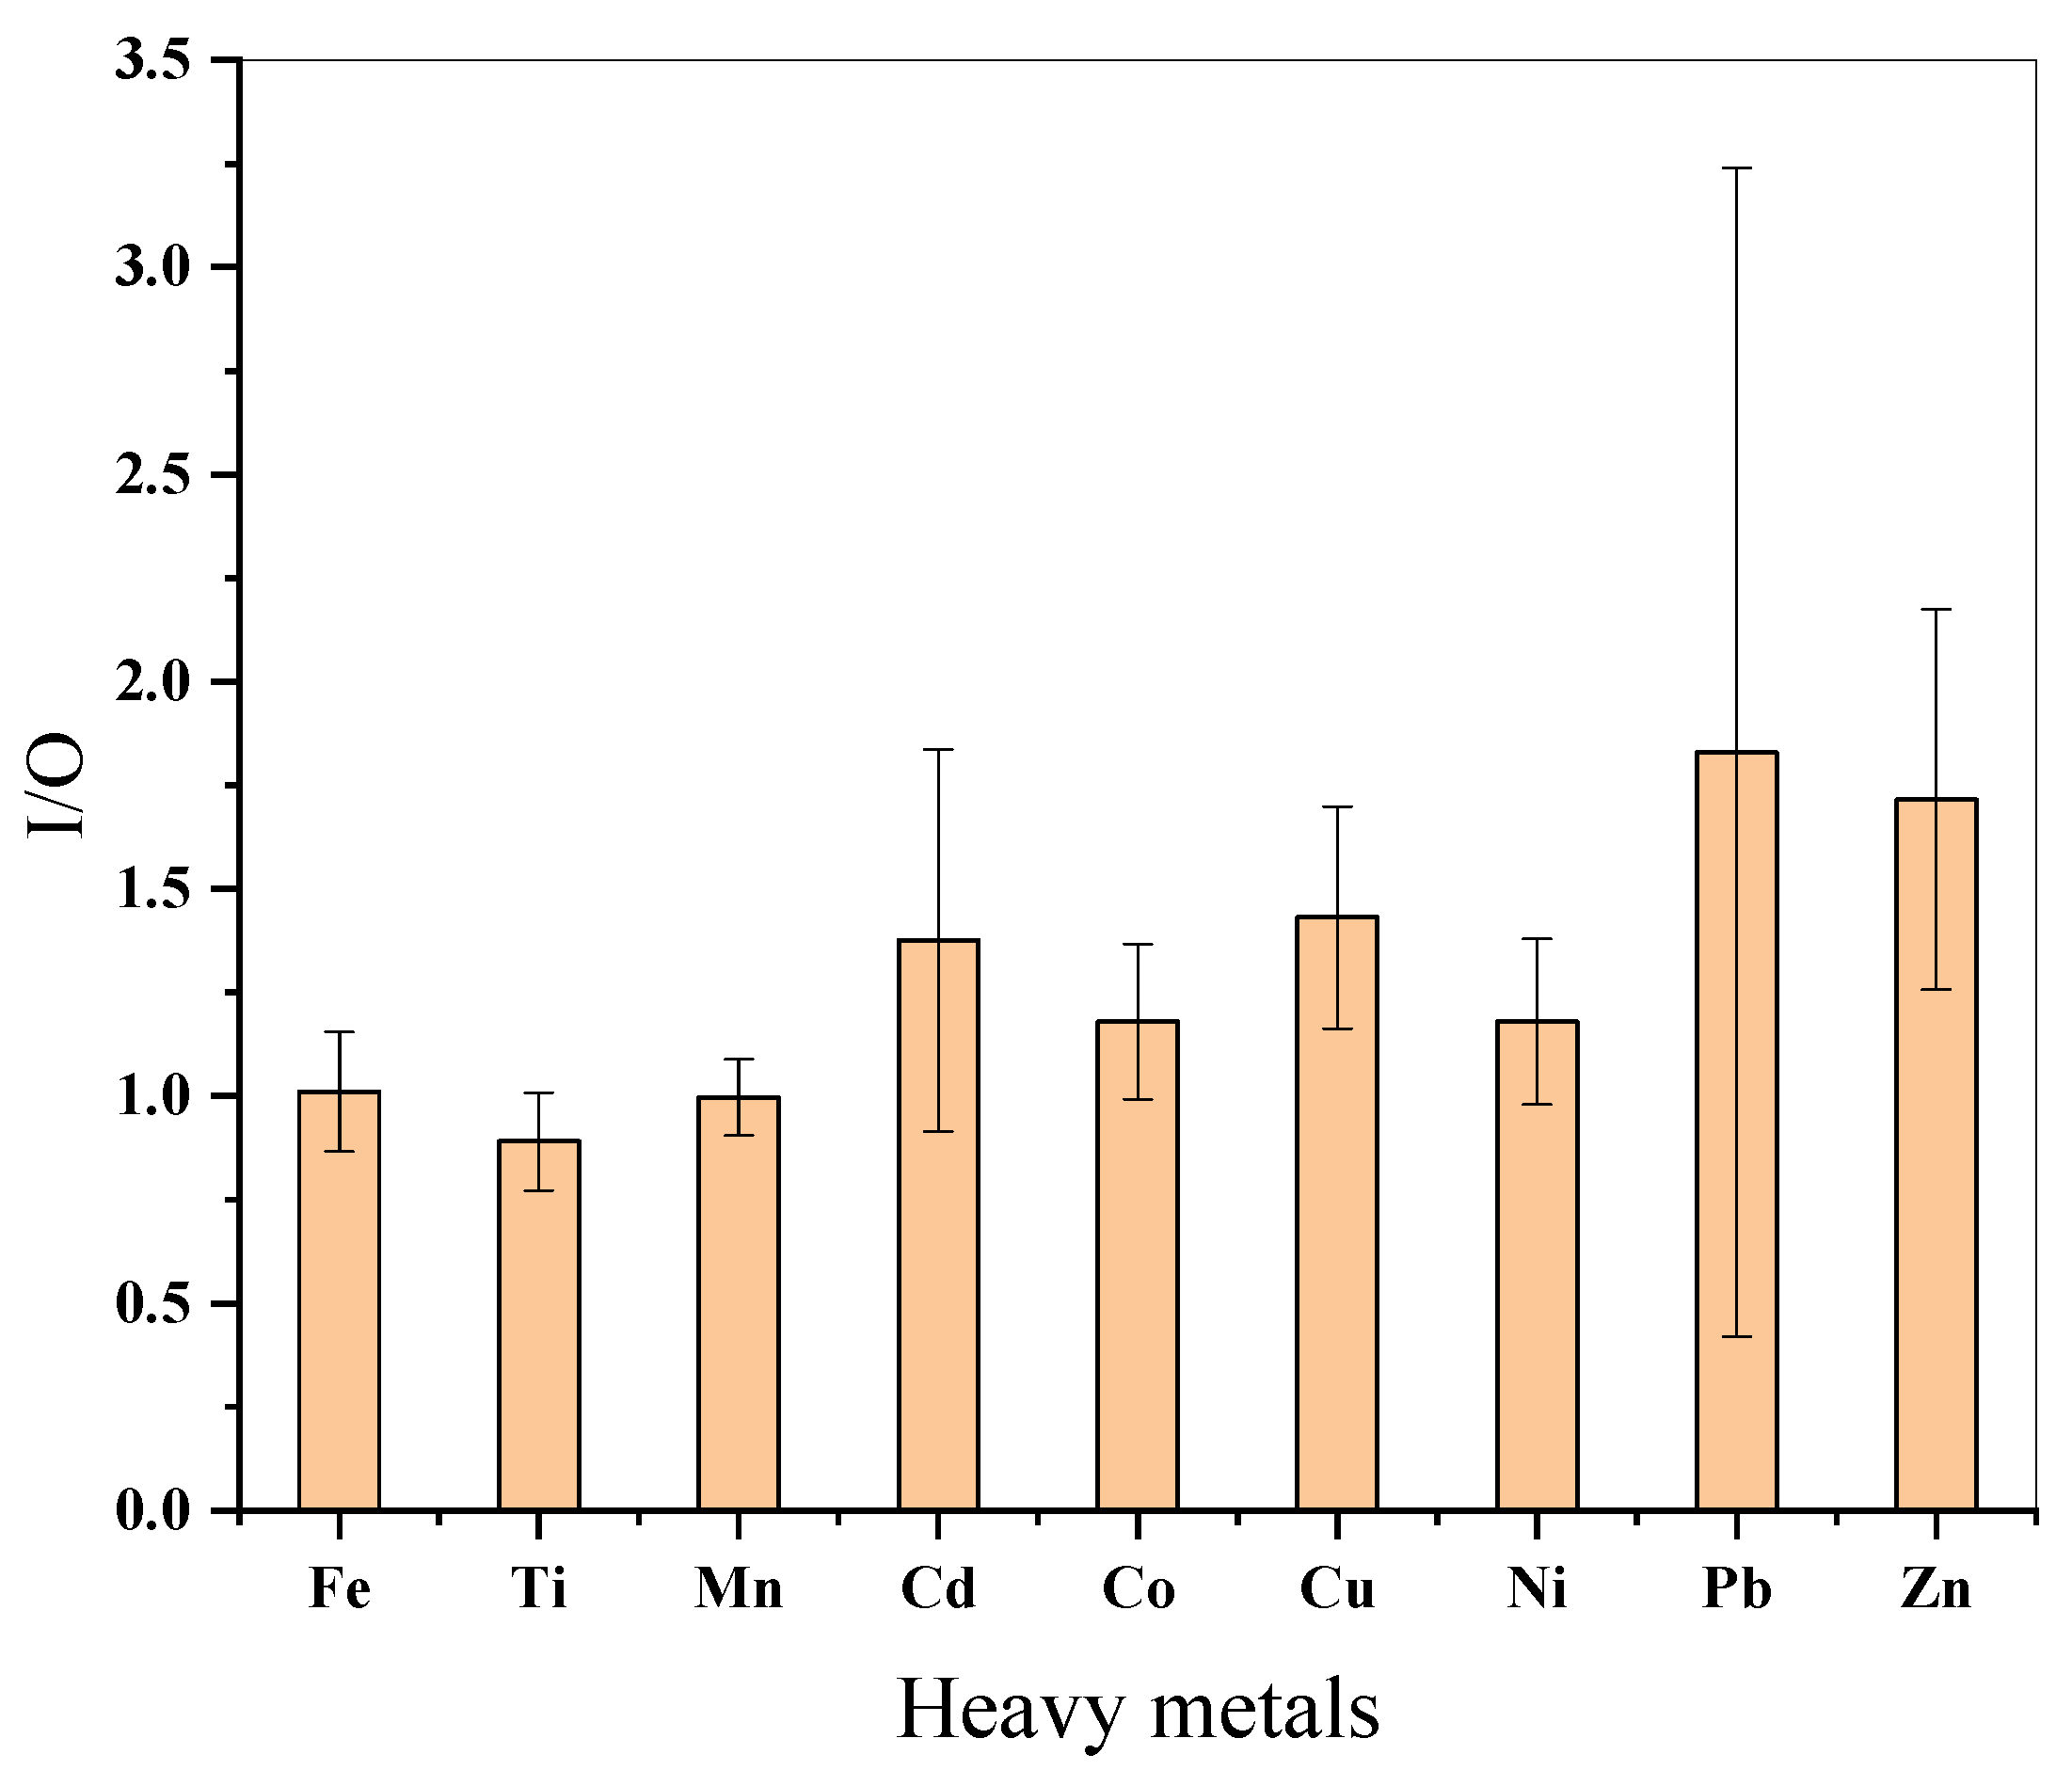
3.1. Heavy Metals Content in Outdoor and Indoor Dust Samples

The mean concentrations of the studied HMs in the dust samples collected from the outdoor and indoor school environment of Riyadh city are presented in Figure 2, Tables S1 and S2. The average HM concentrations in the dust samples collected from outdoor and indoor environments from Riyadh were 6650 and 6520 mg·kg1 for Fe, 3730 and 3230 mg·kg1 for Ti, 441 and 434 mg·kg1 for Mn, 0.065 and 0.080 mg·kg1 for Cd, 3.07 and 3.45 mg·kg1 for Co, 42.2 and 59.2 mg·kg1 for Cu, 13.6 and 15.2 mg·kg1 for Ni, 4.57 and 4.99 mg·kg1 for Pb, and 62.4 and 94.1 mg·kg1 for Zn in outdoor and indoor samples, respectively. Generally, it was observed that the HM concentrations in indoor dust samples were higher than those of outdoor dust samples, except Fe, Ti, and Mn.
The average HM concentrations (especially for Cd, Co, Cu, Ni, Pb, and Zn) in the collected dust samples in our study were lower than most of the reported HM concentrations for different cities. For instance, the concentration of various HMs reported in the following cities were substantially higher compared with the concentrations of HMs found in current study: Changqing—China [27]; Amman—Jordan [35]; Massachusetts—USA [36]; Xi’an—China [37]; Hong Kong—China [38]; London—UK [39], Olso—Norway; Madrid—Spain [40]; and Ottawa—Canada [41].
Figure 3 and Table S3 show the indoor and outdoor ratio (I/O) in the school environments of Riyadh city, which was used to estimate the contribution of outdoor pollution to indoor regions. In this study, I/O was in the range 1.2–1.8. Their order was Pb > Zsn > Cu = Cd > Ni ≥ Co. These results indicated that the outdoor source contributed to the indoor pollution due to opened doors and windows [13]. Another study conducted by Othman et al. [42] reported that the I/O ratio > 1 could be due to the contribution from the resuspension of dust due to school children’s activities. Actually, apart from HMs entering from outdoors, indoor activities inducing gases and particulates released from people, furniture, and other activities—smoking, cleaning, and coal combustion for heating or cooking—could be predominant factors associated with an elevated concentration of metals, such as Pb, Cd, and As in indoor dust [43]. Moreover, increasing I/O ratios could also be the result of ventilation rates due to fans and opened windows, as well as the temperature [44].

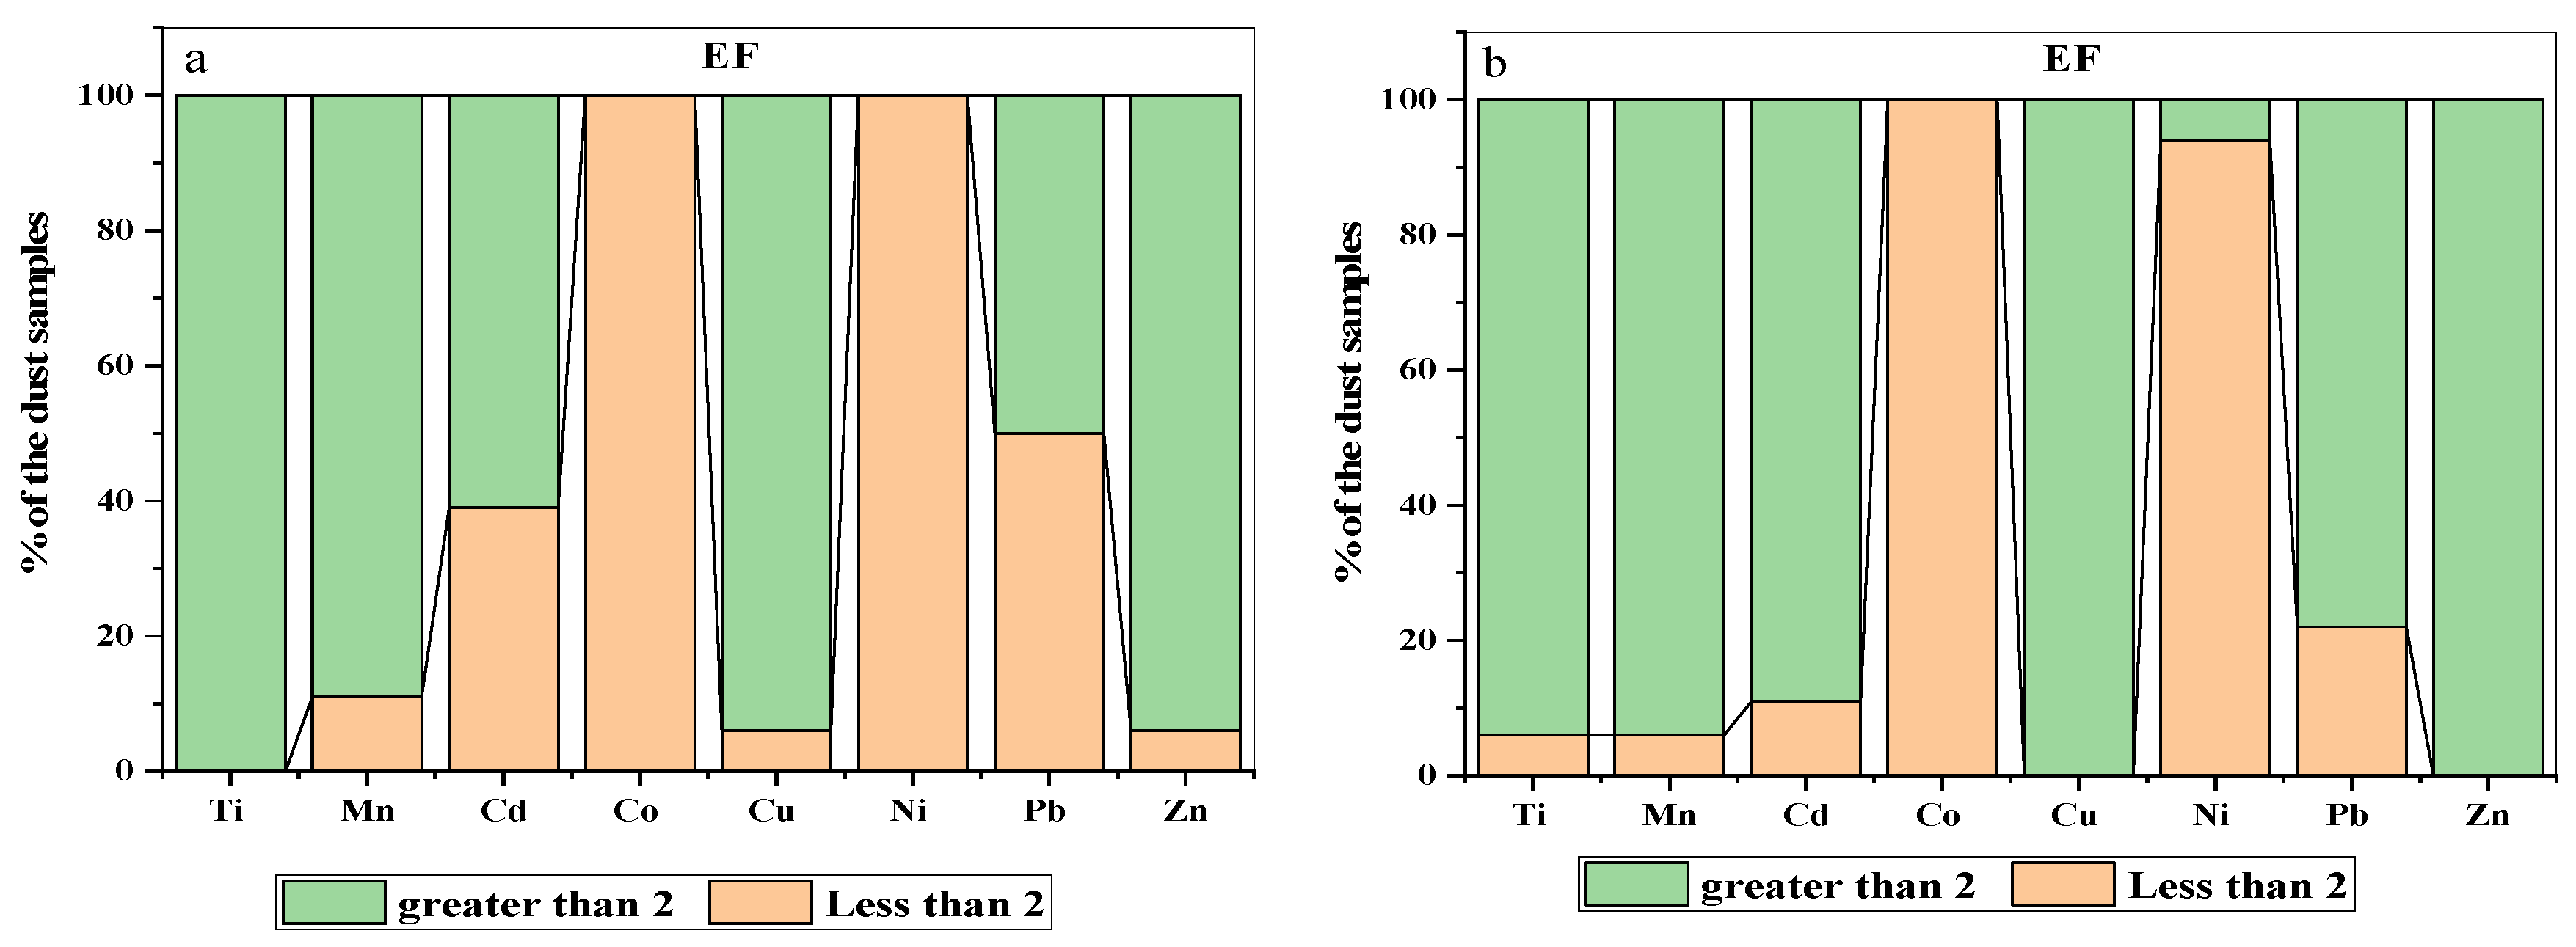
3.2. Pollution and Ecological Indices of Heavy Metals in Dust Samples

The calculated data of the PI, Igeo, EF, Ei, and RI for tested HM in dust samples of outdoor and indoor environments are presented in Table 2 and Tables S4–S7. It was generally observed that the values of pollution and ecological indices of all the analyzed HMs in the indoor dust samples were higher than in the outdoor dust samples, except Fe, Ti, and Mn. The results showed that the maximum, minimum, and mean PI values for most of the HMs of the outdoor and indoor dust samples were ˂1, indicating a low level of pollution with those HMs. On the contrary, in outdoor school sites, the PI values of Cu and Zn in the middle city had 1.2 at site 18 for Cu, and 2.1 and 1.3 for Zn in sites 15 and 18, respectively, indicating a moderate level of pollution. Furthermore, in indoor school sites, the PI values of Cu and Zn had a moderate level of pollution in most sites. Likewise, the maximum, minimum, and mean IPI values of all HMs in the outdoor and indoor dust samples in all school sites were ˂1, indicating a low level of pollution. Moreover, Table 2 shows the values of the Igeo in the outdoor and indoor dust samples. The results indicated that the maximum, minimum, and mean Igeo for outdoor and indoor dust samples were ˂1, indicating no pollution [27]. In addition, the EF values for the outdoor and indoor dust samples were calculated. Based on the mean EF values, it was generally observed that the indoor dust samples had higher EF than that of outdoor dust samples, except Ti and Mn. As a result, the EF values ranged from moderate enrichment for Ti, Mn, Cd, Cu, and Pb, to significant enrichment for Zn (except Cu in the indoor dust samples, as they showed significant enrichment). Among all the metals, the outdoor and indoor sites possessed the highest enrichment for Zn with significant reference. Previously, it has been suggested that the EF index could be applied to determine the source of HMs. The EF values being less than 2 indicated that the HMs originated from natural processes, and some researchers suggest that HMs with EF values less than 2 were not a major contamination concern [45,46]. In this context, the EF values for Co and Ni at all outdoor sites, and Co at all indoor sites, were less than 2, indicating that these metals were not major concerned contaminants. However, the EF values for Cu and Zn in all sites of indoor dust samples were higher than 2, indicating a major contamination concern and anthropogenic influence (Figure 4). There could be multiple anthropogenic sources responsible for the presence of Cu and Zn in dust, including tire tread, yellow paints, brake dust, and emissions from the vehicles.
The assessment of ecological risk potential was investigated in this study for Cd, Cu, Ni, Pb, and Zn. Table 2 shows the single Ei and the integrated potential ecological risk (RI). The results revealed that the maximum, minimum, and mean of RI in all the outdoor and indoor dust samples were characterized by low ecological risk (RI ≤ 150).
Each of the HMs’ pollution index has its own pro and cons and, thus, no single method can be recommended for risk assessment. For instance, PI is easy to employ and contains precise scale; however, it does not include differences in natural processes for its calculations and neglects the available ability of HMs [47]. Likewise, EF can assess the contamination by individual HM and can potentially estimate the anthropogenic impacts of HMs; however, it requires a reference value for its calculation. Similarly, Igeo does not include the consideration for natural geochemical variations, and it does require background values for HMs [47]. Thus, the inappropriate selection of background or reference could lead to misinterpretation of the results. Therefore, great care should be taken when calculating the pollution indices to avoid uncertainty and misinterpretation of the results.

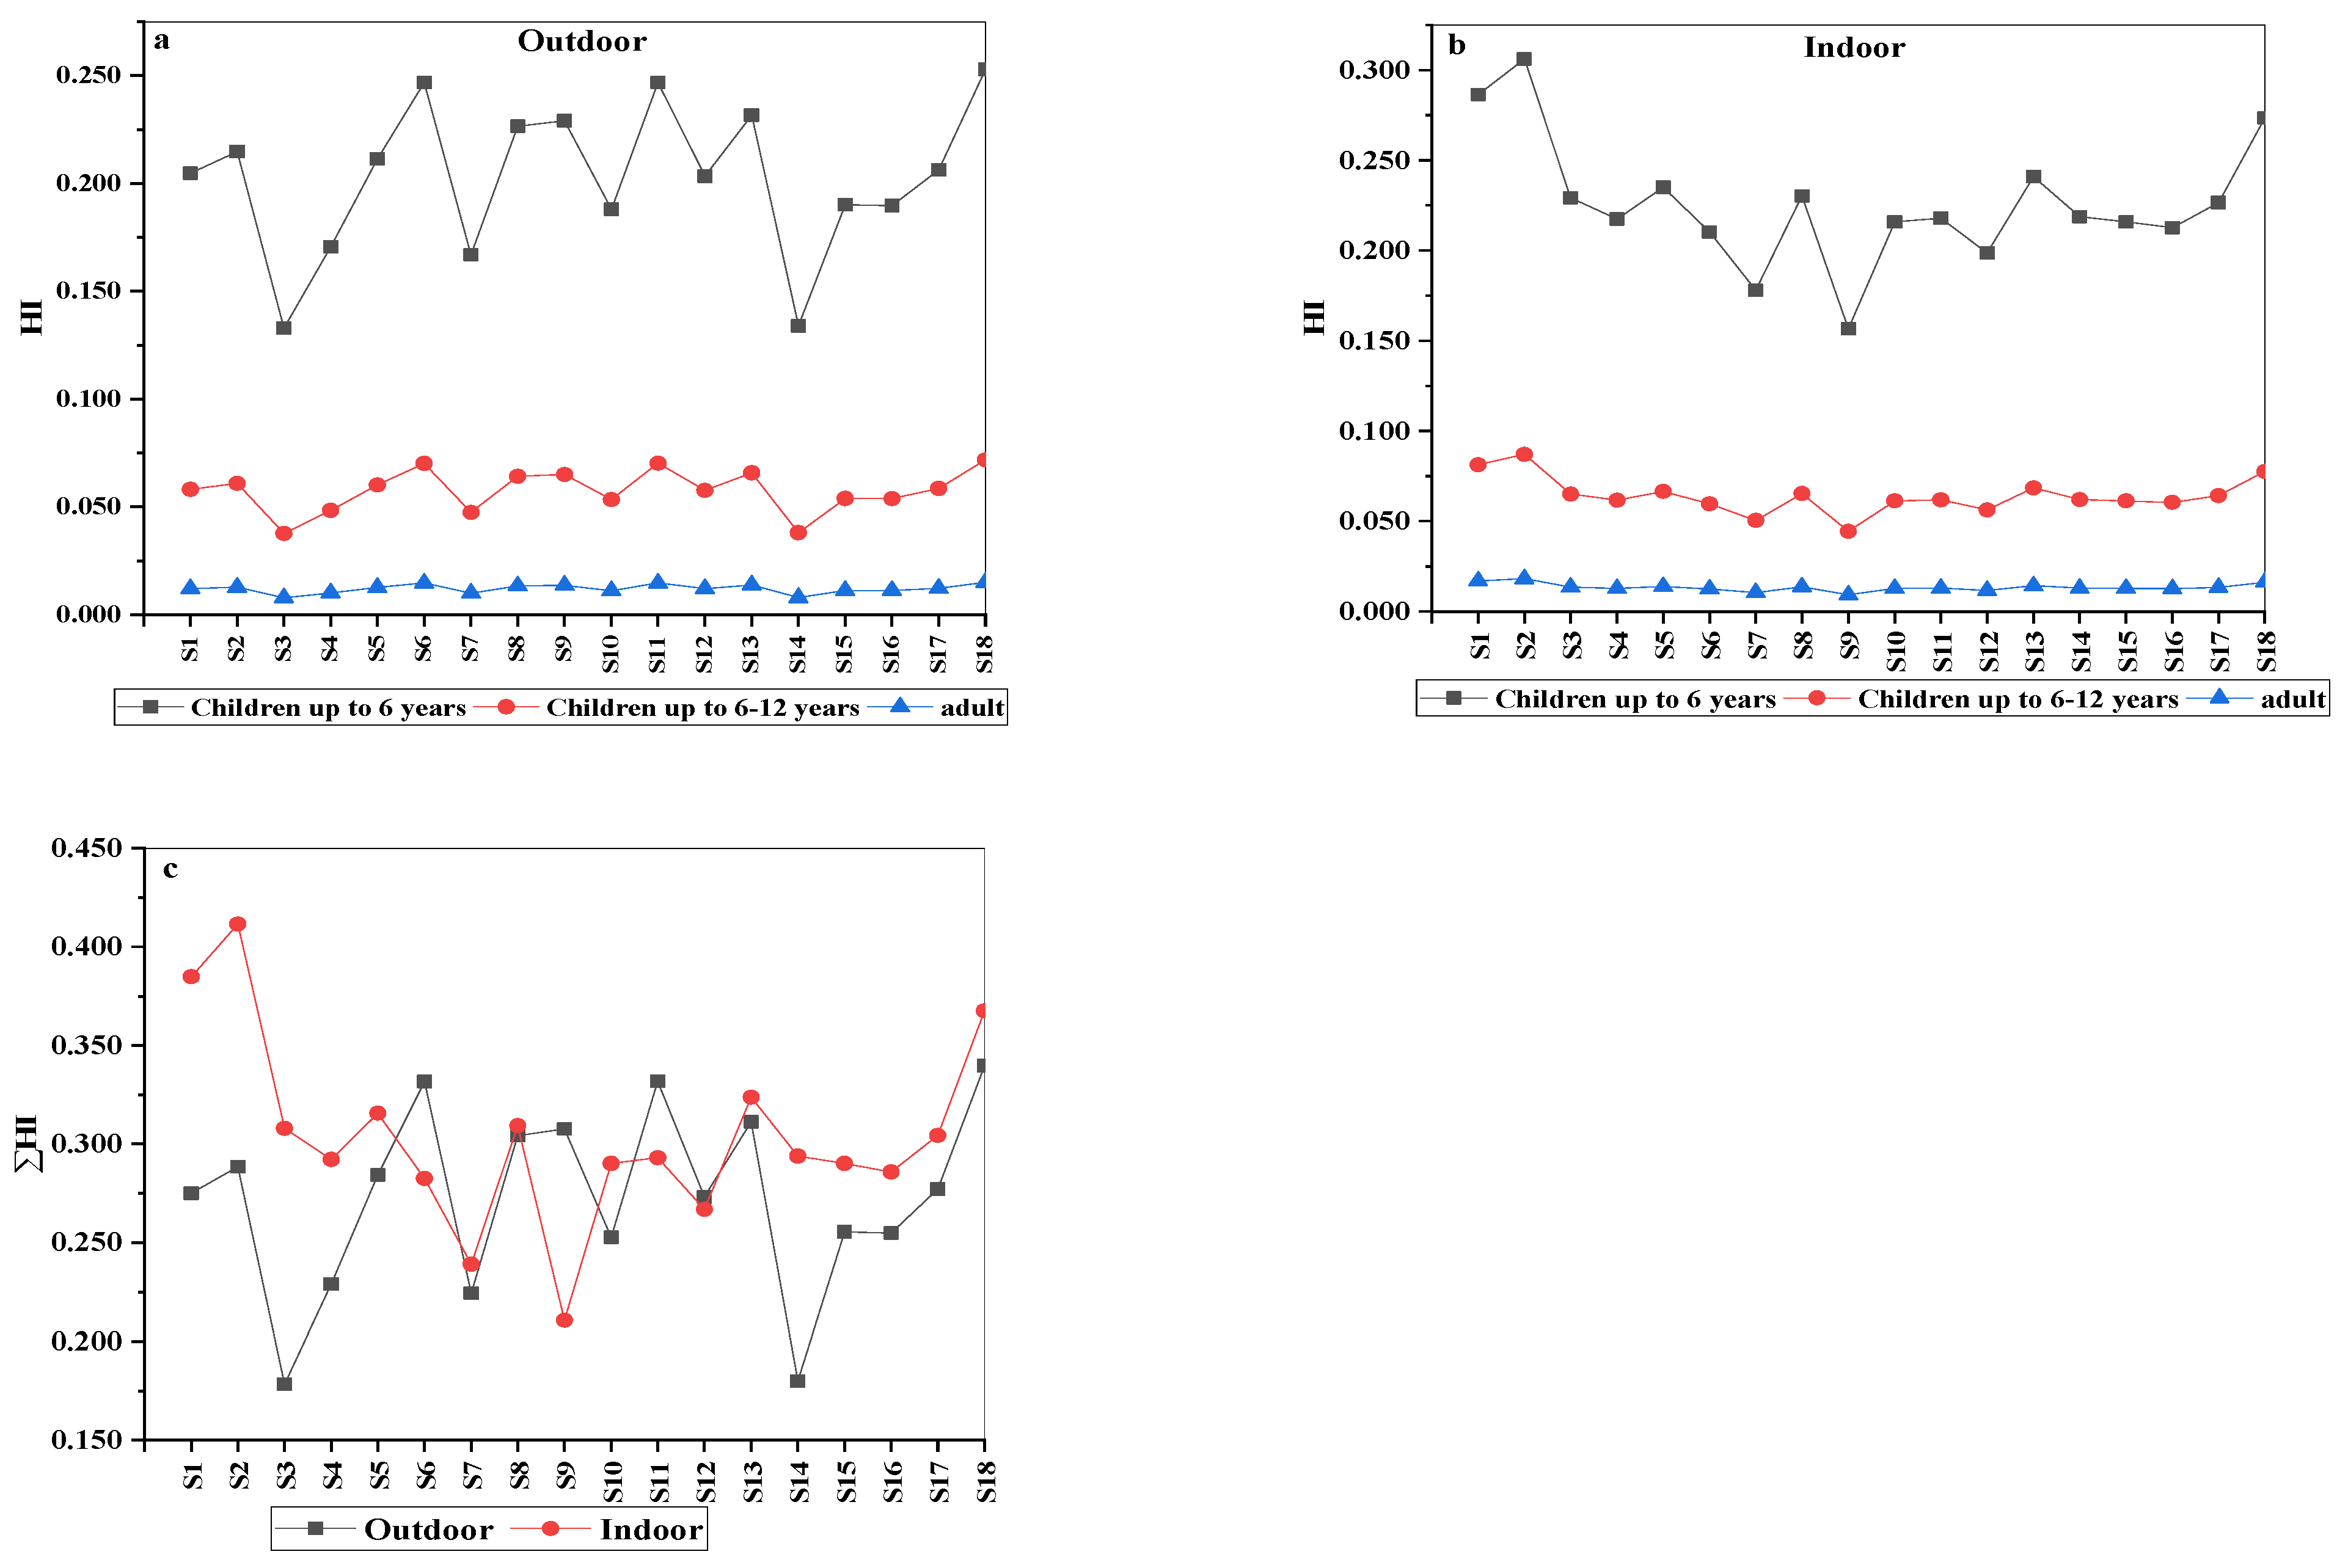
3.3. Human Health Risk Assessment of Heavy Metals of Dust in Outdoor and Indoor Areas

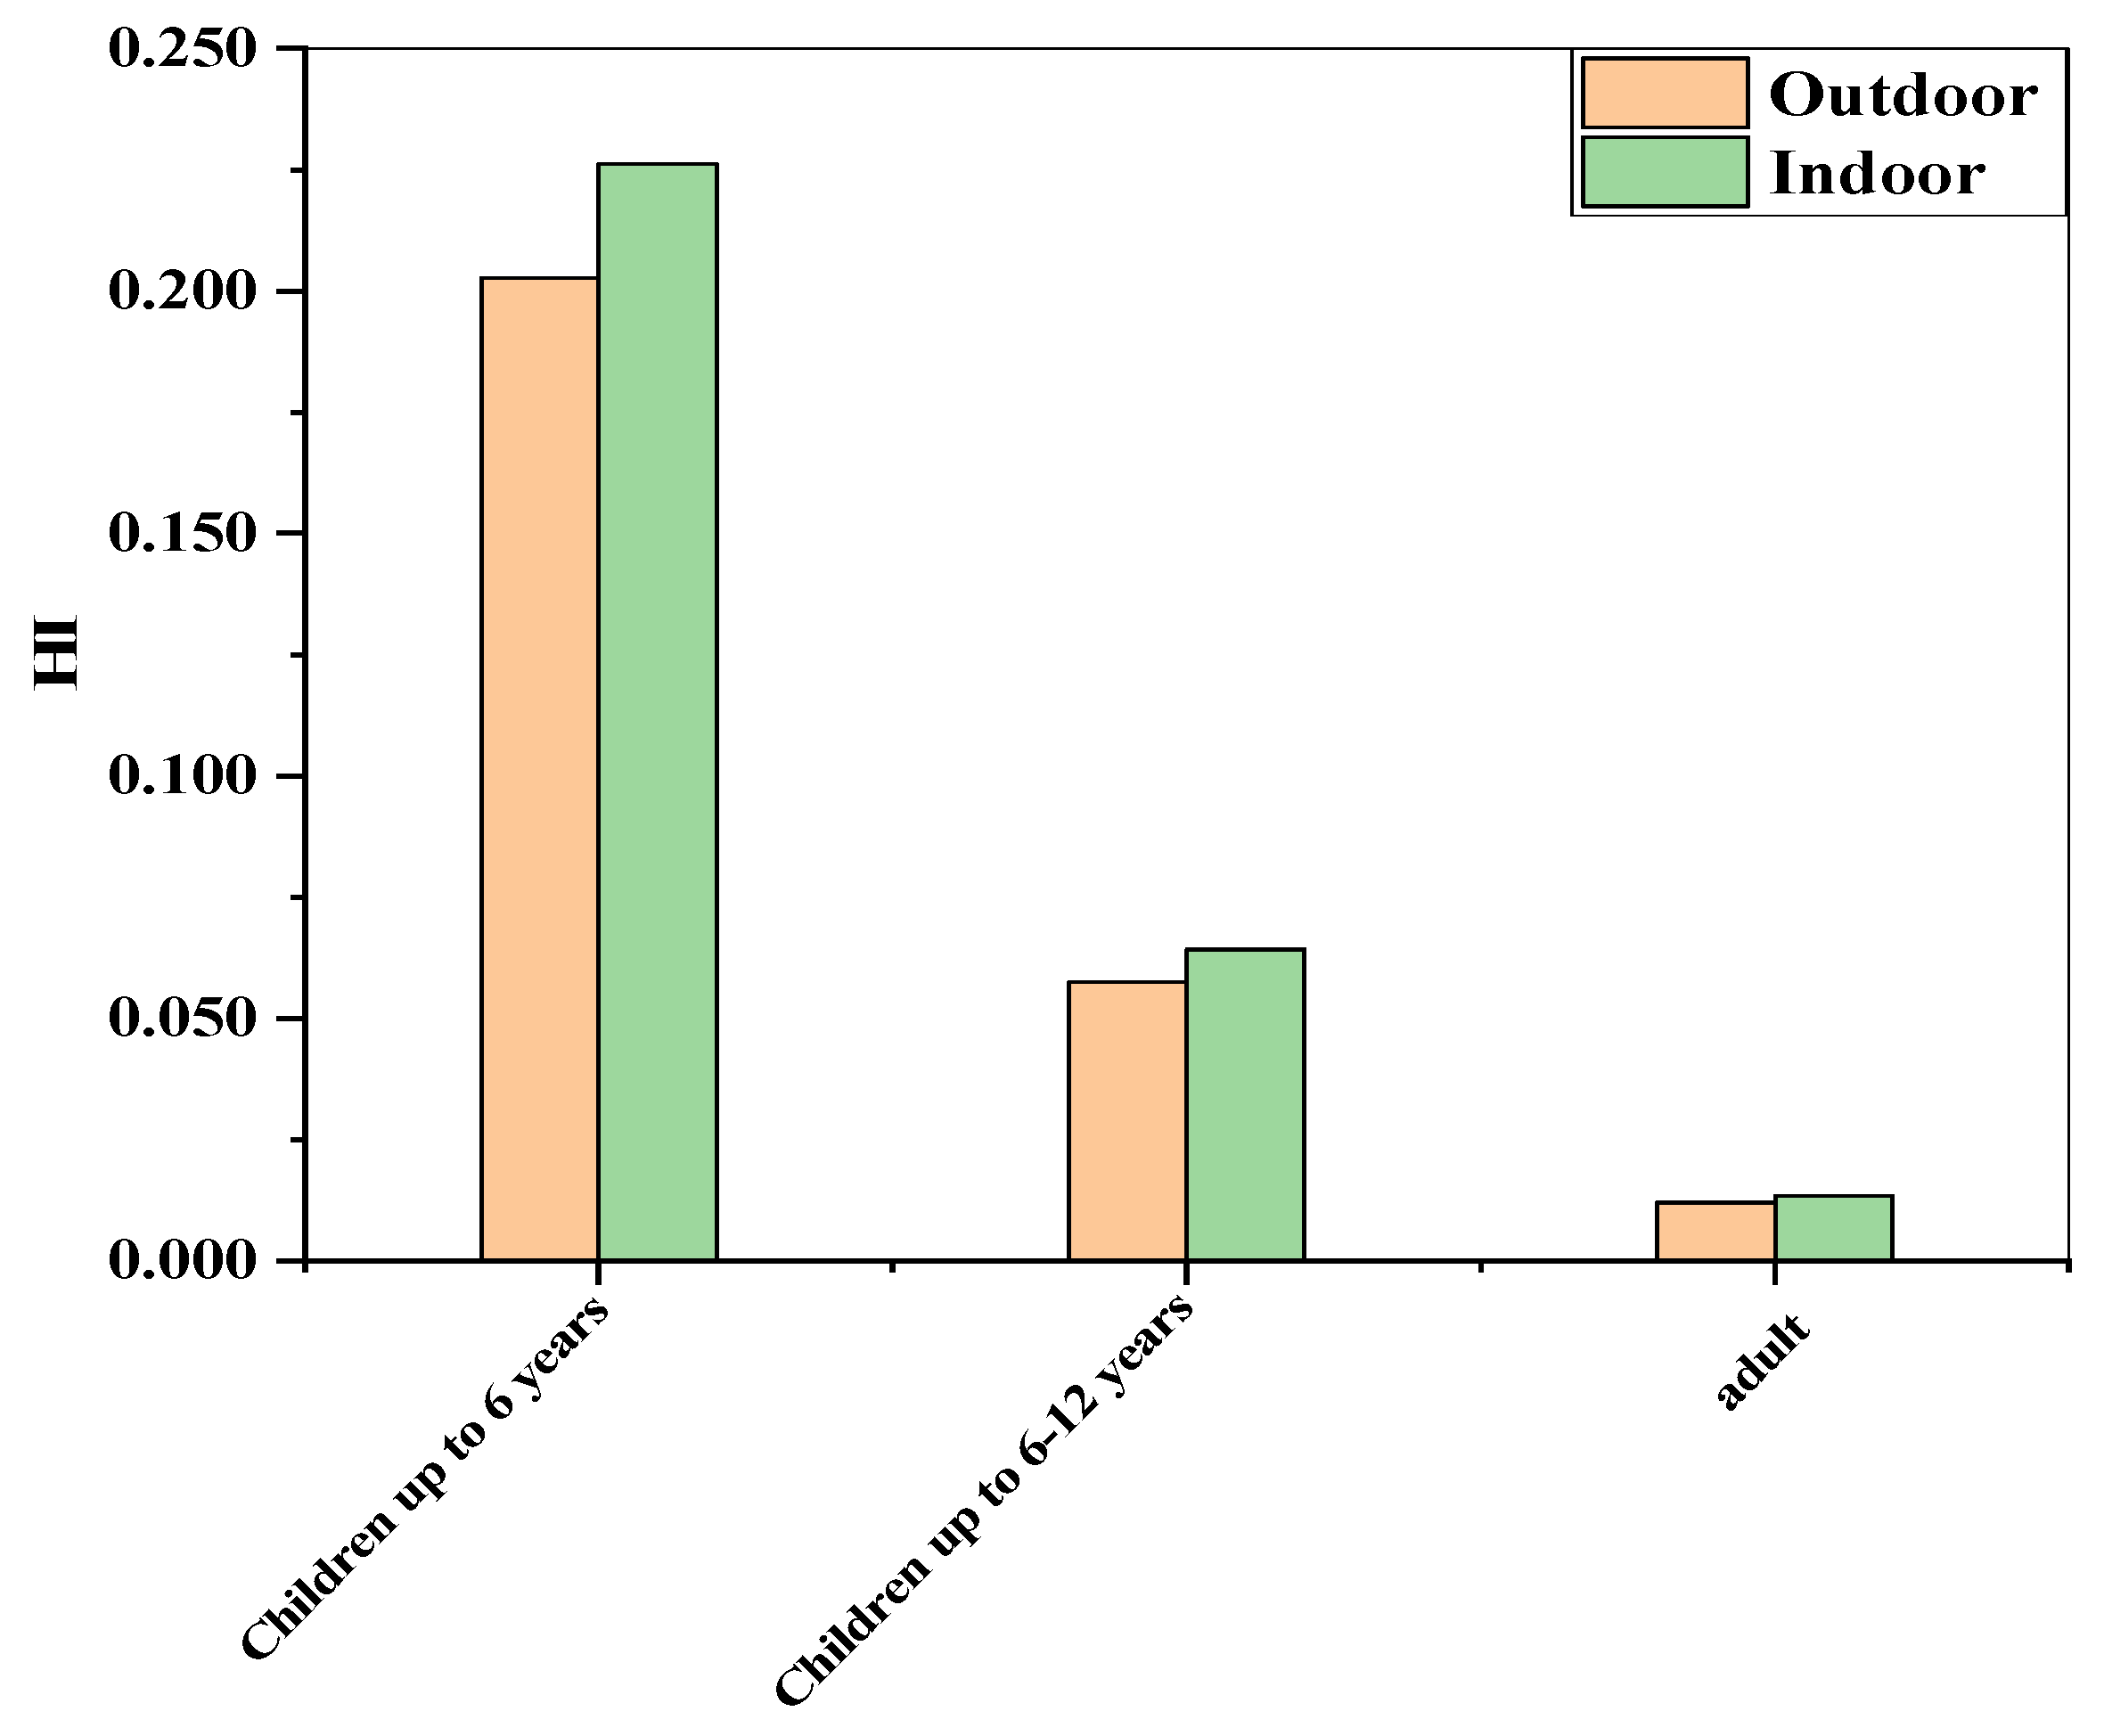
3.3.1. Non-Carcinogenic Hazard

The results showed that the values of hazard quotient (HQ) of HMs in the indoor dust samples were higher than those in the outdoor samples in the exposure pathways for all human categories (except Mn). In addition, the HQ values for the HMs for all outdoor and indoor dust samples were less than 1, suggesting no adverse health effects (Table 3). Othman et al. [42] assessed the health risk associated with Al, Pb, Cr, Fe, Cd, Co, Zn, V, Ni, As, Cu, and Mn in outdoor and indoor dust samples from Kuala Lumpur city center, reporting that the HQ values were <1. Likewise, the HI values for the outdoor and indoor dust samples in the current study were lower than 1, suggesting that there was non-carcinogenic risk (Table 4).
The HI values for the outdoor and indoor dust samples were less than 1 for exposure pathways for all human categories. In addition, the HI values were in the following order: children up to 6 years ˃ children 6–12 years ˃ adult (Figure 5a,b). The values of HI for ∑ human categories for outdoor and indoor dust were less than 1 (Figure 5c). Therefore, it could be speculated that there were no adverse health risks related to cancer.
The average of HI values in outdoor and indoor dust samples are shown in Figure 6. The average of HI values in outdoor and indoor dust were less than 1, suggesting that there is non-carcinogenic risk. However, the average values of HI in indoor dust were higher than outdoor dust for all human categories.
The relationship between the human health risks, ecological risk, and pollution indicators were investigated. Table 5 showed that there was a significant correlation between the Σ HI, pollution indicators (IPI, EF, and Igeo), and ecological risk (RI). As a result, the significant relationships (r) between Σ HI and average (RI), IPI and average Igeo were accounted for 0.71, 0.60, and 0.81, respectively. Therefore, it could be concluded that the characteristics of dust pollution indicators and ecological risk can be used to predict human health risks in such areas.

3.3.2. Carcinogenic Risk

The values of ILCR for children up to 6 years, children 6–12, and adults for Pb in the outdoor and indoor dust for exposure pathways were computed (Table 6). According to the instruction of the American EPA, the lower carcinogenic risk of HMs in a year is less than 1.00 × 10⁻⁶. So, in outdoor and indoor dust, the ILCRing for Pb was less than 1.00 × 10⁻⁶ in all human categories for exposure pathways, indicating a lower risk [48]. On the contrary, the values of ILCRder and of ∑ILCRing+der for Pb were between 1.00 × 10⁻⁶ and 1.00 × 10⁻⁴ in all human categories for exposure pathways, indicating the possibility of a high risk of lifetime cancer development, according to USEPA [48]. Furthermore, the carcinogenic risk from dermal contact was the largest contributor to the total ILCR. Generally, the mean values of carcinogenic ILCR for Pb in indoor dust samples were higher than outdoor dust samples for all exposure pathways and human categories.

4. Conclusions

The current study assessed the levels of heavy metals and associated health risks in outdoor and indoor dust samples collected from 18 different elementary schools’ environments in Riyadh, Saudi Arabia. The investigated heavy metals in indoor dust samples were higher (0.08, 3.45, 59.20, 15.20, 4.99, and 94.10 mg kg−1 for Cd, Co, Cu, Ni, Pb, and Zn, respectively) than those of outdoor dust samples (0.07, 3.07, 42.20, 13.60, 4.57, and 62.40 mg kg−1 for Cd, Co, Cu, Ni, Pb, and Zn, respectively). Our results exhibited that the Zn and Cu in outdoor and indoor dust samples showed moderated pollution, while Cd and Pb showed significantly higher pollution. The mean values of PI, IPI, Igeo, and IR were lower (except Zn with PI = 1.18 in indoor dust), indicating no potential risk to the children in the school environments. The health risks (non-carcinogenic and carcinogenic) estimation revealed that both HQ and HI were lower than 1, suggesting no potential risk to the children exposed to dust in school’s environments. Overall, it was concluded that indoor and outdoor dust samples were moderately contaminated with Zn and Cu, while being highly contaminated with Cd and Pb. Dust storms, industrial activities, and emissions from the heavy traffic could be major sources for higher heavy metal concentrations in dust. Therefore, it is of critical importance to assess the air quality in school environments to avoid any potential health risk of heavy metals to young children in schools. Thus, our findings suggested the potential contamination of dust particles with Cd and Pb, which could lead to serious health concerns in school children when exposed. However, these results cannot be extrapolated to whole Riyadh area due to the limited number of samples examined in this study. Thus, future research may focus on extensive sampling from the whole area to better understand the overall heavy metal pollution, the sources of heavy metals in the atmosphere, and their associated health and ecological risks in Riyadh.

Supplementary Materials

The following supporting information can be downloaded at: https://www.mdpi.com/article/10.3390/atmos13030464/s1, Table S1. The concentrations of the heavy metals in the outdoor dust samples of elementary schools in Riyadh city, Table S2. The concentrations of the heavy metals in the indoor dust samples of schools in Riyadh city, Table S3. The indoor and outdoor ratio (I/O) in dust samples of schools in Riyadh city, Table S4. The calculated data of the PI and IPI for heavy metals of dust samples in outdoor and indoor areas, Table S5. The calculated data of the Igeo for heavy metals in outdoor and indoor dust samples, Table S6. The calculated data of the enrichment factor (EF) for heavy metals in outdoor and indoor dust samples, Table S7. Average the single potential ecological risk (Ei) and integrated potential ecological risk (IR) of outdoor and indoor dust in Riyadh.

Author Contributions

Conceptualization, project administration, supervision, manuscript review and editing, M.O.A.; methodology, designing, conceptualization, investigation, and writing the draft of the manuscript, L.A.A.; samples collection, preparation, and formal analyses, N.M.A.; analyses of heavy metals and writing the draft of the manuscript, M.M.E. and Z.A.; data curation, analyses, and writing the draft of the manuscript, H.A.A.-S.; formal analyses, statistical analyses, and writing of the manuscript, H.A.A.-S. and M.A.; statistical analyses, manuscript review and editing, M.A. All authors have read and agreed to the published version of the manuscript.

Funding

This research was supported by Princess Nourah bint Abdulrahman University Researchers Supporting Project number (PNURSP2022R101), Princess Nourah bint Abdulrahman University, Riyadh, Saudi Arabia.

Institutional Review Board Statement

Not applicable.

Informed Consent Statement

Not applicable.

Data Availability Statement

Data set available on request to corresponding authors.

Acknowledgments

Princess Nourah bint Abdulrahman University Researchers Supporting Project number (PNURSP2022R101), Princess Nourah bint Abdulrahman University, Riyadh, Saudi Arabia.

Conflicts of Interest

The authors declare no conflict of interest.

References

  1. Joshi, U.M.; Vijayaraghavan, K.; Balasubramanian, R. Elemental composition of urban street dusts and their dissolution characteristics in various aqueous media. Chemosphere 2009, 77, 526–533. [Google Scholar] [CrossRef] [PubMed]
  2. Rodríguez, M.C.; Dupont-Courtade, L.; Oueslati, W. Air pollution and urban structure linkages: Evidence from European cities. Renew. Sustain. Energy Rev. 2016, 53, 1–9. [Google Scholar] [CrossRef]
  3. Jang, E.; Do, W.; Park, G.; Kim, M.; Yoo, E. Spatial and temporal variation of urban air pollutants and their concentrations in relation to meteorological conditions at four sites in Busan, South Korea. Atmos. Poll. Res. 2017, 8, 89–100. [Google Scholar] [CrossRef]
  4. Meuser, H. Contaminated Urban Soils; Springer Science and Business Media: Berlin/Heidelberg, Germany, 2010; Volume 18. [Google Scholar]
  5. Lenart-Boroń, A.; Boroń, P. The effect of industrial heavy metal pollution on microbial abundance and diversity in soils-a review. In Environmental Risk Assessment of Soil Contamination; InTech: London, UK, 2014. [Google Scholar]
  6. Alloway, B.J. Heavy Metals in Soil: Trace Metals and Metalloids in Soil and Their Bioavailability; Springer: Reading, UK, 2012. [Google Scholar]
  7. Ogunkunle, C.O.; Ziyath, A.; Opeloyeru, N.; Adeniyi, S.; Fatoba, P. Sources, Transport Pathways and the Ecological Risks of Heavy Metals Present in the Roadside Soil Environment in Urban Areas. Environ. Res. Eng. Manag. 2017, 73, 21–31. [Google Scholar] [CrossRef]
  8. Li, K.; Cui, S.; Zhang, F.; Hough, R.; Fu, Q.; Zhang, Z.; Gao, S.; An, L. Concentrations, Possible Sources and Health Risk of Heavy Metals in Multi-Media Environment of the Songhua River, China. Int. J. Environ. Res. Public Health 2020, 17, 1766. [Google Scholar] [CrossRef] [PubMed] [Green Version]
  9. Chithra, V.S.; Nagendra, S.S. Indoor air quality investigations in a naturally ventilated school building located close to an urban roadway in Chennai, India. Build. Environ. 2012, 54, 159–167. [Google Scholar] [CrossRef]
  10. Chen, R.; Zhou, B.; Kan, H.; Zhao, B. Associations of particulate air pollution and daily mortality in 16 Chinese cities: An improved effect estimate after accounting for the indoor exposure to particles of outdoor origin. Environ. Pollut. 2013, 182, 278–282. [Google Scholar] [CrossRef]
  11. Mohammadyan, M.; Alizadeh-Larimi, A.; Etemadinejad, S.; Latif, M.T.; Heibati, B.; Yetilmezsoy, K.; Abdul-Wahab, S.A.; Dadvand, P. Particulate air pollution at schools: Indoor-outdoor relationship and determinants of indoor concentrations. Aerosol. Air Qual. Res. 2017, 17, 857–864. [Google Scholar] [CrossRef]
  12. Meza-Figueroa, D.; De la O-Villanueva, M.; De la Parra, M.L. Heavy metal distribution in dust from elementary schools in Hermosillo, Sonora, México. Atmos. Environ. 2007, 41, 276–288. [Google Scholar] [CrossRef]
  13. Guo, H.; Morawska, L.; He, C.; Zhang, Y.L.; Ayoko, G.; Cao, M. Characterization of particle number concentrations and PM 2.5 in a school: Influence of outdoor air pollution on indoor air. Environ. Sci. Pollut. Res. 2010, 17, 1268–1278. [Google Scholar] [CrossRef] [Green Version]
  14. Al-Tayeb, N.T.; Jarar, B.M. Dusfall in the city of Ritadh. In Proceedings of the Industrial Air Pollution Symposium, Riyadh, Saudi Arabia, 15–17 November 1993; pp. 66–74. [Google Scholar]
  15. Al-Rajhi, M.A.; Seaward, M.R.D.; Al-Aamer, A.S. Metal levels in indoor and outdoor dust in Riyadh, Saudi Arabia. Environ. Int. 1996, 22, 315–324. [Google Scholar] [CrossRef]
  16. El-Desoky, G.E.; Aboul-Soud, M.A.; Al-Othman, Z.A.; Habila, M.; Giesy, J.P. Seasonal concentrations of lead in outdoor and indoor dust and blood of children in Riyadh, Saudi Arabia. Environ. Geochem. Health 2014, 36, 583–593. [Google Scholar] [CrossRef] [PubMed]
  17. Centers for Disease Control and Prevention. Low-Level Lead Exposure Harms Children: A Renewed Call of Primary Prevention. 2012. Available online: https://www.cdc.gov/nceh/lead/acclpp/final_document_030712.pdf (accessed on 10 January 2022).
  18. Centers for Disease Control and Prevention. Blood Lead Reference Value. 2021. Available online: https://www.cdc.gov/nceh/lead/data/blood-leadreference-value.htm (accessed on 12 January 2022).
  19. Praveena, S.M.; Abdul Mutalib, N.S.; Aris, A.Z. Determination of heavy metals in indoor dust from primary school (Sri Serdang, Malaysia): Estimation of the health risks. Environ. Forensics 2015, 16, 257–263. [Google Scholar] [CrossRef]
  20. Rehman, A.; Liu, G.; Yousaf, B.; Zia-ur-Rehman, M.; Ali, M.U.; Rashid, M.S.; Farooq, M.R.; Javed, Z. Characterizing pollution indices and children health risk assessment of potentially toxic metal(oid) s in school dust of Lahore, Pakistan. Ecotoxicol. Environ. Saf. 2020, 190, 110059. [Google Scholar] [CrossRef] [PubMed]
  21. Kampa, M.; Castanas, E. Human health effects of air pollution. Environ. Pollut. 2008, 151, 362–367. [Google Scholar] [CrossRef]
  22. Rodrigues, S.M.; Römkens, P.F. Human Health Risks and Soil Pollution. In Soil Pollution; Academic Press: Cambridge, MA, USA, 2018; pp. 217–250. [Google Scholar]
  23. Kim, Y.H.; Chung, D.H.; Cho, K.S. Contamination characteristics of heavy metals in indoor, outdoor and playground of schools in the Gochang-Gun, Chonbuk Province of South Korea. J. Korean Earth Sci. Soc. 2006, 27, 73–82. [Google Scholar]
  24. General Authority for Statistics. Statical Yearbook, Saudi Arabia. 2010. Available online: http://cutt.us/RYQBp (accessed on 22 December 2021).
  25. USEPA. Methods 3051, Micro-wave Assisted Acid Digestion of sediments, Sluges, Soil and Oils. In Test Methods for Evaluating Solid Waste, Physical/Chemical Methods, 3rd ed.; U.S. Environmental Protection Agency: Washington, DC, USA, 1994. [Google Scholar]
  26. Chen, T.B.; Zheng, Y.M.; Lei, M.; Huang, Z.C.; Wu, H.T.; Chen, H.; Tian, Q.Z. Assessment of heavy metal pollution in surface soils of urban parks in Beijing, China. Chemosphere 2005, 60, 542–551. [Google Scholar] [CrossRef]
  27. Wang, L.; Lu, X.; Ren, C.; Li, X.; Chen, C. Contamination assessment and health risk of heavy metals in dust from Changqing industrial park of Baoji, NW China. Environ. Earth Sci. 2014, 71, 2095–2104. [Google Scholar] [CrossRef]
  28. Turekian, K.K.; Wedepohl, K.H. Distribution of the metals in some major units of the earth’s crust. Geol. Soc. Am. Bull. 1961, 72, 175–192. [Google Scholar] [CrossRef]
  29. Hakanson, L. An ecological risk index for aquatic pollution control. A sediment logical approach. Water Res. 1980, 14, 75–1001. [Google Scholar] [CrossRef]
  30. Sutherland, R.A.; Tack, F.M.G.; Tolosa, C.A.; Verloo, M.G. Operationally defined metal fractions in road deposited sediment, Honolulu, Hawaii. J. Environ. Qual. 2000, 29, 1431–1439. [Google Scholar] [CrossRef]
  31. USEPA. Integrated Risk Information System (IRIS); U.S. Environmental Protection Agency: Washington, DC, USA, 2011.
  32. Luo, X.S.; Ding, J.; Xu, B.; Wang, Y.J.; Li, H.B.; Yu, S. Incorporating bioaccessibility into human health risk assessments of heavy metals in urban park soils. Sci. Total Environ. 2012, 424, 88–96. [Google Scholar] [CrossRef] [PubMed]
  33. Ferreira-Baptista, L.; De Miguel, E. Geochemistry and risk assessment of street dust in Luanda, Angola: A tropical urban environment. Atmos. Environ. 2005, 39, 4501–4512. [Google Scholar] [CrossRef] [Green Version]
  34. USDOE. The Risk Assessment Information System (RAIS); U.S. Department of Energy’s Oak Ridge Operations Office (ORO): Oak Ridge, TN, USA, 2011.
  35. Al-Khashman, O.A. Determination of metal accumulation in deposited street dusts in Amman, Jordan. Environ. Geochem. Health 2007, 29, 1–10. [Google Scholar] [CrossRef] [PubMed]
  36. Apeagyei, E.; Bank, M.S.; Spengler, J.D. Distribution of heavy metals in road dust along an urban-rural gradient in Massachusetts. Atmos. Environ. 2011, 45, 2310–2323. [Google Scholar] [CrossRef]
  37. Cao, Z.; Yang, Y.; Lu, J.; Zhang, C. Atmospheric particle characterization, distribution, and deposition in Xi’an, Shaanxi Province, Central China. Environ. Pollut. 2011, 159, 577–584. [Google Scholar] [CrossRef]
  38. Yeung, Z.L.L.; Kwok, R.C.W.; Yu, K.N. Determination of multi-element profiles of street dust using energy dispersive X-ray fluorescence (EDXRF). Appl. Radiat. Isot. 2003, 58, 339–346. [Google Scholar] [CrossRef] [Green Version]
  39. Fergusson, J.E.; Ryan, D.E. The elemental composition of street dust from large and small urban areas related to city type, source and particle size. Sci. Total Environ. 1984, 34, 101–116. [Google Scholar] [CrossRef]
  40. De Miguel, E.; Llamas, J.F.; Chacón, E.; Berg, T.; Larssen, S.; Røyset, O.; Vadset, M. Origin and patterns of distribution of trace elements in street dust: Unleaded petrol and urban lead. Atmos. Environ. 1997, 31, 2733–2740. [Google Scholar] [CrossRef]
  41. Rasmussen, P.E.; Subramanian, K.S.; Jessiman, B.J. A multi-element profile of house dust in relation to exterior dust and soils in the city of Ottawa, Canada. Sci. Total Environ. 2001, 267, 125–140. [Google Scholar] [CrossRef]
  42. Othman, M.; Latif, M.T.; Mohamed, A.F. Health impact assessment from building life cycles and trace metals in coarse particulate matter in urban office environments. Ecotoxicol. Environ. Saf. 2018, 148, 293–302. [Google Scholar] [CrossRef] [PubMed]
  43. Cao, S.; Chen, X.; Zhang, L.; Xing, X.; Wen, D.; Wang, B.; Duan, X. Quantificational exposure, sources, and health risks posed by heavy metals in indoor and outdoor household dust in a typical smelting area in China. Indoor Air 2020, 30, 872–884. [Google Scholar] [CrossRef] [PubMed]
  44. Goyal, R.; Khare, M. Indoor–outdoor concentrations of RSPM in classroom of a naturally ventilated school building near an urban traffic roadway. Atmos. Environ. 2009, 43, 6026–6038. [Google Scholar] [CrossRef]
  45. Yongming, H.; Peixuan, D.; Junji, C.; Posmentier, E.S. Multivariate analysis of heavy metal contamination in urban dusts of Xi’an, Central China. Sci. Total Environ. 2006, 355, 176–186. [Google Scholar] [CrossRef] [PubMed]
  46. Ye, C.; Li, S.; Zhang, Y.; Zhang, Q. Assessing soil heavy metal pollution in the water-level-fluctuation zone of the Three Gorges Reservoir, China. J. Hazard. Mater. 2011, 191, 366–372. [Google Scholar] [CrossRef]
  47. Kowalska, J.B.; Mazurek, R.; Gąsiorek, M.; Zaleski, T. Pollution indices as useful tools for the comprehensive evaluation of the degree of soil contamination–A review. Environ. Geochem. Health 2018, 40, 2395–2420. [Google Scholar] [CrossRef] [Green Version]
  48. USEPA. Exposure and Human Health Reassessment of 2,3,7,8-Tetrachlorodibenzo-p-dioxin and Related Compounds. National Academy of Sciences Review Draft; National Center for Environmental Assessment, Office of Research and Development: Washington, DC, USA, 2004. Available online: http://cutt.us/W0CGV (accessed on 16 November 2021).
Figure 1. Dust sampling sites from the outdoor and indoor environment of elementary schools.
Atmosphere 13 00464 g001
Figure 2. The mean concentrations of heavy metals (a) Fe, Ti, and Mn; (b) Cu, Ni, and Zn; (c) Cd, Co, and Pb in the outdoor and indoor dust in school environment.
Atmosphere 13 00464 g002
Figure 3. The indoor and outdoor ratio (I/O) in elementary school environment.
Atmosphere 13 00464 g003
Figure 4. The average percentage of dust samples having enrichment factor (EF) more or less than 2 ((a) outdoor dust samples; (b) indoor dust samples).
Atmosphere 13 00464 g004
Figure 5. The hazard index (HI) average in (a) outdoor dust samples and (b) indoor dust samples, and the (c) total hazard index for Σ human categories in outdoor and indoor dust samples.
Atmosphere 13 00464 g005
Figure 6. The hazard index (HI) average values of outdoor and indoor dust samples in school environment.
Atmosphere 13 00464 g006
Table 1. Definitions of the parameters and values of the variables for the human health risk assessment.
VariableUnitDefinitionValueReferences
ADDingestion
ADDdermal
mg kg−1 day−1The average daily dose contacted through ingestion and dermal In this study
Cdustmg kg−1Concentration of metal in dust In this study
IRingestionmg day−1The ingestion rate of dust200 for children up to 6 years, 100 for children 6–12 years, and 50 for adult[4]
EFdayThe exposure frequency350[31]
EDyearThe exposure duration5 years for children up to 6 years, 6 years for children 6–12 years, and 58 for adult[4]
FunitlessFactor = 10−6 [31]
ABSunitlessthe dermal absorption factor0.03 for AS and 0.001 for other metals[31,32,33]
BWkgaverage body weight16 kg for children up to 6 years, 29 kg from 6 –12 years, and 70 for adult[4]
ATdayaverage lifetimeFor non-carcinogenic = ED × 365
5 × 365 for children up to 6 years, 5 × 365 for children 6–12 years, and 58 × 365 for adult.
For carcinogenic,
70 × 365 for 3 age categories
[4]
SAcm2the exposed skin surface area6980 for children up to 6 years, 10,470 for children 6–12 years, and 18,150 for adult[4]
RFDingestionmg kg−1 day−1Chronic oral reference doseCd = 0.001; Co = 3.00 × 10⁻⁴; Cr = 3.00 × 10⁻³; Cu = 4.00 × 10⁻²; Mn = 1.40 × 10⁻²; Ni = 2.00 × 10⁻²; Pb = 3.50 × 10⁻³; Zn = 3.00 × 10⁻¹[34]
RFDdermalmg kg−1 day−1Chronic dermal reference doseCo = 1.60 × 10⁻²; Cr = 6.00 × 10⁻⁵; Cu = 1.20 × 10⁻²; Cd = 2.50 × 10⁻⁵ (Luo et al., 2012); Mn = 1.84 × 10⁻³; Ni = 5.40 × 10⁻³; Pb = 3.25 × 10⁻⁴; Zn = 6.00 × 10⁻²[31,34]
SFing Cancer slope factorCr = 5.00 × 10⁻¹; Pb = 8.5 × 10⁻³[32,34]
SFder Cancer slope factoreCr = 6.50 × 10⁻³; Pb = 8.50 × 10⁻³[31,32,34]
Table 2. The calculated data of the pollution index (PI), integrated pollution index (IPI), geoaccumulation index (Igeo), enrichment factor (EF), monomial potential ecological risk factor (Ei), and potential ecological risk index (RI) values for heavy metals in outdoor and indoor dust samples in elementary school environment.
FeTiMnCdCoCuNiPbZn FeTiMnCdCoCuNiPbZn
Outdoor dust Indoor dust
Pollution index
Pollution indexIPIPollution indexIPI
Max0.30.90.60.50.11.20.20.92.10.50.30.70.710.11.50.20.82.70.7
Min0.10.40.30.200.40.100.40.30.10.30.40.20.10.50.10.20.60.3
Average0.130.620.490.330.080.60.140.290.780.380.10.50.50.40.10.90.20.31.180.5
Geo−accumulation index
Max−20−1−2−30−2−12−2−1−1−1−31−2−13
Min−4−1−2−4−4−1−4−70−4−2−2−4−4−1−3−31
Average−3−1−2−3−3−1−3−31−4−1−2−3−30−3−32
Enrichment factor
Max6.36.15.30.99.71.66.7155.95.67.91.11226.315
Min2.91.41.40.41.40.60.051.81.91.71.40.34.20.60.74.4
Average54.12.70.651.12.36.44.543.30.76.81.32.69.4
Ecological risk and integrated potential ecological risk
Ei = Ti fiRI Ei = Ti fiRI
Max14.95.814.32.123.929.17.41.14.22.737.5
Min4.62.10.40.10.48.65.52.40.50.90.611.8
Average9.830.71.40.815.7124.20.81.61.219.7
Table 3. Average of hazard quotient (HQ) for pathways exposure and for all categories of human for outdoor and indoor dust samples in elementary school environment.
Hazard Quotient (HQ)
MnCdCoCuNiPbZn
Children up to 6 years
HQingOutdoor3.76 × 10−27.78 × 10−41.22 × 10−11.26 × 10−28.15 × 10−31.56 × 10−22.49 × 10−3
Indoor3.70 × 10−29.57 × 10−41.37 × 10−11.77 × 10−29.10 × 10−31.70 × 10−23.75 × 10−3
HQderOutdoor2.63 × 10−42.17 × 10−48.54 × 10−48.80 × 10−51.42 × 10−31.09 × 10−41.74 × 10−5
Indoor2.58 × 10−42.67 × 10−49.58 × 10−41.23 × 10−41.59 × 10−31.19 × 10−42.62 × 10−5
Children 6–12 years
HQingOutdoor1.04 × 10−22.15 × 10−43.38 × 10−23.48 × 10−32.25 × 10−34.30 × 10−36.86 × 10−4
Indoor1.02 × 10−22.64 × 10−43.79 × 10−24.88 × 10−32.51 × 10−34.70 × 10−31.03 × 10−3
HQderOutdoor2.17 × 10−41.80 × 10−47.07 × 10−47.28 × 10−51.18 × 10−39.01 × 10−51.44 × 10−5
Indoor2.14 × 10−42.21 × 10−47.93 × 10−41.02 × 10−41.31 × 10−39.84 × 10−52.17 × 10−5
Adult
HQingOutdoor2.15 × 10−34.45 × 10−56.99 × 10−37.21 × 10−44.66 × 10−48.92 × 10−41.42 × 10−4
Indoor2.12 × 10−35.47 × 10−57.85 × 10−31.01 × 10−35.20 × 10−49.73 × 10−42.14 × 10−4
HQderOutdoor5.46 × 10−54.52 × 10−51.78 × 10−41.83 × 10−52.96 × 10−42.27 × 10−53.61 × 10−6
Indoor5.38 × 10−55.56 × 10−51.99 × 10−42.57 × 10−53.30 × 10−42.47 × 10−55.44 × 10−6
∑ all categories
HQingOutdoor5.02 × 10−21.04 × 10−31.63 × 10−11.68 × 10−21.09 × 10−22.08 × 10−23.32 × 10−3
Indoor4.94 × 10−21.28 × 10−31.83 × 10−12.36 × 10−21.21 × 10−22.27 × 10−25.00 × 10−3
HQderOutdoor5.35 × 10−44.42 × 10−41.74 × 10−31.79 × 10−42.90 × 10−32.22 × 10−43.53 × 10−5
Indoor5.26 × 10−45.44 × 10−41.95 × 10−32.51 × 10−43.23 × 10−32.42 × 10−45.33 × 10−5
HQing—hazard quotient by ingestion; HQder—hazard quotient by dermal intake.
Table 4. Average hazard index (HI) of dust in outdoor and indoor areas.
Hazard Index (HI)
MnCdCoCuNiPbZnSum
Children up to 6 years
Outdoor3.79 × 10−29.96 × 10−41.23 × 10−11.27 × 10−29.58 × 10−31.57 × 10−22.50 × 10−32.03 × 10⁻¹
Indoor3.73 × 10−21.22 × 10−31.38 × 10−11.78 × 10−21.07 × 10−21.72 × 10−23.78 × 10−32.26 × 10⁻¹
Children 6–12 years
Outdoor1.06 × 10−23.95 × 10−43.45 × 10−23.55 × 10−33.43 × 10−34.39 × 10−37.01 × 10−45.75 × 10⁻²
Indoor1.04 × 10−24.85 × 10−43.87 × 10−24.98 × 10−33.83 × 10−34.80 × 10−31.06 × 10−36.42 × 10⁻²
Adult
Outdoor2.20 × 10−38.97 × 10−57.17 × 10−37.39 × 10−47.62 × 10−49.14 × 10−41.46 × 10−41.20 × 10⁻²
Indoor2.17 × 10−31.10 × 10−48.05 × 10−31.04 × 10−38.51 × 10−49.98 × 10−42.20 × 10−41.34 × 10⁻²
Table 5. Relationship between the characteristics of dust pollution and the human health risks.
Σ HIRI +IPIEF +Igeo +
Σ HI1.00
RI +0.71 *1.00
IPI0.60 *0.74 *1.00
EF +0.300.40 *0.40 *1.00
Igeo +0.81 *0.82 *0.89 *0.40 *1.00
+—average; *—significant; HI—hazard index; RI—potential ecological risk index; IPI—integrated pollution index; EF—enrichment factor; Igeo—geoaccumulation index.
Table 6. Average incremental lifetime cancer risk (ILCR) for Pb of dust in outdoor and indoor areas.
Pb
Children Up to 6 yearsChildren 6–12 YearsAdult
ILCRingOutdoor3.32 × 10−81.10 × 10−82.20 × 10−86.61 × 10⁻⁸
Indoor3.62 × 10−81.20 × 10−82.40 × 10−87.22 × 10⁻⁸
ILCRderOutdoor3.20 × 10−63.18 × 10−67.73 × 10−61.41 × 10⁻⁵
Indoor3.50 × 10−63.47 × 10−68.44 × 10−61.54 × 10⁻⁵
ILCRing+derOutdoor3.24 × 10−63.19 × 10−67.75 × 10−61.42 × 10⁻⁵
Indoor3.53 × 10−63.48 × 10−68.46 × 10−61.55 × 10⁻⁵
Publisher’s Note: MDPI stays neutral with regard to jurisdictional claims in published maps and institutional affiliations.

