Article

Evaluation of the Effectiveness of Common Indoor Plants in Improving the Indoor Air Quality of Studio Apartments

1
Transportation Environmental Research Team, Korea Railroad Research Institute (KRRI), Uiwang-si 16105, Korea
2
Transportation System Engineering, University of Science & Technology (UST), Daejeon 34113, Korea
3
Kumoh National Institute of Technology, Gumi 39177, Korea
*
Author to whom correspondence should be addressed.
Atmosphere 2022, 13(11), 1863; https://doi.org/10.3390/atmos13111863
Submission received: 11 October 2022 / Revised: 28 October 2022 / Accepted: 7 November 2022 / Published: 9 November 2022
(This article belongs to the Section Air Pollution Control)

Abstract

:
People spend most of their time indoors, and prolonged exposure to pollution can harm their health. The degradation of indoor air quality (IAQ) has raised serious issues. Botanical biofilters are an exciting solution for lowering indoor air pollution. However, plants cultivated inside under low light intensity (10–50 μmole PAR m−2 s−1) generate CO2 in the indoor atmosphere. Combining C3 (Calvin Cycle) and Crassulacean Acid metabolism (CAM) plants may be able to address this problem by lowering CO2 emission levels and enhancing the efficiency of pollution removal by removing the primary indoor air pollutants from actual interior settings, including carbon dioxide (CO2), formaldehyde (HCHO), particulate matter (PM2.5 and PM10), and total volatile organic compounds (TVOCs). As a result, a successful botanical biofilter made of several plants was researched. Indoor plants can phytoremediate a variety of indoor contaminants. However, just a few studies have demonstrated its efficacy in practical contexts. Due to the harsh winter, apartments in South Korea are frequently closed, necessitating the measurement of interior air pollution concentration in real-time. Four apartments (APT I through APT IV) with various ventilation and indoor plant setups were selected for this investigation. Various combinations of indoor environments (ventilation, low light) and a combination of C3 and CAM indoor plants as a botanical biofilter were used to study the sites over two months. Current research indicates that combining a botanical biofilter with ventilation can reduce levels of CO2, TVOCs, HCHO, PM2.5, and PM10 by 76%, 87%, 75%, 52%, and 51%, respectively. The current study concluded that different indoor potted plants provide an effective, affordable, self-regulating, sustainable option for enhancing indoor air quality and, consequently, human well-being and productivity in small, cramped places.

1. Introduction

Long-term research has been conducted on the harmful effects of exposure to outdoor air pollution. Numerous studies have connected various health effects to both short-term and long-term exposure to particulate matter (PM) with a diameter of less than 10 µm (PM10) and particulate matter with a diameter of less than 2.5 µm (PM2.5), VOCs, and formaldehyde [1,2,3,4,5,6]. A lesser amount of research has been conducted on exposure to indoor air pollution. Personal exposure depends on various factors, including behaviors that could increase the concentrations of the pollutants of concern, the amount of time spent in the environment, and the methods used to remove the pollutants. Since most people spend roughly 90% of their time indoors and at home, interior spaces are expected to be the source of the greatest exposure [7,8]. The bulk of indoor contaminants originates from outdoor air, which generally has an impact on the quality of indoor air. Infiltrations from the outdoors, emissions from interior-specific sources, and particle production from indoor chemistry are the dynamics causing elevated indoor air pollution levels [9,10]. Furthermore, several indoor sources and occupant activities include furniture, paints, varnishes, waxes, carpets, solvents, cleaning supplies, office equipment including copiers and printers, gas cooktops, and cigarettes that generate potentially harmful gases and particulate matter (PM) [11]. Carbon monoxide and dioxide (CO and CO2), volatile organic compounds (VOCs; for example, formaldehyde and benzene), nitrogen oxides (NO and NO2), and polycyclic aromatic hydrocarbons (PAHs) are among the air pollutants that are commonly found in various indoor situations [12]. Given that individuals in developed nations spend more than 80% of their time indoors, one of the top issues for human health today is the buildup of air pollutant concentrations to dangerous levels, particularly in new energy-efficient yet airtight homes [13]. The primary sources of interior PM pollution include tenant activities such as cooking, lighting candles, incense, and almost any external PM pollution that enters the building through the ventilation systems. Burning incense during religious ceremonies, yoga, and meditation can have a tremendous impact on the indoor atmosphere because it has been a regular practice for decades. According to research, eco-friendly incense releases more polycyclic aromatic hydrocarbons and fine particulate matter (PM2.5) than conventional incense [14]. This increases the risk of cardiovascular diseases and seriously impacts the human lungs [15].
To maintain superior indoor environment quality (IEQ), which primarily focuses on occupant thermal comfort, buildings are frequently outfitted with air conditioning and mechanical ventilation (ACMV) systems. Modern technology has significantly improved the air filtration component of air conditioning (AC) systems, making it more effective in improving indoor air quality (IAQ) and offering optimum thermal comfort to building occupants. However, the high energy consumption of AC systems unintentionally increases greenhouse gas emissions that could impact global warming. The fresh air entering residential buildings is typically insufficient because they only have split air conditioners and no mechanical ventilation systems [16].
As in other cold nations, Korea experiences severe wintertime cold and snowfall. To keep indoor air clean and conserve energy for air conditioning, it is typical for residents to seal window and door openings. The sealing of windows and doors results in the accumulation of indoor pollutants, air stagnation, and a decline in IAQ. To increase IAQ and supply fresh air inside buildings, air purifiers are typically employed along with the operation of ACs to improve IEQ. Although air purifiers’ initial performance appears compelling, Ref. [17] reported that with time, dust particles could build up and clog air filters, decreasing the air purifier’s single-pass efficiency (SPEs) [18].
Removing VOCs and converting these harmful substances into a carbon source for plant and microbial growth are both highly prospective outcomes of phytoremediation [19,20,21,22]. It has been shown that several plant species have a high clearance rate for contaminants such as formaldehyde and benzene. Active botanical biofilter (ABB) systems effectively filter indoor air pollutants and have been identified as a way to improve IAQ in buildings [23].
The Ministry of Environment (MOE) passed the Indoor Air Quality Management Law in Multi-use Facilities in May 2004 to fully handle the IAQ issue. Before occupancy, IAQ data in residences must be measured and made available to the public. The MOE released updated housing guidelines for indoor air quality (IAQ) in December 2005. Additionally, contractors who build or remodel apartment buildings with more than 100 units must install ventilation systems with an air ventilation performance (air exchange rate) of over 0.7 times per hour, according to an update to the Ministry of Construction and Transportation’s Regulations on the Facility Standards of Buildings. Despite this development, a Korean Consumer Agency investigation found that 14.5% of survey respondents had sick-house syndrome [11], and lawsuits against building companies based on poor indoor air quality have continued. Additional fundamental investigations are required to comprehend better the development of IAQ improvement to combat indoor air pollution, and botanical biofilters have gained popularity [24,25]. Between phyto- and bio-degradation, active airflow through the plant layer and growth media layer with microorganisms can increase the effectiveness of removing BTEX [26]. Rhizospheric bacteria can increase pollutant removal effectiveness in addition to plants [27]. Additionally, some contaminants can be absorbed by the chemical and physical characteristics of the plant development media [28]. Therefore, using active botanical biofilters instead of standard passive potted plants delivers a better removal efficiency [24].
Even while botanical biofilters may effectively remove indoor air pollution, plants can often create a high concentration of carbon dioxide (CO2) during plant respiration, especially when inadequate light conditions are present (indoor settings) [17]. According to Satish et al. [29], considerable symptoms are produced by CO2 at 4.5–9 g m−3, and several human symptoms and diseases are caused by high CO2 concentrations over 1.08 g m−3 [29]. The normal CO2 guideline, according to ASHRAE (2011), shouldn’t be more than 1.8 g m−3. Therefore, it is crucial to consider the CO2 generated by plants in low-light situations before utilizing a botanical biofilter. Numerous studies have shown that plants can effectively absorb CO2 when they receive adequate light, but they cannot do so when they do not receive enough light [29]. A combination of C3 and CAM plants in an efficient botanical biofilter can be a different approach to the issue of CO2 production by botanical biofilters under poor light support or indoor settings. According to botany principles, CAM plants generally absorb CO2 at night, while C3 plants can leak CO2 into the atmosphere.
Our study examined the impacts of CAM and C3 plants, which are frequently implemented to reduce indoor air pollution in real-life scenarios. The objective was to investigate the concentration of significant indoor pollutants throughout the winter when interior household activities are typically conducted with windows closed due to the cold outside, including CO2, PM2.5, PM10, TVOC, and HCHO. The effectiveness of the combination of these plants in lowering indoor air pollution was also monitored.

2. Materials and Methods

2.1. Study Location

Uiwang is a city in Gyeonggi Province, South Korea (Figure S1). It lies just South of Seoul. Uiwang has an area of approximately 53.46 km2 and a total population of 158,482. The study was carried out in a typical Uiwang studio apartment home, which was a one-room, 10-pyeong-squared apartment with a kitchen slab and bathroom slab shared in the same living space (View Figure 1). To conduct this study, four apartments (I-IV) were considered (Table 1): APT I (without ventilation and interior plants), APT II (without ventilation, with indoor plants), APT III (with ventilation, without indoor plants), and APT IV (with ventilation and indoor plants). Additionally, an ambient air sample site (outdoor) was chosen to track changes in the external environment. All the selected units were single-occupancy, and each had a window. People were instructed to keep a record detailing all indoor activities and the times they opened windows. The ventilation type in the apartments was natural ventilation. The precise experimental approach was as stated below. Before each sample’s measurement began, equipment was placed at the measuring location in the respective apartments, and after briefly explaining the experiment to the occupants, a questionnaire was given to each of them. Prior to the trial, the indoor air quality in each apartment was actually tested for 48 h in 5-min increments to obtain insights into the occupant’s activity and indoor pollution levels. All experiments were, in theory, carried out with the door closed and the heating on as needed, but the residents were free to open and close the windows as needed to maintain their thermal comfort. However, due to the extremely cold weather in South Korea, the tenants in the apartments did not open their windows during the requested times.

2.2. Plant Preparation

Sansevieria kirkii, Sansevieria trifasciata, Monstera deliciosa, Zamiifolia, and Portulacaria afra (Table 2), five commonly used ornamental plants with comparable age, sizes, and forms were bought from plant stores in South Korea. These plant species are frequently grown indoors. Plants having a total leaf area of 500 cm2 that were pest-free were retrieved from the apartments to gauge how effectively they removed the indoor air pollutants. A LICOR LI-250A Light Meter was used to measure the light intensity of a fluorescent lamp (400–700 nm), which was 50 µmole PAR (Photosynthetically Active Radiation) m−2 s−1. The plant development medium consisted of a potting mixture with a moisture content of 1.1 to 1.4%, a water retention capacity of 9.1 to 10.2 cm m−1, and a composition of 58% sand, 28% silt, and 14% clay. Typically, this substance is used to grow decorative plants. The porosity of the potting material was in the range of 36–38%. All plants were cultivated in their native environments at 30–32 °C and 12/12 h day/night before the experiment.
Sansevieria trifasciata, Sansevieria kirkii, and Zamiifolia were maintained close to the window, while the Monstera and jade plants were stored on the opposite side. Because there is no separation between the apartments, we can infer that all of the plants were in the same room.

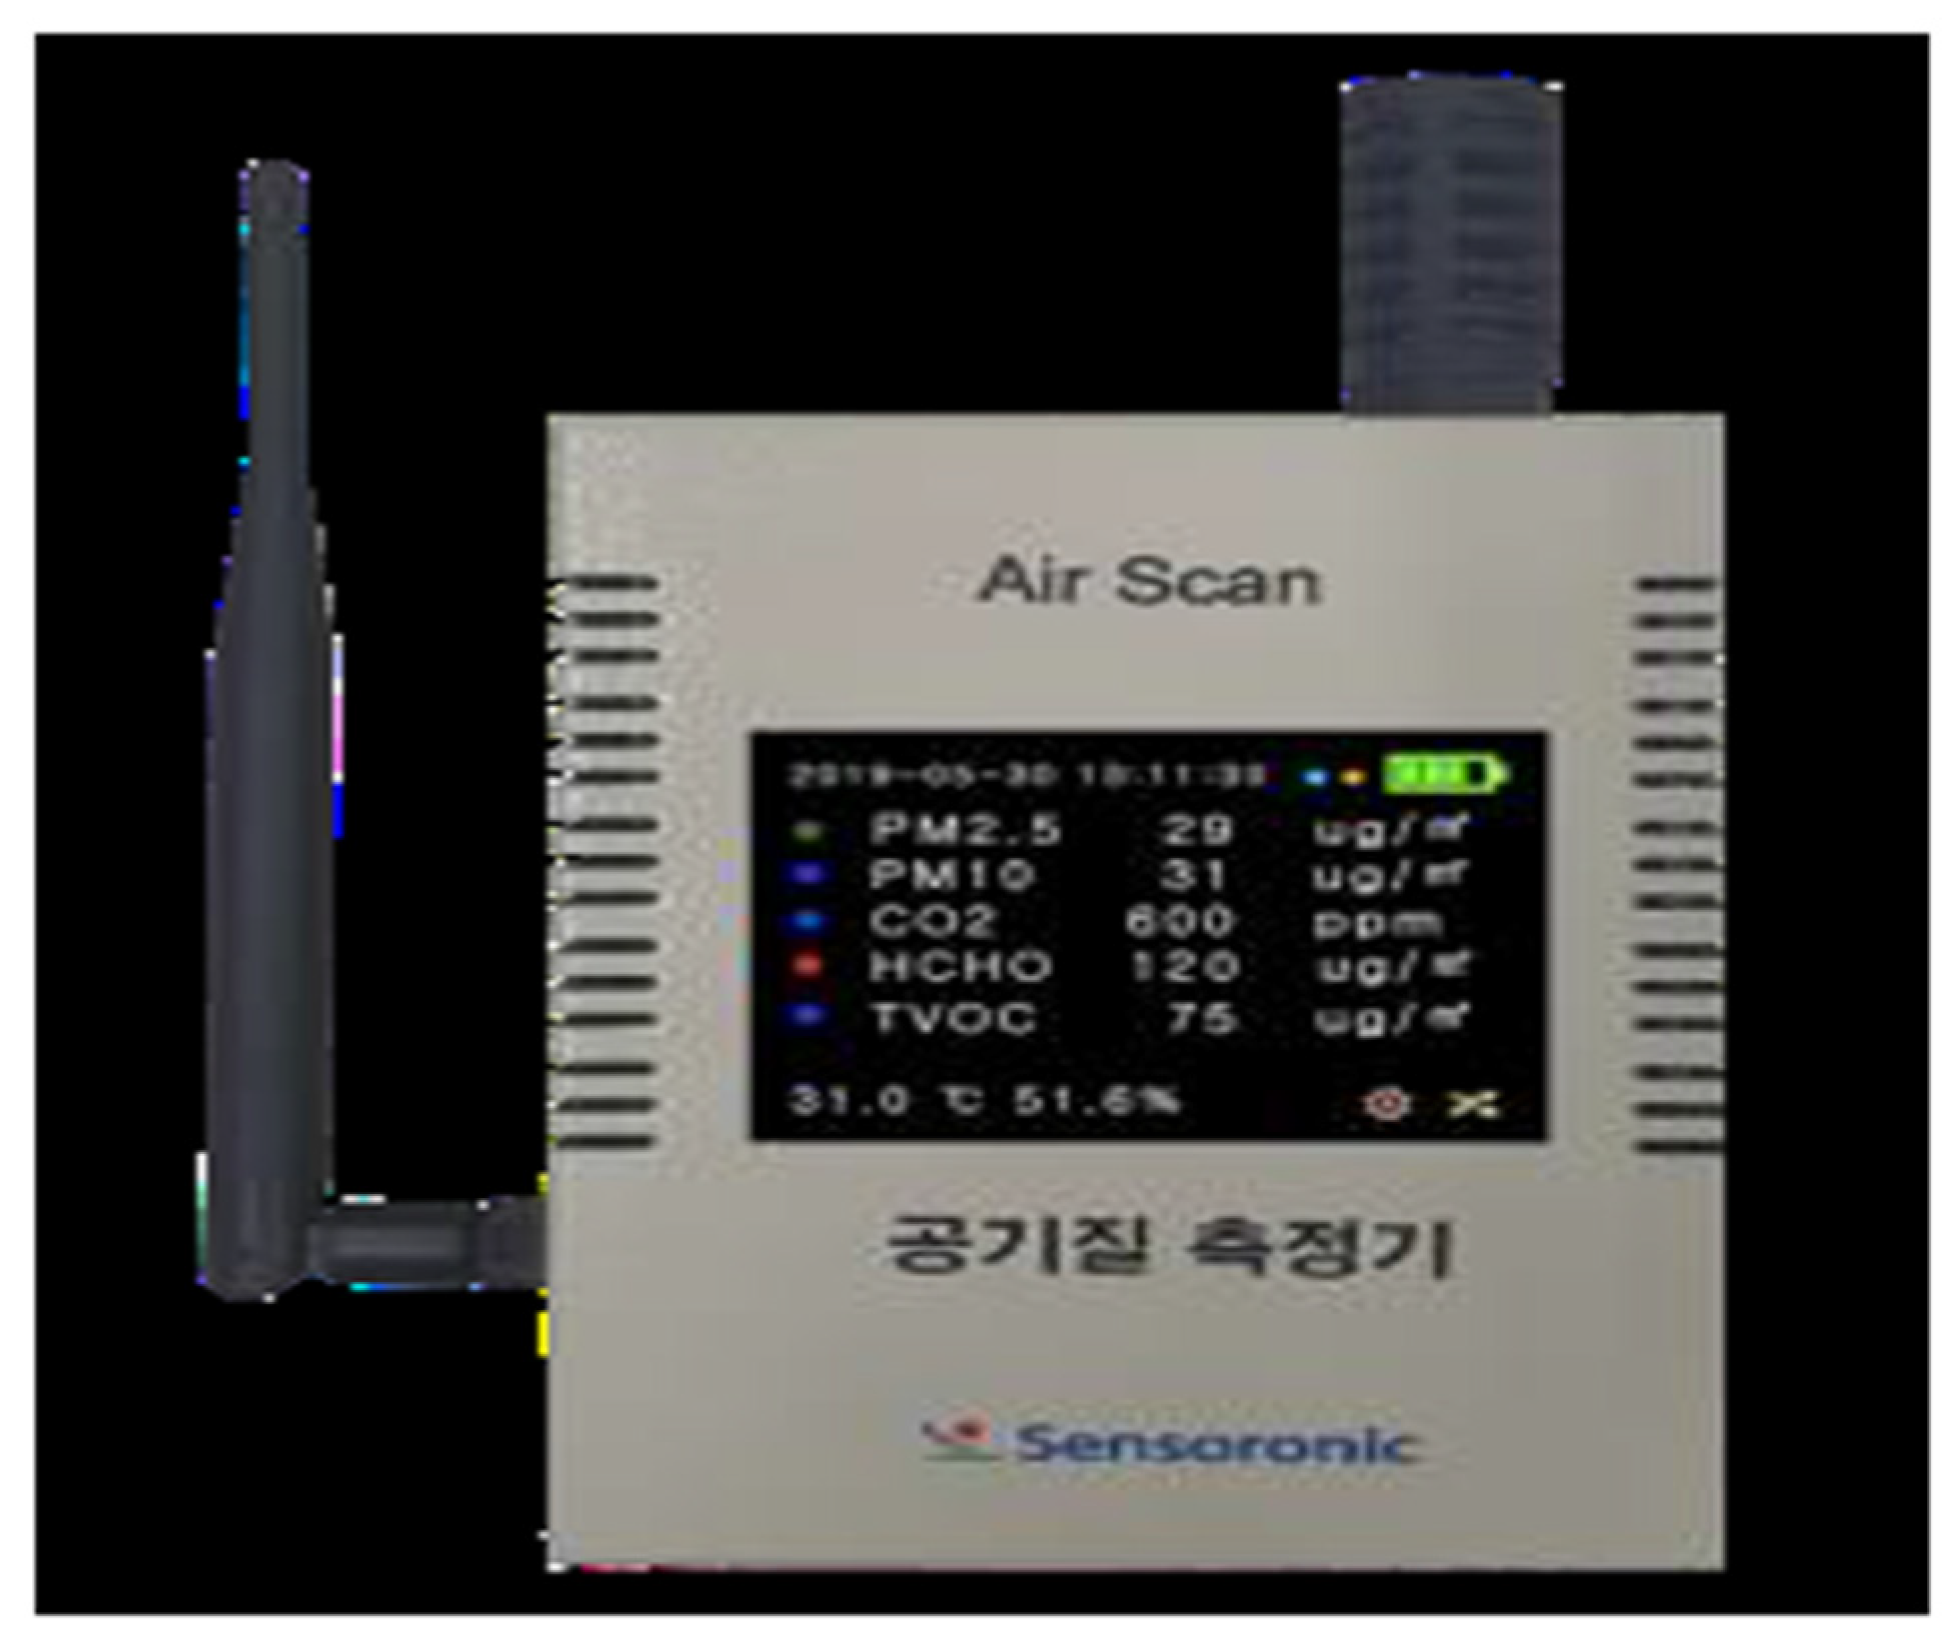
2.3. Indoor Air Pollutants Measurements

From December 2021 to January 2022, the units’ indoor air quality (IAQ) was inspected due to the extremely high levels of particulate matter pollution [30,31]. Each apartment was monitored for 24 h over a regular two-week period. Table 1 describes the characteristics of each flat. The plants were positioned to prevent any obstructions to mobility. Since it was winter in Korea, the tenants kept their windows closed. As their actions also contributed to pollution, the residents were instructed to list all their indoor activities on a notepad, such as sweeping, cooking, lighting candles, and smoking. Information regarding the kind of household, heating and cooling systems, and usage were gathered using a brief questionnaire. However, none of the tenants were smokers; therefore, the main indoor contributing sources were cooking and other maintenance activities. Activities such as cooking, burning incense sticks, and other maintenance jobs such as sweeping and cleaning were also asked to be noted down. All the indoor air pollutants were measured using the AirScan device from Sensoronic (Figure 2). Formaldehyde (HCHO), total volatile organic compounds (TVOCs), carbon dioxide (ppm), PM10, and PM2.5 were all measured in real-time, along with the temperature (°C) and relative humidity (%). The system was configured to record values every five minutes. Weekly readings were recorded. Before the experiment, TVOCs, CO2, PM10, HCHO, and PM2.5 levels were pre-tested and measured to determine the levels and variability of these pollutants. Outdoor PM10 and PM2.5 concentrations were also measured using the same device.

2.4. Data Analysis

MATLAB 2021a was used to process and analyze the real-time mass concentrations of the indoor pollutants that were measured using the Sensoronic AirScan device (Figure 2). The mean and standard deviation were calculated using a descriptive statistical method. For samples with more than two groups, the mean of each treatment was compared using a one-way analysis of variance (ANOVA) at a 95% level of confidence, and for samples with two groups, an independent t-test with n1 + n2 − 2 and α = 0.025 (two tails). Tukey’s multiple comparison test with a 95% confidence level was used to classify groups after the one-way ANOVA. Data visualization and interpretation were made using MATLAB 2021a.

2.5. Calculation of Air Exchange Rate (AER), Deposition and Emission Rate

Using the CO2 release mechanism and its decay rate, as reported in [32], determined the sampling duration’s air exchange rate (AER). The apartment was equipped with an Extech SD800 Datalogger, and the AirScan was used to gauge the CO2 levels within. By releasing lab-grade CO2 from a gas cylinder, the CO2 levels were raised to between 5000 and 7000 ppm, making small fluctuations in the background levels inconsequential. The impact of the background CO2 levels was minimized as a result. The location of the CO2 monitor was changed in order to provide a clearer image of the average AERs. The mass balance equation was employed in this investigation to determine the indoor PM2.5 emission rates, which is consistent with prior studies [33,34,35]. Numerous presumptions were made to simplify the mass balance equation. The penetration efficiency (P) was first considered to be one. The P, however, is a function of particle size and is less than one due to gravitational settling, especially for high particle diameters, which is crucial to mention (e.g., Ref. [9]). Outdoor sources were regarded as negligible since indoor concentrations during the activities were significantly more significant than background levels. Using average values and the extra supposition of a well-mixed environment, the average emission rates were calculated from Equations (1) and (2) as follows:
d C i n d t = P a C o u t + Q s v ( a + k ) C i n
Q s ¯ = V × [   C i n C i n 0 Δ t   ] + ( a + k ¯ ) c i ¯ n a C i n 0
Where t is the difference in time between the initial and peak concentrations, AER, is the deposition rate, and Cin is the average indoor concentration. Qs is the average indoor particle emission rate, V is the room volume, and Cin and Cin0 are the peak and initial indoor concentrations, respectively. The value (α + κ) denotes the average removal rate. As a result, dynamic aerosol processes that affect particle generation and removal, such as condensation, evaporation, and coagulation, are not considered. (Ref. [33]) provides more information on the estimation of particle emission rates.
According to [36], which assumes that the outdoor effect is minimal, the decay of interior particles after the source has stopped is characterized as follows:
d C i n d t = ( a + k ) C i n
Equation (3) can be integrated to yield the following linear equation:
l n C i ν t C i n 0 = ( a + k ) t
where the slope of the graph of ln( C i n t C i n o ) vs. t is equal to (α + κ).

3. Results

3.1. Indoor and Outdoor PM2.5 and PM10 Concentration

According to our findings, there are substantial differences in the component concentrations of each apartment (Table 1), with APTI having the lowest pollutant level due to ventilation and specially chosen indoor plants. The lowest and highest average indoor PM2.5 levels were recorded for APTI and APTIV, respectively. The PM10 content of APTI was found to vary from 6 to 68 µg m−3, with an average value of 19.4 µg m−3, whereas APTIV had a range from 4 to 679 µg m−3, with the highest average value being 58.81 µg m−3. These standards cover typical indoor activities, including frying, cleaning, and lighting candles. PM10 and PM2.5 are both present, with PM2.5 having a range of 4–42 µg m−3 and an average of 12.64 µg m−3 for APTI and APTIV, respectively, and a range of 3–49 µg m−3 and 35.72 µg m−3. For each apartment, the interior PM10 and PM2.5 readings exhibit greater variation than the outdoor concentrations (Table S1). The study’s indoor PM concentrations are within the range of those noted in the literature. According to earlier research [9,33,34,35,36], indoor PM2.5 levels can reach 9.5 µg m−3 and 34.6 µg m−3, and indoor PM10 levels can reach 23.0 µg m−3, 18.3 µg m−3, and 47.2 µg m−3, respectively [37,38]. The minimum, maximum, and average concentrations of all the pollutants from each apartment can be seen in Table S1. There was a difference between interior and outdoor PM concentrations in each apartment, with the apartment with ventilation and inside plants having the lowest concentration (Figure 3).
The concentrations of PM2.5 and PM10 varied significantly between the indoor sites. While preliminary comparisons can still be used even though complete multiple comparisons cannot be made using the nonparametric technique, there were significant variations in PM2.5 and PM10 concentrations among the flats. The results (Figures S2–S5) show that despite indoor plants and ventilation, the indoor PM2.5 and PM10 concentrations in APT I did not significantly change in response to outdoor PM2.5 and PM10 concentrations. However, the results from APT IV and APT III also suggest that ventilation may have a small effect on indoor pollutant concentration.
The results also made it abundantly clear that apartments with indoor plants and ventilation can significantly lower PM2.5, up to 64.61%, as opposed to apartments with only CAM plants, which only show a reduction of 52.09%. These apartments also have higher reduction efficiencies than apartments without indoor plants and ventilation (Table 3) (p-value < 0.0001). The outcomes demonstrated the plants’ capacity to adsorb or absorb PM2.5. Prior research has suggested that plants can lower the amount of PM2.5 in the air [39,40].

3.2. Indoor TVOC, HCHO, and CO2 Concentrations

3.2.1. Total Volatile Organic Compound (TVOC) Concentrations

Table 3 shows the total volatile organic compound (TVOC) rates throughout the complete two-month study. Table 3 shows the variation in average TVOC concentrations over time for several sets of circumstances, namely, APTI, APTIV, APT II, and APT III. Indoor average TVOC concentrations without indoor plants and ventilation can reach 800.41 µg m−3, but they were found to be 56.35 µg m−3 and 190.93 µg m−3 in APTI and APT II, respectively (Table S1). In the indoor testing settings, a general decreasing pattern for average TVOC concentration was seen with the indoor plants (p-value < 0.0001; APTI–APTIV). This increase in average TVOC concentration can be noticed in APT II compared to APT I. We also discovered a decrease in TVOC levels, with APT I having the lowest average TVOC level compared to APT II when both C3 Cycle and CAM plants were combined (Table 3).
The sansevieria species and other commonly used indoor plant species have been shown in prior research to be able to remove a variety of VOCs [41,42,43,44]. Still, we discovered that the apartment with both C3 and CAM plants, or APT I, had a substantially greater TVOC-removal effectiveness than APT II, which only had the CAM plants, when comparing the removal efficiency of TVOCs for APT I and APT III, respectively, and using Apartment IV as the control apartment, devoid of any indoor plants and ventilation, as a standard for comparison (Table 3). The removal of indoor air pollutants such as formaldehyde, acetone, benzene, and xylene by CAM plants and C3 plants has also been reported in earlier research [45,46,47,48,49]. However, in this case, we found the average concentration of TVOCs.

3.2.2. Formaldehyde (HCHO) Concentration

The average formaldehyde (HCHO) rates for the whole two-month study are depicted in Table 3. The variations in average HCHO concentration over time are depicted in Table 3 for several different sets of conditions, such as APTI, APTIV, APT II, and APT III (refer to Table 1). Average indoor HCHO concentrations are higher in apartments lacking indoor plants and ventilation than in apartments with these features. For example, APTI has a value of 6.023 µg m−3, APT II has a value of 5.98 µg m−3, while APT III and APTIV were found to have values of 34.67 µg m−3 and 23.99 µg m−3 (Table S1). A general decreasing pattern for average HCHO concentrations was seen with indoor plants in the indoor testing circumstances (p-value < 0.0001) (APTI–APTIV). Because the plants used in APT II have already demonstrated their ability to reduce the HCHO content, similar average formaldehyde concentrations can be found for both APT I and APT II [45,46,47,48,49]. The reduction rates for APT I and APT II are identical, at 75% and 74%, respectively. Although the average HCHO level for each apartment was found to be within the ASHRAE-recommended range, there is a noticeable difference in the concentrations of HCHO in the units with plants. (Table 3)

3.2.3. Carbon Dioxide (CO2) Concentration

Table 3 illustrates the variation in average CO2 concentration over time for a variety of various combinations of settings, APTI, APTIV, APT II, and APT III (refer to Table 1). Similar to other contaminants, it has been found that average indoor CO2 concentrations are higher in apartments without indoor plants and ventilation than in those that do. Previous studies have also shown that few Indoor plants reduce CO2 concentration [37,42]. The average CO2 emissions from plants at night are a significant issue when considering phytoremediation in indoor areas. Combining CAM and C3 plants can dramatically lower the system’s CO2 emissions [46]. APT III with simply a CAM plant and APT I with combined CAM and C3 plants appeared to maintain low CO2 concentrations in the apartment, while apartments without indoor plants and ventilation released higher CO2 (p-value < 0.0001). Table 3 shows the reduction rate for each apartment, with APT I having the lowest average CO2 concentration of 615.5 ppm, whereas APTIV has the highest average CO2 concentration of 2616.36 ppm (Table S1). In CAM plants such as S. trifasciata, moderate light intensity appeared to cause stomata to open, enhancing CO2 uptake. The C3 plant may produce CO2 simultaneously due to the moderate light intensity [46]. Therefore, it is possible that the atmosphere in APT I experienced CO2 emission and absorption when CAM and C3 plants were mixed.

4. Discussion

Interior plants will increasingly be used in indoor areas as people’s awareness of sustainability grows. A solution for treating indoor air that has the potential to be both efficient and sustainable is phytoremediation. However, the number of plants utilized, as well as their mix, affect how well they may reduce indoor air pollution. Total volatile organic compounds (TVOCs), particulate matter, and oxidants and irritants are some of the several elements that make up indoor pollution (PM). People dwell indoors for up to 90% of the time in every country on earth. The interior air quality is, therefore, crucial to limiting human exposure to pollutants. The ability to lower indoor air pollutants was demonstrated by potted plants. According to our knowledge, this study is the first to perform real-time monitoring of indoor and outdoor PM and different indoor air pollutant concentrations (TVOC, HCHO, and CO2) in a typical Korean apartment throughout the winter. We emphasize the distinct indoor and outdoor sources by differentiating between the different diurnal patterns of indoor and outdoor PM levels. The main contributors to indoor formaldehyde, TVOC, and PM pollution are cigarette use, building materials, and furniture. Furthermore, there is no association between interior and outdoor PM concentrations, particularly for PM2.5. The effectiveness of commonly used indoor ornamental plants and ventilation in eliminating the primary indoor air contaminants is also discovered. Current research has shown that C3 and CAM plants work well together to reduce PM2.5, PM10, HCHO, TVOCs, and CO2 to greater extents, up to 64%, 67%, 75%, 93%, and 76%, respectively (Table 3).
Active botanical biofilters are a recent innovation that has gained popularity for reducing indoor air pollution [24,25]. This approach involves passing tainted air through a layer of plants and growth material harboring advantageous bacteria [50]. Therefore, this technique could be able to control the CO2 content in indoor environments and lower the number of plants [51]. According to the principles of the botanical biofilter, microorganisms growing on plant growth material can be crucial in the removal of pollutants in a botanical biofilter [26] since some pollutants can be adsorbed on the planting material [28]. In contrast to this, very few researchers have focused on lowering indoor air pollution in actual settings [52,53,54]. More research and field tests are required to fully understand the capability of absorption by house plants in practical situations. The potential of a mixture of typical CAM and C3 house plants to absorb indoor air pollutants is explained in this study. The results demonstrate that the average concentration of all indoor air pollutants caused by diverse daily indoor activities was significantly greater in APT IV (without ventilation and plants) than in APT I (with ventilation and plants). Even with ventilation and without plants (APT III), there was a significant variation in the levels of several pollutants, demonstrating that ventilation cannot completely reduce pollution. The average value of several pollutants inside APT II is still greater than that of APT I, which also implies that the combination of both CAM and C3 plants may reach the highest removal effectiveness.

5. Conclusions

A solution for treating indoor air that has the potential to be both efficient and sustainable is phytoremediation. However, using plants to remove interior pollutants instantly still presents difficulties. Furthermore, having many plants, especially C3 plants, in a room with air conditioning might also be problematic because they release CO2 into the atmosphere at night. Mixed plants (CAM and C3) exhibited high pollution removal efficiency with low CO2 output than single plant species. In this study, we created a system that showed real-time indoor air phytoremediation in a typical Korean apartment during the winter, with little CO2 emissions despite activities such as cooking, cleaning, lighting candles, etc. Condensation, evaporation, and coagulation, dynamic processes that affect the production and removal of aerosols, were not considered since they were deemed negligible in this study when indoor sources were present. Reducing indoor air pollution levels by using plants may be a simple way to lower lifetime risk and exposure to a wide range of chemicals.
Furthermore, as most of society spends most of its time indoors, the current research is essential to improving indoor air quality. The results also show a sustainable and affordable indoor air pollutant bioremediation system that is simple to integrate into engineering measures for any building infrastructure, including workplaces, research facilities, schools, and urban families. Given that plant growth conditions and the effectiveness of the plant species being employed in pollution removal influence how quickly plants digest air pollutants, it is necessary to conduct more research on the selection of indoor plant species based on their morphological, anatomical, and physiological characteristics that have the potential to phytoremediate air. This will ensure that indoor living has positive health benefits and will promote learning, productivity, and quality of life. This work sheds light on the significance of this understanding, particularly in light of its implications for human health.

Supplementary Materials

The following supporting information can be downloaded at: https://www.mdpi.com/article/10.3390/atmos13111863/s1, Figure S1: Uiwang-si map and sampling site location. Figure S2: Correlation values of outdoor and indoor PM10 and PM2.5 for APT I (with ventilation and indoor plants). Figure S3: Correlation values of outdoor and indoor PM10 and PM2.5 for APT II (without ventilation and only CAM indoor plants). Figure S4: Correlation values of outdoor and indoor PM10 and PM2.5 for APT III (with ventilation and without indoor plants). Figure S5: Correlation values of outdoor and indoor PM10 and PM2.5 for APT IV (without ventilation and indoor plants). Table S1: Values of various indoor pollutants inside various apartments

Author Contributions

The study was designed and developed by S.S. and M.J., S.S. and M.J. also helped with data collection, and S.S. and A.B. handled data visualization and analysis. The complete study process was managed and funded by D.P. D.P. and H.L. reviewed the manuscript and revised it. All authors have read and agreed to the published version of the manuscript.

Funding

This work was supported by a living-laboratory-based, real-time biosurveillance and response platform project by the Ministry of Environment (ME22001, 2021003380006).

Institutional Review Board Statement

Not applicable.

Informed Consent Statement

Informed consent was obtained from all individuals living in the apartments involved in the study.

Data Availability Statement

Not applicable.

Conflicts of Interest

The authors certify that they have no known financial or interpersonal conflict that might have influenced the research presented in this study.

References

  1. Brook, R.D.; Rajagopalan, S.; Pope, C.A.; Brook, J.R.; Bhatnagar, A.; Diez-Roux, A.V.; Holguin, F.; Hong, Y.; Luepker, R.V.; Mittleman, M.A.; et al. Particulate Matter Air Pollution and Cardiovascular Disease: An Update to the Scientific Statement from the American Heart Association. Circulation 2010, 121, 2331–2378. [Google Scholar] [CrossRef] [PubMed] [Green Version]
  2. Crouse, D.L.; Peters, P.A.; Hystad, P.; Brook, J.R.; van Donkelaar, A.; Martin, R.V.; Villeneuve, P.J.; Jerrett, M.; Goldberg, M.S.; Arden Pope, C.; et al. Ambient PM2.5, O3, and NO2 Exposures and Associations with Mortality over 16 Years of Follow-up in the Canadian Census Health and Environment Cohort (CanCHEC). Environ. Health Perspect. 2015, 123, 1180–1186. [Google Scholar] [CrossRef] [PubMed] [Green Version]
  3. Shuai, J.; Kim, S.; Ryu, H.; Park, J.; Lee, C.K.; Kim, G.B.; Ultra, V.U.; Yang, W. Health Risk Assessment of Volatile Organic Compounds Exposure near Daegu Dyeing Industrial Complex in South Korea. BMC Public Health 2018, 18, 528. [Google Scholar] [CrossRef] [PubMed] [Green Version]
  4. Zhang, X.; Li, X.; Wang, Z.; Deng, G.; Wang, Z. Exposure Level and Influential Factors of HCHO, BTX and TVOC from the Interior Redecoration of Residences. Build. Environ. 2020, 168, 106494. [Google Scholar] [CrossRef]
  5. Jahanzaib, B.; Irshad, D.; Park, M.Z. Development of Driving Cycle for Passenger Cars and Estimation of Vehicular Exhaust Emission Factors. J. Environ. Pollut. Control 2022, 5, 1–11. [Google Scholar] [CrossRef]
  6. Hoek, G.; Krishnan, R.M.; Beelen, R.; Peters, A.; Ostro, B.; Brunekreef, B.; Kaufman, J.D. Long-Term Air Pollution Exposure and Cardio-Respiratory Mortality: A Review. Environ. Health A Glob. Access Sci. Source 2013, 12, 43. [Google Scholar] [CrossRef] [PubMed] [Green Version]
  7. Brasche, S.; Bischof, W. Daily Time Spent Indoors in German Homes—Baseline Data for the Assessment of Indoor Exposure of German Occupants. Int. J. Hyg. Environ. Health 2005, 208, 247–253. [Google Scholar] [CrossRef]
  8. Schweizer, C.; Edwards, R.D.; Bayer-Oglesby, L.; Gauderman, W.J.; Ilacqua, V.; Juhani Jantunen, M.; Lai, H.K.; Nieuwenhuijsen, M.; Künzli, N. Indoor Time-Microenvironment-Activity Patterns in Seven Regions of Europe. J. Expo. Sci. Environ. Epidemiol. 2007, 17, 170–181. [Google Scholar] [CrossRef] [PubMed] [Green Version]
  9. Chen, C.; Zhao, B. Review of Relationship between Indoor and Outdoor Particles: I/O Ratio, Infiltration Factor and Penetration Factor. Atmos. Environ. 2011, 45, 275–288. [Google Scholar] [CrossRef]
  10. Vardoulakis, S.; Giagloglou, E.; Steinle, S.; Davis, A.; Sleeuwenhoek, A.; Galea, K.S.; Dixon, K.; Crawford, J.O. Indoor Exposure to Selected Air Pollutants in the Home Environment: A Systematic Review. Int. J. Environ. Res. Public Health 2020, 17, 8972. [Google Scholar] [CrossRef]
  11. Maisey, S.J.; Saunders, S.M.; West, N.; Franklin, P.J. An Extended Baseline Examination of Indoor VOCs in a City of Low Ambient Pollution: Perth, Western Australia. Atmos. Environ. 2013, 81, 546–553. [Google Scholar] [CrossRef]
  12. Geiss, O.; Giannopoulos, G.; Tirendi, S.; Barrero-Moreno, J.; Larsen, B.R.; Kotzias, D. The AIRMEX Study—VOC Measurements in Public Buildings and Schools/Kindergartens in Eleven European Cities: Statistical Analysis of the Data. Atmos. Environ. 2011, 45, 3676–3684. [Google Scholar] [CrossRef]
  13. Bruce, N.; Perez-Padilla, R.; Albalak, R. The Health Effects of Indoor Air Pollution Exposure in Developing Countries. Geneva World Health Organ. Rep. 2002, 11, 1–40. [Google Scholar]
  14. Lui, K.H.; Bandowe, B.A.M.; Ho, S.S.H.; Chuang, H.C.; Cao, J.J.; Chuang, K.J.; Lee, S.C.; Hu, D.; Ho, K.F. Characterization of Chemical Components and Bioreactivity of Fine Particulate Matter (PM2.5) during Incense Burning. Environ. Pollut. 2016, 213, 524–532. [Google Scholar] [CrossRef] [PubMed]
  15. Pan, A.; Clark, M.L.; Ang, L.W.; Yu, M.C.; Yuan, J.M.; Koh, W.P. Incense Use and Cardiovascular Mortality among Chinese in Singapore: The Singapore Chinese Health Study. Environ. Health Perspect. 2015, 122, 1279–1284. [Google Scholar] [CrossRef] [PubMed] [Green Version]
  16. Daghigh, R. Assessing the Thermal Comfort and Ventilation in Malaysia and the Surrounding Regions. Renew. Sustain. Energy Rev. 2015, 48, 681–691. [Google Scholar] [CrossRef]
  17. Torpy, F.R.; Irga, P.J.; Burchett, M.D. Profiling Indoor Plants for the Amelioration of High CO2 Concentrations. Urban For. Urban Green. 2014, 13, 227–233. [Google Scholar] [CrossRef]
  18. Zuraimi, M.S.; Vuotari, M.; Nilsson, G.; Magee, R.; Kemery, B.; Alliston, C. Impact of Dust Loading on Long Term Portable Air Cleaner Performance. Build. Environ. 2017, 112, 261–269. [Google Scholar] [CrossRef]
  19. Wolverton, B.C.; Mcdonald, R.C.; Watkins, E.A. Foliage Plants for Removing Indoor Air Pollutants from Energy-Efficient Homes. Econ. Bot. 1984, 38, 224–228. [Google Scholar] [CrossRef]
  20. Wolverton, B.; Wolverton, J. Plants and Soil Microorganisms: Removal of Formaldehyde, Xylene, and Ammonia from the Indoor Environment. J. Miss. Acad. Sci. 1993, 38, 11–15. [Google Scholar]
  21. Liu, Y.J.; Mu, Y.J.; Zhu, Y.G.; Ding, H.; Crystal Arens, N. Which Ornamental Plant Species Effectively Remove Benzene from Indoor Air? Atmos. Environ. 2007, 41, 650–654. [Google Scholar] [CrossRef]
  22. Kvesitadze, E.; Sadunishvili, T.; Kvesitadze, G. Mechanisms of Organic Contaminants Uptake and Degradation in Plants. Int. J. Biol. Biomed. Eng. 2009, 3, 458–468. [Google Scholar]
  23. Moya, T.A.; van den Dobbelsteen, A.; Ottelé, M.; Bluyssen, P.M. A Review of Green Systems within the Indoor Environment. Indoor Built Environ. 2019, 28, 298–309. [Google Scholar] [CrossRef]
  24. Darlington, A.B.; Dat, J.F.; Dixon, M.A. The Biofiltration of Indoor Air: Air Flux and Temperature Influences the Removal of Toluene, Ethylbenzene, and Xylene. Environ. Sci. Technol. 2001, 35, 240–246. [Google Scholar] [CrossRef]
  25. Feng, H.; Hewage, K. Lifecycle Assessment of Living Walls: Air Purification and Energy Performance. J. Clean. Prod. 2014, 69, 91–99. [Google Scholar] [CrossRef]
  26. Wang, Z.; Pei, J.; Zhang, J.S. Experimental Investigation of the Formaldehyde Removal Mechanisms in a Dynamic Botanical Filtration System for Indoor Air Purification. J. Hazard. Mater. 2014, 280, 235–243. [Google Scholar] [CrossRef]
  27. Torpy, F.; Zavattaro, M.; Irga, P. Green Wall Technology for the Phytoremediation of Indoor Air: A System for the Reduction of High CO2 Concentrations. Air Qual. Atmos. Health 2017, 10, 575–585. [Google Scholar] [CrossRef]
  28. Soreanu, G.; Dixon, M.; Darlington, A. Botanical Biofiltration of Indoor Gaseous Pollutants—A Mini-Review. Chem. Eng. J. 2013, 229, 585–594. [Google Scholar] [CrossRef]
  29. Satish, U.; Mendell, M.J.; Shekhar, K.; Hotchi, T.; Sullivan, D. Concentrations on Human Decision-Making Performance. Environ. Health Perspect. 2012, 120, 1671–1678. [Google Scholar] [CrossRef] [Green Version]
  30. Kwon, S.B.; Jeong, W.; Park, D.; Kim, K.T.; Cho, K.H. A Multivariate Study for Characterizing Particulate Matter (PM10, PM2.5, and PM1) in Seoul Metropolitan Subway Stations, Korea. J. Hazard. Mater. 2015, 297, 295–303. [Google Scholar] [CrossRef]
  31. Rim, D.; Gall, E.T.; Kim, J.B.; Bae, G.N. Particulate Matter in Urban Nursery Schools: A Case Study of Seoul, Korea during Winter Months. Build. Environ. 2017, 119, 1–10. [Google Scholar] [CrossRef]
  32. Claude-Alain, R.; Foradini, F. Simple and Cheap Air Change Rate Measurement Using CO2 Concentration Decays. Int. J. Vent. 2002, 1, 39–44. [Google Scholar] [CrossRef]
  33. He, L.Y.; Hu, M.; Huang, X.F.; Yu, B.D.; Zhang, Y.H.; Liu, D.Q. Measurement of Emissions of Fine Particulate Organic Matter from Chinese Cooking. Atmos. Environ. 2004, 38, 6557–6564. [Google Scholar] [CrossRef]
  34. He, C.; Morawska, L.; Gilbert, D. Particle Deposition Rates in Residential Houses. Atmos. Environ. 2005, 39, 3891–3899. [Google Scholar] [CrossRef] [Green Version]
  35. Guo, L.; Lewis, J.O.; McLaughlin, J.P. Emissions from Irish Domestic Fireplaces and Their Impact on Indoor Air Quality When Used as Supplementary Heating Source. Glob. Nest J. 2008, 10, 209–216. [Google Scholar] [CrossRef] [Green Version]
  36. Vicente, E.D.; Evtyugina, M.; Vicente, A.M.; Calvo, A.I.; Oduber, F.; Blanco-Alegre, C.; Castro, A.; Fraile, R.; Nunes, T.; Lucarelli, F.; et al. Impact of Ironing on Indoor Particle Levels and Composition. Build. Environ. 2021, 192, 107636. [Google Scholar] [CrossRef]
  37. Aquilina, N.J.; Camilleri, S.F. Impact of Daily Household Activities on Indoor PM2.5 and Black Carbon Concentrations in Malta. Build. Environ. 2022, 207, 108422. [Google Scholar] [CrossRef]
  38. Amouei Torkmahalleh, M.; Zhigulina, Z.; Madiyarova, T.; Turganova, K.; Adotey, E.K.; Sabanov, S. Exposure to Fine, Ultrafine Particles and Black Carbon in Two Preschools in Nur-Sultan City of Kazakhstan. Indoor Air 2021, 31, 1178–1186. [Google Scholar] [CrossRef]
  39. Gawrońska, H.; Bakera, B. Phytoremediation of Particulate Matter from Indoor Air by Chlorophytum Comosum L. Plants. Air Qual. Atmos. Health 2015, 8, 265–272. [Google Scholar] [CrossRef] [Green Version]
  40. Mo, L.; Ma, Z.; Xu, Y.; Sun, F.; Lun, X.; Liu, X.; Chen, J.; Yu, X. Assessing the Capacity of Plant Species to Accumulate Particulate Matter in Beijing, China. PLoS ONE 2015, 10, e0140664. [Google Scholar] [CrossRef]
  41. Zhao, S.; Zhao, Y.; Liang, H.; Su, Y. Formaldehyde Removal in the Air by Six Plant Systems with or without Rhizosphere Microorganisms. Int. J. Phytoremediation 2019, 21, 1296–1304. [Google Scholar] [CrossRef] [PubMed]
  42. Bhargava, B.; Malhotra, S.; Chandel, A.; Rakwal, A.; Kashwap, R.R.; Kumar, S. Mitigation of Indoor Air Pollutants Using Areca Palm Potted Plants in Real-Life Settings. Environ. Sci. Pollut. Res. 2021, 28, 8898–8906. [Google Scholar] [CrossRef] [PubMed]
  43. Lee, H.; Jun, Z.; Zahra, Z. Phytoremediation: The Sustainable Strategy for Improving Indoor and Outdoor Air Quality. Environments 2021, 8, 118. [Google Scholar] [CrossRef]
  44. Permana, B.H.; Thiravetyan, P.; Treesubsuntorn, C. Effect of Airflow Pattern and Distance on Removal of Particulate Matters and Volatile Organic Compounds from Cigarette Smoke Using Sansevieria Trifasciata Botanical Biofilter. Chemosphere 2022, 295, 133919. [Google Scholar] [CrossRef] [PubMed]
  45. Kim, K.J.; Lim, Y.W.; Kim, H.H.; Il Jeong, M.; Lee, D.W.; Song, J.S.; Kim, H.D.; Yoo, E.H.; Jeong, S.J.; Han, S.W.; et al. Variation in Formaldehyde Removal Efficiency among Indoor Plant Species. Hortscience 2010, 45, 1489–1495. [Google Scholar] [CrossRef]
  46. Treesubsuntorn, C.; Thiravetyan, P. Botanical Biofilter for Indoor Toluene Removal and Reduction of Carbon Dioxide Emission under Low Light Intensity by Using Mixed C3 and CAM Plants. J. Clean. Prod. 2018, 194, 94–100. [Google Scholar] [CrossRef]
  47. Siswanto, D.; Permana, B.H.; Treesubsuntorn, C.; Thiravetyan, P. Sansevieria Trifasciata and Chlorophytum Comosum Botanical Biofilter for Cigarette Smoke Phytoremediation in a Pilot-Scale Experiment—Evaluation of Multi-Pollutant Removal Efficiency and CO2 Emission. Air Qual. Atmos. Health 2020, 13, 109–117. [Google Scholar] [CrossRef]
  48. Khaksar, G.; Treesubsuntorn, C.; Thiravetyan, P. Effect of Endophytic Bacillus Cereus ERBP Inoculation into Non-Native Host: Potentials and Challenges for Airborne Formaldehyde Removal. Plant Physiol. Biochem. 2016, 107, 326–336. [Google Scholar] [CrossRef]
  49. Setsungnern, A.; Treesubsuntorn, C.; Thiravetyan, P. The Influence of Different Light Quality and Benzene on Gene Expression and Benzene Degradation of Chlorophytum Comosum. Plant Physiol. Biochem. 2017, 120, 95–102. [Google Scholar] [CrossRef]
  50. Sandhu, A.; Halverson, L.J.; Beattie, G.A. Bacterial Degradation of Airborne Phenol in the Phyllosphere. Environ. Microbiol. 2007, 9, 383–392. [Google Scholar] [CrossRef]
  51. Torpy, F.; Clements, N.; Pollinger, M.; Dengel, A.; Mulvihill, I.; He, C.; Irga, P. Testing the Single-Pass VOC Removal Efficiency of an Active Green Wall Using Methyl Ethyl Ketone (MEK). Air Qual. Atmos. Health 2018, 11, 163–170. [Google Scholar] [CrossRef] [PubMed] [Green Version]
  52. Ghate, S. Phytoremediation of Formaldehyde in Indoor Environment With Common House Plants and Pseudomonas Chlororaphis. J. Earth Environ. Sci. Res. 2021, 3, 1–7. [Google Scholar] [CrossRef]
  53. Han, Y.; Lee, J.; Haiping, G.; Kim, K.H.; Wanxi, P.; Bhardwaj, N.; Oh, J.M.; Brown, R.J.C. Plant-Based Remediation of Air Pollution: A Review. J. Environ. Manag. 2022, 301, 113860. [Google Scholar] [CrossRef] [PubMed]
  54. Jung, C.; Awad, J. Improving the Iaq for Learning Efficiency with Indoor Plants in University Classrooms in Ajman, United Arab Emirates. Buildings 2021, 11, 289. [Google Scholar] [CrossRef]
Figure 1. Diagram of the apartment showing the doors, windows, Kitchen shafts, indoor air pollutants (IAP) monitors, and the entry and exit path.
Atmosphere 13 01863 g001
Figure 2. AirScan Device used for monitoring the Indoor Air Pollutant level.
Atmosphere 13 01863 g002
Figure 3. Average PM2.5 and PM10 concentrations for Different Apartments (APTI–APTIV): Indoor and Outdoor Diurnal Variations. (a) Apartment with indoor plants and ventilation (APTI). (b) Apartment with indoor plants (only CAM plants) and without ventilation (APT II). (c) Apartment with ventilation and without indoor plants (APT III). (d) Apartment without ventilation and indoor plants (APTIV).
Atmosphere 13 01863 g003
Table 1. Detailed information about the apartments.
Experimental SitesArea, Door, Window
No. of Occupants
VentilationIndoor Plant
Apartment I
(APT I)
10-Pyeong (~33 m2), 1, 1, 1With VentilationWith Indoor Plants.
Apartment II
(APT II)
10-Pyeong (~33 m2), 1, 1, 1Without VentilationWith Indoor Plants (only CAM plants).
Apartment III
(APT III)
10-Pyeong (~33 m2), 1, 1, 1With VentilationWithout Indoor Plants.
Apartment IV
(APT IV)
10-Pyeong (~33 m2), 1, 1, 1Without VentilationWithout Indoor Plants
Table 2. Details about selected Plant species.
PlantFamilyCommon NamePlant Type
Sansevieria kirkiiAsparagaceaeSnake PlantCAM carbon fixation.
Sansevieria trifasciataAsparagaceaeSnake PlantCAM carbon fixation.
Monstera deliciosaAraceaeSwiss Cheese PlantC3 carbon fixation.
ZamiifoliaAraceaeZZ-plantC3 carbon fixation
Portulacaria afraDidiereaceaeJade plantC3 or CAM carbon fixation
Table 3. Reduction Rate (%) of PM10, PM2.5, HCHO, TVOC, and CO2 by indoor plants.
Indoor PollutantApartmentConditionMean ± SEReduction Rate (%)
PM10Apartment I (APT I)Ventilation ✔ & Indoor plant (C3 + CAM) ✔19.4 ± 0.7467.01%
Apartment II (APT II)Ventilation ✘ & Indoor plant (CAM) ✔21.82 ± 0.2162.89%
Apartment III (APT III)Ventilation ✔ & Indoor plant ✘29.02 ± 0.9450.65%
Apartment IV (APT IV)Ventilation ✘ & Indoor plant ✘58.81 ± 1.66Control
PM2.5Apartment I (APT I)Ventilation ✔ & Indoor plant (C3 + CAM) ✔12.64 ± 0.3264.61%
Apartment II (APT II)Ventilation ✘ & Indoor plant (CAM) ✔17.11 ± 0.1352.09%
Apartment III (APT III)Ventilation ✔ & Indoor plant ✘15.94 ± 0.556.63%
Apartment IV (APT IV)Ventilation ✘ & Indoor plant ✘35.72 ± 0.96Control
TVOCApartment I (APT I)Ventilation ✔ & Indoor plant (C3 + CAM) ✔56.35±6.5992.95%
Apartment II (APT II)Ventilation ✘ & Indoor plant (CAM) ✔190.93 ± 7.6376.14%
Apartment III (APT III)Ventilation ✔ & Indoor plant ✘84.42 ± 3.0389.41%
Apartment IV (APT IV)Ventilation ✘ & Indoor plant ✘800.41 ± 14.73Control
HCHOApartment I (APT I)Ventilation ✔ & Indoor plant (C3 + CAM) ✔6.023 ± 0.25574.89%
Apartment II (APT II)Ventilation ✘ & Indoor plant (CAM) ✔5.98 ± 0.0675.07%
Apartment III (APT III)Ventilation ✔ & Indoor plant ✘34.67 ± 0.35−30%
Apartment IV (APT IV)Ventilation ✘ & Indoor plant ✘23.99 ± 0.32Control
CO2Apartment I (APT I)Ventilation ✔ & Indoor plant (C3 + CAM) ✔615.5 ± 2.7376.47%
Apartment II (APT II)Ventilation ✘ & Indoor plant (CAM) ✔1154.52 ± 10.8355.87%
Apartment III (APT III)Ventilation ✔ & Indoor plant ✘1278.42 ± 9.2751.13%
Apartment IV (APT IV)Ventilation ✘ & Indoor plant ✘2616.36 ± 25.81Control
Values are means ± SE; (p < 0.0005); (p < 0.0001); (p > 0.0005).
Publisher’s Note: MDPI stays neutral with regard to jurisdictional claims in published maps and institutional affiliations.

