1. Introduction
Air quality is gaining increasing attention, both among academics and practitioners, due to the rising evidence of its impacts on human health. The World Health Organization (WHO, Geneva, Switzerland) [
1] estimates that about seven million premature deaths occur worldwide due to long-term exposure to poor air quality every year, related both to outdoor and indoor air quality. The focus of regulations about air quality has historically been on the protection of human health against the negative effects of exposure to airborne pollutants, through two main orientations. On the one hand, in the outdoor environment, with the setting of a concentrations limit for airborne pollutants of concern typical of urban areas (e.g., particulate matter, nitrogen compounds and ozone) [
2]. On the other hand, in working environments, setting threshold limit values (TLV) for target substances deriving from the specific activities carried out [
3]. In the first case, international frameworks have been developed to align national approaches to the management of pollution sources in different contexts, such as industrial (for the EU context, 2010/75/EU Directive of the European Parliament and the Council on industrial emissions; for the U.S., Clean Air Act—United States Code as Title 42, Chapter 85—and National Emission Standards for Hazardous Air Pollutants (NESHAP); for China, the 13th Five-Year (2016–2020) Plan for Economic and Social Development) or urban (for the EU, 2008/50/EC Directive on Ambient Air Quality and Cleaner Air for Europe and 2004/107/EC Directive on heavy metals and polycyclic aromatic hydrocarbons; for the U.S., amendments to Clean Air Act, 1990; for China, National Ambient Air Quality Standard (GB3095-2012)). In the second case, standards have been set at the international level to limit the exposure of professionals to instant or long-term threats (for the EU, Directive 2009/161/EU—indicative occupational exposure limit values; for the U.S., specific regulations are developed at State level, such as California, with the California Labor Code §§6300 et seq., and New Jersey, with Indoor Air Quality standard, N.J.A.C. 12:100-13 (2007); for China, Occupational Diseases Prevention and Control Act of 2002).
Nevertheless, little is currently said about indoor air quality in civil environments, even though we spend about 90% of our time indoors [
4], among households, working places, leisure, shopping and various services. The level of air pollution has been proven to be remarkably higher in indoor environments compared to the outdoors, even in the presence of everyday-life activities [
5,
6,
7], to which the release of specific contaminants is related, or due to the location of the buildings in generally polluted areas, as demonstrated by Lucialli et al. [
8]. Among others, particulate matter (PM) and volatile compounds (VOCs) represent relevant groups of contaminants, as they both include a variety of substances and may, therefore, pose threats to human health, especially in the long term. PM is, in fact, a mix of different substances: solid particles of a wide range of characteristic dimensions, particularly fine and ultrafine, in the case of indoor environments, liquid droplets [
9] and secondary organic aerosol (SOA) [
10]. The World Health Organization has listed PM among carcinogens [
11], and the risk increases with the decreasing size of particles involved, as they acquire the ability to travel along the deep airways and reach more sensible areas, such as pulmonary alveolus. VOCs are a broad set of airborne contaminants which are typically related to photochemical smog and, consequently, tropospheric and ground-level ozone formation, in the outdoor environment. In indoor environments, they represent an element of concern, as several VOCs are listed among carcinogenic compounds (e.g., formaldehyde, methylene chloride, acetaldehyde, perchloroethylene, etc.) and consequently pose a threat to human health. In addition to this, they are involved in chemical reactions, able to generate sub-micron sized particles and by-products that may be associated with negative health effects in sensitive populations. Anthropic activity is widely regarded as the main source of air pollution in indoor environments. PM can result from physical activity in the room at different levels of engagement, from the simple walking [
12] to more complex activities [
13], but also cooking [
6,
7] and cleaning, especially when detergents [
5] and vacuuming [
14] are involved. VOCs may be generated not only by activities using chemicals (such as painting, dry cleaning, disinfectants, etc.), but also released on surfaces (i.e., furniture, coatings, textiles, etc.). As in the outdoors, VOCs may react with the indoor ozone, deriving, for example, from office equipment such as printers, or from air purifiers such as ionizers, or from the outside, even in low concentrations (i.e., below public health standards).
The onset of the COVID-19 pandemic has drawn additional attention to air quality, by considering its direct impacts on human health on a very short timescale. Air quality, in fact, has been proven to affect epidemiological parameters of the pandemic, such as mortality rate and spreading potential, in terms of risk determinants, i.e., vulnerability and exposure. First, in terms of vulnerability, the outdoor air quality has been proven to carry a significant impact, as recent studies have shown evidence for a link between long-term exposure to air pollution and an increase in mortality from SARS-CoV-2 infection [
15], as testified by the exceptional mortality rates in Northern Italy, where air quality is particularly poor [
16]. Second, in terms of exposure, studies developed during the pandemic have pointed out a potential risk of infection via aerosol, i.e., a suspension of solid particles or liquid droplets in the air [
17,
18,
19,
20]. The airborne pathway is physically able to spread viruses over a distance of about 2 m from the source, i.e., an infected person, as aerosols and particles can act as carriers for the microbial components, but only in recent years has it been proven as an effective transmission route for different diseases, from SARS-CoV-2 to avian influenza and measles [
19,
21,
22,
23,
24]. Indoor environments require, in this sense, adequate attention, as they are typically affected by limited ventilation and, possibly, crowding, increasing the probability of exposure to microbes. For these reasons, management protocols have been outlined during the last months to increase the safety of indoor areas, and activities with higher risk parameters have been subjects to restriction measures, limiting the use of the premises or the number of accesses (such as in restaurants, fitness clubs, nightclubs, offices and working places).
For the hospitality industry, the COVID-19 pandemic constitutes an unprecedented crisis, setting the clock back by about 30 years. The tourism industry used to contribute, on average in OECD countries, 4.4% of gross domestic product (GDP), 6.9% of employment, 21.5% of service exports [
25] and 6.5% of global exports [
26]. Considering international tourism, the sector is estimated to have declined between 70% [
27] and 80% [
25] across the world during 2020. OECD foresees a reasonable return to pre-pandemic levels not before 2023, due to a combination of limited travelers’ confidence and measures in place. Travel restrictions are expected to remain in place for the near future, at different levels of severity and with discontinuous patterns along time and across countries, adjusted based on the progress of the pandemic. Therefore, a “new normal” must be outlined for the hospitality sector, to boost its resilience towards the post-COVID-19 era. Management modes, routines and protocols able to deal with the transient period, together with technological innovation aimed at improving the safety conditions of re-opening, can guarantee a safe utilization of indoor environments for both staff and guests and, consequently, rebuild their confidence in the short term [
28]. Both technical and management controls are crucial actions to minimize the exposure of people to the virus, possibly travelling in the indoor air through the mechanisms mentioned above, as suggested by Kumar and Morawksa [
17] and Morawska et al. [
29]. In particular, once enhanced sanitization protocols have been implemented for the premises, IAQ monitoring appears strategic in the definition of safety conditions for the use of indoor environments, to verify the exposure to poor air quality on a regular basis. For this purpose, the application of dense networks of low-cost sensors would provide instruments for the long-term management of the issue. This could also support the design of additional solutions, both in terms of technological equipment (e.g., air purification) or management protocols aimed at reducing the risks, but also at enhancing customers’ experience [
30], in the post-pandemic era. Environmental quality in general, and IAQ in particular, has been perceived as an element of concern even before the present crisis, in the hospitality sector [
31], as well in sectors related to it (e.g., airport facilities management [
32]), as IAQ is recognized as an element to enhance the health and comfort of travelers and, therefore, a selling point with high growing potential. Previous studies in the field focused mainly on PM monitoring [
6,
13,
31,
33,
34], and for limited periods of time (e.g., hours, in the case proposed by Asadi et al. [
33], or days [
34]).
Based on these premises, we developed a longitudinal case study during the COVID-19 crisis in collaboration with a major Italian hotel, with the overarching aim of providing support to the recovery of the hospitality activities, based on insights gathered by IAQ. Specifically, our study has the following aims: (i) developing a longitudinal data collection for IAQ in semi-continuous mode over a 16-week timespan, while previous studies in the field of IAQ in the hospitality sector focused on limited periods of time, (ii) collecting IAQ data in different environments within a hospitality premise, overcoming the limitation to specific areas (e.g., guestrooms or restaurants), and (iii) integrating data about different airborne contaminants of concern in indoor environments, to better capture the overall IAQ trends, affected by sources of contamination of a different nature in different environments.
This was accomplished by implementing an integrated IAQ continuous monitoring system of different parameters, i.e., PM, VOCs and CO2, aimed at collecting data to build a robust dataset for the characterization of IAQ in the hospitality industry. Different environments have been included in the present study and the monitoring period covered 16 weeks.
2. Materials and Methods
2.1. Experimental Design
The project was developed through a partnership with a major hotel of Turin, i.e., DoubleTree by Hilton Turin Lingotto, with the aim of supporting the management of air quality at the time of pandemic. Considering the unavailability of technologies able to monitor microbial contamination in real time, a set of parameters has been defined for the characterization of IAQ, able to describe the crowding conditions of the indoor environments and the possible sources of pollution. In particular, we identified PM, VOCs and CO2 as key contaminants of concern. Environments with different purposes have been monitored, in order to characterize the IAQ of the whole premise over a long period of time.
The monitoring activity was carried out in an online semi-continuous mode, along 16 weeks, across winter and spring of 2021. Data were analyzed to describe the contamination developed throughout the whole period of the study, in the different environments tested.
2.2. Site Details
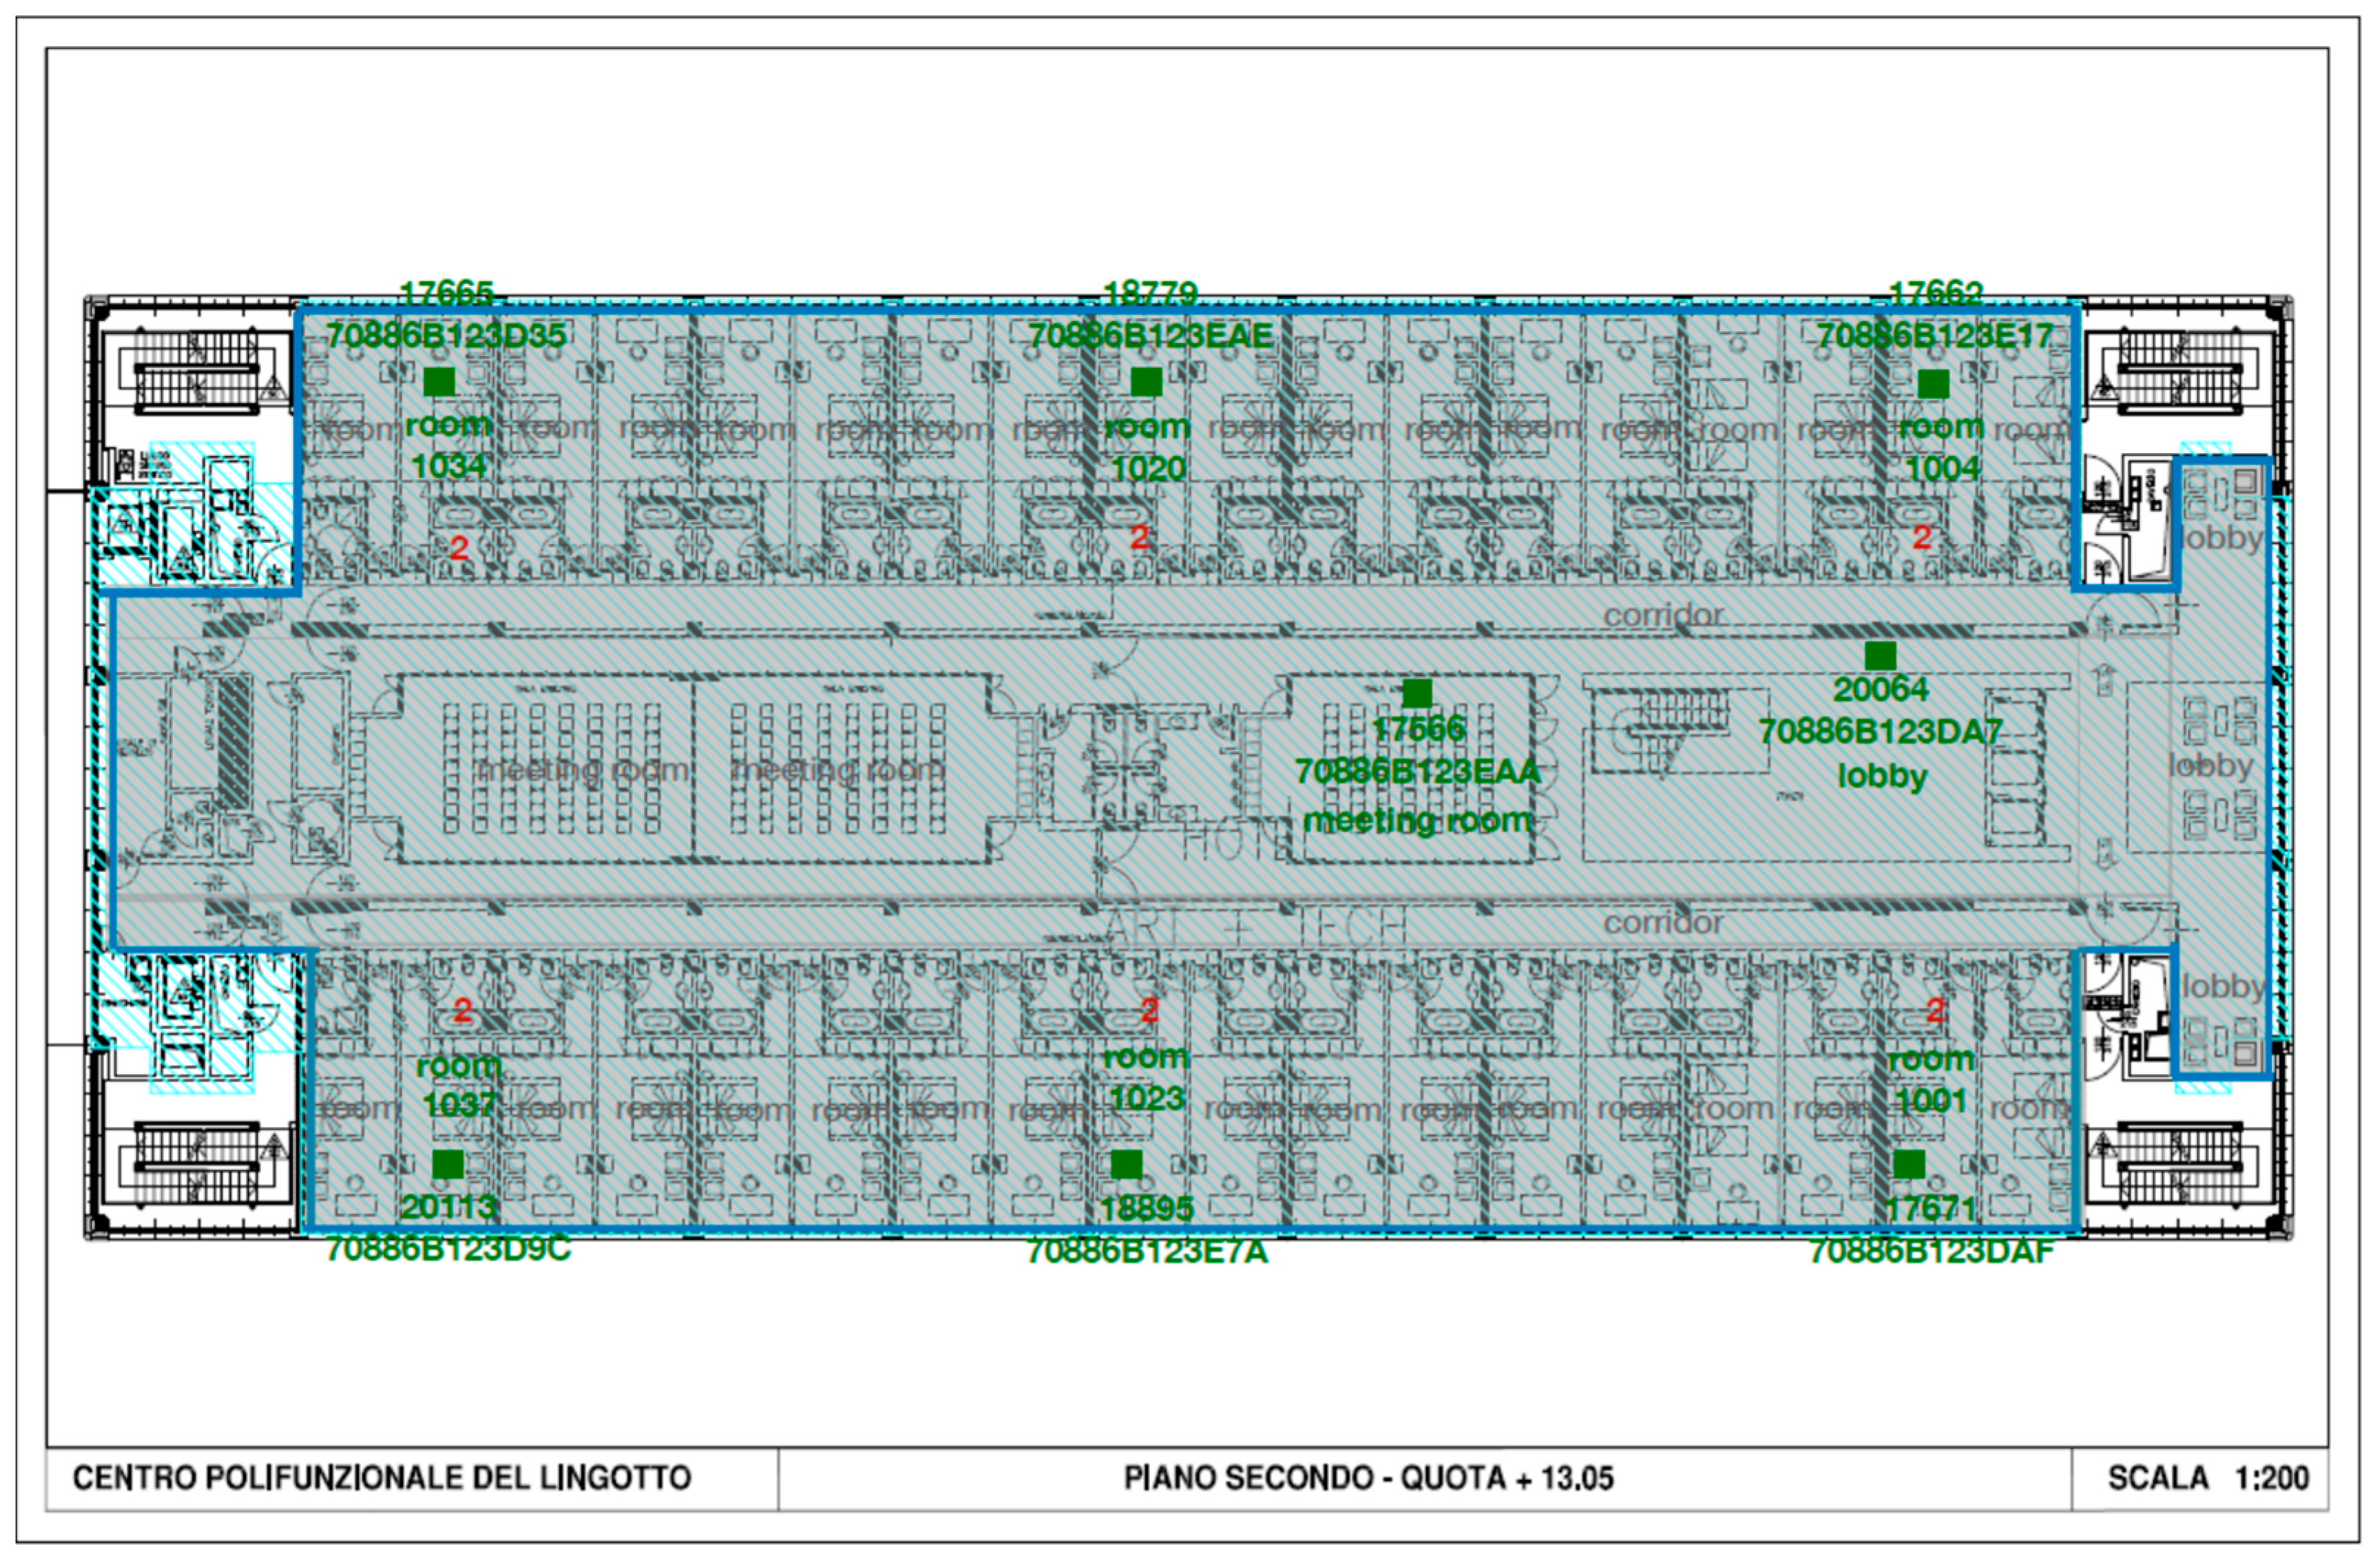
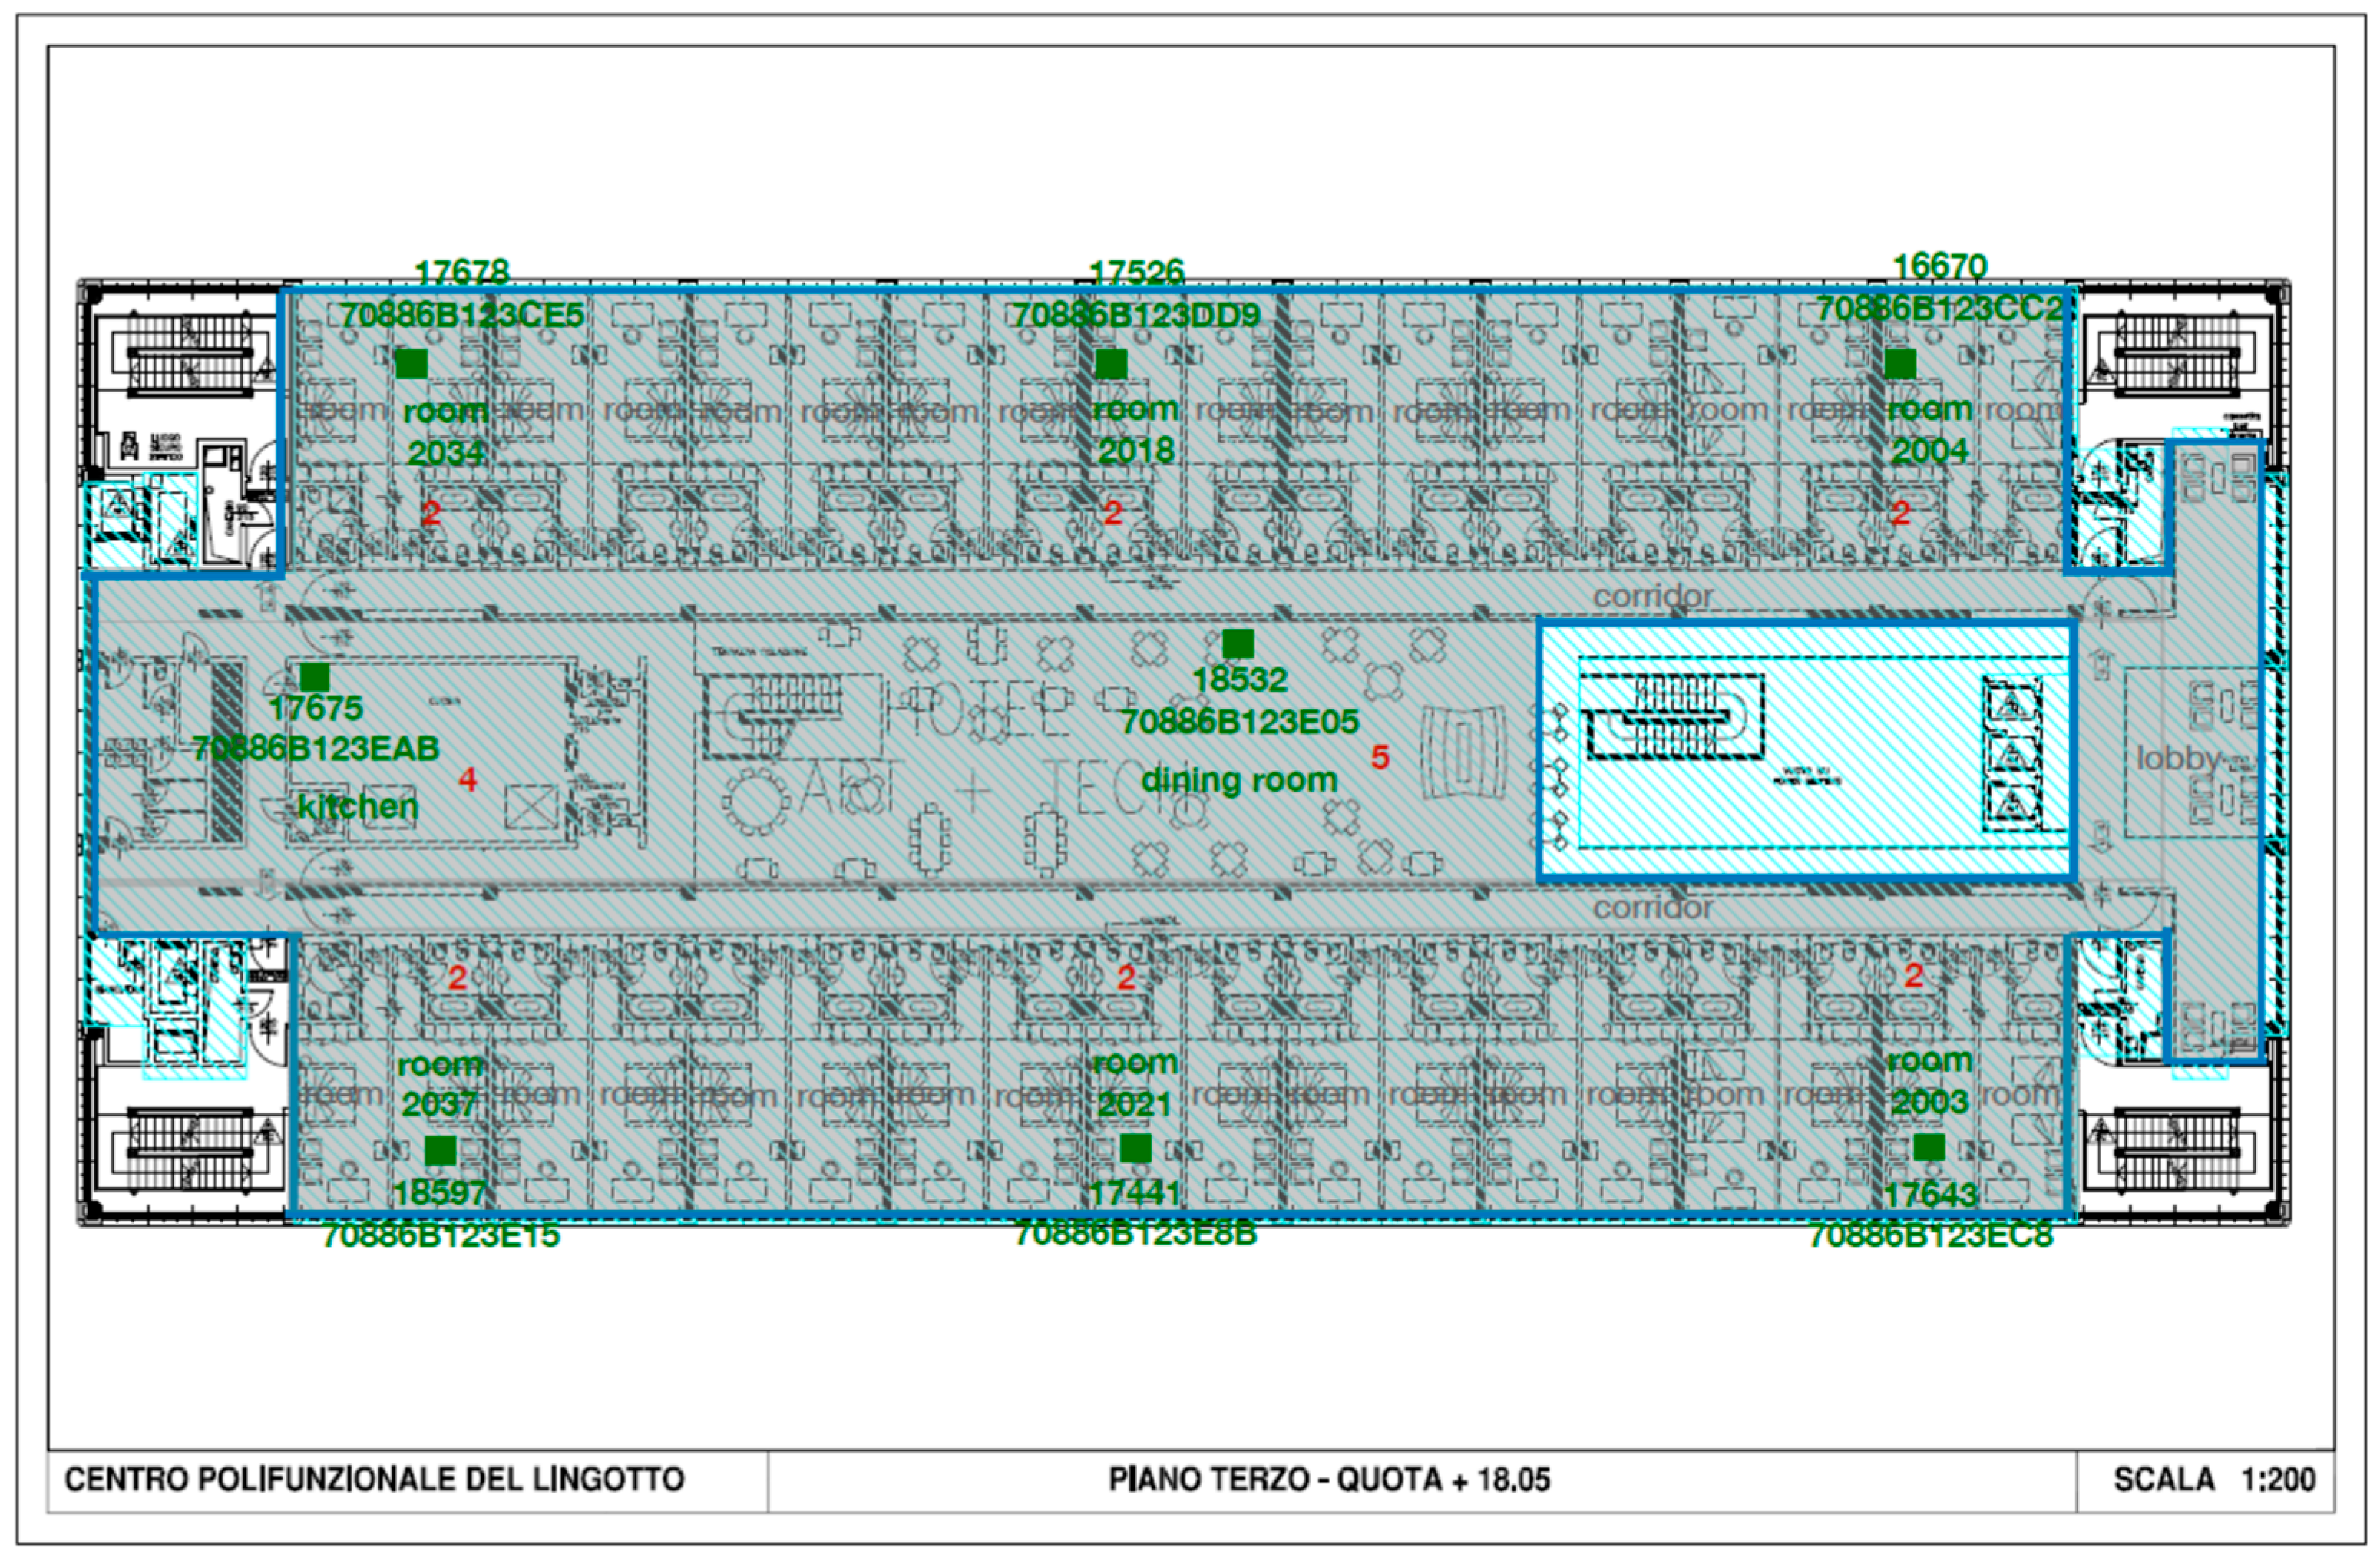
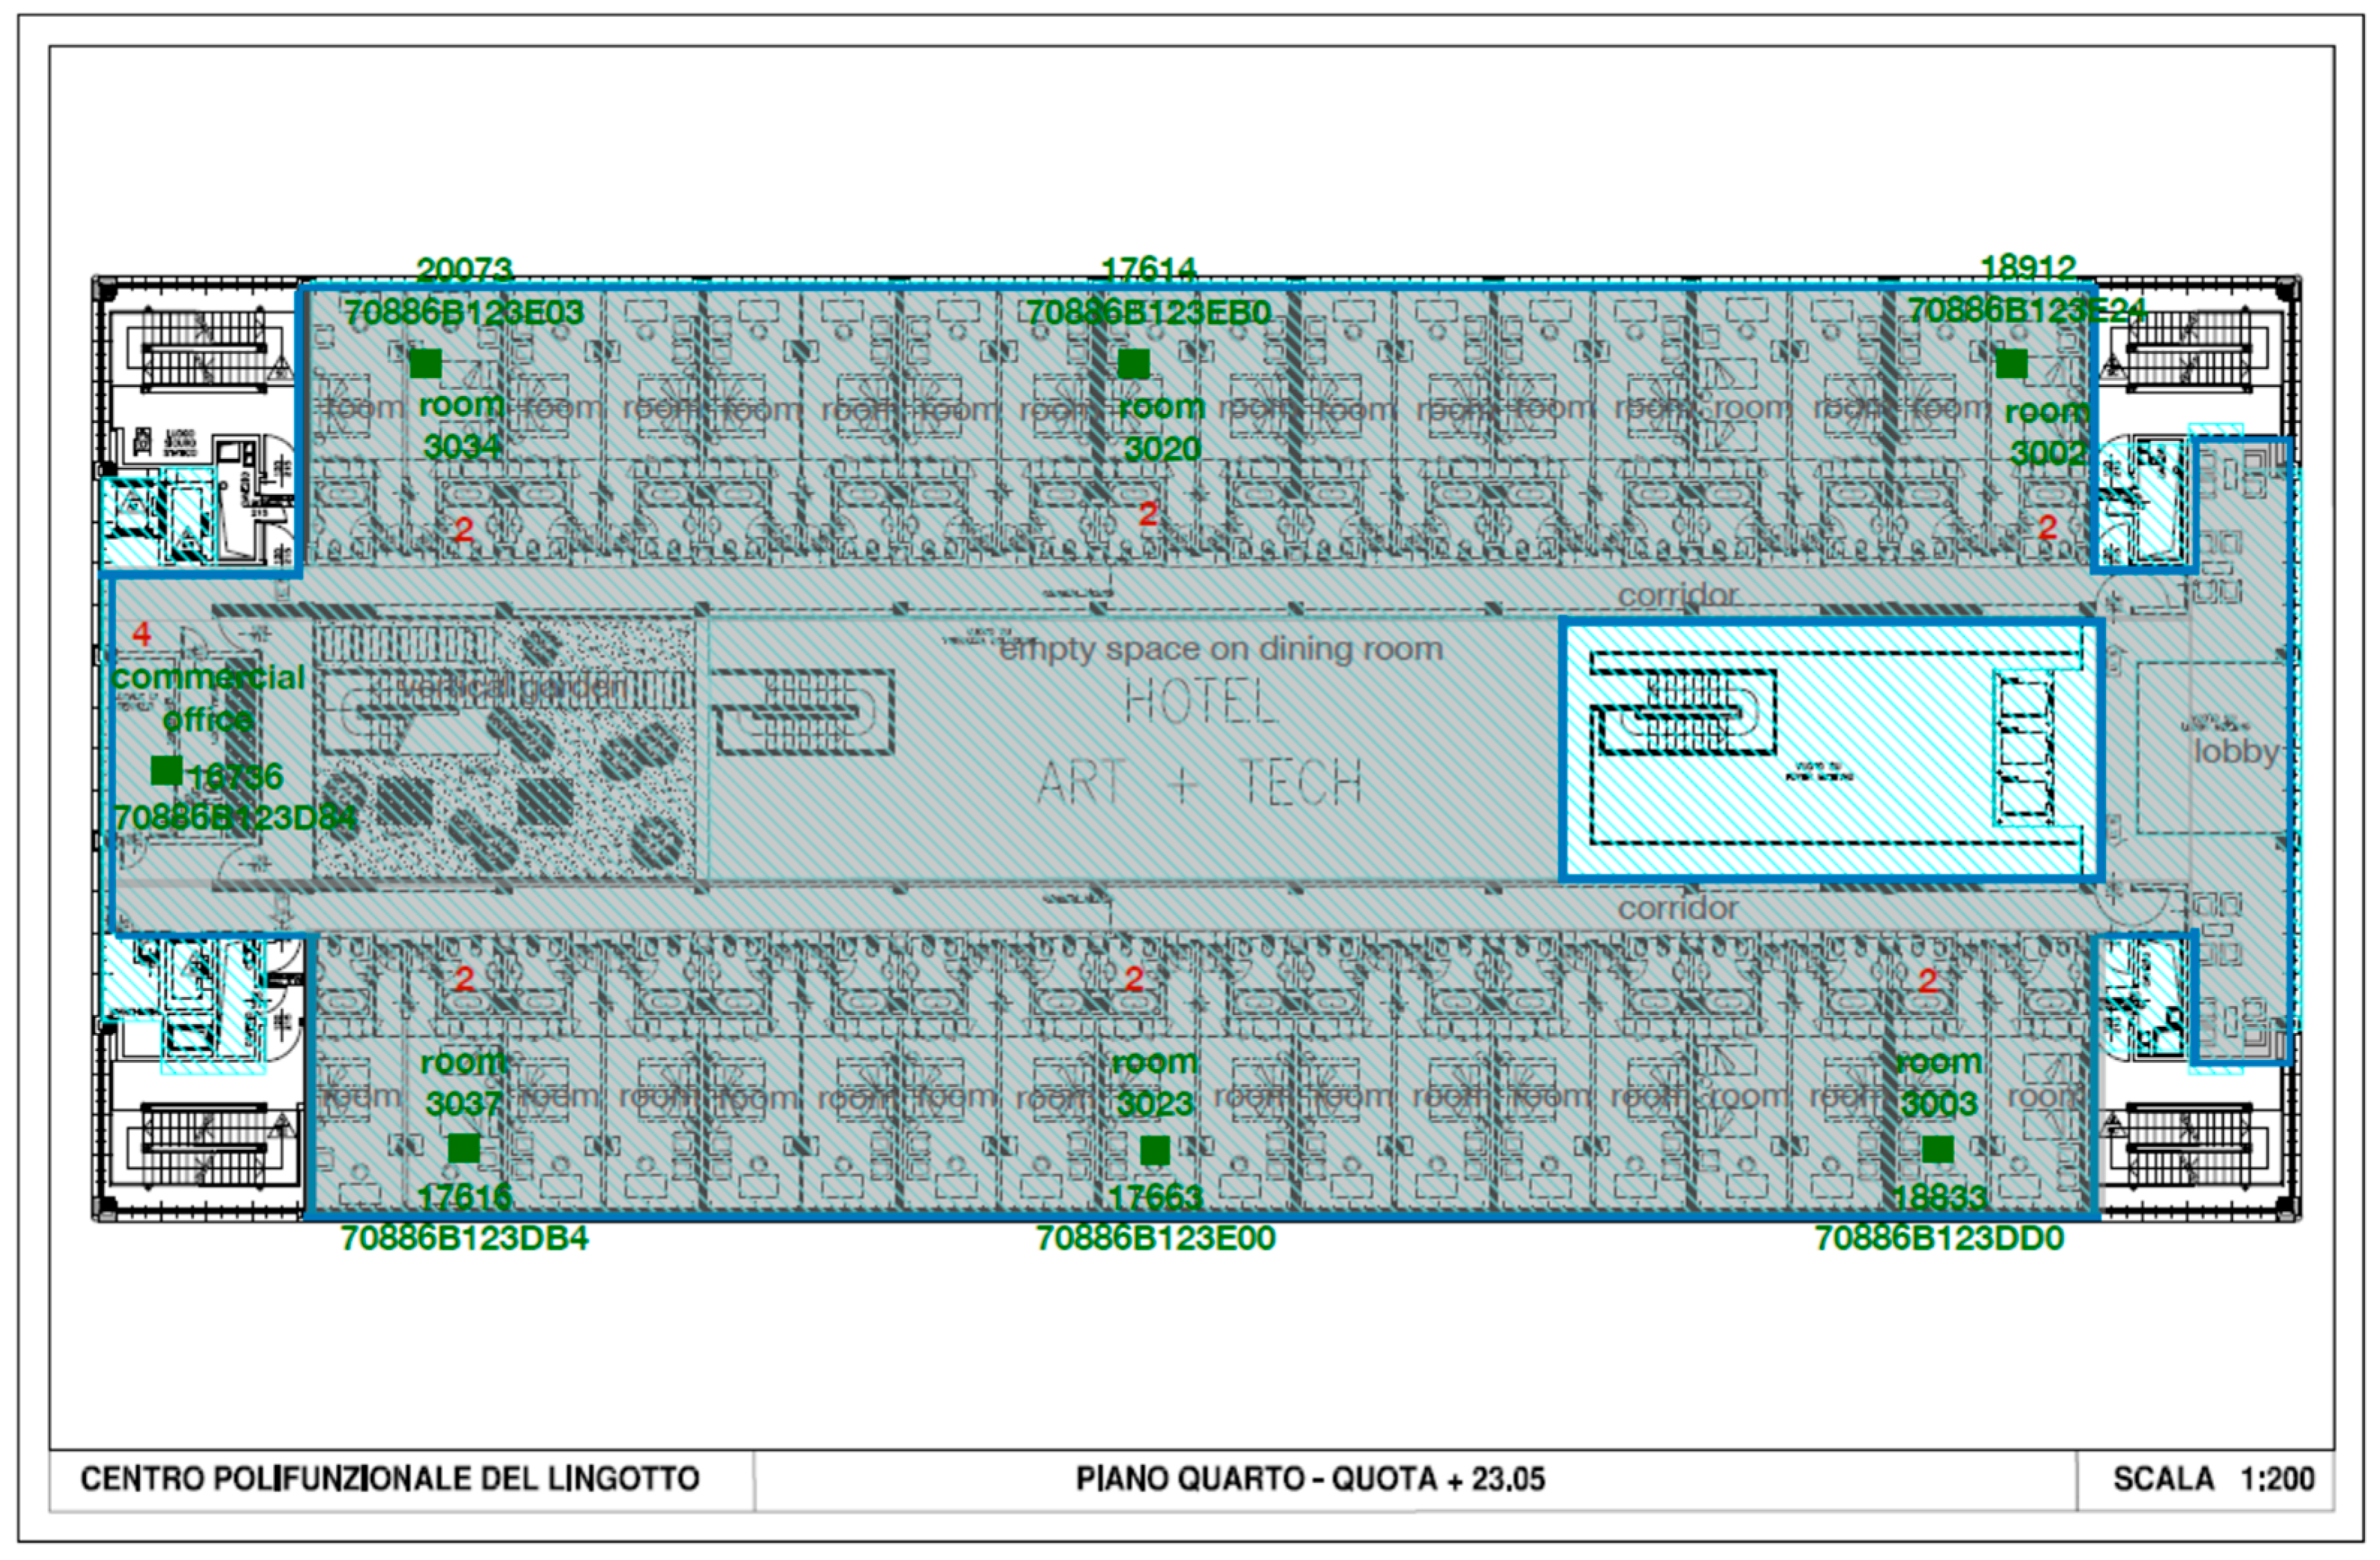
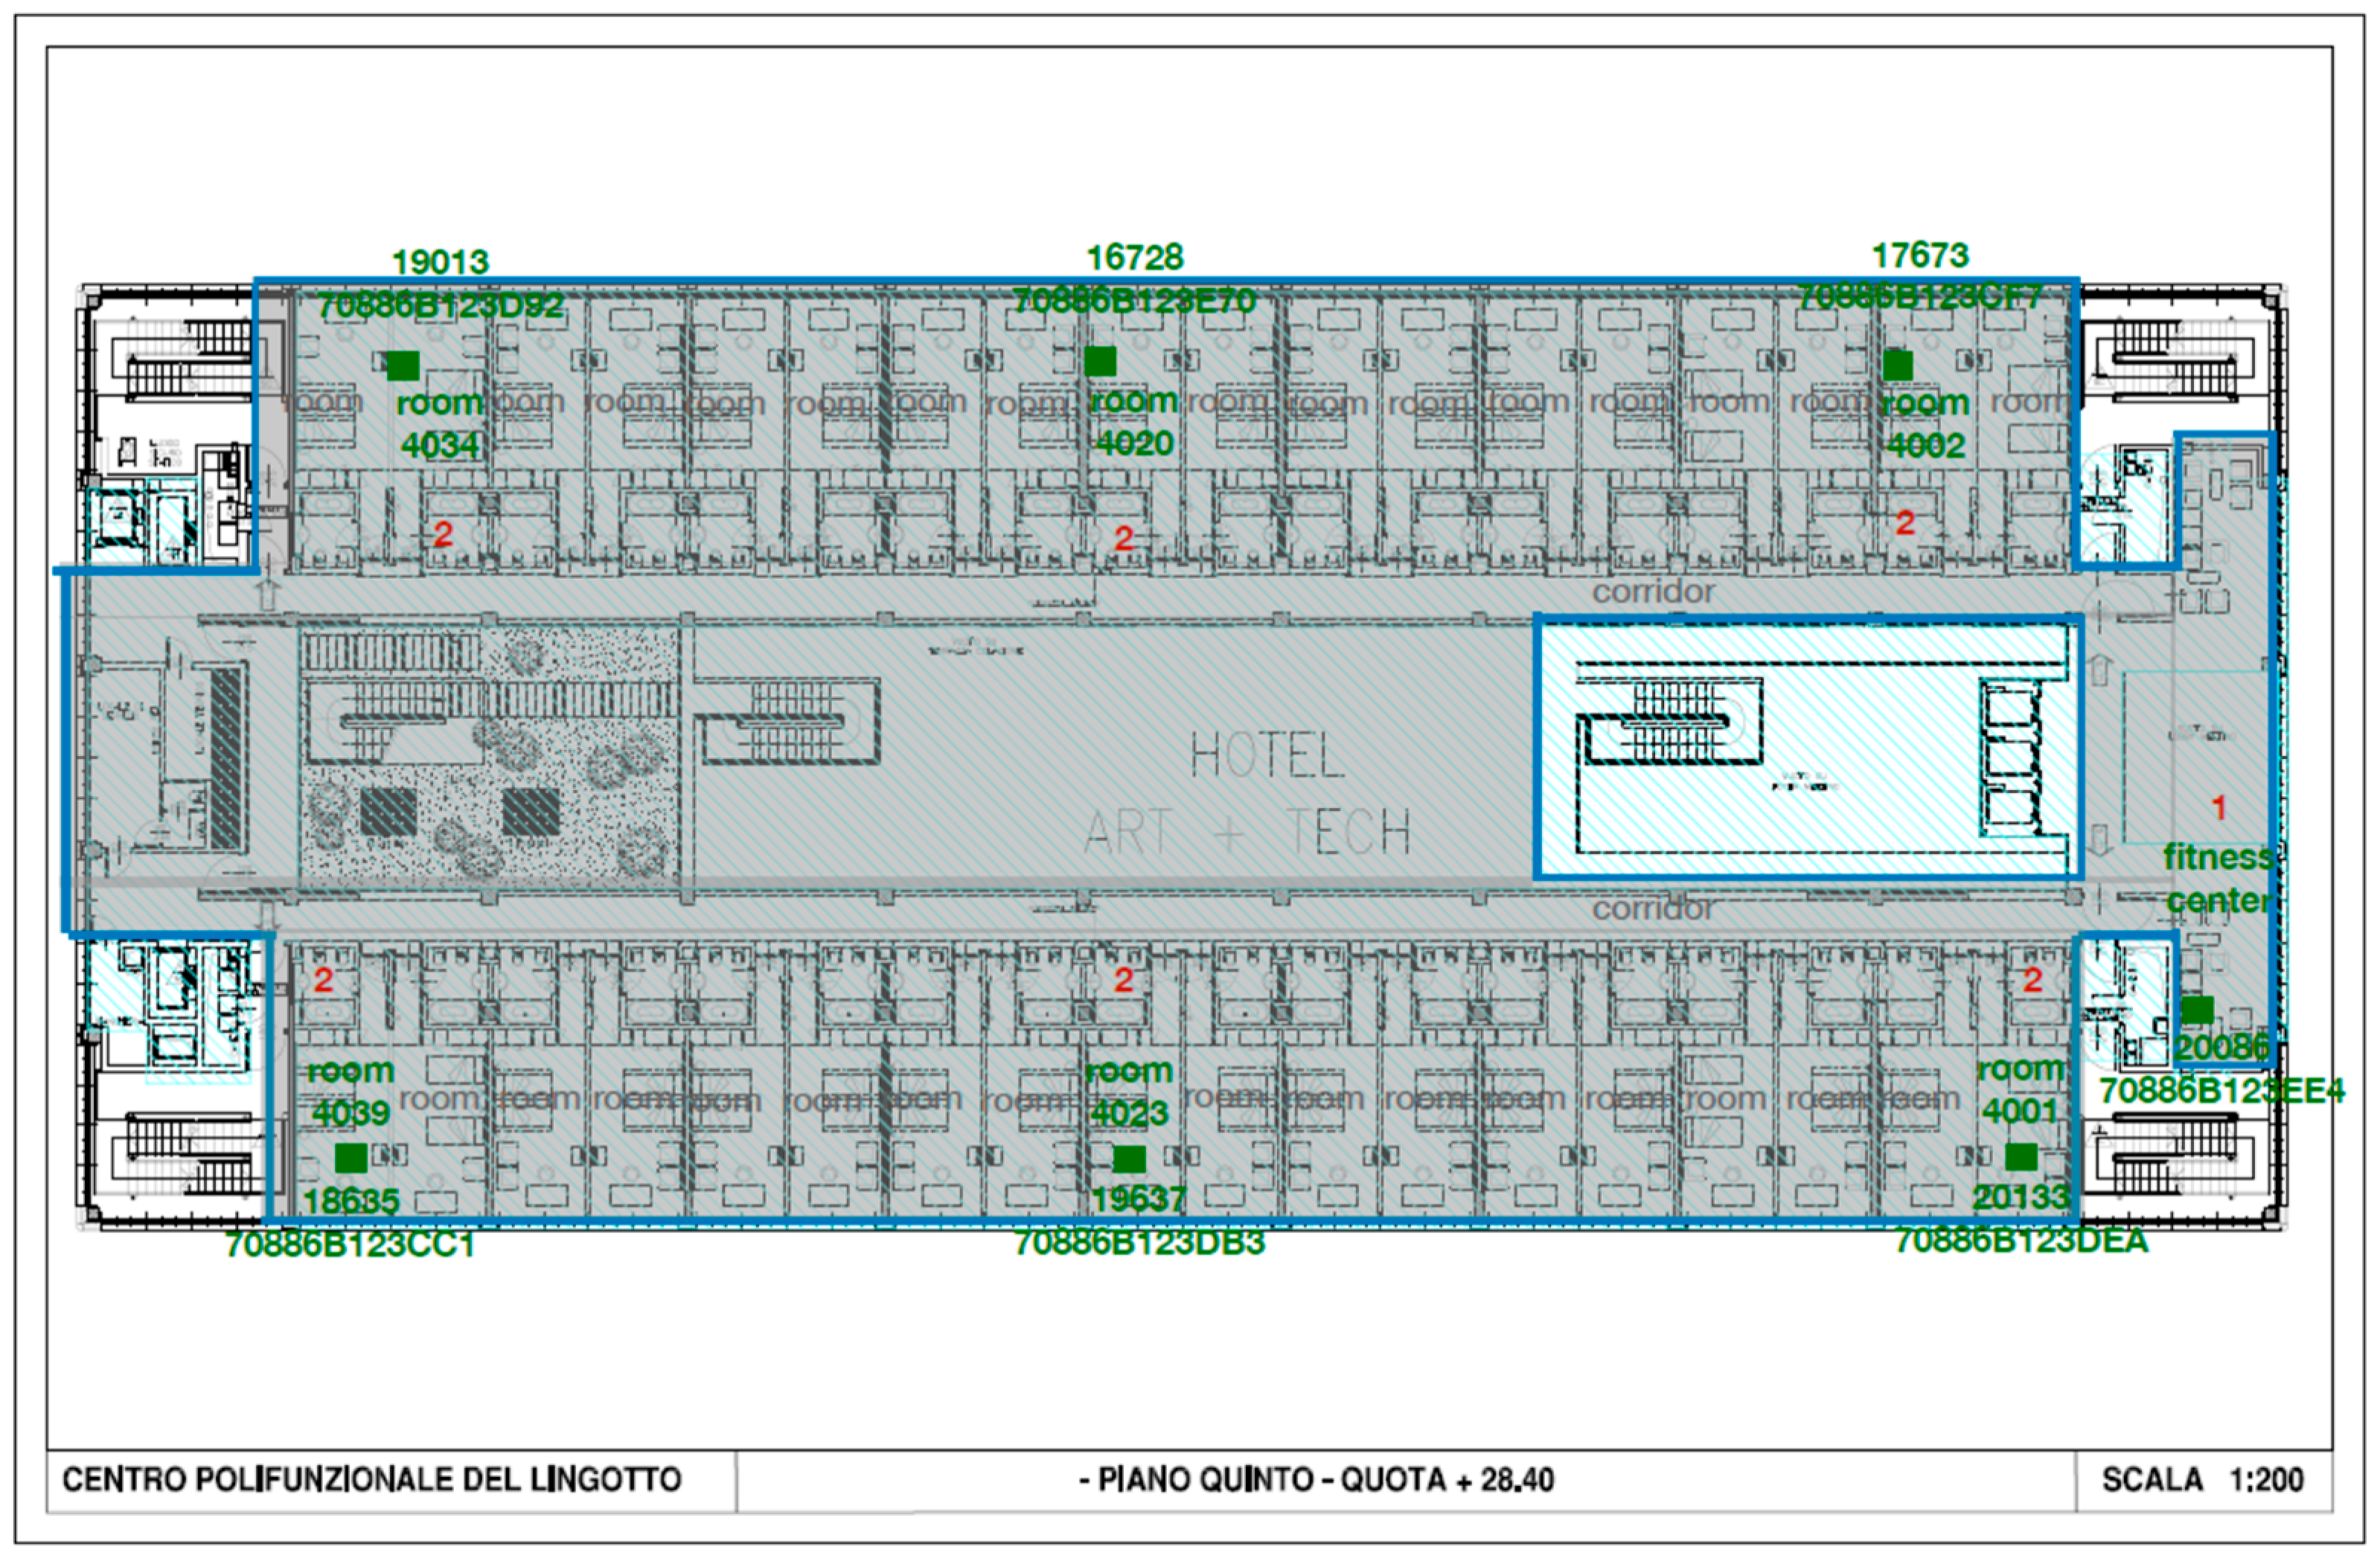
The building was designed by Renzo Piano and it is located in the historic former FIAT factory, next to the Lingotto Congress Center and the underground station, in the city of Turin (Northern Italy). This hotel retains a distinguishing architecture, with large windows and high ceilings, providing natural light, and the former FIAT test track on the roof. The hotel has 144 rooms developed over 4 floors and typically hosts guest all throughout the year, visiting the city not only for business purposes but also for tourism. The building is equipped with a centralized air treatment and ventilation system, treating all the different environments uniformly.
The monitoring network has been distributed over different kinds of environments and, in particular, the overall ratio was to cover spaces regularly occupied, namely by at least 1 person for not less than 1 h a day, and the rooms have been chosen in sufficient numbers to represent each floor. The following table (
Table 1) reports details of the monitored environments, in terms of approximated size and the number of monitoring devices installed.
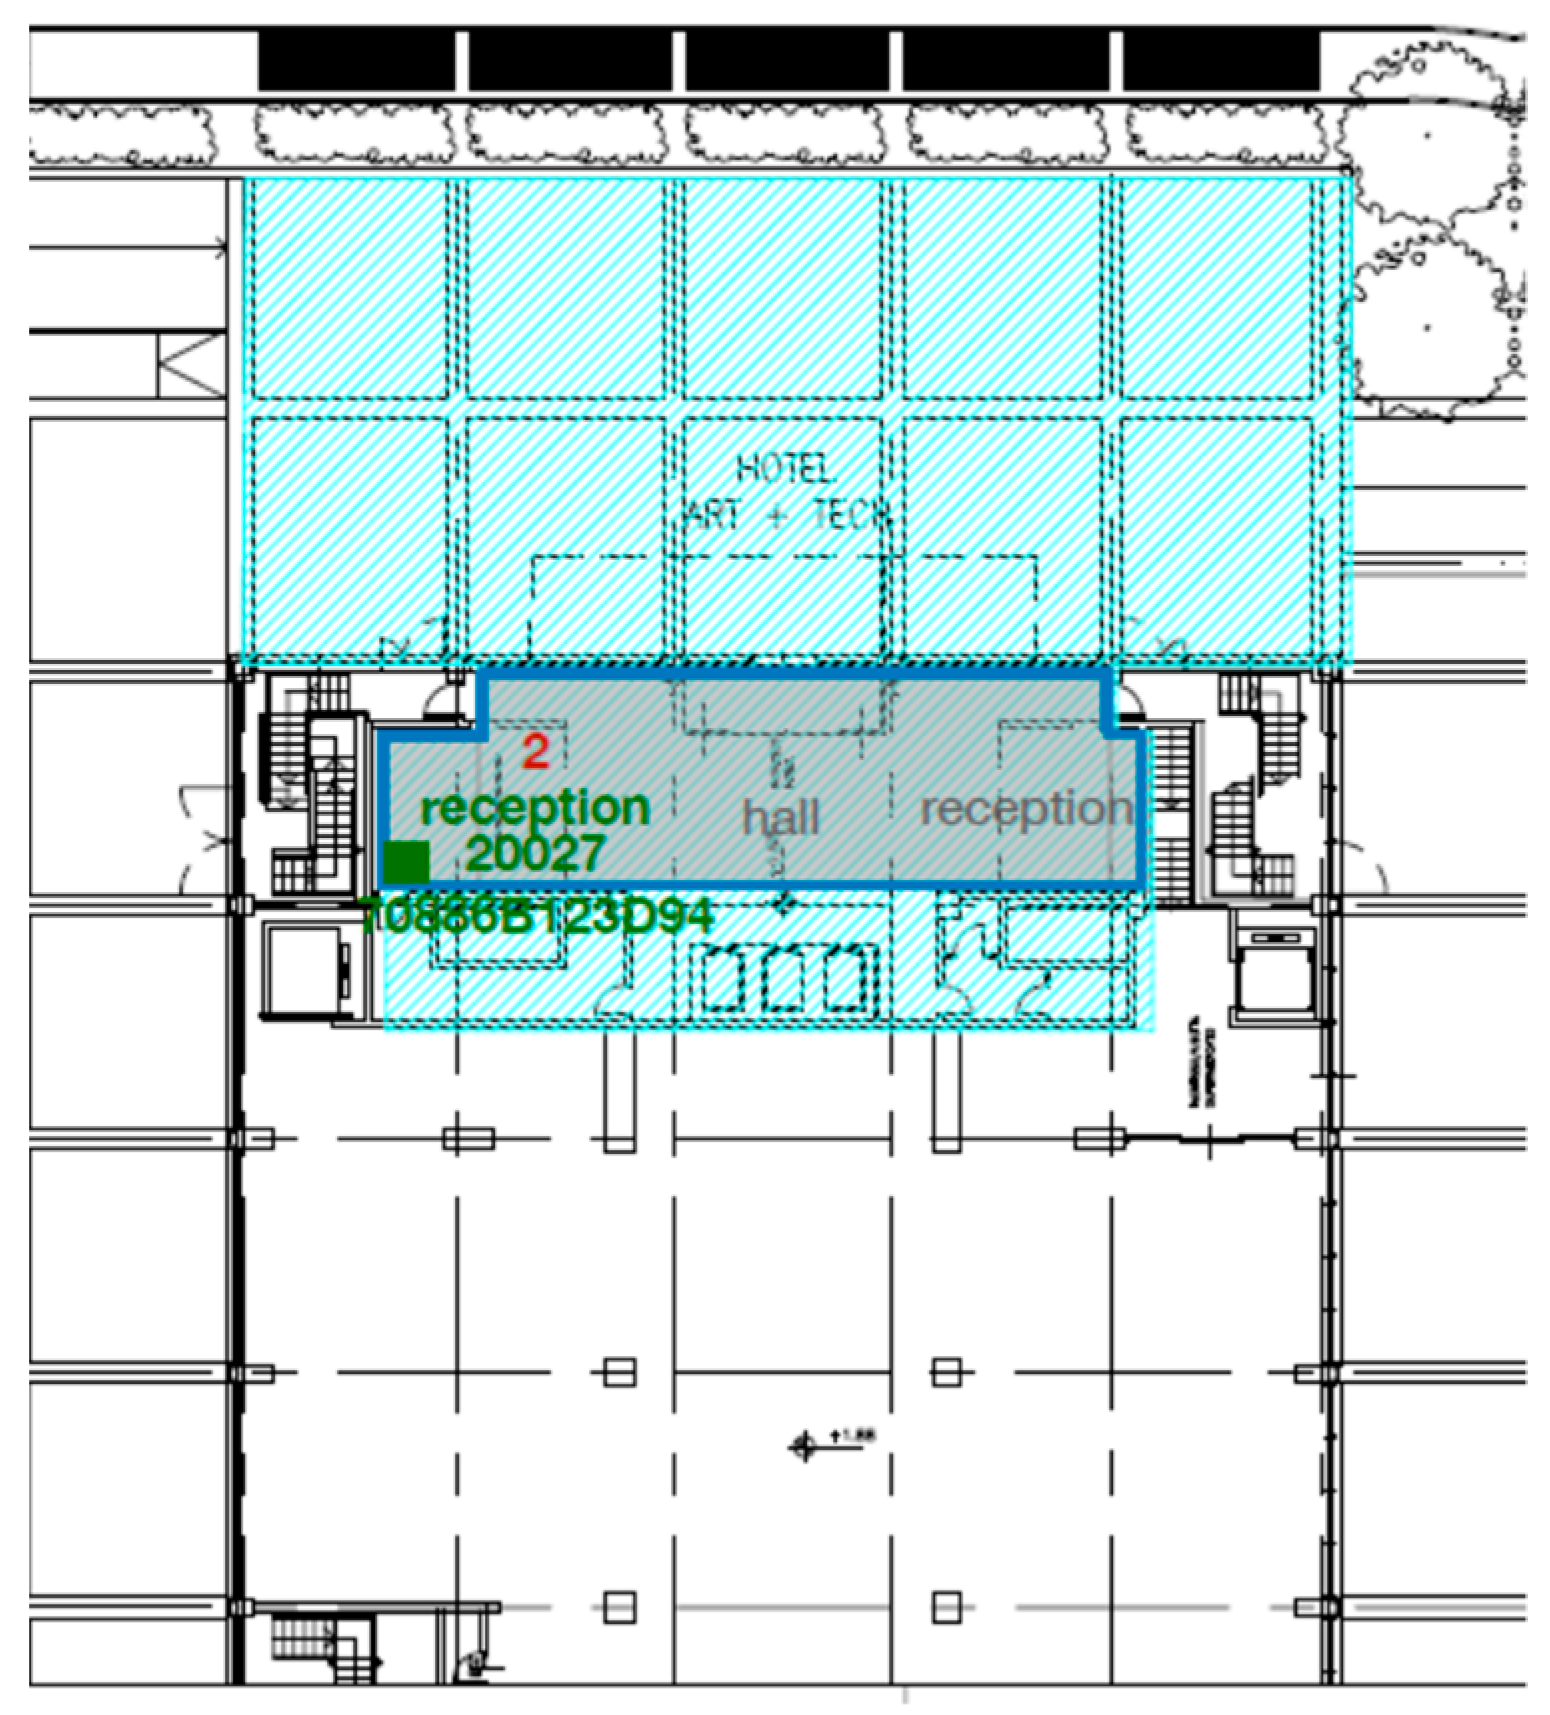
The following figures (
Figure 1,
Figure 2,
Figure 3,
Figure 4 and
Figure 5) report the outline of the monitored environments (in light blue) and the location of each monitoring device (in green). The placement of the devices has been defined based on a compromise between the ideal location, i.e., the most representative of the average IAQ within the room, and the availability of the power supply. Each device has been installed at least 1.5 m from the floor, on walls free from direct sources of pollution, e.g., HVAC units, printers, cooking or cleaning stations, etc.
2.3. Monitoring Techniques and Data Quality
The monitoring network has been built on company-grade monitoring devices, commercially available and supplied by the partner company (Planetwatch sas—Awair). The devices record data on various airborne pollutants, as well as environmental parameters, and they are compliant with the RESET standard [
35]. As no international standard has been set neither in terms of monitoring methods and devices, nor of contaminants of concern at the policy level, RESET standard is the first sensor-based and performance-driven data standard for the general-purpose indoor environments. The RESET standard and certification creates a structure for data quality, continuous monitoring and benchmarking, considering a set of environmental parameters and airborne contaminants.
The pollutants considered in in this study are PM 2.5 (measured in μg/m3), VOC (parts per billion—ppb) and CO2 (parts per million—ppm).
PM 2.5 are detected by a laser particle sensor (light scattering), able to measure the air opacity by the projection of an infrared light beam and the detection of photons that are scattered by the impact, with particles passing through the chamber, by a photodiode. This converts the light into a signal which is proportional to particle count and concentration, in a certain size range [
32]. The sensor is provided by Honeywell Sensing and the model is HPMA115S0. It is calibrated with the exposure to tobacco cigarette smoke, which correlates with combustion processes and traffic emissions.
VOCs are detected by a Multi-pixel Metal Oxide Semiconductor Sensor (MOS) [
36] supplied by Sensirion (SGP30) and calibrated based on ISO 16000-29. The sensing element is basically a capacitor, able to adjust its capacitance on the circuit, thanks to the specific polymer constituting the dielectric [
37]. The level of modification into the capacitance is based on the levels of environmental parameters detected, i.e., temperature and humidity, which are determined in this way.
A similar sensor is applied for the determination of the temperature and relative humidity, i.e., a Complementary Metal–Oxide–Semiconductor (CMOS) Sensor, widely appreciated for its high noise immunity and low static power consumption.
A Non-Dispersive Infrared Detector (NDIR) is applied for the detection of carbon dioxide and it is the most common type of sensor used for this purpose on the market. In these sensors, an infrared (IR) lamp directs light close to the CO
2 absorption band of 4.26 microns, which works as a marker for CO
2 molecules’ identification, into a tube filled with air. As the light wave travels along the tube, the CO
2 molecules absorb the specific wavelength and, at the end of the tube, the remaining light passes through an optical filter and it is measured by the IR light detector. The measure of CO
2 concentration is calculated considering the direct proportion between the light absorbed by CO
2 molecules (calculated as the difference between the light emitted by the IR lamp and the light received by the detector) and the number of molecules inside the tube [
38]. The equipped sensor is T6703, supplied by Telaire/Amphenol, calibrated by Telaire’s Patented ABC Logic Self-Calibrated Algorithm.
The devices installed in the hotel acquired data every five minutes. This sampling frequency offers a good compromise between detailed monitoring, allowing to evaluate specific events, such as human activities generating pollution and computational concerns, avoiding overcharging the data acquisition process. With the set sampling frequency, in fact, we are able to detect both quite instant activities, such as perfume diffusion, and more long-term activities, such as the permanence of guests in a room without opening the windows. Over a period of 4 months, our data acquisition has generated only 10 Mb of data, which offers great perspective for the scale-up of the process, with the development of wider networks, ensuring the collection of detailed information.
Each device is equipped with an integrated WiFi communication module for wireless data communication and the connection to the internet cloud, and it is powered by an external wall-mount 220 Vac power supply. The general operating range is between 0 and 40 °C for temperature and 10–85% for relative humidity. Details about output resolution, measuring range and accuracy of each sensor are reported in
Table 2.
2.4. Data Processing
We have used the R software to process the data collected. The software allows solid statistical analysis and implements a specific library, “openair”, offering relevant tools for air quality data analysis (
https://cran.r-project.org/web/packages/openair/index.html, accessed on 2 May 2021).
The data has been divided into sets, based on the type of environment where the device is installed. In particular, we focused on five specific locations in the hotel: rooms, kitchen, fitness center, hall and restaurant. The activities that take place in these environments are representative of the hotel activities in general and they are of particular interest for pollutant detection.
For each environment and for each pollutant, we analyzed the concentration values over the whole period, in terms of evolution of the parameters over time.
The analyses described above have been replicated for each environment monitored. IAQ data deriving from guestrooms have been aggregated to cope with privacy-related concerns.
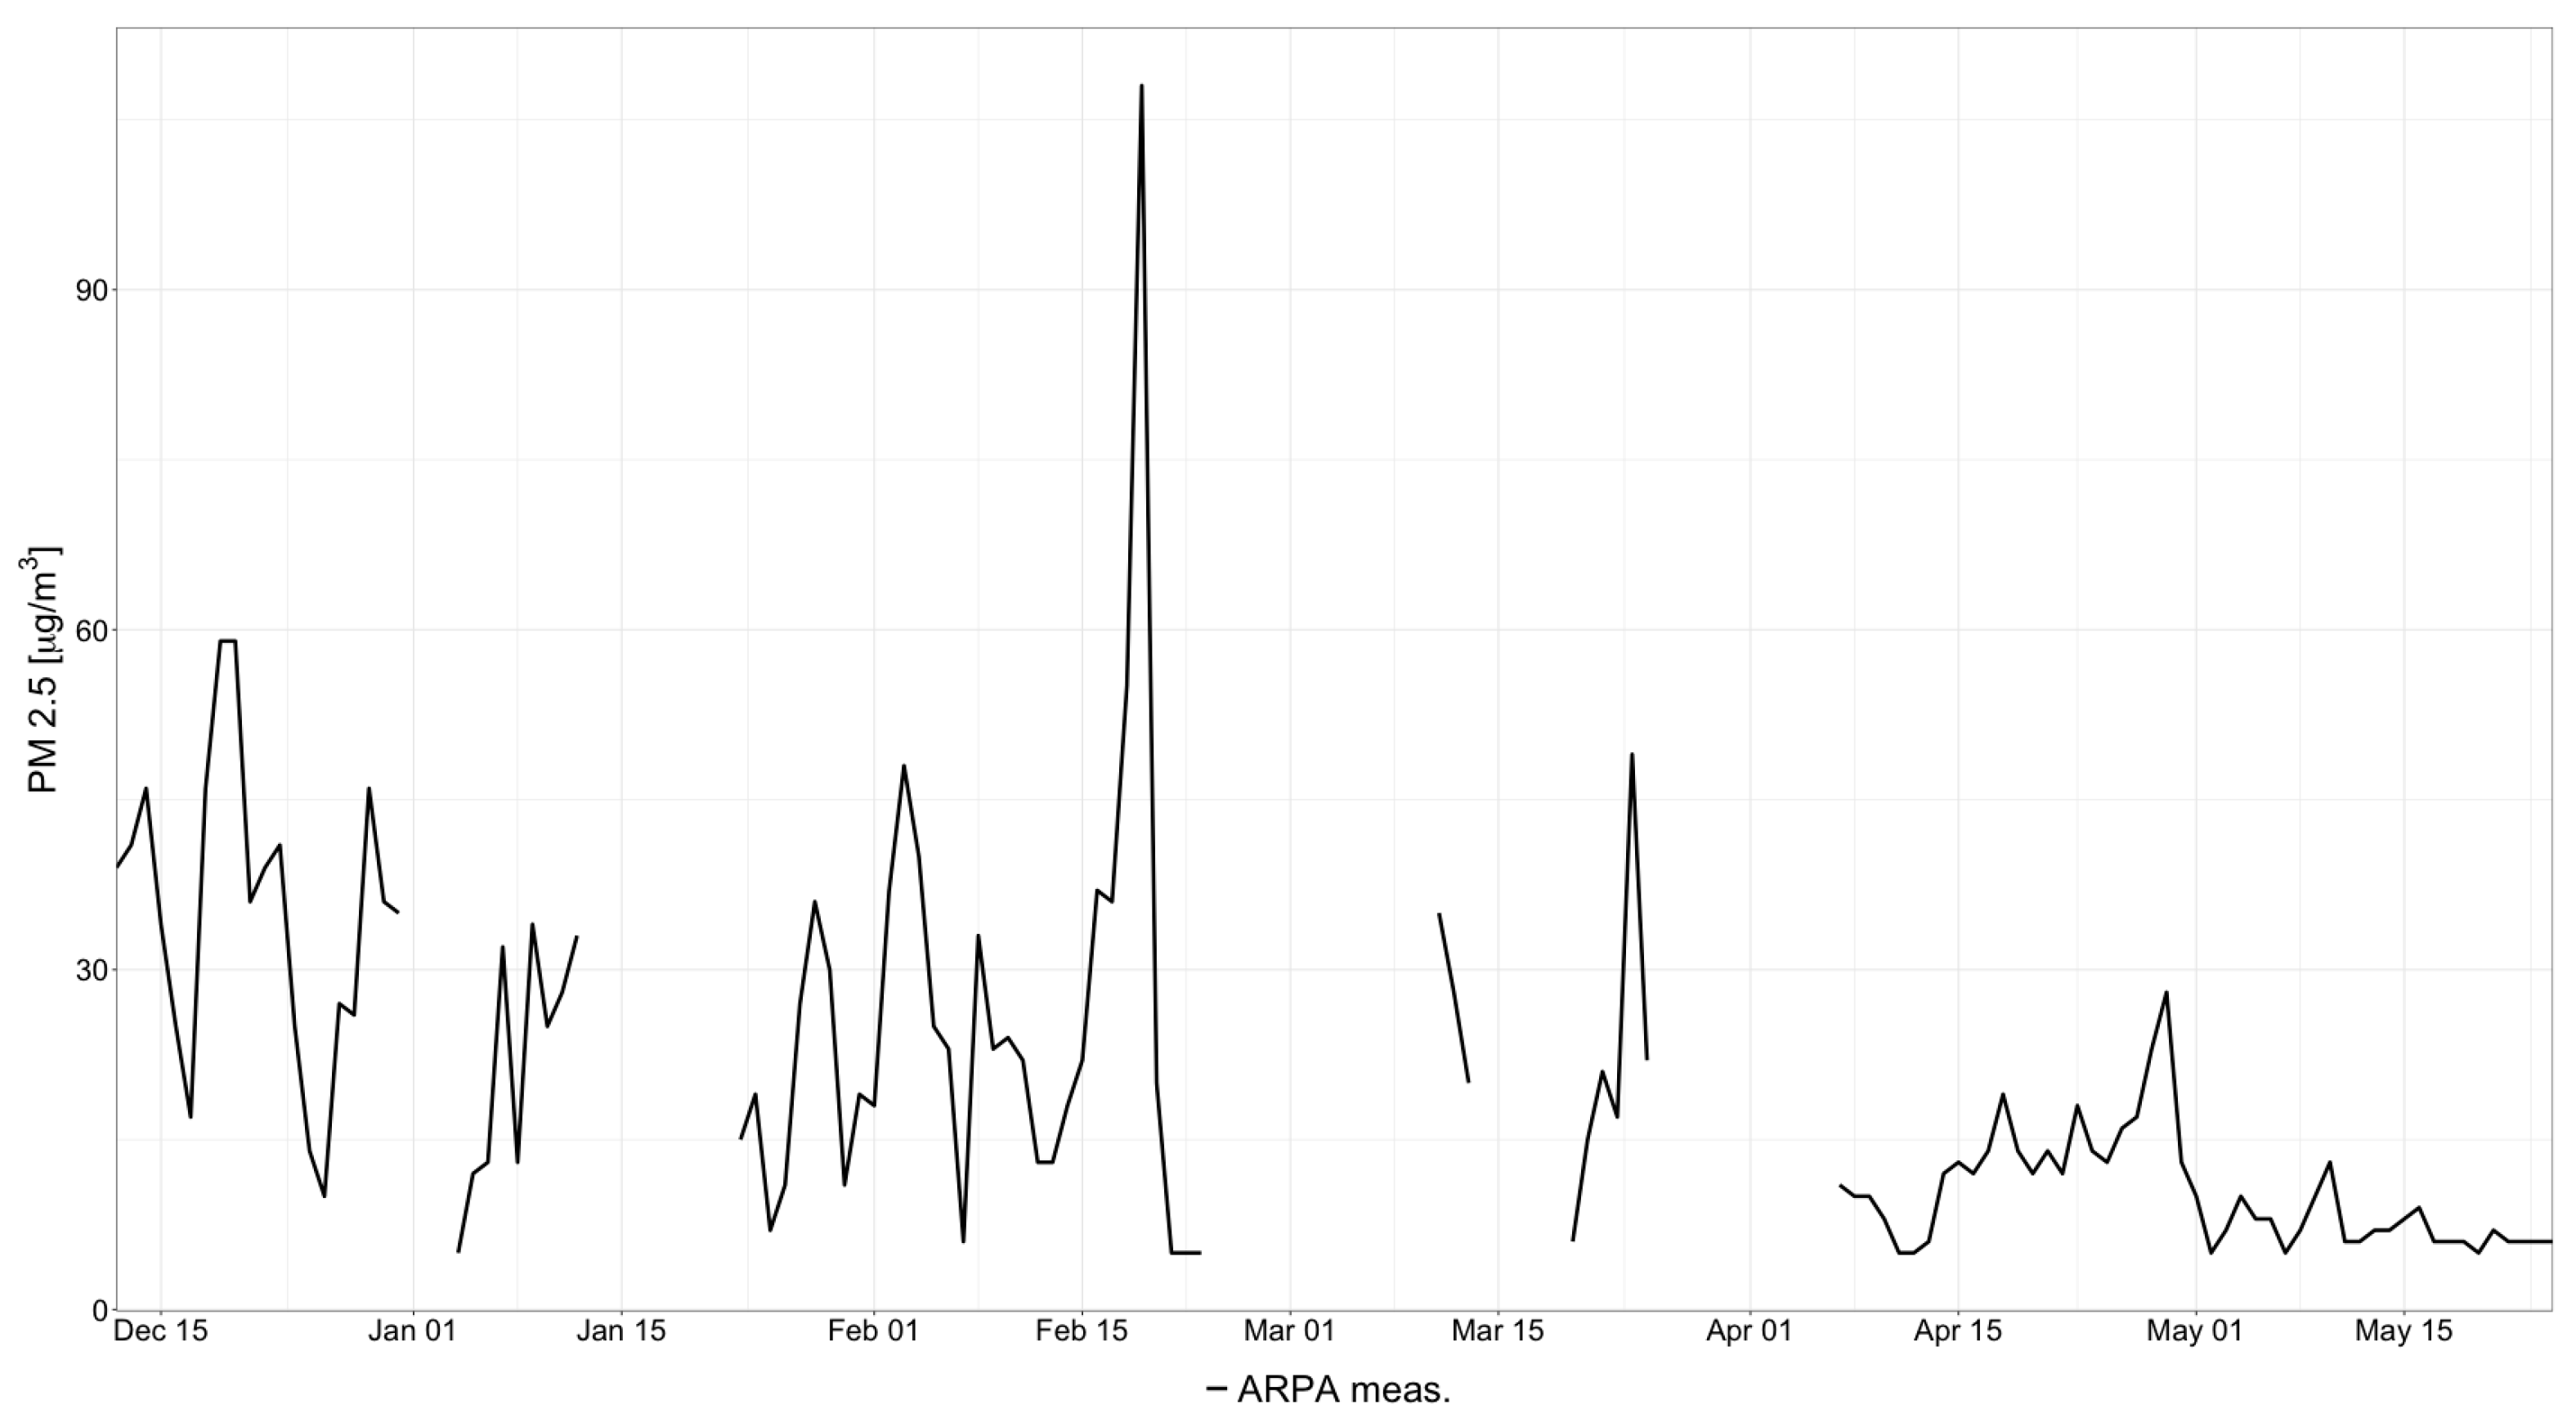
Finally, outdoor air quality data collected and made publicly available by the Environmental Authority of Piemonte Region, i.e., Arpa Piemonte, have been retrieved (Stazione Torino Lingotto, data retrieved from
http://www.regione.piemonte.it/ambiente/aria/rilev/ariaday/ariaweb-new/, accessed on 2 May 2021). Concentration values and trends registered outdoors were then matched with indoor data collected during the present study, in order to identify possible analogies with the concentration values detected for the contaminants of concern. The ARPA monitoring station in the proximity of the building registers data about different contaminants, such as ammonia, nitrogen dioxide, benzene, black carbon, ozone, etc. (
http://webgis.arpa.piemonte.it/qualita_aria_webapp/dati_anagrafici/index.php?NUMCODICE=001272-806, accessed on 22 April 2021).
4. Discussion and Conclusions
The COVID-19 crisis has highlighted the relevance of IAQ management, especially in indoor environments, where crowding and people’s turnover may give rise to an increased risk of infection related to the exposure to human aerosols. For the hospitality sector, so heavily affected by travel restrictions and containment measures as a response to the pandemic, controls become crucial to design a pathway towards safe reopening and, in that perspective, towards a sustainable management of premises [
39]. Following the hierarchical structure of controls aimed at facing the challenges posed by the pandemic (originally proposed by the CDC [
40] and revised by Morawska et al. [
29]), both administrative and technical actions must enter the management routine of hospitality facilities. As a first response to the surge of the crisis, mainly operational protocols have been implemented, based on standard approaches, such as disinfection of surfaces, limitations for the use of indoor environments and obligation to wear personal protective equipment, but more sophisticated approaches are required in the long term. With our study, we developed a case study in partnership with a major hotel facility, during the pandemic, aimed at implementing a smart IAQ monitoring network into a real-scale context. The study provides a set of contributions to the literature in the field and to practice.
First, we conducted longitudinal data collection over a long period of time, based on a monitoring network fully compliant with the RESET IAQ standards. This represents a major contribution, as, to our knowledge, this is the very first application of RESET standards in the hospitality sector. Moreover, previous studies in the field focused only on spot detection of IAQ and underlined the criticality of prolonging the monitoring period, in order to avoid singularities and support the understanding of local-scale phenomena. In the context of the pandemic and post-pandemic era, the network equipped in the hotel offers the basis for the implementation of a steady monitoring routine, supporting the analysis of the influence of specific activities and occupation of the different areas in the IAQ, in order to provide information to the facility management. For example, from the observation of IAQ data in the period of study, it is possible to detect how the pandemic affected the access to the hotel. Due to travel restrictions related to the pandemic, in fact, the typical customers were limited to business and the average visit schedule excluded the weekends, when we registered the minimum values for all the airborne contaminants monitored, on a regular basis and for all the environments monitored.
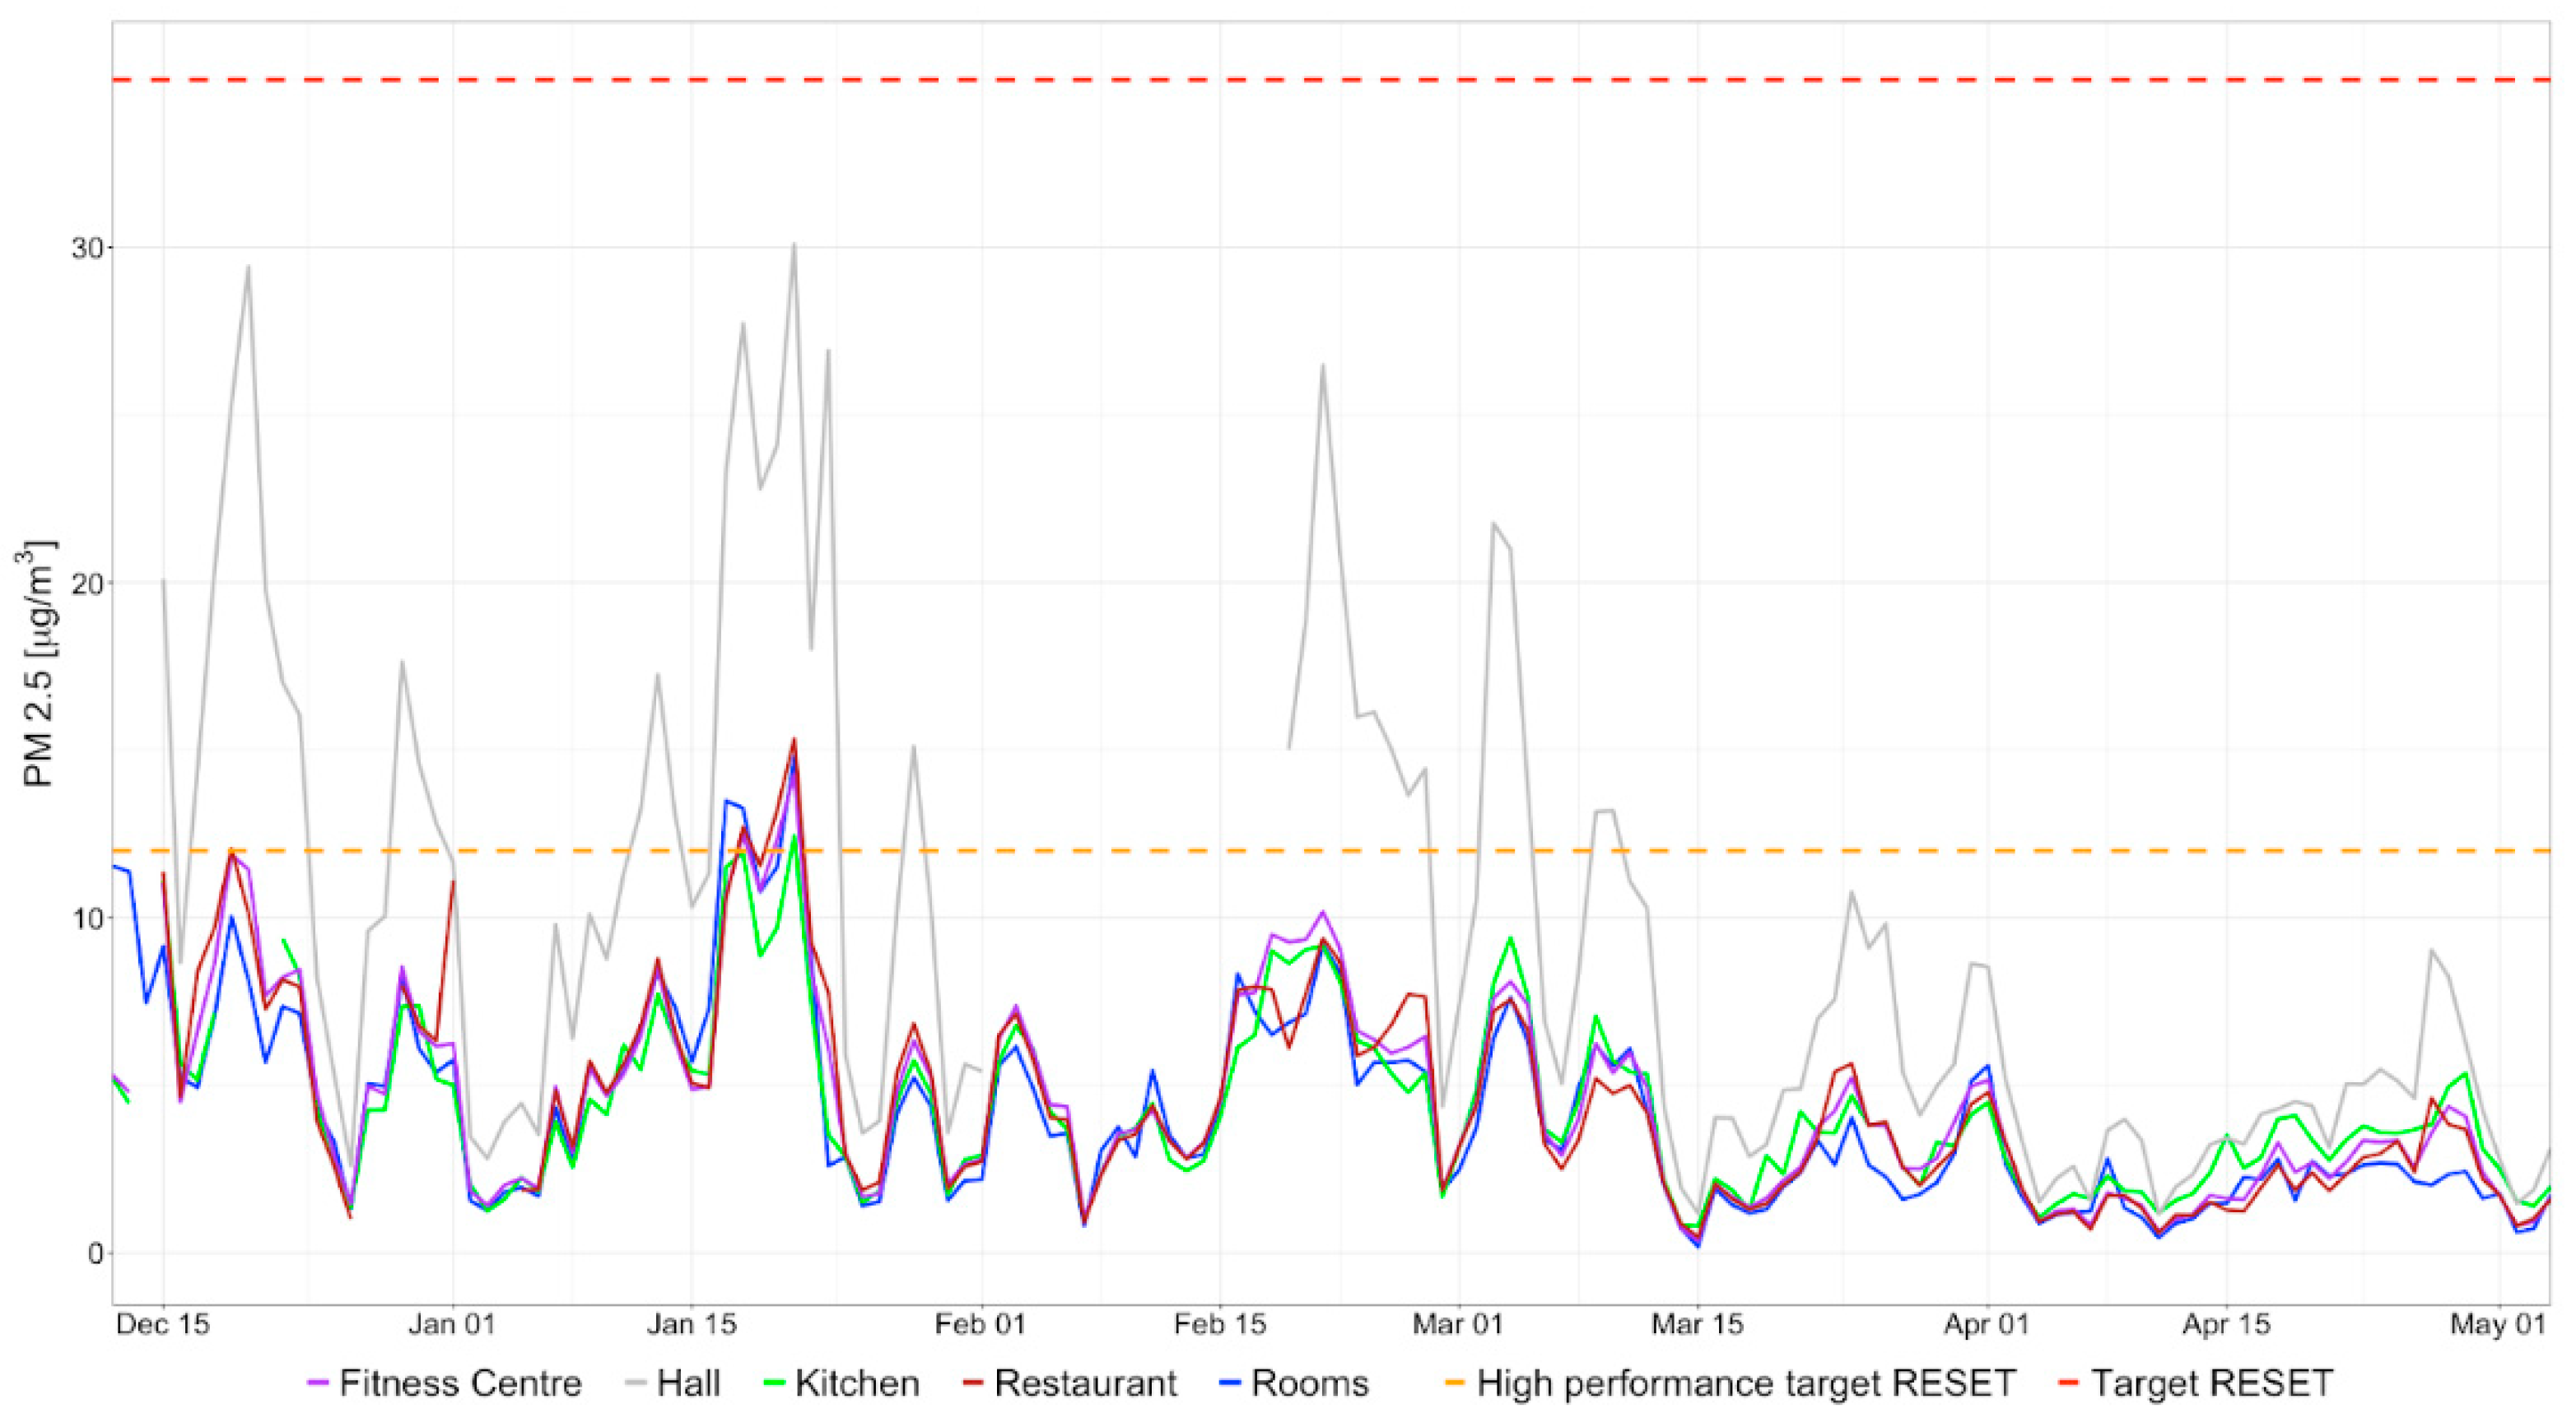
Second, IAQ data were collected in environments with different purposes, within the same hospitality premise. Results showed peculiarities of each environment in terms of average values and peak concentrations of the airborne contaminants detected. This allows to outline the contributions of the specific activities performed in the different environments, such as workout and cleaning in the fitness center or cooking in the dining area, giving rise to peaks of concentration on a recurrent basis. The hall, as a unique environment partially open to the outdoors, provides an interesting point for reflection about the possible interdependence with outdoor air quality, as concentration values detected for PM 2.5 differed remarkably from all other environments.
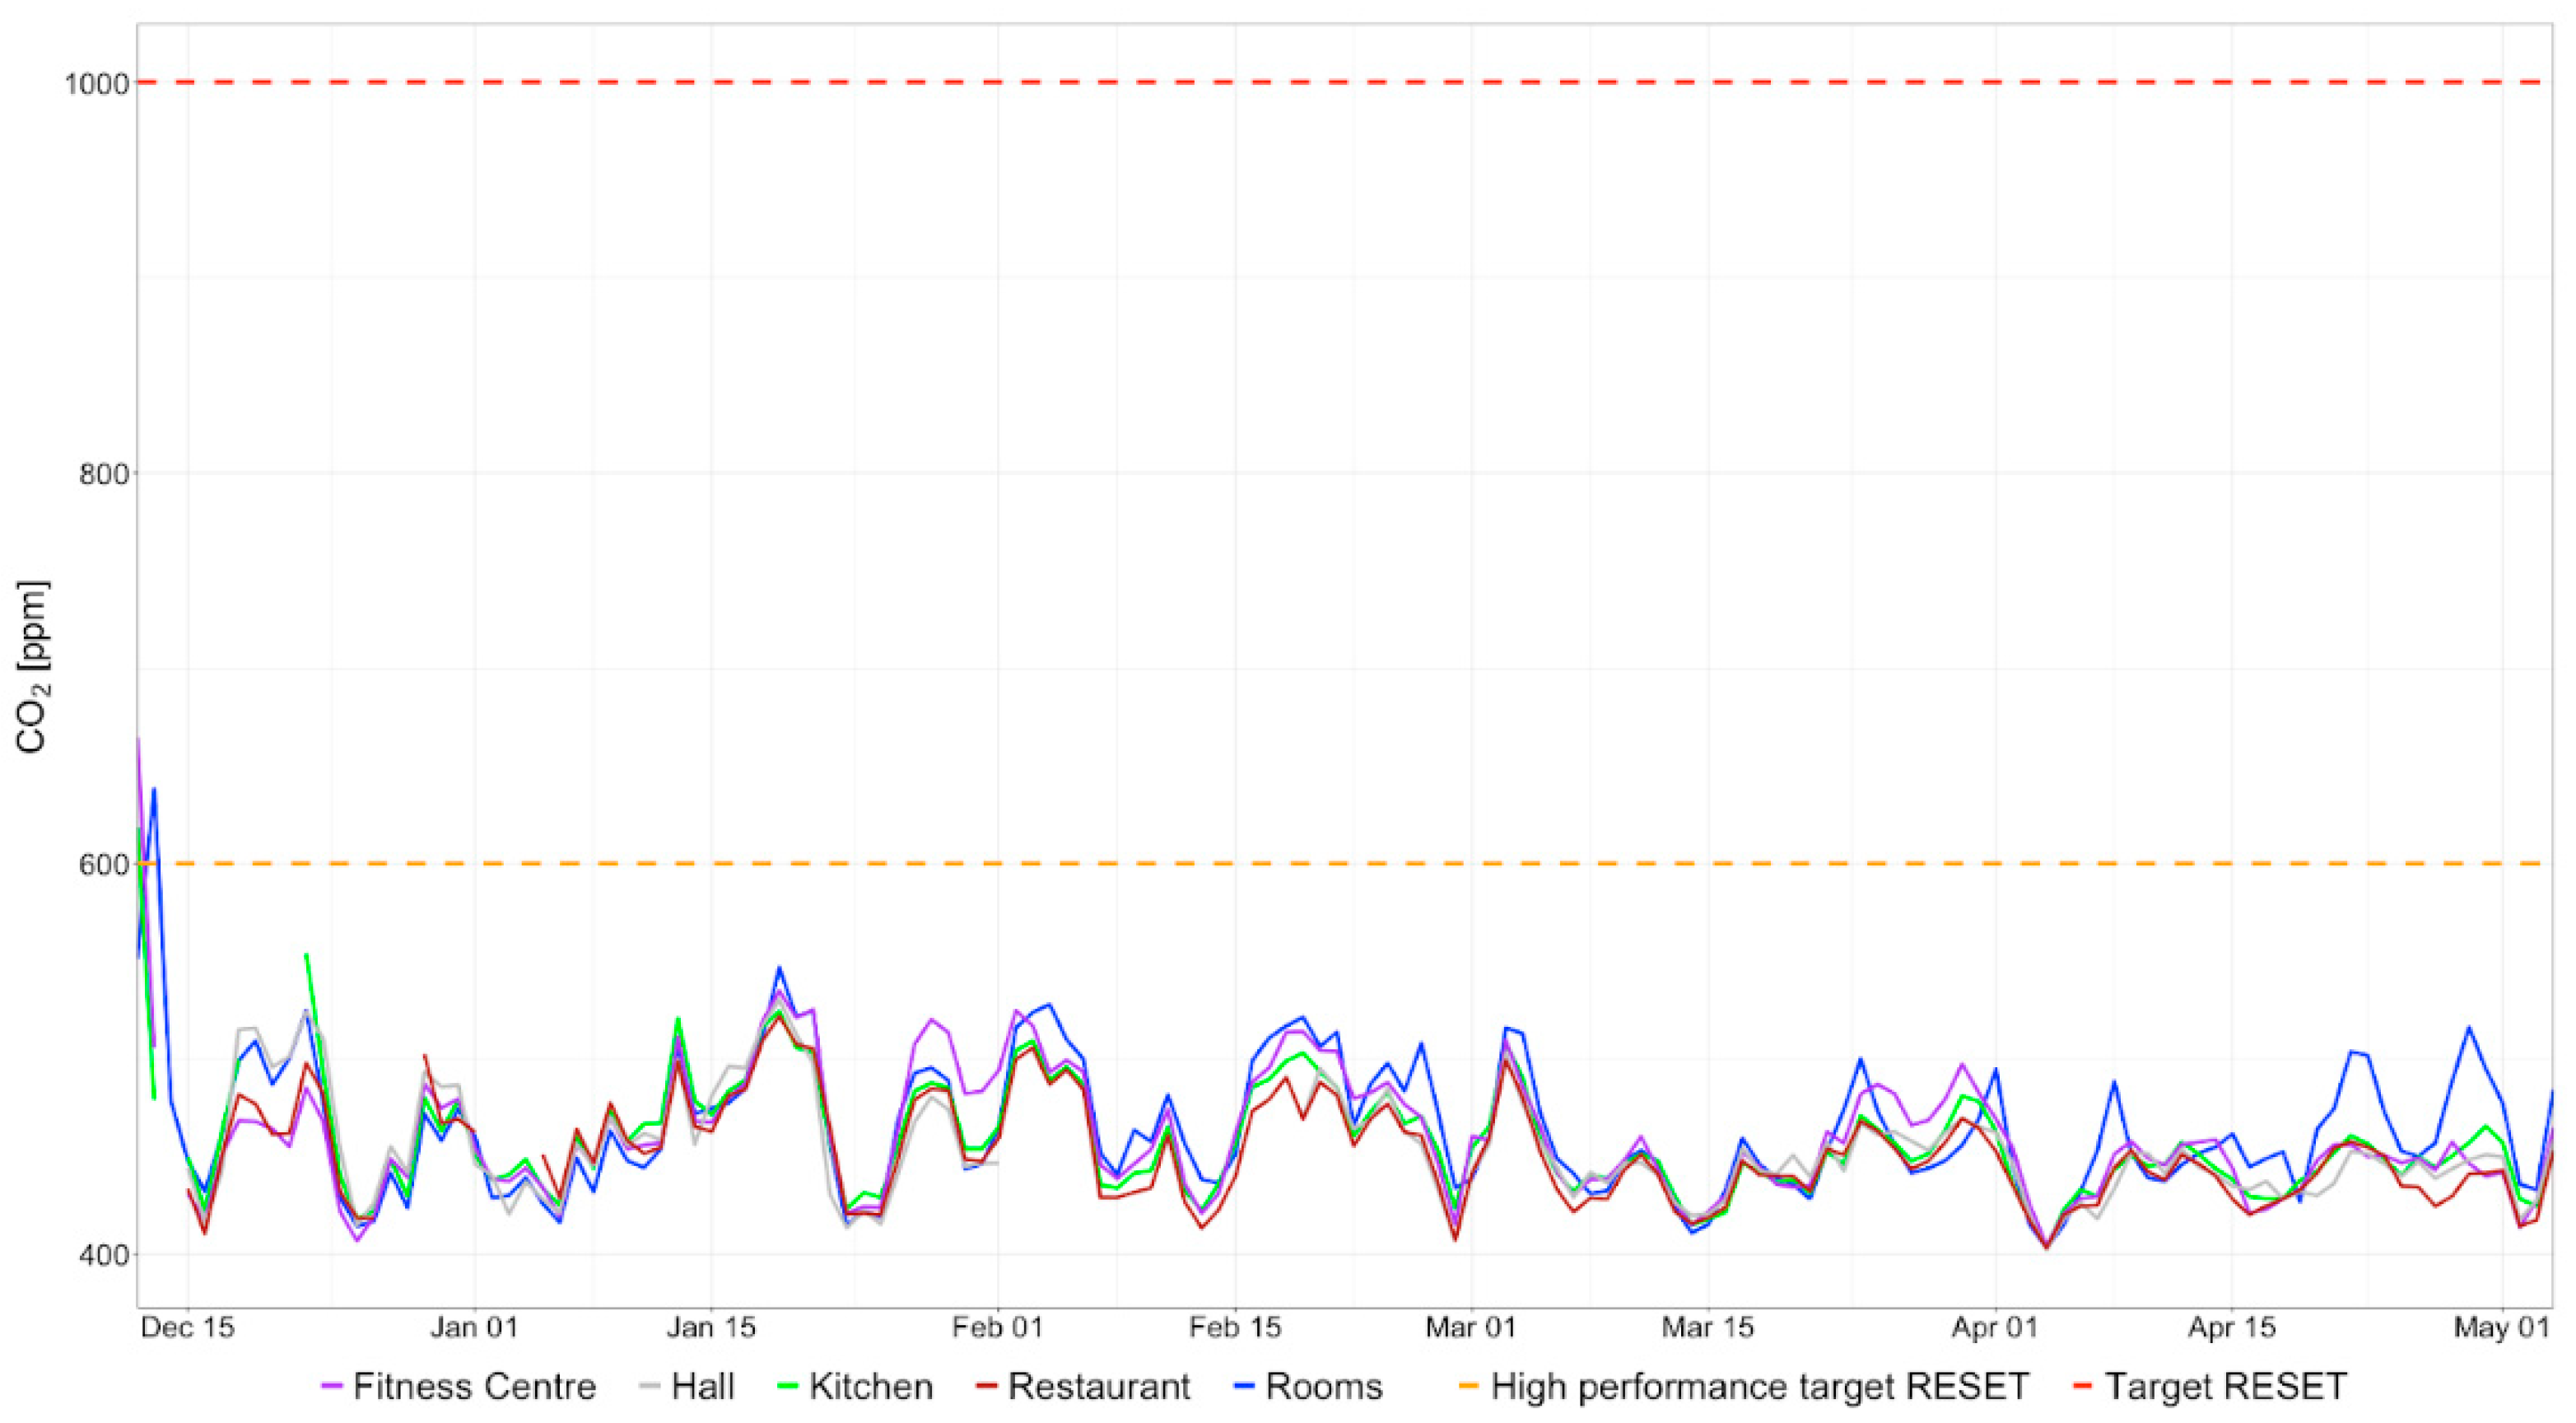
Third, we integrated the monitoring of different contaminants of concern under the same framework. This, combined with the previous elements, allowed to gather several insights, at the general level and more focused on the relationship between the specific contaminants and the environments monitored. Considering the overall performance of the IAQ management system currently in place, it appears generally adequate for the targets proposed by the RESET standards. We can observe how the ventilation system is able to promote the exchange of exhaust air, as the levels of CO2 are kept consistently within the targets for all the environments monitored, and PM 2.5 displays a quite similar behavior, except for the concentrations detected in the hall. The hall is typically the area at the interface between the indoor and the outdoor of a hospitality premise, and doors open repeatedly throughout the day. Therefore, the effect of the ventilation system is reduced, and other factors may come into play, such as temporary crowding, e.g., at the check-out time in the morning, or outdoor pollution events. It is worth noticing that PM 2.5 concentrations decrease with time, following a pattern reasonably related to the changing season under two perspectives. First, at the indoor level, where the increasing outdoor temperature typically leads to a decreased heating rate within the building. Second, at the outdoor level, where springtime is generally related with both a decrease in polluting emissions from traffic and households’ heating systems and an increase in the planetary boundary layer, leading to reduced PM concentrations in outdoor air.
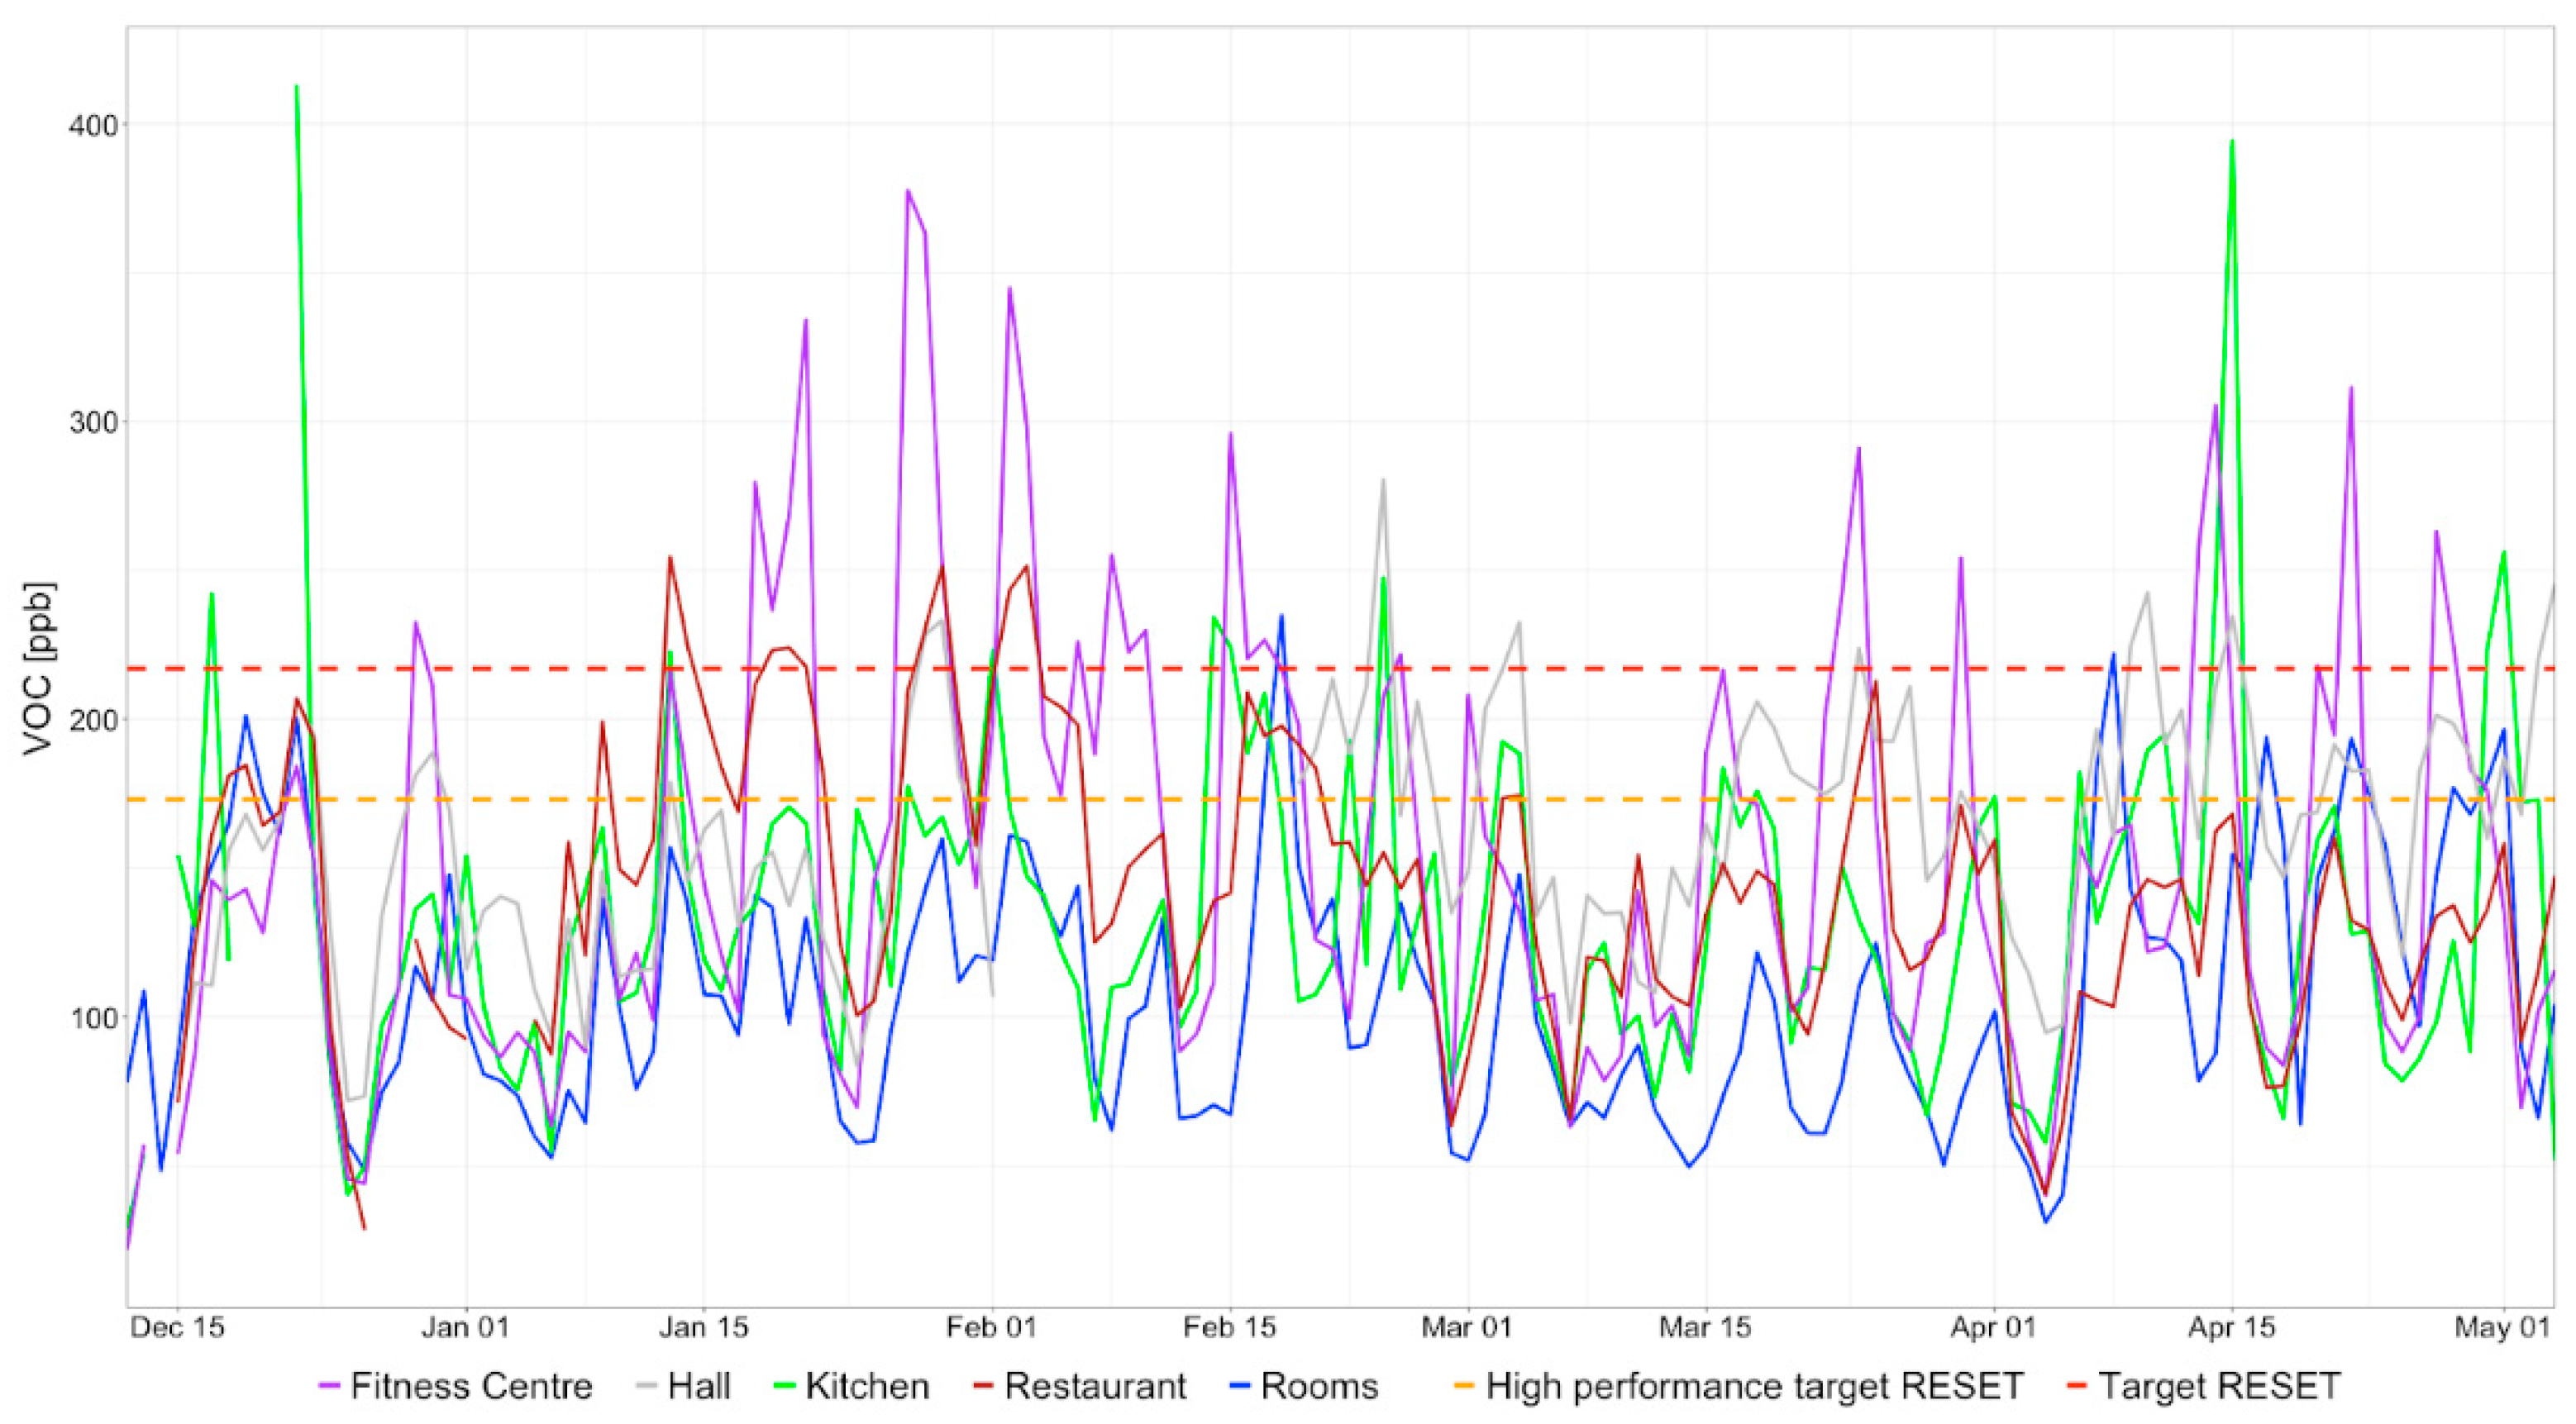
Considering VOCs management, as general ventilation is less relevant, peculiarities related to the activities performed in the environments emerge as predominant to guide the IAQ. The fitness center, for example, is characterized by recurrent peaks in concentration, exceeding the target values. It is reasonable to relate these peaks with the perspiration from the users of the premise and the consequent extensive cleaning routine implemented during the pandemic. Both of the activities are typically spaced out by long periods when the area is unused, thus justifying the high standard deviation calculated. The restaurant also resulted as an area of concern regarding VOCs concentration, characterized by repetitive peaks, most of the time corresponding to the ones highlighted by the fitness center. This suggests a relation with the rate of occupation of the hotel, as during the toughest periods of the pandemic only restaurants within hospitality premises were allowed to host, and the same was true for fitness centers, and, therefore, all the guests were reasonably forced to perform these activities within the hotel. Guestrooms showed the lowest VOCs concentrations and relatively high CO
2, both of which are explained by the fact that most of the rooms remained unoccupied for long periods of time during the pandemic, but for privacy reasons, a more focused analysis was unapplicable. This represents one of the main limitations of the present study and provides grounds for future research, as with the lifting of travel restrictions, more data will become available. The other main limitation is the implementation of low-cost sensing technologies to build the monitoring network, but this has been recognized as an acceptable approach to extend the air monitoring across time and space and improve the availability of data [
41].
Based on the results obtained so far, pathways for future research may be outlined, starting from the application of advanced techniques for data analysis, and, in perspective, big data analyses, as the innovative dataset of IAQ data created will be updated continuously. This would allow to detect repetitive patterns of contamination over different time spans automatically, such as days, weeks and years, gathering information about the influence of specific human activities, e.g., cleaning routine, or natural events and phenomena, e.g., effects of the changing seasons or outdoor air quality. In addition to this, the system currently in place could be supplemented with recurring spot monitoring of microbial aerosol performed with standard methodologies, in order to enrich the set of parameters for the IAQ-related risk management.


