Article

Effect of Biochar and Straw Application on Nitrous Oxide and Methane Emissions from Eutric Regosols with Different pH in Sichuan Basin: A Mesocosm Study

by
Tite Ntacyabukura
1,2,
Ernest Uwiringiyimana
1,2,
Minghua Zhou
1,*,
Bowen Zhang
1,2,
Bo Zhu
1,
Barthelemy Harerimana
1,2,
Jean de Dieu Nambajimana
1,2,
Gratien Nsabimana
1,2 and
Pascal Nsengumuremyi
1,2
1
Key Laboratory of Mountain Surface Processes and Ecological Regulation, Institute of Mountain Hazards and Environment, Chinese Academy of Sciences, Chengdu 610041, China
2
University of Chinese Academy of Sciences, Beijing 100049, China
*
Author to whom correspondence should be addressed.
Atmosphere 2021, 12(6), 729; https://doi.org/10.3390/atmos12060729
Submission received: 9 May 2021 / Revised: 24 May 2021 / Accepted: 27 May 2021 / Published: 7 June 2021
(This article belongs to the Section Air Quality)

Abstract

:
Adoption of crop residue amendments has been increasingly recommended as an effective management practice for mitigating greenhouse gas emissions while enhancing soil fertility, thereby increasing crop production. However, the effect of biochar and straw on nitrous oxide (N2O) and methane (CH4) emissions in soils of differing pH remains poorly understood. Three treatments (control (i.e., no amendment), maize straw, and biochar derived from maize straw) were therefore established separately in soils with different pH levels, classified as follows: acidic, neutral, and alkaline. N2O and CH4 were investigated using a static chamber–gas chromatography system during 57 days of a mesocosm study. The results showed that cumulative N2O emissions were significantly higher in acidic soils than in other experimental soils, with the values ranging from 7.48 to 11.3 kg N ha−1, while CH4 fluxes ranged from 0.060 to 0.089 kg C ha−1, with inconclusive results. However, a weak negative correlation was observed between log N2O and log NO3-N in acidic soil with either biochar or straw, while the same parameters with CH4 showed a moderate negative correlation, suggesting a likelihood that these amendments could mitigate GHGs as a result of the NO3-N increase in acidic soils. It is also possible, given the alkaline nature of the biochar, that incorporation had a significant buffer effect on soil acidity, effectively increasing soil pH by >0.5 pH units. Our findings suggest that for the rates of application for biochar and straw used in this study, the magnitude of reductions in the emissions of N2O and CH4 are dependent in part on initial soil pH.

1. Introduction

Nitrous oxide (N2O) and methane (CH4) remain important greenhouse gases (GHGs), greatly contributing to global warming. Previous study has shown that increases in these GHGs fluxes is anticipated to disrupt the sustainable nature of the environment [1]. Soils, in particular, remain the primary source of N2O and CH4 emissions [2], with total contributions of 60% and 50% global anthropogenic greenhouse gas emissions, respectively [3]. These emissions are mainly attributed to increasing use of mineral nitrogen fertilizers and the burning of fossil fuels [2]. Recently, the atmospheric concentration of CH4 increased 2.5 fold compared to its pre-industrial concentration of 722 ppbv (parts per billion by volume) [3]. On the other hand, N2O has increased to 324 ppbv, approximately 20% more than its mid-18th-Century level (270 ppbv) [2]. N2O and CH4 releases play a huge part in the chemistry of the planet’s gaseous envelope, representing one of the foremost sources of free radical compounds (NOx, CH2O), which deplete ozone levels [4,5]. Considerable scientific efforts have recently been directed towards establishing mitigation measures that are intended to effectively minimize non-CO2 trace gas emissions from arable soils while addressing climate warming scenarios [1,6].
In recent decades, increasing soil carbon stock through adoption of organic amendments, conservation tillage, and crop rotation has been proposed as the most effective technique for potentially offsetting agricultural GHG emissions [7,8,9]. An estimate shows that farming practices result in roughly four thousand million tons per year of plant remnants, worldwide [10]. Incorporation of these residues has been widely increased in recent years with the aim of reclaiming agricultural waste [11,12]. Several studies have reported that use of crop straw combined with mineral nitrogen fertilizer enhances soil quality while reducing adverse environmental effects [13,14,15]. Crop straw return commonly aims at improving soil carbon and nitrogen cycling [16,17], but sometimes it can also be a source of trace gas emissions [18,19]. Procházková et al. [20] also pointed out that this approach may consequently cause the transfer of pests and diseases to plants, and is not able to last long in soil due to microbial decomposition. The modification of crop straw to biochar before field application has therefore been of great significance in alleviating these issues [21].
Biochar refers to a carbon-rich solid residue obtained by thermal degradation of plant biomass, animal manure and sewage sludge exposed to a partially or completely oxygen-depleted environment [22,23], and is mostly recognized as a potential soil amendment that can enhance the composting process, as well as being a promising animal feed additive [22,24,25]. Black carbon undergoes slow decay, with a large share of stable aromatic C compound [24,26]. By increasing the C content in soil, the long-term application of charred plant straw could reduce both CH4 and N2O fluxes [27], while enlarging pores size that are able to absorb soil C, decreasing complete biodegradation [28]. Recent indoor experiments involving biochar have been reported to minimize N2O emissions for neutral [29] and alkaline soils [30]. Conversely, Clough et al. [31] observed the opposite findings in alkaline soil. Following carbon addition, development of N2O occurs as a result of nitrification and denitrification microbial activities [32,33]. Outdoor mesocosm study revealed the capacity of different biochars to offset the N2O emissions of acidic red soil [34]. Wu et al. [35] reported a decline of 26.9% of N2O fluxes in acidic soils with corn biochar mixed with N-fertilizer input compared to only N-fertilizer treatment. Furthermore, Senbayram et al. [36] found that input of charred straw had no effect on nitrous oxide release in alkaline soils. With all these differences regarding the effects of biochar and straw on trace gas emissions, it is obvious that soil pH is likely to be a potential confounder of gas emissions, and therefore, the same kind of amendment could be effective or futile, accordingly. To the best of our knowledge, there are limited studies to date that have explicitly examined the behavioral effect on greenhouse gas emissions of biochar and straw amendments in soils with different natural pH.
Eutric Regosols (locally known as purple soils) encompass a vast territory of the Sichuan Basin (approximately 2.5 million km2) [37]; due to substantial N-fertilizer application associated with vegetable production, these soils can generate significant amounts of N2O and CH4 emissions [38,39]. Some prior work has paid attention to crop straw return in order to offset this issue based on field investigation [40]. Huang et al. [27] reported that maize straw input suppressed N2O emissions in acidic clay loam soil in an outdoor mesocosm experiment. On the other hand, other researchers have used biochar amendment in alkaline purple soil under short-term laboratory settings, demonstrating that charred corn-straw potentially improves the microbial community associated with nitrous oxide emissions [40,41].
As previous studies have mostly focused on soil with only a specific soil pH when examining problems associated with GHGs emissions [27,40], the current work introduces an intuitive approach in order to explore the effectiveness of crop straw and its biochar derivative for the purpose of alleviating N2O and CH4 emissions over a wide range of soils with various pH levels (i.e., acidic, neutral, and alkaline soils) in the Sichuan Basin. The main aims of the present study were to: (1) measure the dynamic and cumulative N2O and CH4 emissions of three different soils in response to biochar and straw input; (2) investigate the effect of these applied amendments on soil properties after the period of the open environment mesocosm study; (3) investigate the relationship of different soil factors with N2O and with CH4 emissions from soils of different natural pH levels under biochar and straw throughout the experiment.

2. Materials and Methods

2.1. Study Site

The Yanting agro-ecological purple soil station is geographically located in Southwest China, at 31°16′ N latitude and 105°28′ E longitude, at an altitude of 500 m above sea level (m a.s.l). The region experiences a subtropical monsoon climate, with an annual average precipitation and temperature of 826 mm and 17.3 °C, respectively [38]. Entisols, which are broadly spread over the mountainous terrain of the Sichuan Basin, China, carry the domestic term “purplish soils”, as well as Regosols under the Food Agriculture Organization (FAO) soil taxonomy [37]; these soils account for nearly 70% of the arable area in Sichuan province [40]. Based on similar land use (i.e., upland soil of wheat–maize rotation), three typical arable soils with different natural pH values were selected from agricultural farmlands of the Sichuan Basin. The values for total C, total N, and pH of the acidic loam soil collected from the farmland of Hejiang, Sichuan province (28°45′ N and 105°55′ E), were 7.12 g kg−1, 0.88 g kg−1, and a pH of 4.69, respectively (Table 1). The neutral sandy loam soil sampled from Xinqiao, Chongqing province (29°21′ N and 105°44′ E), had 11.23 g kg−1 of total C, 1.05 g kg−1 of total N, and a pH of 7.12, while alkaline silt clay loam soil collected from the experimental farm of Yanting, Sichuan province (31°16′ N and 105°27′ E), had 14.84 g kg−1 of total C, 0.91 g kg−1 of total N, and a pH of 8.32 (Table 1). Cereals, wheat and corn had previously been grown in the above-mentioned soils before sampling. While collecting the samples, 5 cm of topsoil and roots were initially removed. The soil samples were then collected at a depth of 5–20 cm. The most common agricultural crop residues (i.e., corn straw) at the farm of Yanting station were pyrolyzed into biochar using a customized laboratory reactor functioning at 500 °C, with a residence time of 8 h. Biochar and straw characteristics are shown in Table 1.

2.2. Experimental Design

A randomized outdoor mesocosm study using polyvinyl chloride (PVC)-packed soil columns was established at the Yanting agro-ecological station. The columns, with a height of 58 cm and a diameter of 14.8 cm, were arranged in a 3 × 3 factorial design for both soil and gas sampling. Three pH values of natural soil, i.e., acidic soil, neutral soil and alkaline soil, were each treated with no amendment, biochar, and straw amendments in three replicates.
Prior to column packing, soils were air-dried, passed through a 5-mm sieve, and kept in a clean polyethylene plastic box. Deionized water was added in an equivalent to 60% water-filled pore space (WFPS), the boxes were then wrapped and incubated for seven days in a room at 25 °C for the purpose of optimizing microbial growth [42]. Biochar was sieved (4 mm) and maize straw sliced into small pieces (approximatively 1 cm) using a straw crusher; these were evenly mixed with damp soil before packing to the upper layer of the columns at an application rate of 34.2 g/column (i.e., 20 t ha−1) for biochar [43] and 10.3 g/column (i.e., 6 t ha−1) for straw [44,45] before fertilization. The damp packed soil column was designed in two layers of 15 cm topsoil and 15 cm subsoil, allocated to distinct bulk densities of 1.1 g cm−3 and 1.3 g cm−3, respectively. To obtain the uniform soil column layers, a manual scissor jack linked with a shock plastic piston (14 cm diameter) was used to slightly compact the soils within a column in order to achieve the designated bulk densities, that is, a packed column 30 cm (topsoil + subsoil) deep with appropriate soil amounts [46]. The bottom side of each column was sealed with a perforated plastic end-cap filled with a nylon mesh filter 0.001 m in diameter, and silk sand at a depth 0.02 m to ensure no saturation zone; a thin Teflon tube (1-cm diameter, 100-cm length) was connected to drain rainwater.
All columns received an equal amount of ammonium chloride fertilizer, consisting of 0.353 g NH4Cl (200 kg N ha−1), superphosphate of 0.265 g P2O5 (150 P ha−1), and potassium chloride of 0.282 g KCl (160 kg K ha−1), which is equivalent to the actual field input rates of local farmers [38,47]. These were sprayed manually onto the soil surface of the packed columns using a polyethylene spray bottle. In order to minimally disturb the column topsoil, a shovel was used to carve a small slot, and cabbage seedlings (Brassica oleracea L. var. Capitata L.) were transplanted. The packed columns were buried nearly 25 cm deep, and a thin water draining tube was placed about 10 cm away from the bottom surface of a paved pit channel in order to transport water draining from the column.

2.3. Sampling and Measurements of Gas Emissions

The N2O and CH4 fluxes were monitored (from late July to mid-September 2020) using the chamber gas chromatography method. The columns consisted of a removable cap with ports for gas sampling and ventilation to balance air pressure during sampling. In this study, the N2O and CH4 emissions were monitored on a daily basis throughout the first week after fertilization. Later, the sampling changed to once every two days for the remaining period of the experiment, except that the days for which columns were not fully drained after rainfall events, sampling took place the day after. In total, gas sampling was performed 24 times throughout the experimental period. Following the gas flux sampling protocols recommended by Parkin et al. [48], the gas samples were collected from the column headspace at times ranging between 8:00 and 11:00 a.m., local time. After column closure, the four separate gas samples were taken at time intervals of 0, 5, 10, and 15 min, with the aid of a 20-mL syringe connected to a three-way stopper. After gas sampling, a gas chromatography system (GC 7890, Agilent Technologies Inc., Wilmington, DE, USA) rigged with an electron capture detector (ECD) and a flame ionized detector (FID) was used to analyze the concentration of N2O and CH4 emissions in the gas samples, respectively. Following the measurement method and procedures previously described by Wang et al. [49], the GC machine was calibrated with a mixture of standard gasses consisting of CO2 (386.2 ppm), CH4 (5.1 ppm) and N2O (0.5 ppm), and the concentrations of samples were represented using standard curves. The fluxes were calculated based on changes in gas concentrations inside the column headspace at time intervals relative to column closure using the mathematical model shown in Equation (1) [50,51,52,53].
F = ρ × V × c × 273 [ A × t × ( 273 + T ) ]
where F represents dynamic emissions of N2O (µg N m−2 h−1) and CH4 (mg C m−2 h−1); ρ is the gas density (kg m−3); V stands for the volume of column headspace (m3); A, ∆c, and ∆t are the surface area (m2), variation in gas concentration (ppb h−1) throughout closure time, and the closure time span (h) of the column, respectively; and T is air temperature within the column during gas collection (°C). Cumulative gas emissions for the entire experimental period were calculated on the basis of Equation (2) [52,54].
C = ( F i + 1 + F i ) 2 × ( t i + 1 t i ) × 24    
where C denotes the cumulative magnitude of N2O (kg N ha−1) and CH4 (kg C ha−1) fluxes obtained through linear interpolation between every two consecutive gas measurements; F represents the dynamic gas emission; t is the sampling period in form of days; and i denotes sampling times.

2.4. Soil Sampling and Analysis

The topsoil (0–15 cm) of the columns was sampled to determine soil pH, ammonium nitrogen, nitrate nitrogen, dissolved organic carbon (DOC), and water-filled pore space (WFPS). The sampling frequency followed that of gas sampling until the 19th day of sampling. However, further soil samples were taken following the course of the study to determine the effect of treatments on these soil parameters. The soil pH was tested in a mixture of 1:2.5 soil:deionized water using a DMP-2 mV/pH detector (quark Ltd., Nanjing, China) [55]. The mineral nitrogen substrates (NH4+-N and NO3-N) concentrations were initially measured by adding 1 mole of KCl solution (5 mL for 1 g soil) and agitating for 1 h. Finally, a Whatman syringe filter with a diameter of 0.45 µm was used to filter the floating liquid, followed by measurements with a continuous flow analyzer (AA3, seal analytical, Norderstedt, Germany) [56].
Soil water content was determined after oven drying at 105 °C for 24 h. The WFPS was quantified through the conversion of soil gravimetric water content using the following equation:
WFPS   ( % ) =   SGWC × BD 1 ( BD 2.65   ) × 100
where SGWC is soil gravimetric water content, BD is the bulk density of 1.1 g cm−3, and 2.65 g cm−3 represents the theoretical particle density.

2.5. Statistical Analysis

Data analysis was performed with the aid of RStudio software, version 1.2.5042 [57]. The accumulation of both CH4 and N2O fluxes from different soil types following the various treatments was estimated using two-way ANOVA followed by Tukey’s HSD test as a post hoc analysis, where appropriate. The multiple linear regression model was employed to determine the emission rate response to the interaction of different soil factors, natural soil pH, and treatments. Thereafter, the degree of association between each soil factor and gas emission rate in various soil types under a particular treatment was extracted after manipulating regression model syntax in R using the cor.test () function of the stats package, and then adapting the correlation analysis. After a thorough exploration of the data, we transformed variables where appropriate, using the log () function of base R, which computes the natural logarithm, in order to meet the statistical assumptions for the linear models. The heteroskedasticity and normal distribution of residuals were carefully assessed to ensure the validity of the regression model results. All graphs were drawn with the aid of the ggplot2 [58] and ggpubr [59] packages. A step-by-step analysis and reproducible R code are provided in Supplementary Materials as a data analysis script compiled in a form of an R markdown document.

3. Results

3.1. Precipitation and Air Temperature at the Experimental Site

Large weekly differences in daily rainfall, as well as maximum and minimum air temperatures, were observed between late July and late September in 2020 (Figure 1). During the opening phase of the study, two heavy rainfall events, each of more than 60 mm, occurred (Figure 1), and 85.6% of the total precipitations occurred mid-way through the overall experimental period.
Overall, the months of July and August received high amounts of precipitation (311.6 and 177.4 mm) compared to September (91.8 mm), with a peak of 68.7 mm observed in late July (Figure 1).

3.2. The CH4 and N2O Fluxes of Soils Influenced by Application of Straw and Biochar

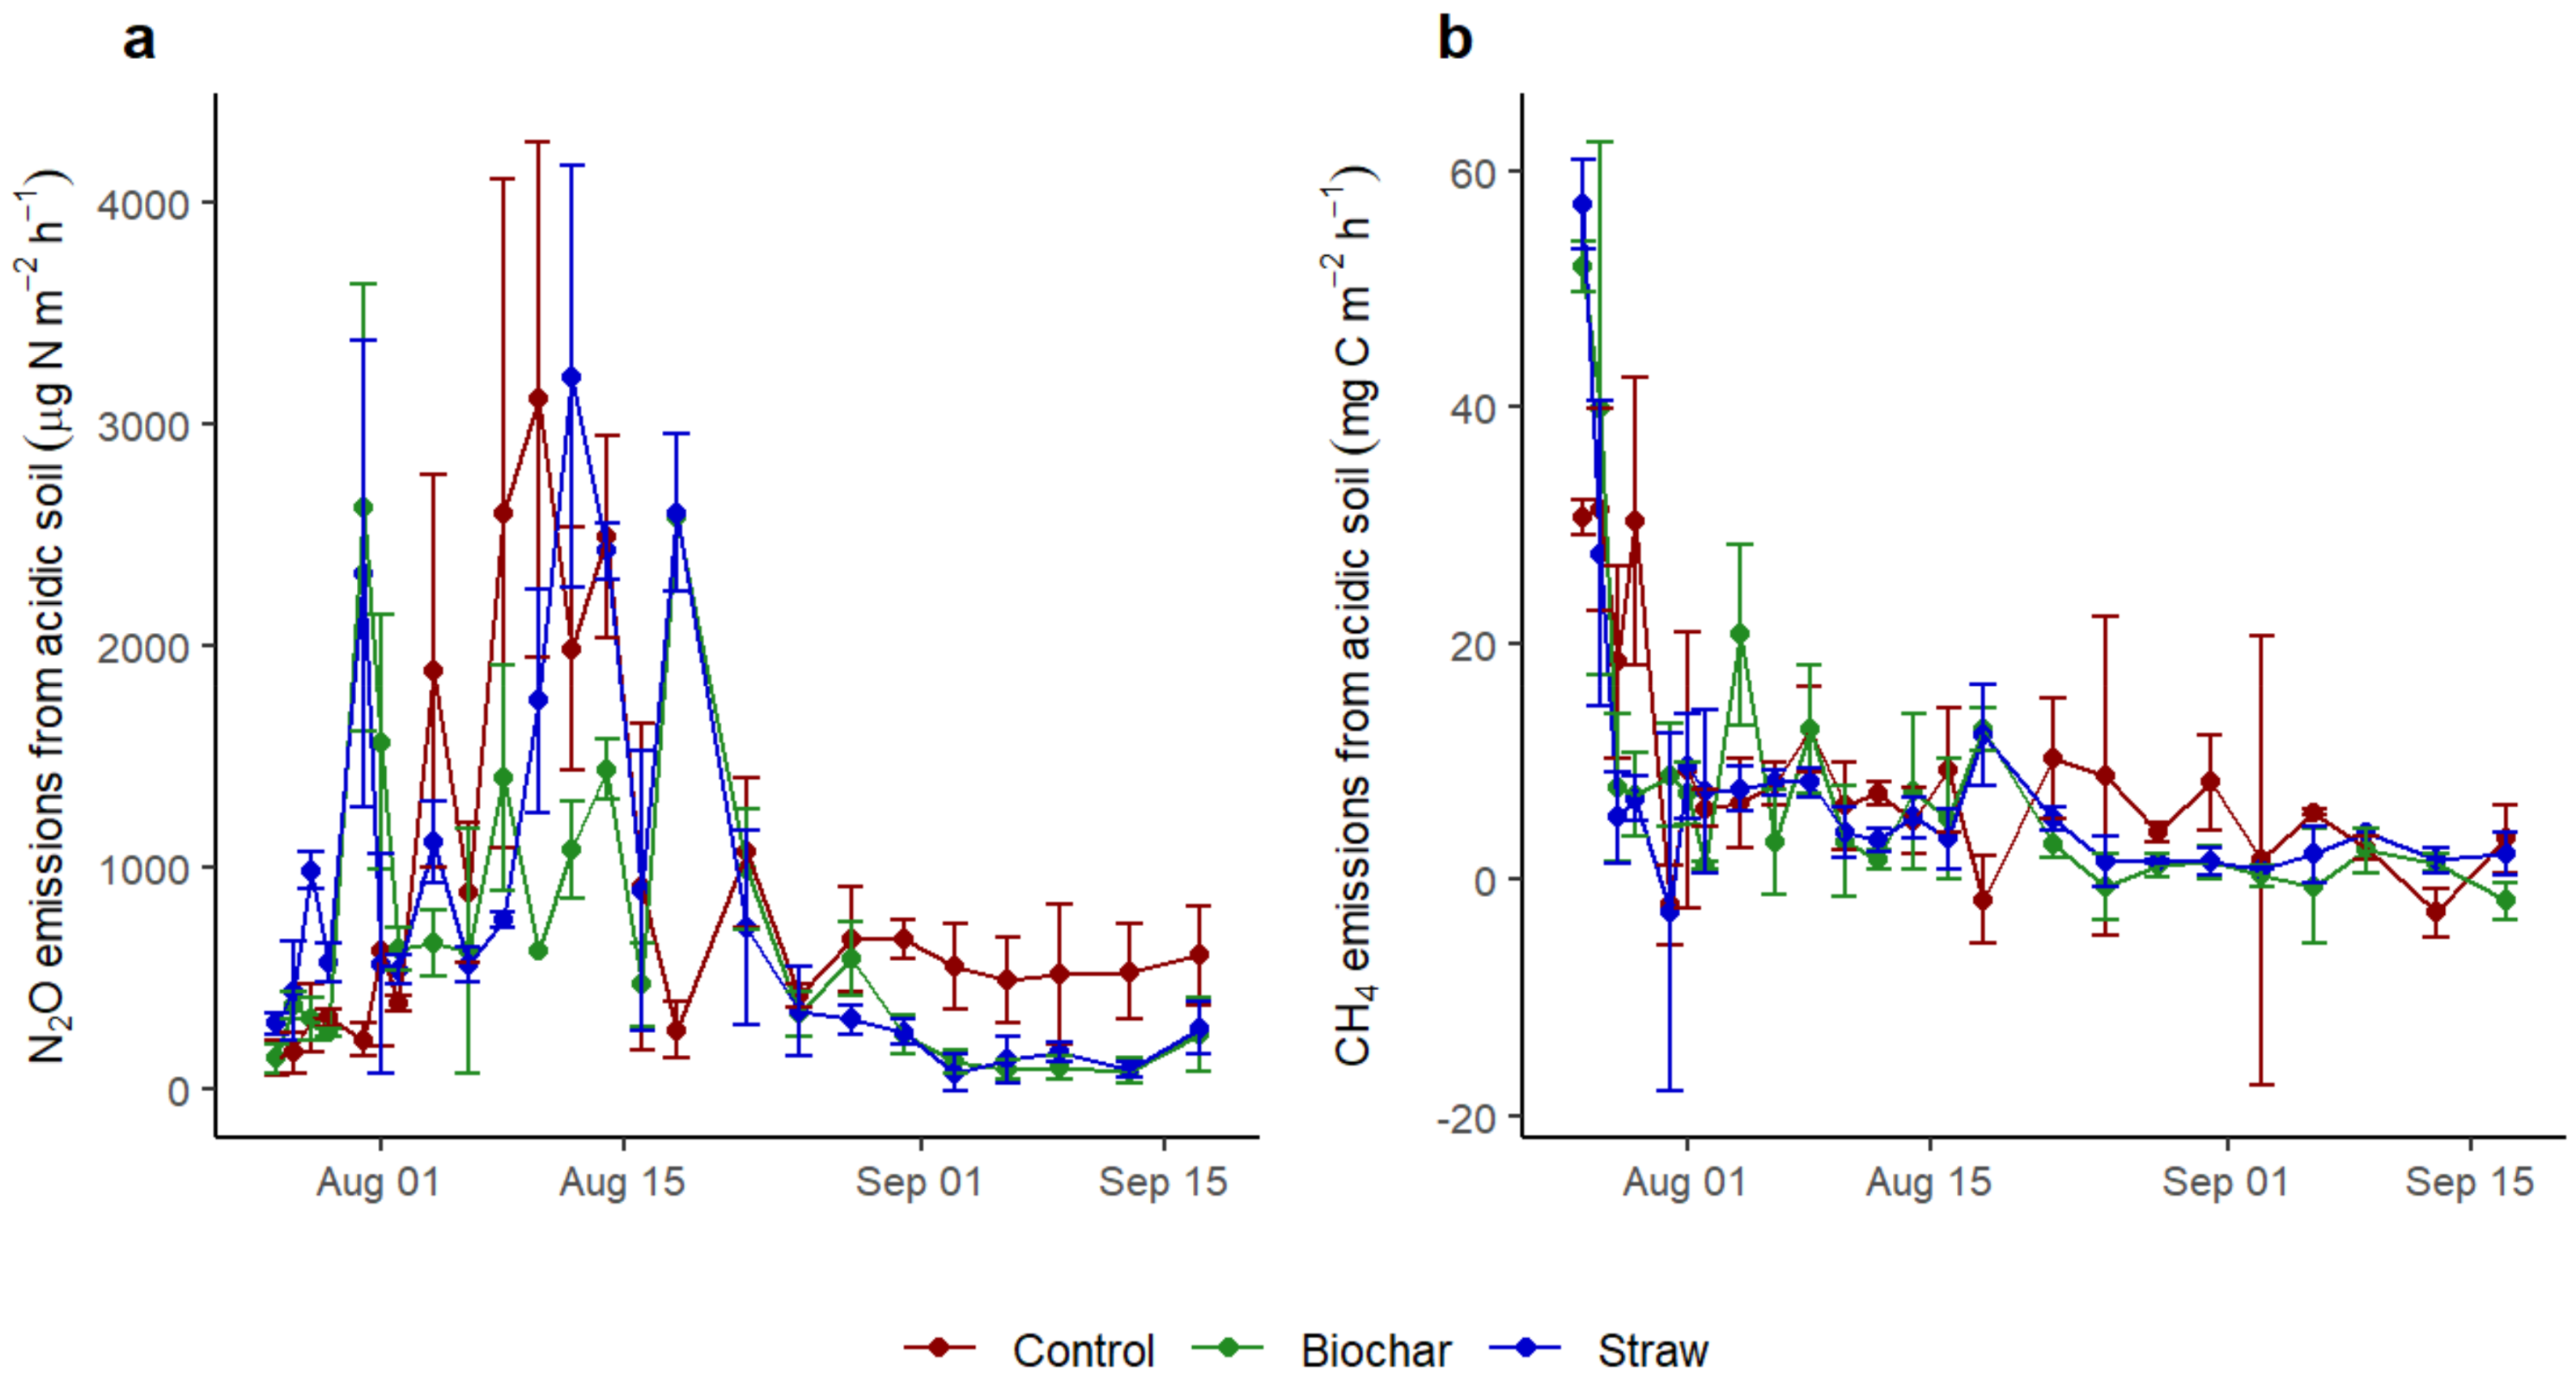
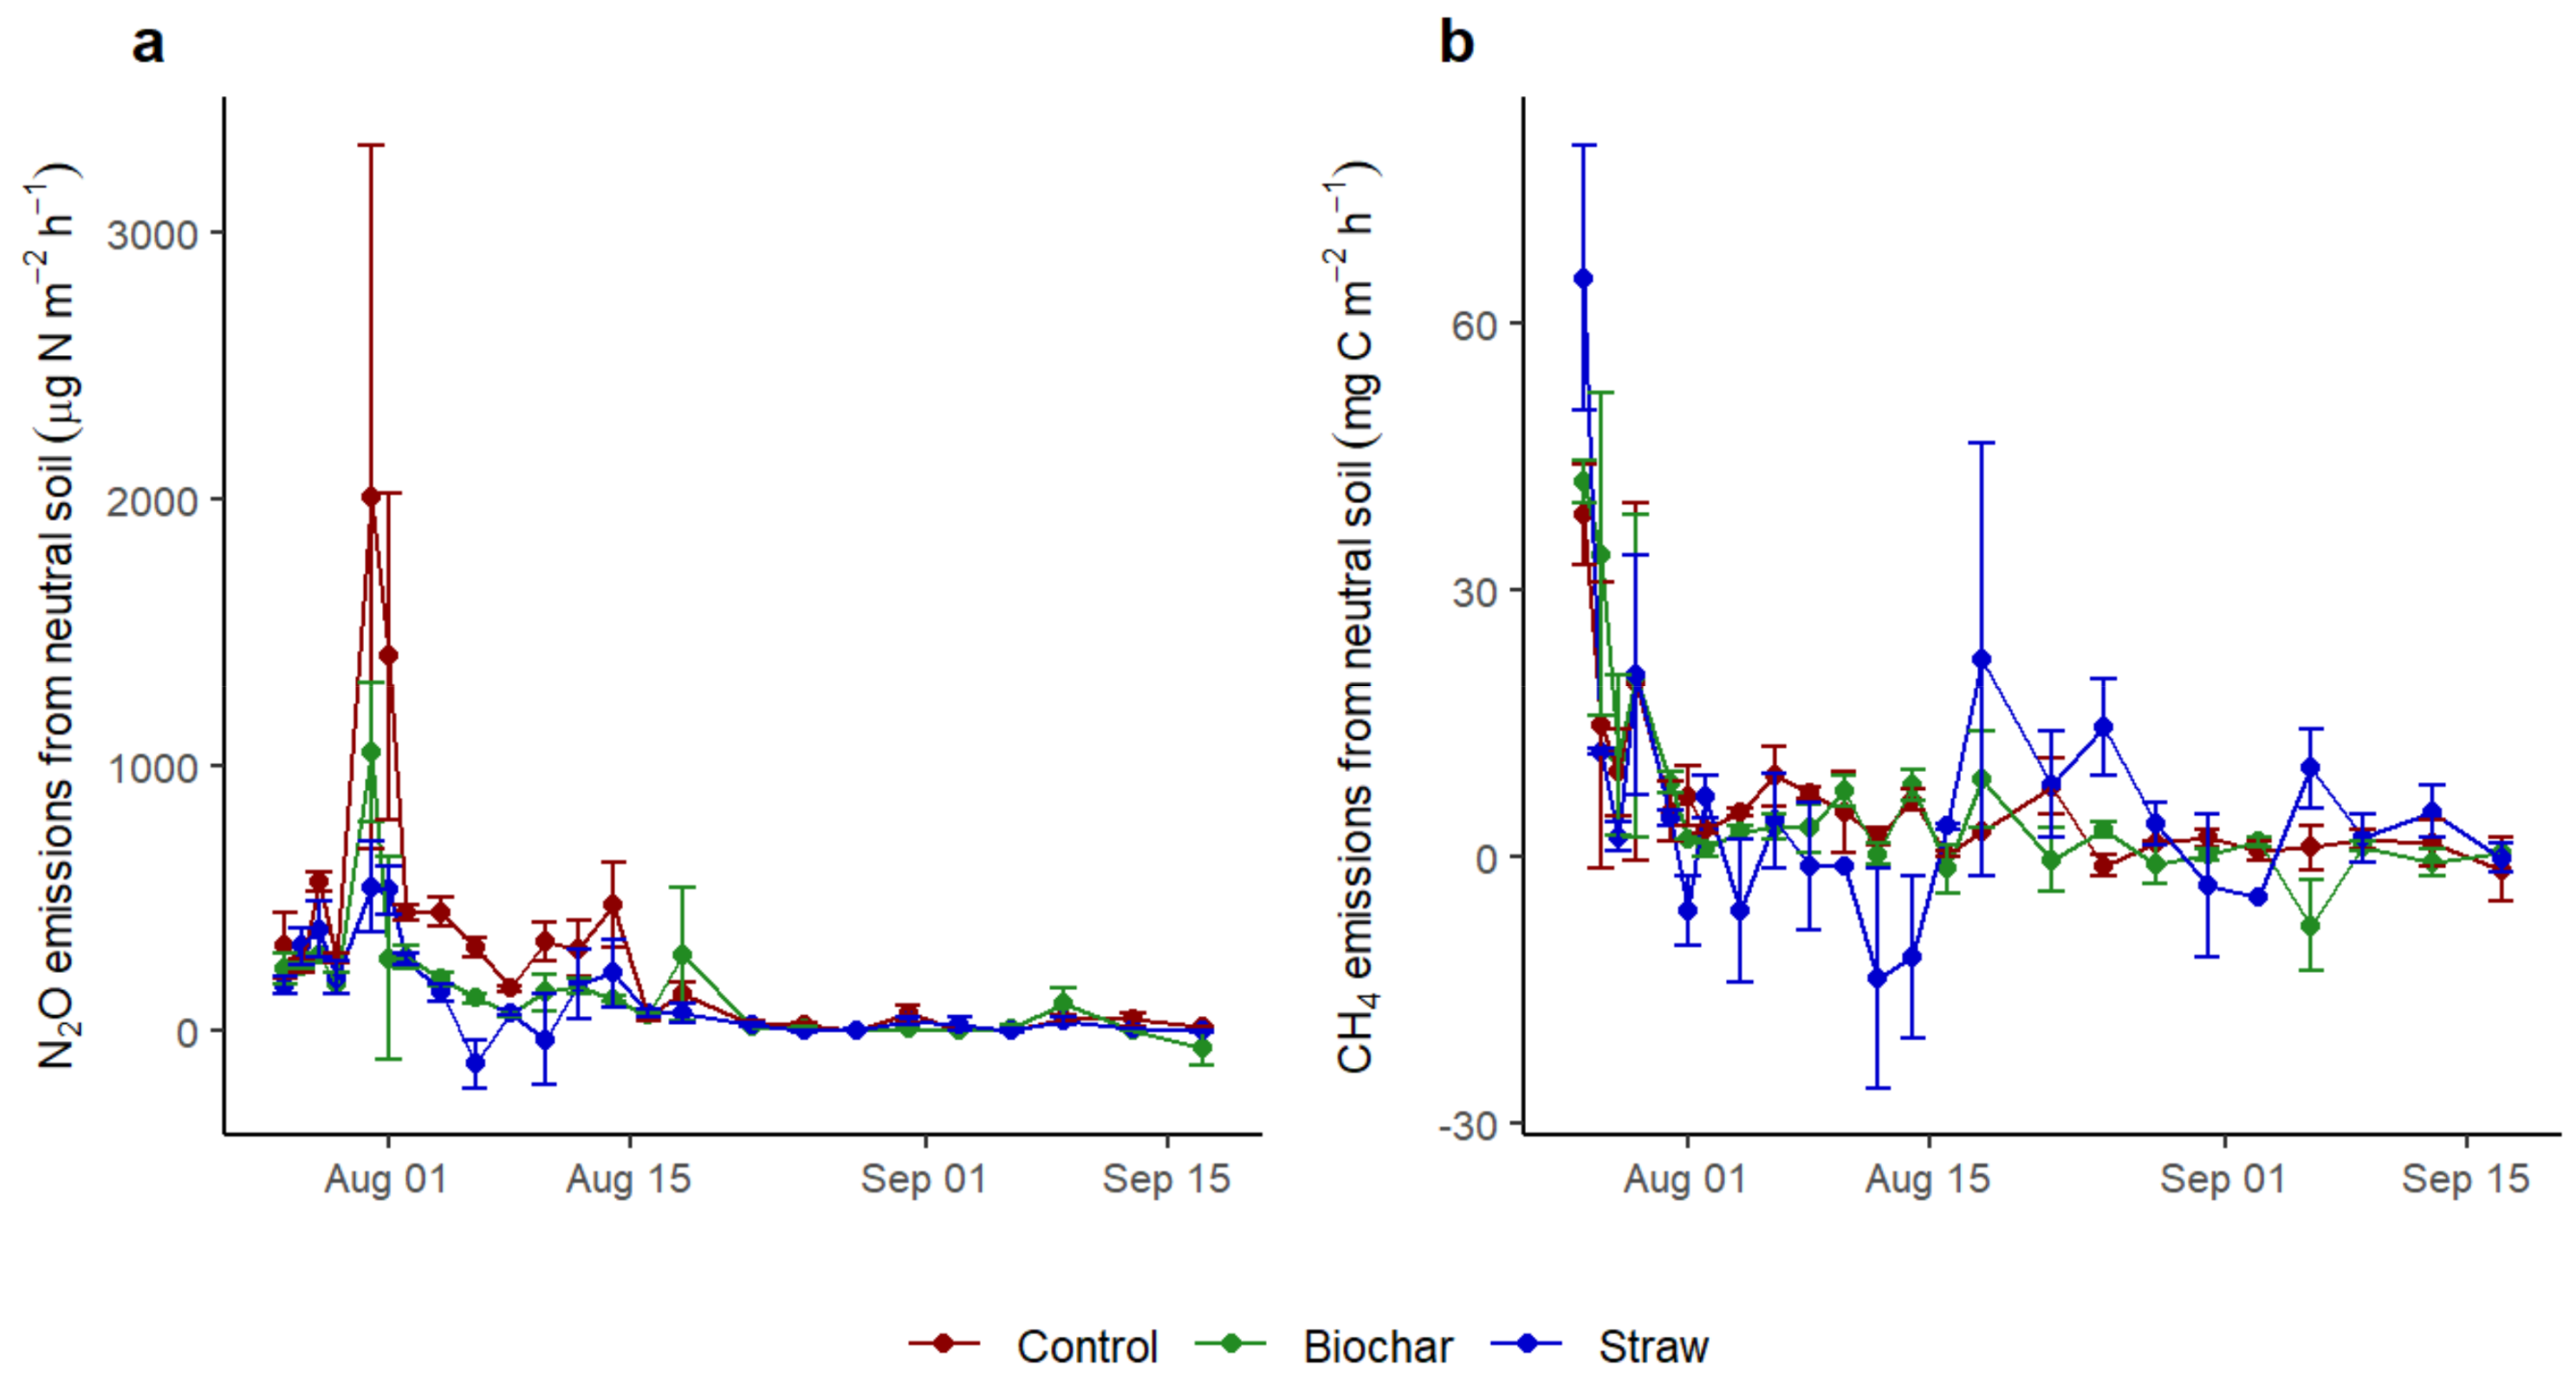
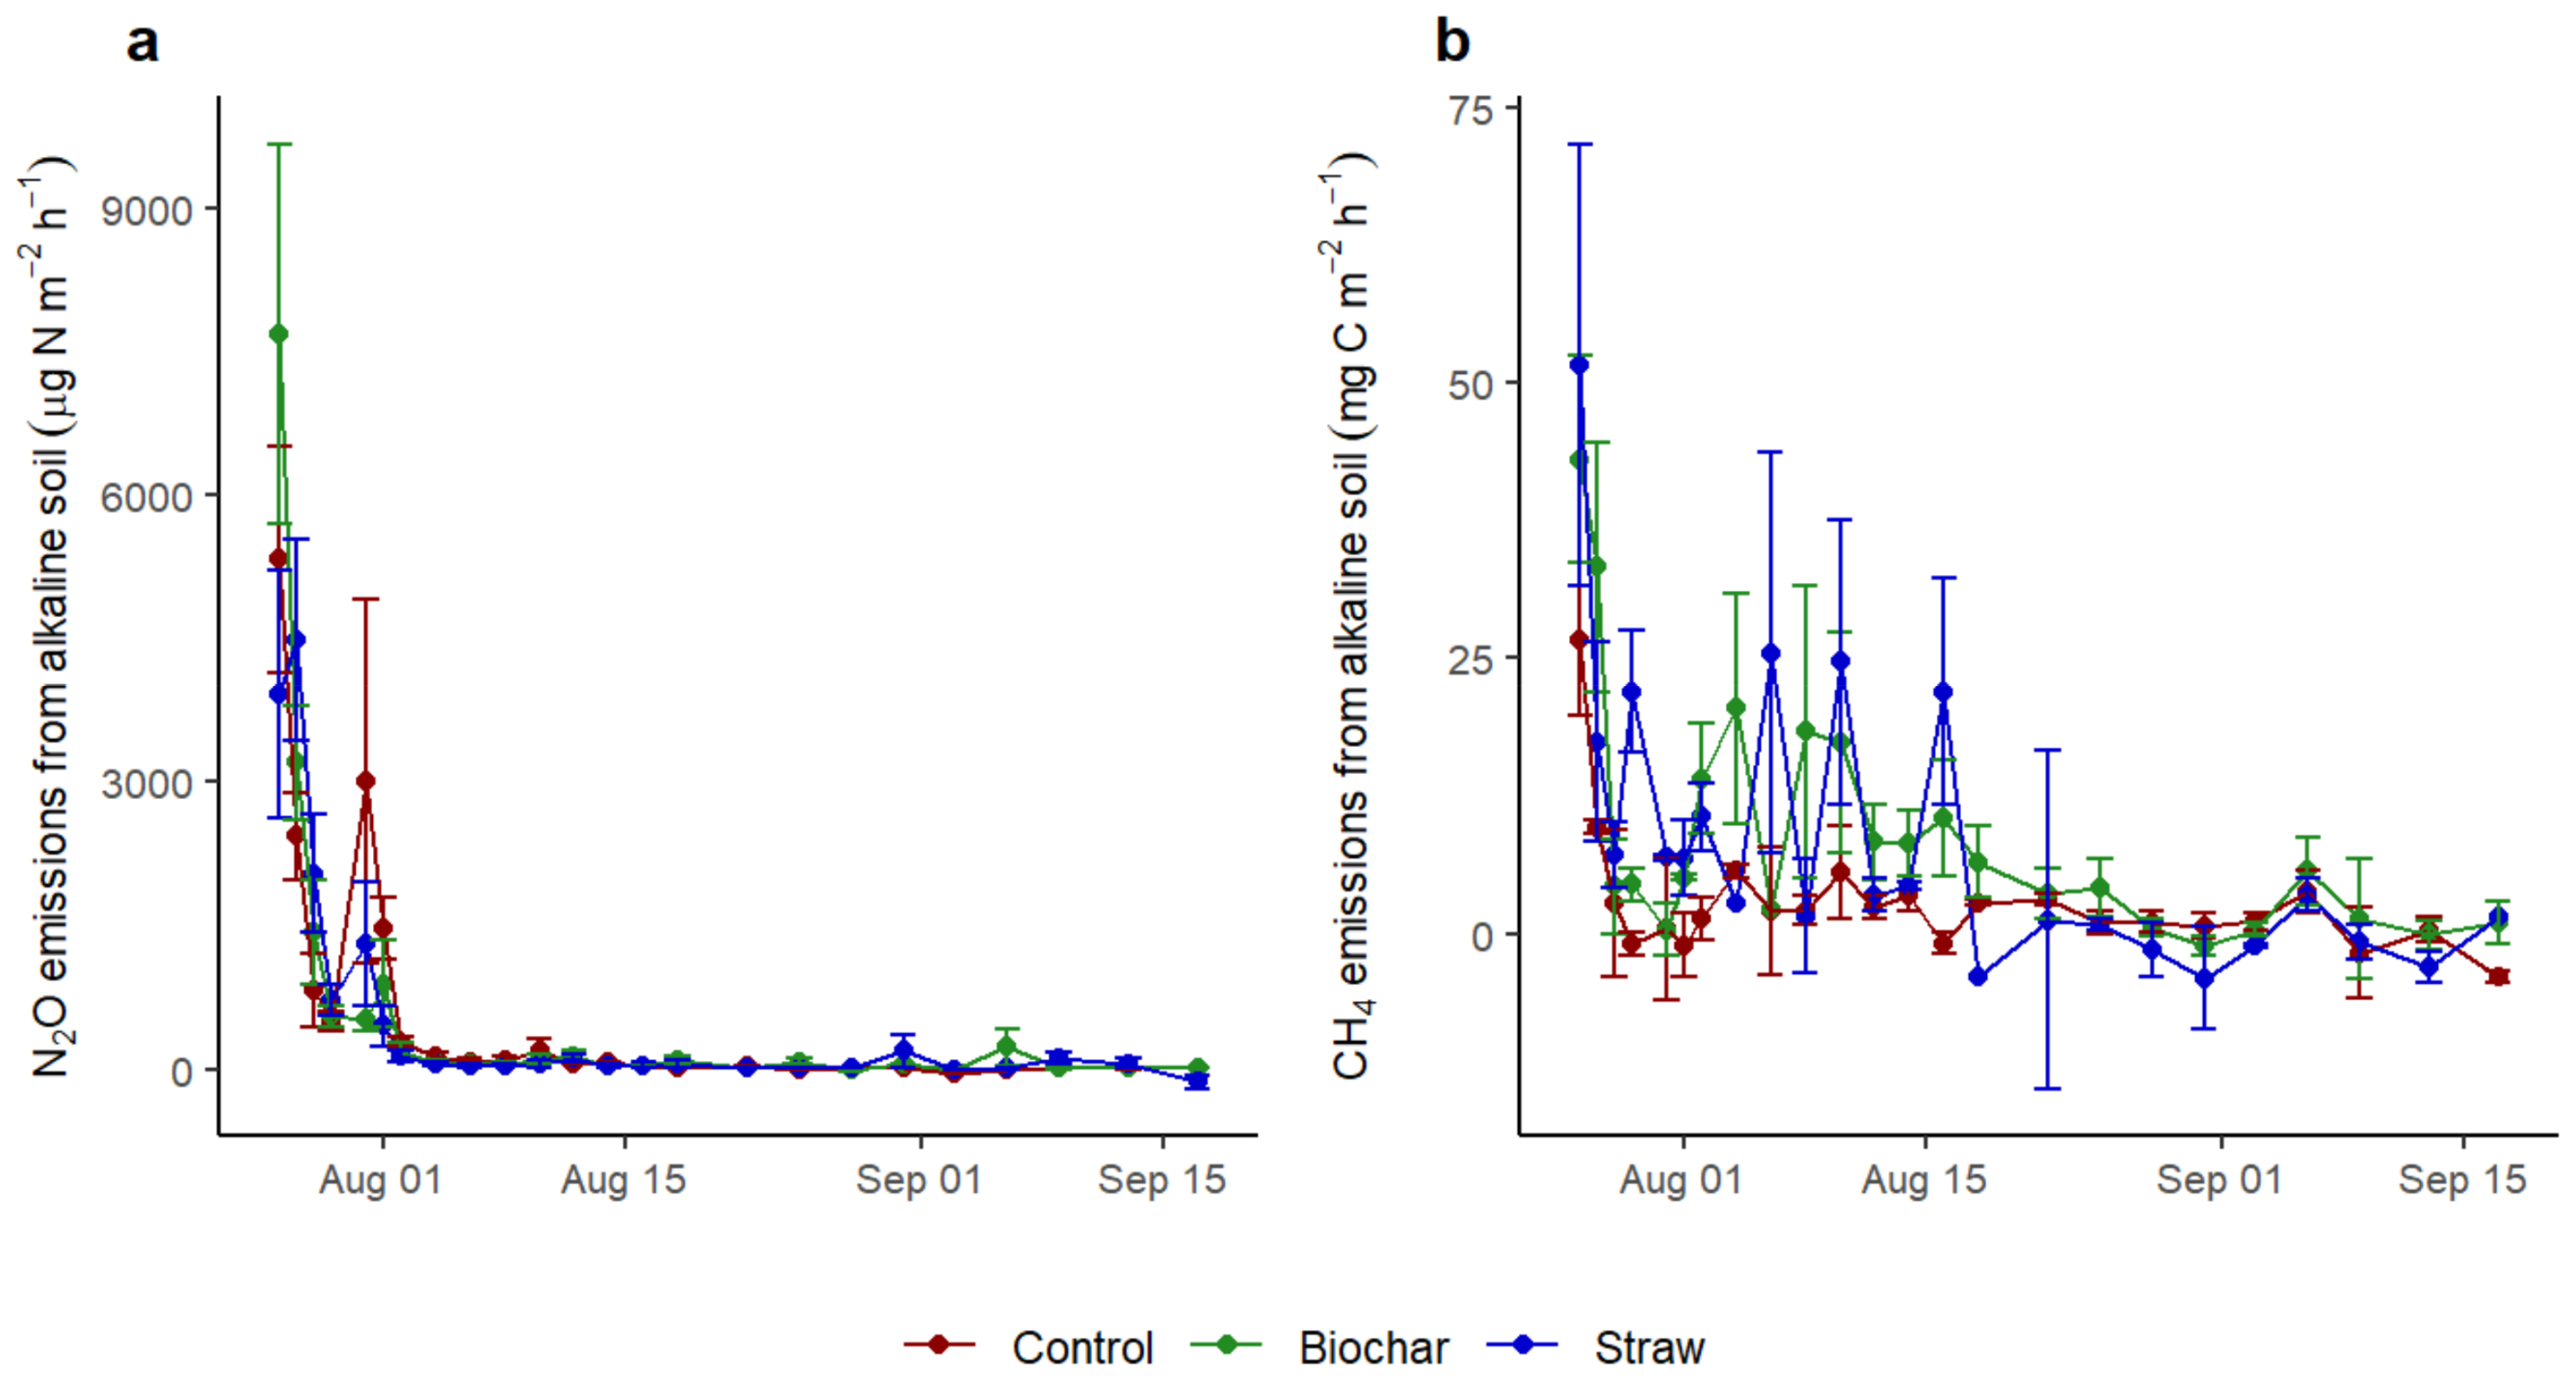
The dynamic patterns of the daily average N2O (a) and CH4 (b) emissions are presented in Figure 2, Figure 3 and Figure 4. The gases displayed a distinct emissions trend in the acidic (Figure 2), neutral (Figure 3), and alkaline (Figure 4) soils over the investigated period. The degree of gas emissions differed in accordance with soil pH levels and amendments. The N2O emissions from the alkaline soil exhibited an intense increase upon treatment during the first week of investigation. Over the entire study period, the highest N2O flux of 7.68 mg N m−2 h−1 was recorded for the treatment of alkaline soil with biochar (Figure 4a), after which the N2O pulse declined and remained stable until the last days of the experiment. In the acidic and neutral soils, the N2O fluxes increased gradually to values of 2.01 and 3.21 µg N m−2h−1 (Figure 2a, Figure 3a and Figure 4b), respectively, followed by a slow decrease. On the other hand, the CH4 emissions measured from the investigated soils were relatively comparable in terms of exhibiting a decreasing trend over time for the outdoor packed soil column (Figure 2b, Figure 3b and Figure 4b). The peak CH4 emissions value was (67.76 mg C m−2 h−1) in neutral soil combined with straw (Figure 3b).
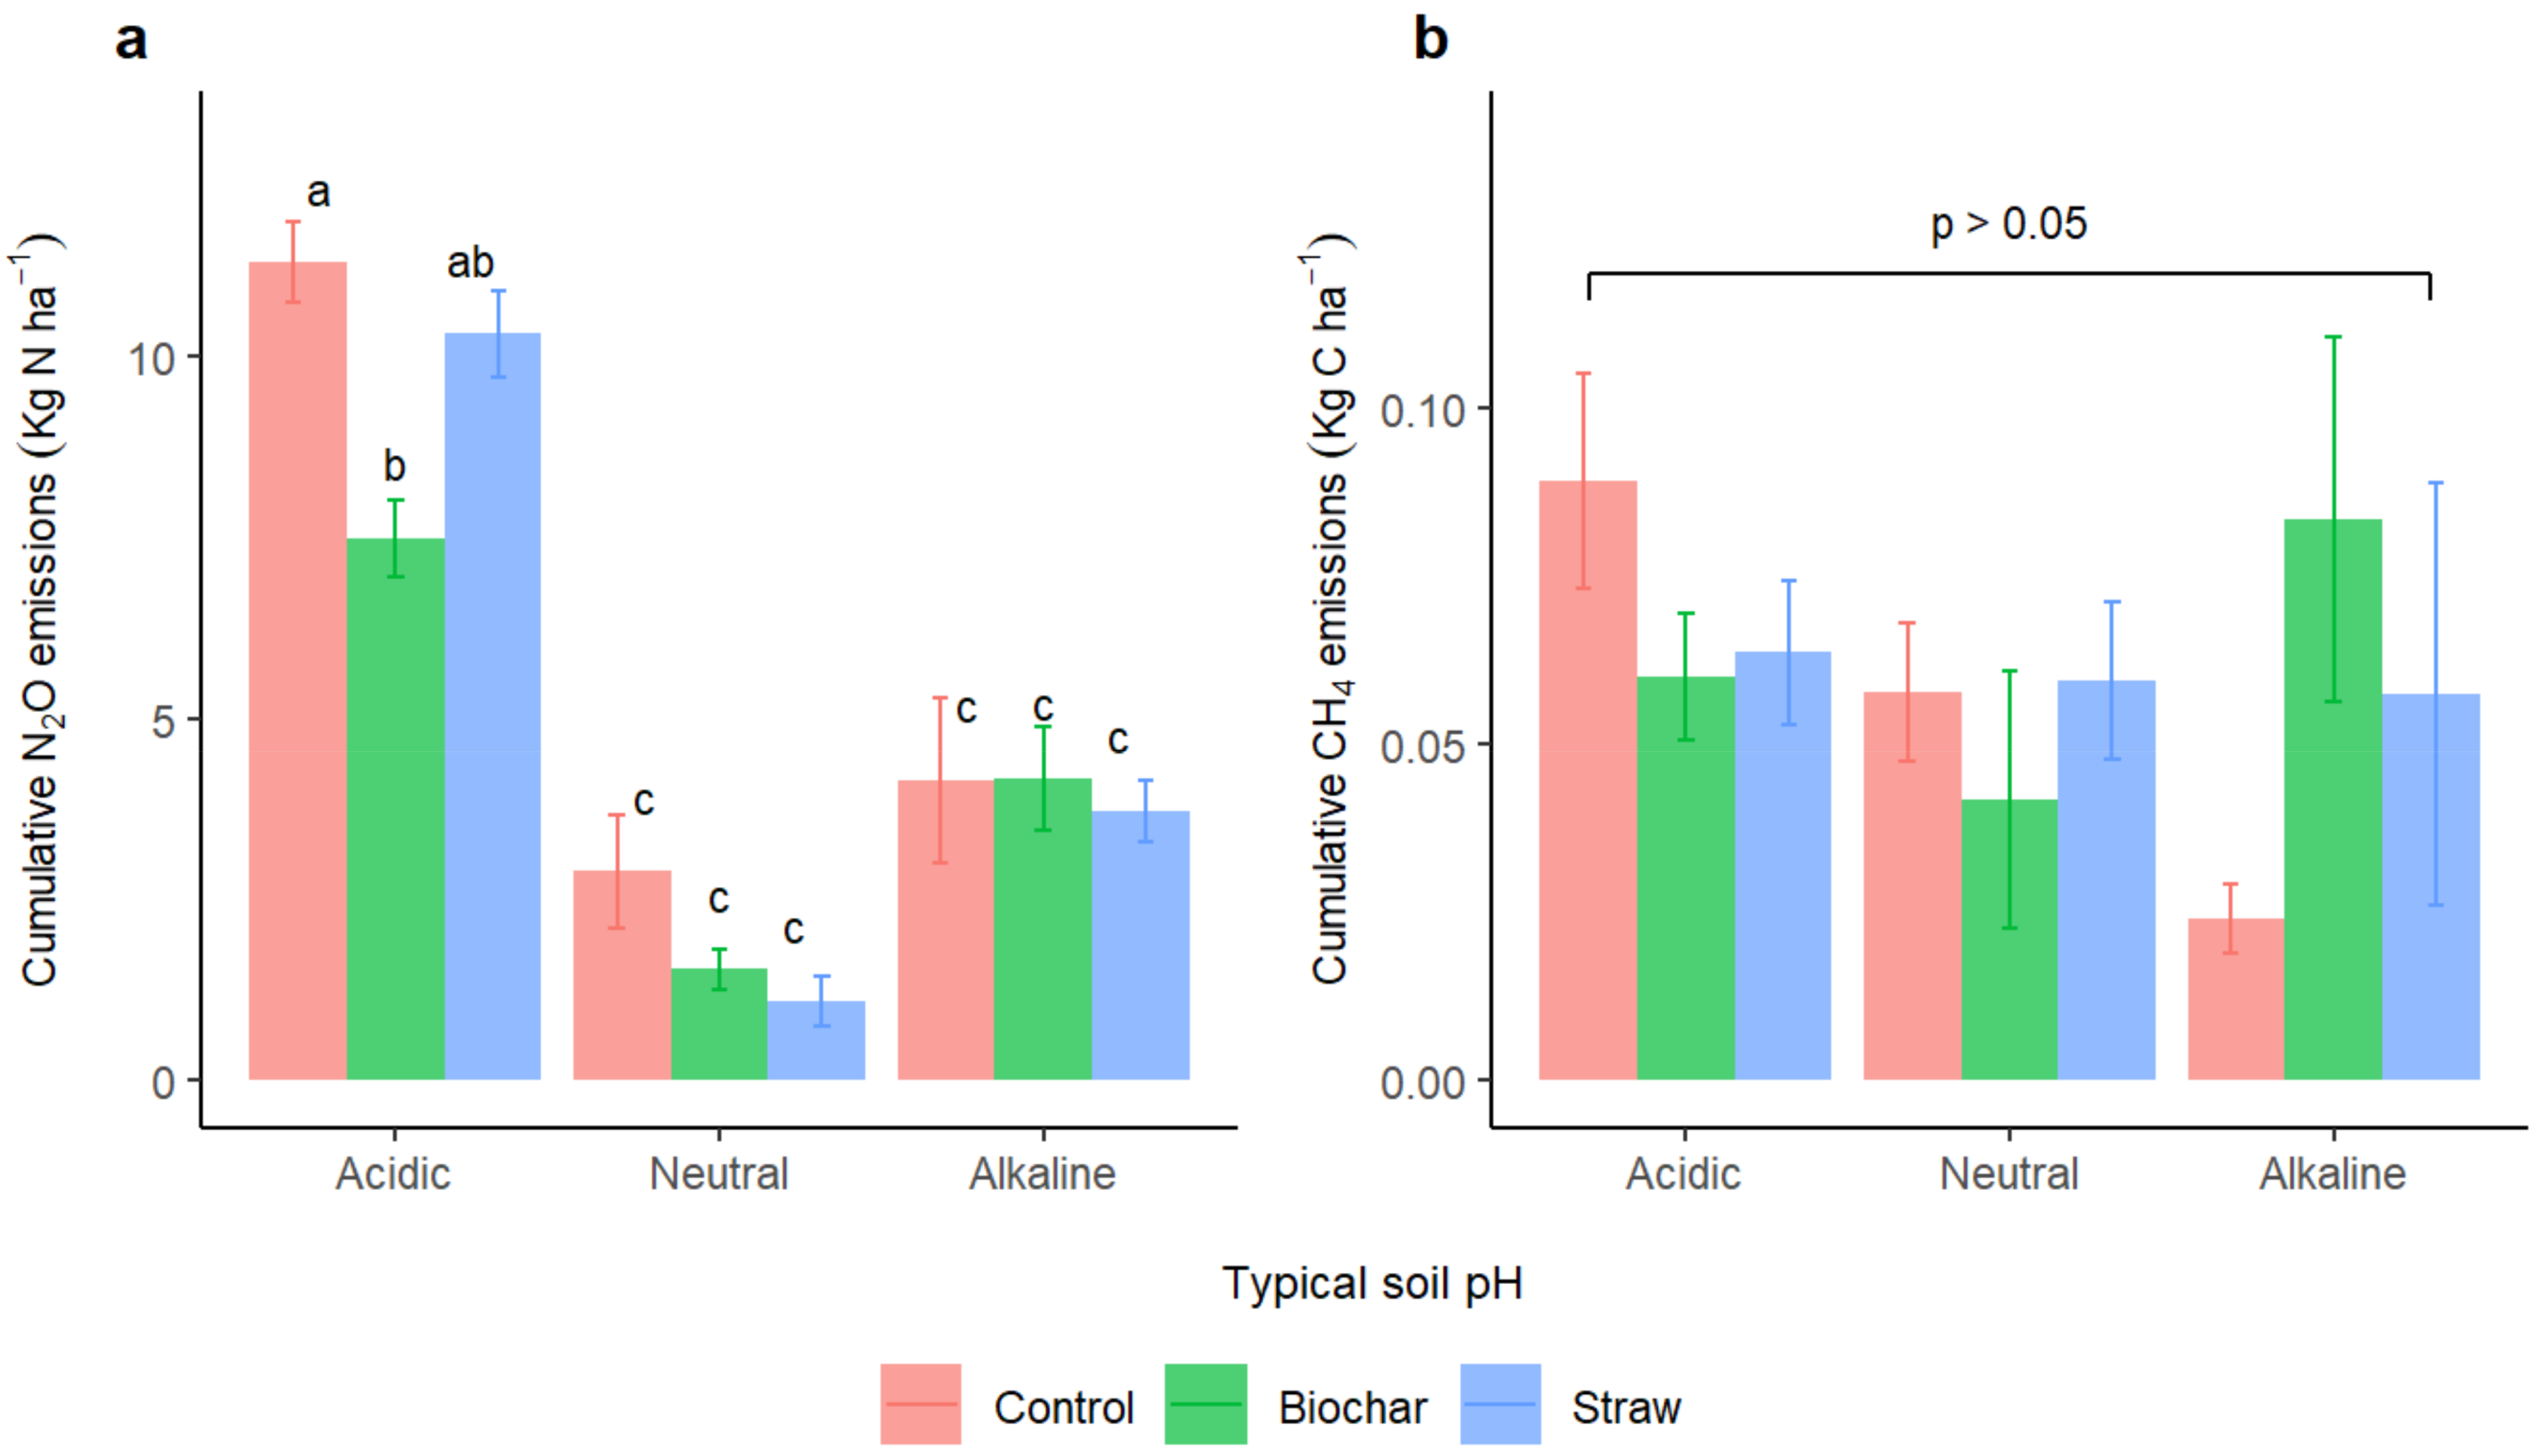
The results of two-way ANOVA are illustrated in Figure 5. The means and standard error values can be seen in Table S1 of the Supplementary Materials. For N2O emissions, the values of treatments ranged between 7.48 ± 0.53 and 11.3 ± 0.55 kg N ha−1 in acidic soil, while the values of treatments in neutral soil ranged from 1.10 ± 0.34 to 2.89 ± 0.79 kg N ha−1. The alkaline soils recorded mean values ranging between 3.72 ± 0.42 and 4.15 ± 1.14 kg N ha−1 among the treatments. Surprisingly, CH4 was cumulatively emitted from various soil types, with mean values ranging between 0.060 ± 0.009 and 0.089 ± 0.016 kg C ha−1 in acidic soil among the various treatments. The values recorded for neutral and alkaline soils ranged from 0.042 ± 0.019 to 0.059 ± 0.012 kg C ha−1 and from 0.024 ± 0.005 to 0.083 ± 0.027 kg C ha−1, respectively, among the various treatments. It turns out that the N2O fluxes were more likely to be significantly higher in acidic soil than in neutral or alkaline soils (Figure 5a). However, it is obvious that the application of treatments reduced the N2O emissions in acidic soils, where a significant reduction (p < 0.05) was noticeable with the use of biochar (Figure 5a). Straw also decreased emissions, but the difference was not statistically significant. With respect to the results of N2O fluxes in neutral and alkaline soils, there were no significant differences between the treatments and the control, although there was a slightly higher variability for the control than for the treatments in neutral soils. The results of the test for CH4 fluxes reported slightly higher values in acidic soil than in other soil types, but the data were inconclusive (Figure 5b). However, it is noteworthy that the application of biochar and straw in acidic soil seemingly decreased cumulative CH4 emissions, while the mean values of cumulative CH4 for treatments in alkaline soils were high and exhibited greater variability than the cumulative CH4 for the control (Figure 5b).

3.3. Relationship of N2O and CH4 Emissions with Soil Factors in Soils of Different pH under Biochar and Straw

3.3.1. Relationship of N2O to WFPS and Soil Temperature

The results revealed that there was an extremely weak correlation between WFPS and N2O. The strength of the relationship between log N2O emissions and WFPS was higher in acidic soil under biochar and in neutral soil under straw treatments, but was not statistically significant (Figure 6a). The relationship was positive in all treatments except for in acidic soil under the control condition, where a 1% increase in WFPS was associated with a 3% decrease in µg N m−2 h−1 N2O emitted to the atmosphere (Figure 6a) and (Supplementary Materials Table S2). However, none of the typical soils showed more extreme results under the different treatments than any other. Conversely, the results from our data showed that the correlation between soil temperature and log N2O emissions was significant under biochar in neutral soil (p < 0.05), with 27% of variation explained, and in alkaline soil (p < 0.01), with 47% of variation explained (Figure 6b). It is important to note that the slope coefficients for control and biochar in alkaline soil were identical, but the correlation coefficient for control was only significant at p-value = 0.05 due to there being less variation in N2O emissions explained by soil temperature under no treatment (R2 = 0.33) compared to that explained under biochar treatment (R2 = 0.47), although it was significant at p-value = 0.01 (Figure 6b). Similarly, only soil temperature was negatively correlated with N2O emissions in acidic soil under the no treatment condition, where a 1 °C increase in soil temperature was expected to lead to a decrease of N2O emitted to the atmosphere by 2% (Figure 6b) and (Supplementary Materials Table S3). Furthermore, the expected effect of soil temperature on N2O emissions (slope coefficient) under the control condition was significantly (p = 0.017) higher in alkaline soil by 41% compared to that in acidic soil under the control condition, as revealed by the interaction model (Supplementary Materials Table S3). No other slope coefficients were found to be significantly different.

3.3.2. Relationship of N2O with Soil pH and Soil Dissolved Organic Carbon

The results revealed that soil pH was negatively correlated with log N2O emissions for all treatments except for straw in acidic soil (Figure 7a). Furthermore, the strength of the negative relationship was greater in alkaline soil under biochar (p < 0.001) and straw (p < 0.01) treatments, with R2 = 0.54 and 0.38, respectively. Nevertheless, no significant difference was found among the treatments’ slope coefficients in any of the different soil types after model fit assessment (Table S4, Supplementary Materials). However, what is noticeable is that biochar seems to possess a liming capacity in acidic soil, while straw does not affect the natural pH of the soil (Figure 7a). On the other hand, the results showed no clear relationship between dissolved organic carbon and log N2O emissions, as the two variables were weakly correlated for all different typical soil pH values under different treatments (Figure 7b). Yet, no significant difference was found among the treatments’ slope coefficients in any of the soils of different natural pH after model fit assessment (Table S5, Supplementary Materials).

3.3.3. Relationship of N2O with Soil Ammonium-N and Soil Nitrate-N

The results for log N2O as a function of log NH4+-N and NO3-N in different types of soils under biochar and straw are presented in Figure 8, and it is clear that both forms of N in soil are good predictors of N2O emissions. To this end, NH4+-N seemed to have a moderate positive correlation with N2O in acidic soils that had been treated, and the rest of the other typical soils in general (Figure 8a). There was no correlation found between NH4+-N and N2O in acidic soil without treatment, but NH4+-N seemed to significantly explain a certain amount of variation in N2O for this typical soil under straw (R2 = 0.32). In neutral soils, the correlation between log NH4 +-N and log N2O was typically higher under all treatment conditions; the coefficient of determination was significant at p-value = 0.05 for the control (R2 = 0.25), while the coefficients for both biochar and straw were significant at p-value = 0.01, with R2 = 0.44 and 0.39, respectively. In alkaline soil, only the control condition significantly enhanced the N2O emissions with increasing NH4+-N, with an R2 of 0.23 (Figure 8a). Despite NH4+-N being a good predictor of N2O emissions, and the coefficients of determination varying with soil type and treatment, no significant difference was found among the slope coefficients of the treatments in various typical soils (Supplementary Materials Table S6).
In contrast, log NO3-N seemed to have a weak negative correlation with log N2O in acidic soil under biochar and straw, but the correlation was positive under the control condition and in the rest of other typical soils (Figure 8b). The correlation between log NO3-N and log N2O in neutral soil without treatment was significant at p-value = 0.05, with 28% of variation being explained in log N2O by log NO3-N, while in neutral soil under biochar, the correlation was significant at p-value = 0.01, with 36% of variation being explained. No significant correlation was found under straw treatment, although a certain amount of variation (22%) was explained (Figure 8b). Alkaline soil, though, seemed to significantly enhance N2O emissions with increasing NO3-N under all conditions. In fact, the correlation between log NO3-N and N2O emissions was significant in this typical soil without treatment, at p-value = 0.01, with 37% of variation being explained, while the correlation under biochar and straw was significant at p-value = 0.05, with R2 = 0.28 and 0.24, respectively (Figure 8b). With respect to the respective influential soil type under a particular treatment, the log-log model predicted that an increase of 1% in the nitrate content of alkaline soil without treatment would significantly increase N2O emissions (p = 0.038) by 0.97% compared to acidic soil without treatment (Table S7, Supplementary Materials). No other significant difference was found in the slope coefficients among the various soil types under different treatments.

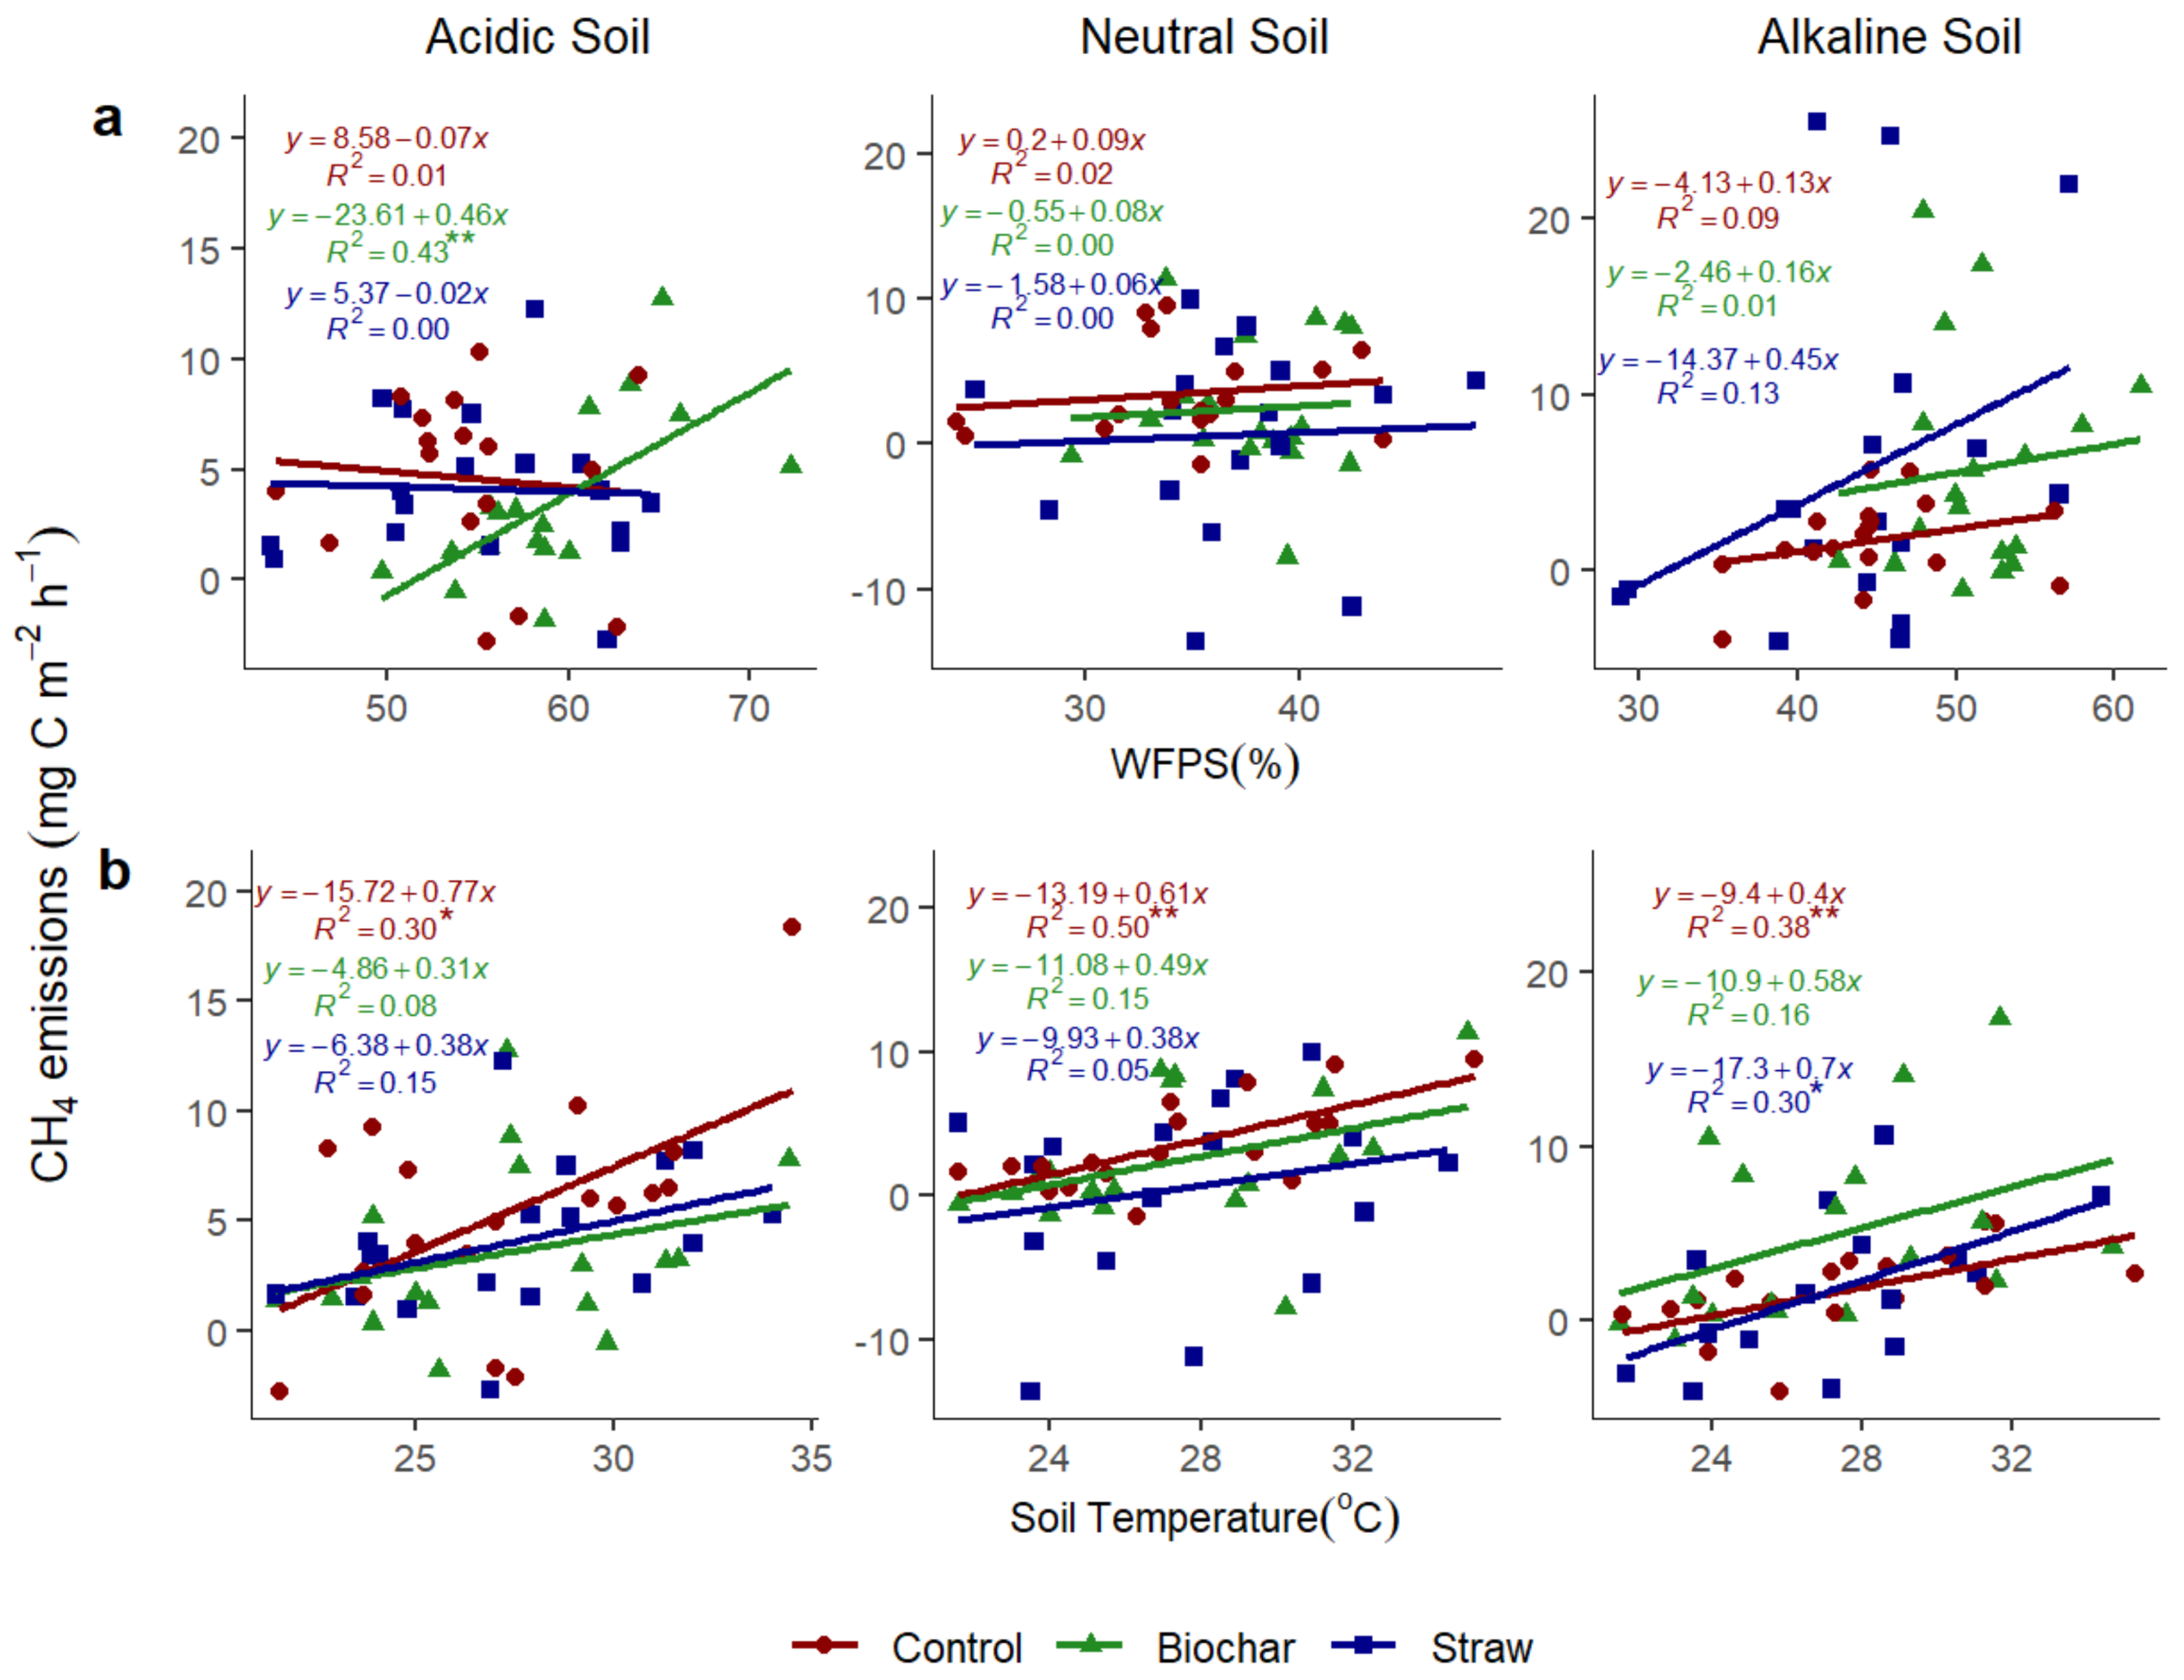
3.3.4. Relationship of CH4 with Soil Water-Filled Pore Space and Soil Temperature

The results for the relationship of CH4 emissions with soil WFPS and soil temperature in response to biochar and straw are presented for all soils, with their different pH, in Figure 9. It turns out that only the correlation between WFPS and CH4 emissions was significant in acidic soils under biochar (Figure 9a). The correlation was positive and significant at p-value = 0.01, with 43% of variation in CH4 emissions being explained by soil WFPS. Alkaline soil under straw exhibited a bit more influence on CH4 emissions with increasing soil WFPS, but the correlation between these variables was weak. No correlation at all was found for the rest of the treatments in general, where neutral soil specifically did not influence CH4 emissions with increasing soil WFPS, regardless of whether the amendment was applied or was not (Figure 9a). Furthermore, no significant difference was found among the treatments’ slope coefficients in any of the soils with different natural pH after model fit assessment (Table S8, Supplementary Material). Soil temperature, on the other hand, was weakly to moderately correlated with CH4 emissions in various soil types under different treatments (Figure 9b). In fact, the correlation between soil temperature and CH4 was positive and significant in all soil types without any treatment, with the correlation in acidic soil being significant at p = 0.05 and 30% of the variation in CH4 emissions being explained by soil temperature. Note also that the effect of a 1 °C increase in the temperature of acidic soil without treatment results in an expected significant increase of 0.77 mg C m−2 h−1 in CH4 emissions, as predicted by the model (p = 0.006), and no other slope coefficient was found that was significant (Table S9, Supplementary Materials). The correlation between soil temperature and CH4 emissions in both untreated neutral and alkaline soils was significant at p-value = 0.01, with R2 = 0.5 and 0.38, respectively (Figure 9b). A significant correlation between soil temperature and CH4 emissions was observed in alkaline soil under straw (p < 0.05), with 30% of variation being explained. No significant correlation was found in any typical soil pH under biochar treatment (Figure 9b).

3.3.5. Relationship of CH4 with Soil pH and Soil Dissolved Organic Carbon

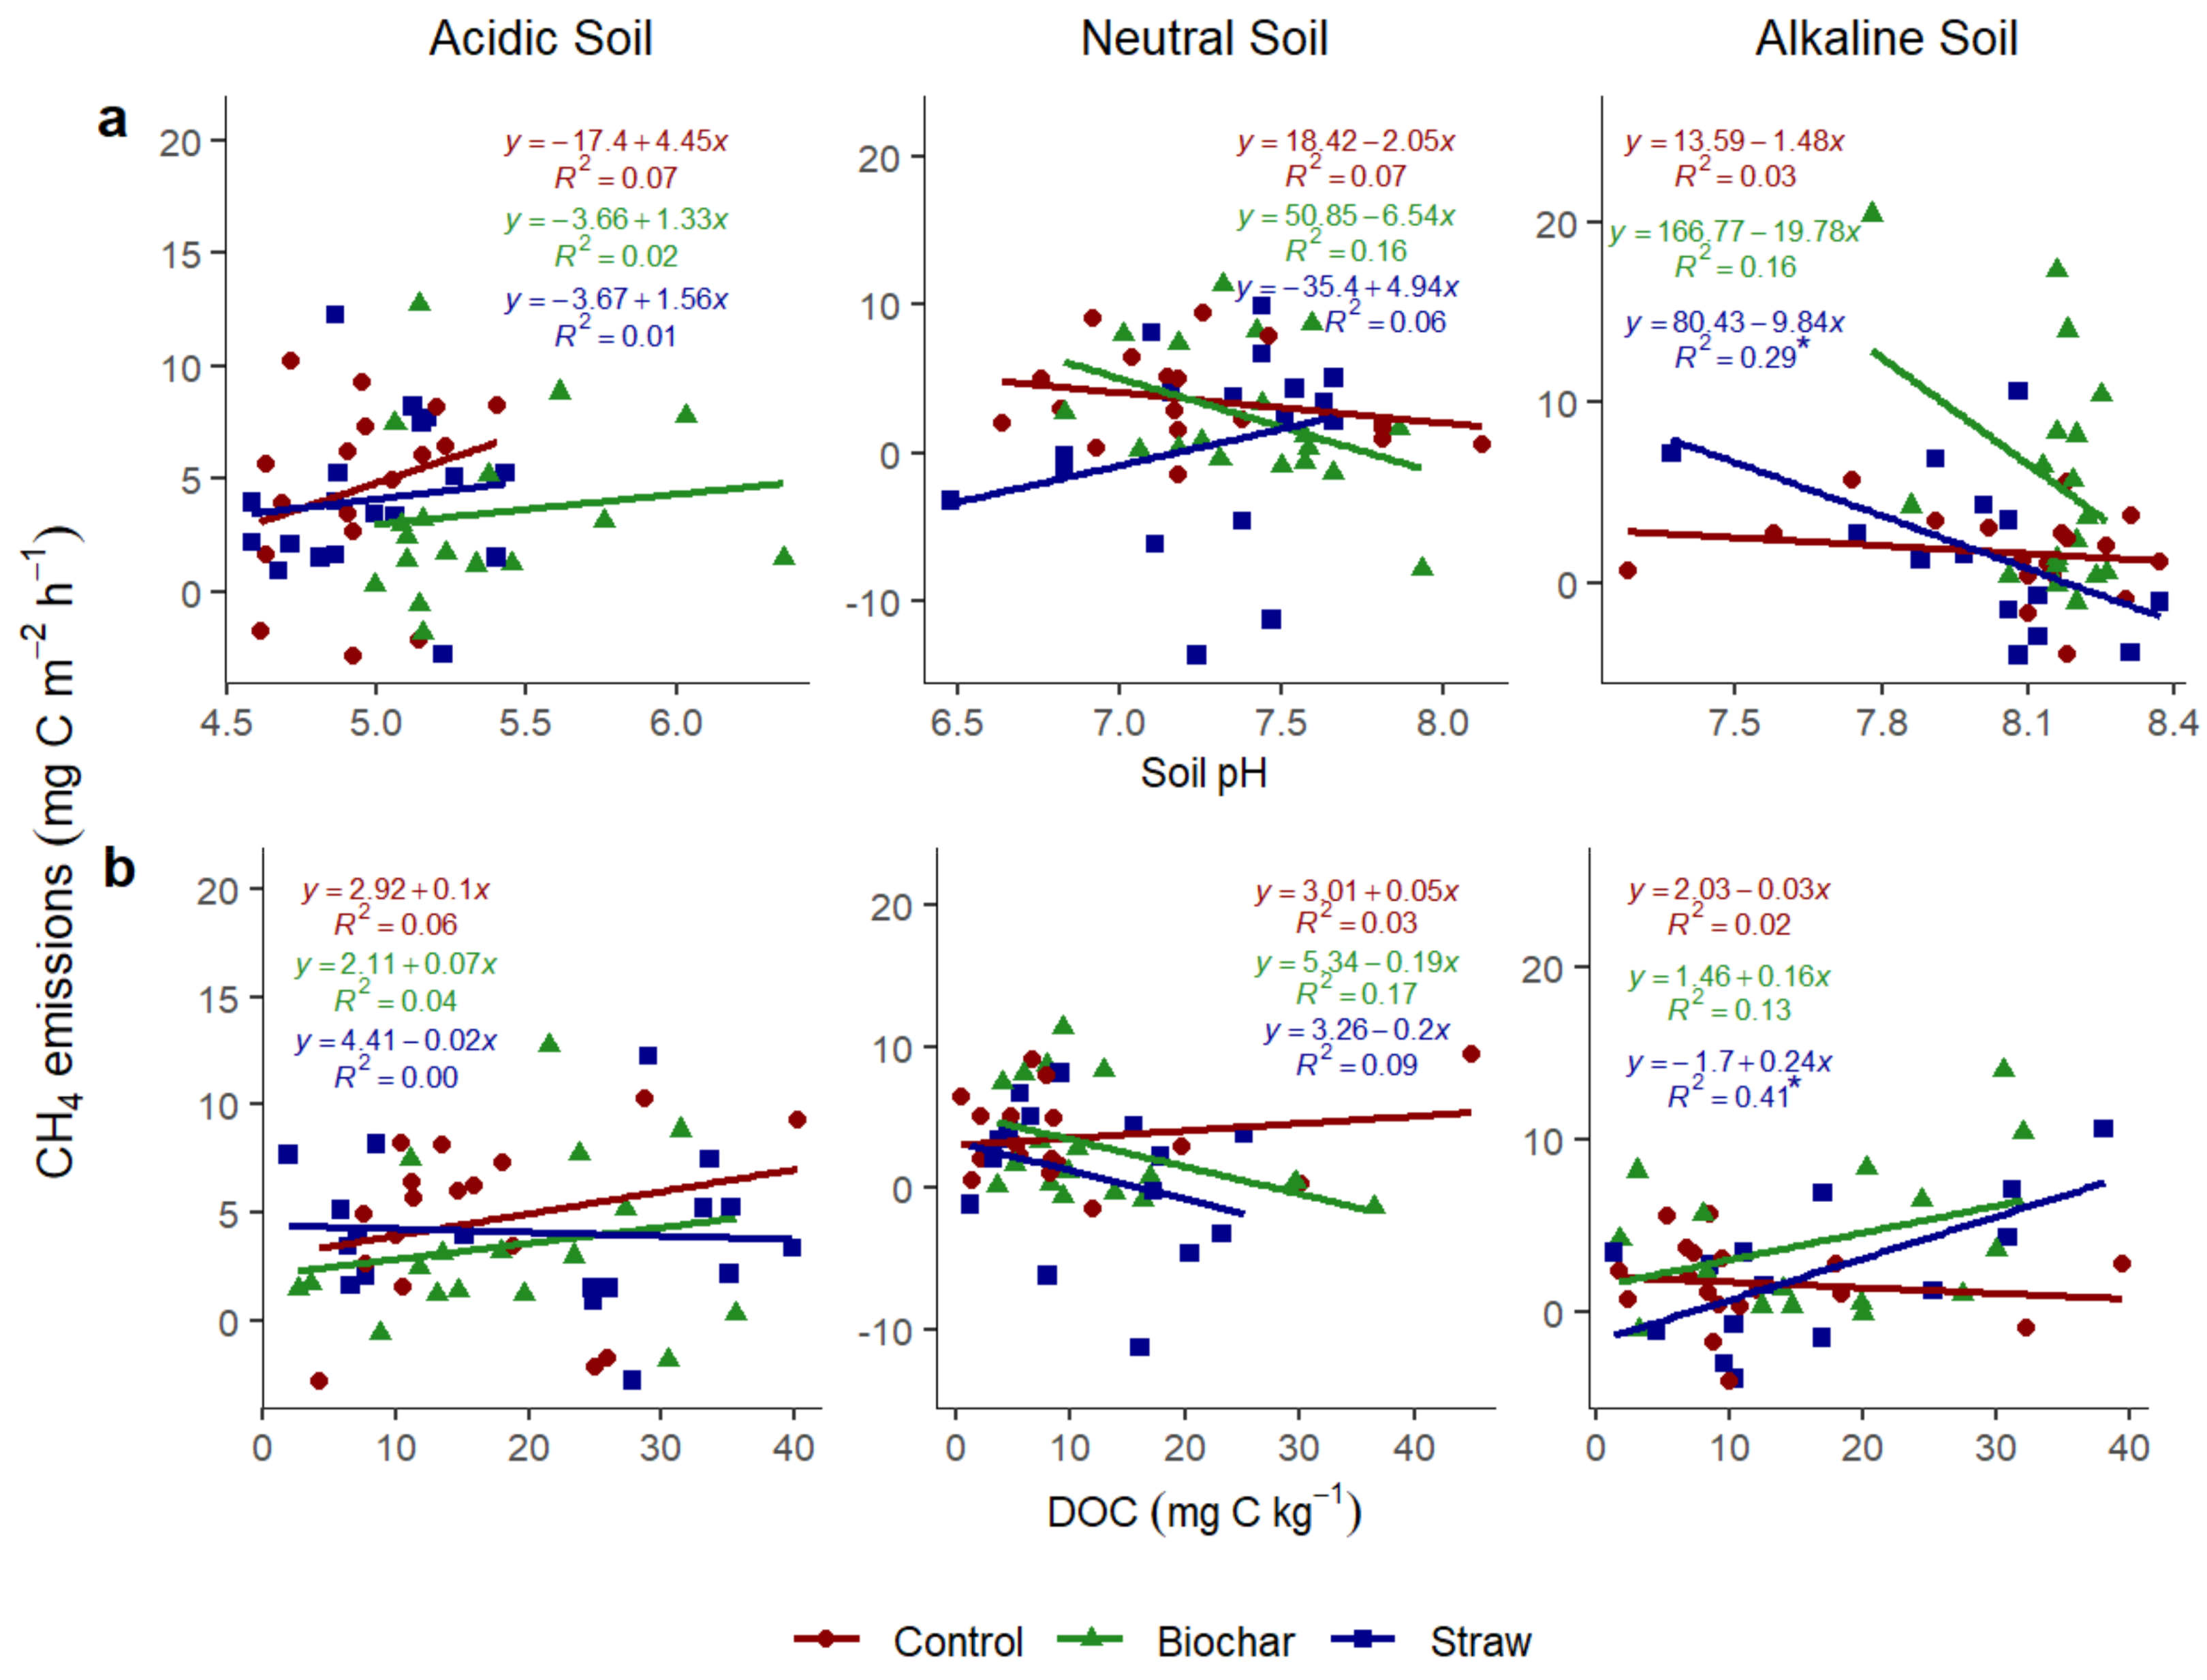
The results revealed an extremely weak correlation between soil pH and CH4 emissions, particularly in acidic soils (Figure 10a). We observed a weak negative correlation between these variables in neutral soil without treatment and with biochar, while under straw treatment, neutral soil exhibited a weak positive correlation between soil pH and CH4 emissions. The alkaline soil with straw seemed to decrease CH4 emissions, as the soil becomes more alkaline, with 29% of variation being explained and p < 0.05 (Figure 10a). With respect to the surprising influential soil type under a particular treatment, no significant difference was found among the treatments’ slope coefficients in any of the soils with different pH after model fit assessment (Table S10, Supplementary Materials). Similarly, alkaline soil under straw was the only condition that significantly influenced CH4 emissions with increasing DOC, with a total variation of 41% being accounted for (Figure 10b). Moreover, this effect was significantly higher by 0.26 compared to that of acidic soil under straw (p = 0.032). No other slope coefficient was found that was statistically significant (Table S11, Supplementary Materials).

3.3.6. Relationship of CH4 with Soil Ammonium N and Soil Nitrate N

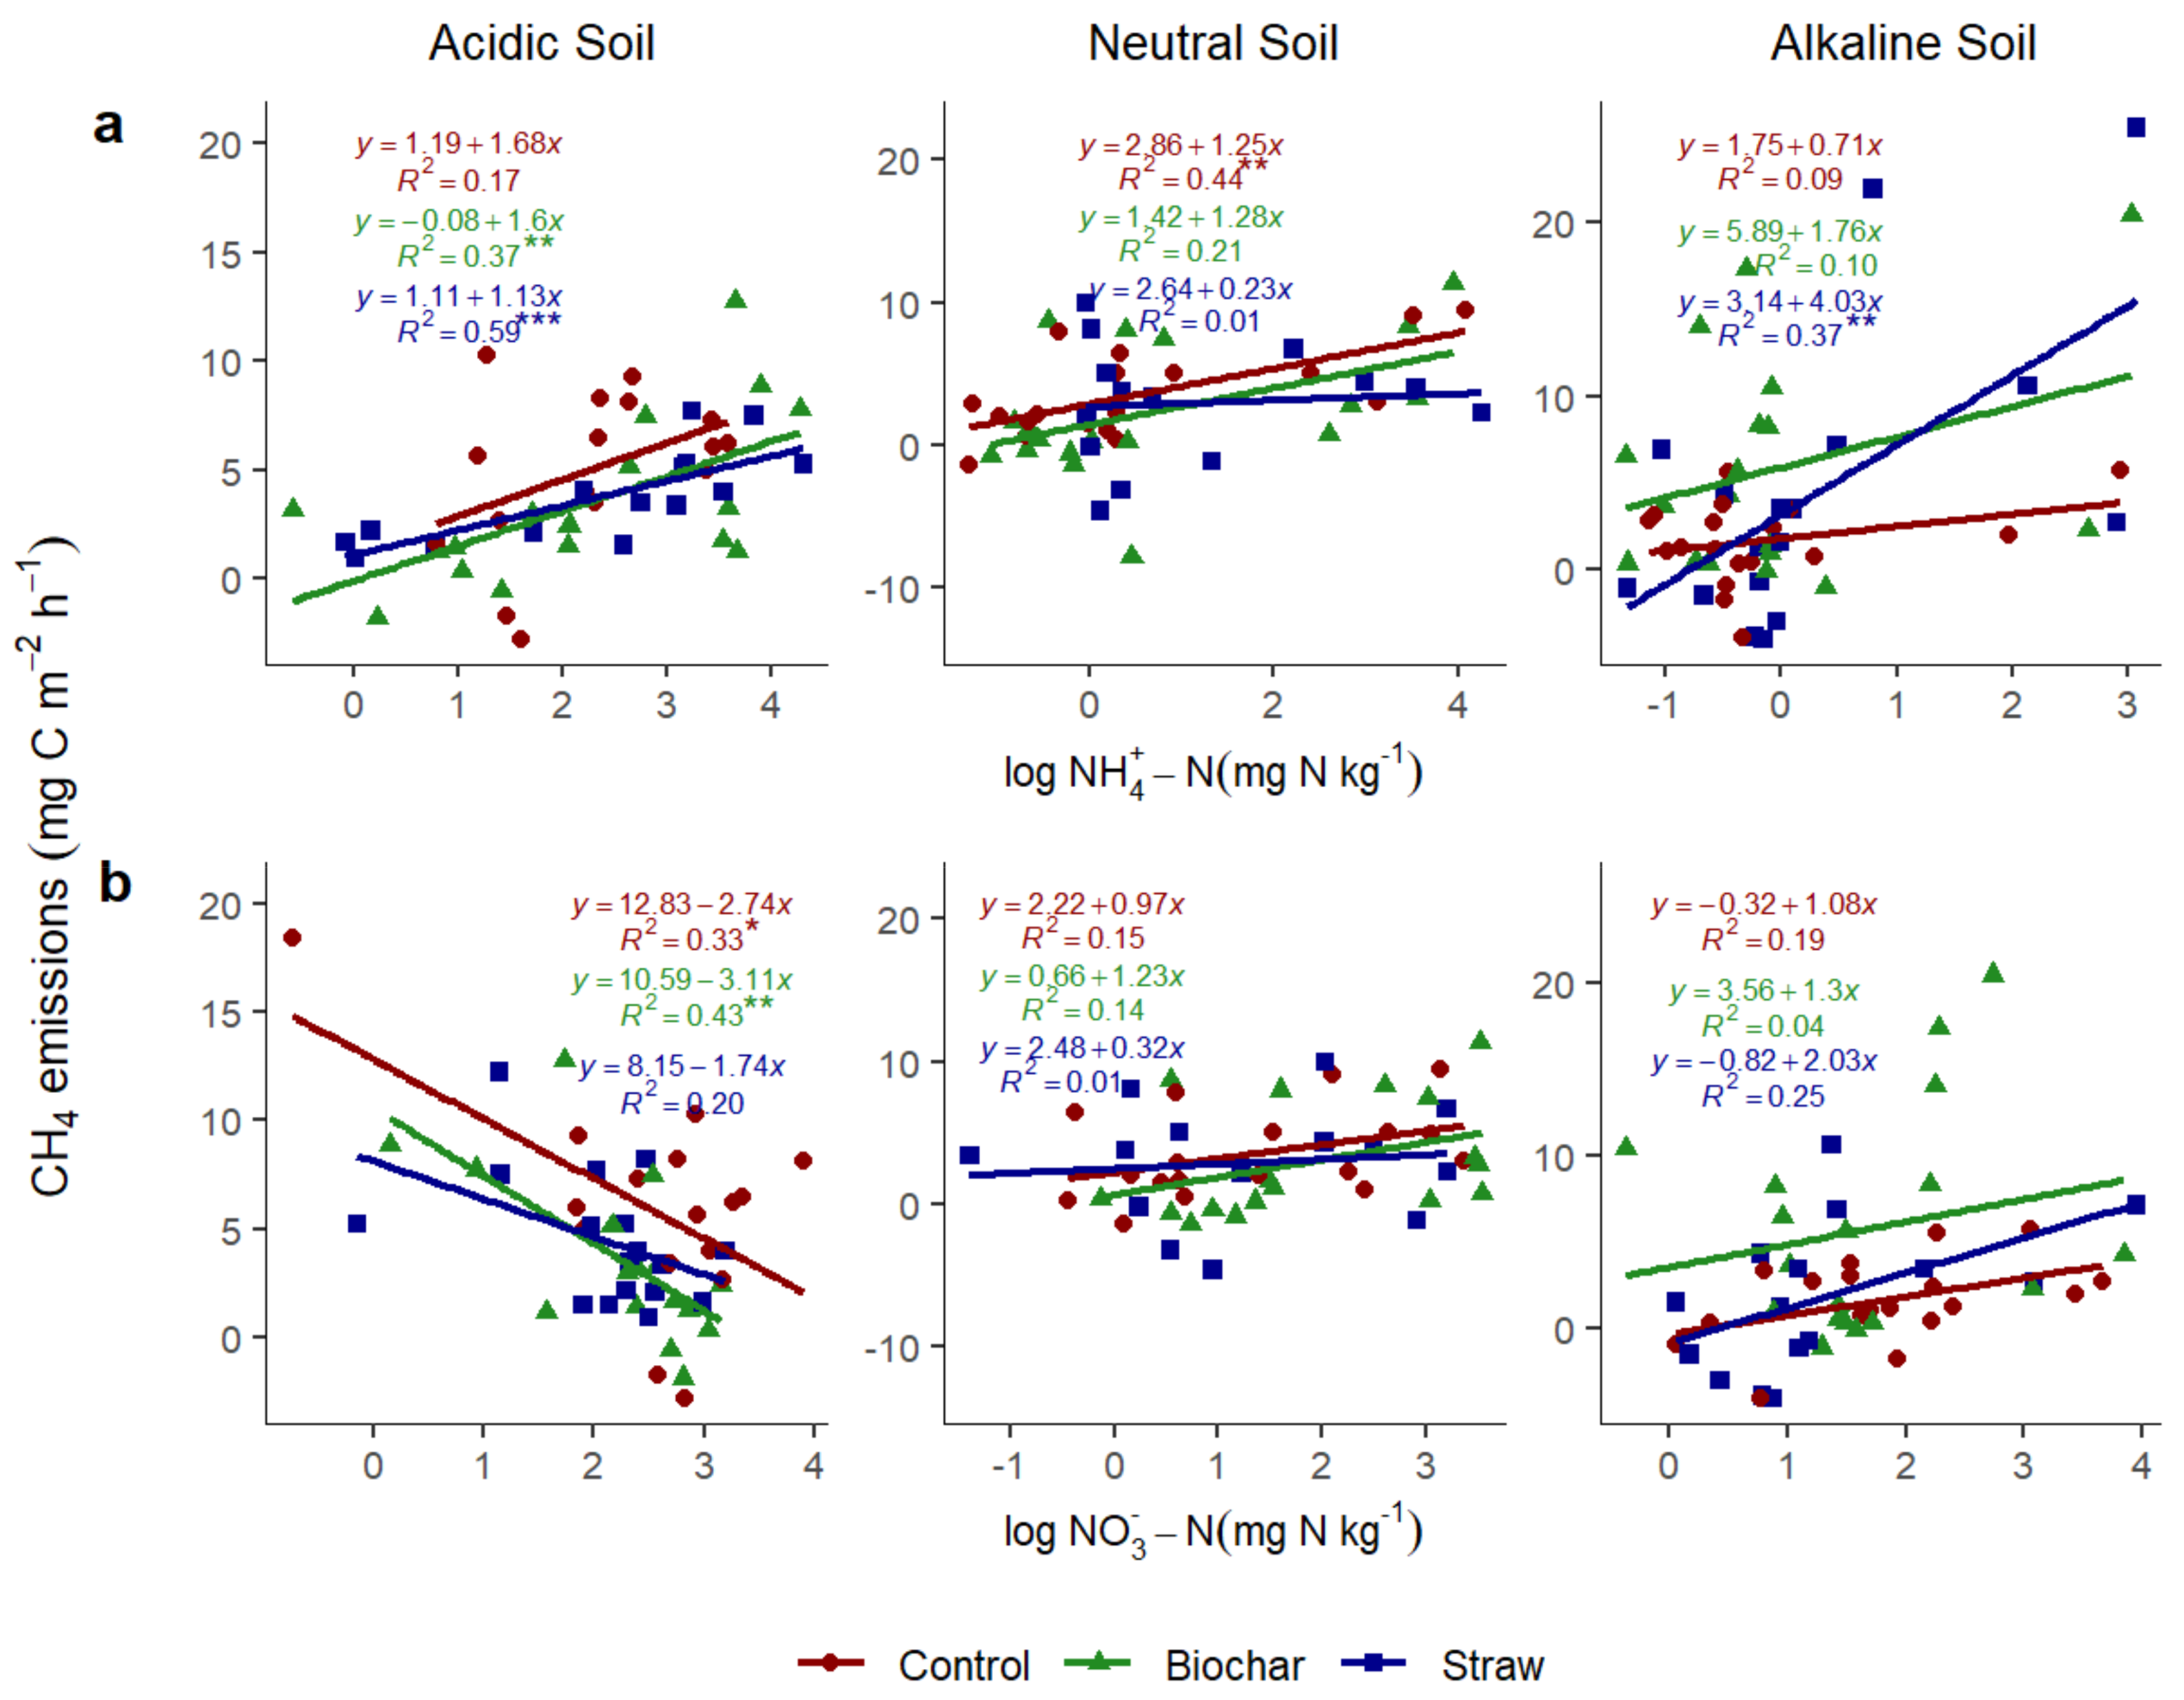
The results illustrated in Figure 11 represent CH4 emissions as a function of log NH4+-N and log NO3-N enhanced by natural soil pH under no treatment, and treatment with biochar and straw. Although the correlation was positive in all soil types, it is obvious that the correlation between log NH4+-N and CH4 under biochar and straw was more prominent in acidic soils. We found a highly significant correlation under the straw treatment condition, where 59% of variation was explained at p < 0.001. A significant correlation (p < 0.01) between these variables in acidic soil was also found under biochar, with 37% of the variation in CH4 emissions being explained by log NH4+-N (Figure 11a). In neutral soil, we only found a significant correlation under the control condition, with 44% of variation being accounted for (p < 0.01). The correlation between log NH4+-N and CH4 in alkaline soil was significant only under the straw treatment, where 37% of the variation was explained, p < 0.01. Furthermore, the linear-log model predicted that the latter effect was associated with a significantly higher increase in CH4 emissions by 0.029 compared to the straw condition for acidic soil (p = 0.046), assuming a 1% increase in NH4+-N content in acidic soil. No other slope coefficient was found that was significant (Supplementary Materials, Table S12).
Apart from in acidic soil, where the significant negative correlation between log NO3-N and CH4 was more prevalent under the control and biochar conditions and non-significant under straw, the correlation under the treatment conditions for neutral and alkaline soils was positive, indicating the relative influence of decreasing soil pH on reducing CH4 emissions, as a result of the increase in soil nitrate content.
Nonetheless, the positive relationship between soil nitrate and CH4 emissions in soils with high pH is not significant (Figure 11b). In acidic soil under the control condition, the increase of 1% in NO3-N content was associated with a significant decrease of 0.027 mg C m−2 h−1 CH4 emitted to the atmosphere (Table S13, Supplementary Materials), with a total of 33% of the variation being accounted for (Figure 11b). Similarly, 43% of the variation in CH4 was explained by log NO3-N under biochar straw (p < 0.01). With respect to the relative effect of treatments in different soil types, the linear-log model predicted that a 1% increase in NO3-N content in neutral and alkaline soil without treatment would significantly increase CH4 emissions by 0.037 (p = 0.0029) and 0.038 (p = 0.0056) mg C m−2 h−1, respectively, compared to acidic soil without treatment. No other slope coefficient was found that was significant (Figure S13, Supplementary Materials).

3.4. Contributions of Different Treatments to Soil Properties Following the Packed Soil Column Experiment

The chemical and physical features of the soil were evaluated to better understand the function of the additions after the investigation period. Table 2 summarizes the soil environment variables, consisting of soil inorganic substrates (NH4+-N, NO3-N, DOC), soil water-filled pore space (WFPS), and pH. The addition of biochar resulted in a high increase in soil pH (p < 0.05) for acidic soil relative to the other treatments. The DOC content of the treated soils varied roughly, without any clear tendencies among the treatments (p > 0.05). The three (acidic, neutral, and alkaline) considered soils responded differently following the application of different treatments on mineral nitrogen substrates (NH4+-N, NO3-N).

4. Discussion

4.1. Effect of Biochar and Straw Addition on N2O Emissions

Previous studies have shown that input of biochar into the soil has a potential effect on the chemical and physical characteristics of the soil, mostly the pH, fertility and water retention [60,61]. Crop-derived biochar with an elevated pH has received much attention as a practical way of reclaiming soil quality and reducing GHG emissions [62,63]. However, the response of soil emissions to the addition of biochar might have a contrasting effect depending on the pH values of both the biochar and the soil [35,36]. The findings of this study revealed that corn biochar application evidently suppressed (p < 0.05) the N2O pulses in acidic loam soil relative to the control treatment (Figure 5a), possibly due to large gap between the pH of the applied biochar and the amended soil (Table 1), which might have influenced the pH increase of the soil (Table 2) due to the inherent buffering ability of biochar [54]. Wang et al. [63] similarly reported that wheat straw biochar input reduced N2O fluxes by 36.3–44.2% in acidic orchard tea soil, with an equally high pH (around 10.4) to the corn biochar used in the present work.
Indeed, prior findings have shown that biochar application could enhance soil porosity and oxygen diffusion, and hence decrease N2O emissions, in sandy loam and clay loam with a pH ranging from 5.4 to 7.66 [64,65]. Nevertheless, such findings were not in accordance with the effects of biochar in neutral sandy loam soil during the rainy period (Figure 1) in the present study. Hence, biochar did not show a significant change in N2O emissions for neutral and alkaline soils compared to the control (Figure 5a). Our experiment experienced two heavy rainfall events, each of more than 60 mm, in the first week of monitoring gas emissions (Figure 1). It is important to highlight that those events massively influenced the methane and nitrous oxide emissions; thus, it may have taken a while for soil columns to fully drain, thus promoting anaerobic conditions, as is evident in the fluxes of methane (Figure 2b, Figure 3b and Figure 4b). Previous findings have shown that the increase in soil moisture following rainfall events results in higher CH4 emissions [66]. Chen et al. [67] reported that heavy precipitation could induce nitrous oxide emissions from the complete denitrification of soil by increasing soil N and C, which is probably what happened during the first week of the present study. However, it is noteworthy that, unlike CH4, natural soil pH may have interacted with those rainfall events to enhance the N2O emissions (Figure 2a, Figure 3a and Figure 4a). The soil pH is a vital factor in regulating soil processes that affect the production and release of N2O [68]. Therefore, the high buffering capacity of corn biochar was likely to lead to the decline of N2O fluxes in acidic soil [52,69]. According to the recent review by Cayuela et al. [70], the capacity of char to mitigate N2O pulses is more prevalent in soils with pH < 5. Analogous to Senbayram et al. [36], input of olive mill biochar in soils with low pH significantly reduced N2O fluxes and had no effect in alkaline soil. Additionally, the availability of mineral nitrogen substrates (i.e., NH4+-N, NO3-N) might have a strong impact on soil nitrous oxide release. Other than alkaline soil, the nitrate substrates of soils with added biochar showed low concentrations at the end of the study (Table 2), giving rise to a negative correlation between N2O and NO3-N (Figure 8b), specifically in acidic soil. Van Zwieten et al. [71] reported similar results in ferrosol amended using greenwaste biochar. These findings could be attributed to the sorption of NO3-N substrates onto the biochar pores [72,73]. Consequently, the decrease of nitrate content following the addition of biochar to soils may explain the decline in nitrous oxide (Figure 3a). With respect to the occurrence of biochar, previous studies have reported that the extent of soil N2O emissions is influenced by several factors, including soil temperature, water percentage, N mineral content (NH4+-N, NO3-N), DOC, and soil pH [74,75]. The results of the present study showed a significant positive log-linear relationship between the N2O fluxes and soil temperature following biochar application in neutral and alkaline soil, while a non-significant positive log-linear relationship (p < 0.05) between the N2O fluxes and WFPS was prevalent in all treatments in different soil types (Figure 6). A significant positive log-linear relationship was observed between the N2O emissions and both soil mineral nitrogen (NH4+-N, NO3-N) content in different higher pH soils regardless of soil amendments (Figure 8). Surprisingly, a considerable positive relationship between N2O and NH4+-N was more common in amended acidic soils than in unamended acidic soil (Figure 8a). However, given that incorporation of maize biochar into acidic soil influenced pH increase (Figure 7a and Table 2), this could promote soil nitrate pool reduction to dinitrogen gas, thus leading to a decrease in N2O/N2 ratio and total N2O fluxes [75,76]. Furthermore, Yang et al. [77] argued that by incorporating biochar into soil, the N2O emissions from the nitrification and denitrification processes were indirectly affected via the alteration of soil properties. The increase of soil pH also enhanced nitrification, thereby increasing N2O emissions [78]. Our results with respect to the relationship between N2O and mineral Nitrogen were not in line with those reported in many studies in the literature [79,80], and were mainly dependent on the interaction between soil amendment and soil pH; hence, the mechanisms underlying the N2O emissions resulting from soil Nitrogen require further attention.
All soils amended using plant straw suppressed N2O fluxes, but the magnitude varied in accordance with the soil pH levels, with an observable, yet unsignificant change (p > 0.05) in acidic loam soil (Figure 5a). It is important to note that the pH differences among soils (Table 1) could influence the decomposing organisms in crop residues, thereby resulting in inconsistencies in N2O emissions. The seemingly positive effect of the addition of straw on N2O pulses was in line with earlier findings [42,81]. On the contrary, Lin et al. [82] found that incorporation of corn husk into yellow brown acidic soil enhanced nitrous oxide pulses relative to the control treatment. The sharp increase of N2O emissions after the addition of crop residues to alkaline soil (Figure 4a) was likely dependent on fast mineralization after the addition of mineral N fertilizer and carbon substrates, stimulating the denitrification process [32]. The greater cumulative N2O emissions observed in the acidic loam soil compared to other soils (Figure 5a) is probably related to the high content of soil mineral nitrogen substrates (Table 1), which remain an important source of soil N2O emissions [66]. Furthermore, a negative relationship was observed between nitrate and N2O emissions in acidic amended soils (Figure 8b); it is possible that either the concentration of nitrate in soils inhibited the production of N2O [83,84], or that the soils experienced changes in the genes that produce or consume N2O following amendment [85].

4.2. Effect of Biochar and Straw Input on the CH4 Fluxes

Upland soils generally uptake methane from the atmosphere through methanotrophic microorganisms that oxidize CH4 in dry soils [86]. In the present work, methane fluxes varied dynamically between the greatest release and least uptake of limited pulses (Figure 2b, Figure 3b and Figure 4b), and therefore the net CH4 emissions was detected for every single treatment (Figure 5b). This was probably due to the study being carried out during the rainfall period (Figure 1), which may have increased soil water content, reduced oxygen diffusion, and hence influenced the anaerobic environment in the packed soil columns [39]. Methane is primarily formed through the methanogenic process, which occurs under strictly oxygen-depleted environments [87], in the presence of CH4-generating archaea and appropriate soil water content [66,88,89]. Literature evidence indicated that biochar input to soil can potentially reduce CH4 emissions [26,90]. In contrast, Yu et al. [91] and Qi et al. [50] showed that charcoal input into soil may increase soil methane fluxes. Nevertheless, the findings here revealed that input of charred corn straw (biochar) into soil had no significant effect on CH4 emissions (Figure 5b), probably due to the high variability of CH4 resulting from rainfall patterns (Figure 1), therefore resulting in the lack of interaction between methanogen microorganisms and soil pH [92]. These findings are in full agreement with earlier studies reporting this effect in biochars with elevated pH of equivalent value to those in the present work [43,93,94].
Additionally, CH4 emissions exhibited a significant positive log-linear relationship with inorganic nitrogen (NH4+-N) substrates in acidic and alkaline soils following maize straw input, while in neutral soil, a weak log-linear relationship was recorded between CH4 emissions and extracted ammonium following application of crop straw (Figure 11a). On the other hand, soil DOC content mostly did not show a significant correlation with methane emissions in soils, other than a significant positive correlation observed in alkaline soil treated with crop straw (Figure 10b). This suggests that DOC is an imperative factor governing methane fluxes of alkaline soil amended with straw. This finding was congruent with a previous study by Shen et al. [44], which indicated that DOC was the vital element of methane emissions as a result of the provision of labile carbon to methanogens. The research results by Bodelier and Laanbroek [95] highlighted that CH4 release could increase due to elevated soil nitrogen content, predominantly available ammonium (NH4+-N) substrates, which could impede the activity and growth of CH4-oxidizing bacteria. Previous research has reported that ammonium substrates act as a modest inhibitor of methane oxidation, despite the fact that most methanotrophic microorganisms tend to oxidize ammonium nitrogen [96,97,98]. However, in the present study, the increase of NO3-N substrates was associated with a decrease in CH4 emissions following application of both corn straw and its biochar (Figure 11b).
Further research is needed to gain a full understanding of how the interactions among soil substrates (i.e., ammonium nitrogen, nitrate, dissolved organic carbon), different levels of natural soil pH, and nitrous oxide and methane emissions in Eutric Regosols. It is important to note that acidic soils, which are mostly distributed in the Sichuan region [99], are more prone to N2O emissions, yet the application of biochar seems not to only reduce these emissions, but also to correct the soil acidity. Therefore, the present study reports a significant decrease in N2O emissions following biochar application, as reported in previous studies [30,34,42,45,63] another important aspect is that soil pH is a crucial factor in the regulation of soil emissions, whereby acidic soil is more likely to increase N2O and CH4 emissions than neutral and alkaline soils. Moreover, there seems to be a considerable interaction effect among soil WFPS, DOC, soil temperature, and soil nitrogen with biochar and straw, in addition to natural soil pH, on these two trace gases. To this end, an interesting extension of this research could be to consider various potential factors such varying seasons and related long-term field studies, the potential effect on emissions of crops in association with soils, as well as to reproduce this study to cement the reliability of our findings.

5. Conclusions

The incorporation of biochar into acidic soil resulted in a significant decrease in N2O emissions compared to non-biochar amendment treatments. Maize-straw-derived char not only offset the N2O emissions of acidic soil, but also reduced the available nitrate content and buffer soil acidity. The response patterns of both N2O and CH4 emissions to the amendments of soils with different pH levels depended on a variety of environmental features. A positive relationship was observed between N2O emissions and WFPS, as well as with temperature, following the addition of the treatment, while a significant interaction effect was observed for CH4 with the incorporation of maize straw and available inorganic substrates into the considered soils. Our findings suggest that the conversion of straw into biochar and its application in soils is an effective technique for reducing N2O and CH4 emissions, and their effectiveness may vary with changes in soil pH. Nevertheless, it is noteworthy that the results of the present study are based on a 57-day mesocosm study in an open environment, and further field experiments are needed to evaluate the effects of biochar amendment on N2O and CH4 emissions. Biochar decreased nitrate content compared to the control, particularly in acidic soil.

Supplementary Materials

The following are available online at https://www.mdpi.com/article/10.3390/atmos12060729/s1, Table S1: Summary statistics for cumulative N2O and CH4 fluxes, Table S2. Model summary of log(N2O) as a function of WFPS in soils of different pH under different treatments, Table S3: Model summary of log (N2O) as a function of soil temperature in soils of different pH under different treatments, Table S4. Model summary of log(N2O) as a function of Soil pH in soils of different pH under different treatments, Table S5: Model summary of log(N2O) as a function of DOC in soils of different pH under different treatments, Table S6: Model summary of log (N2O) as a function of log (NH4+-N) in soils of different pH under different treatments, Table S7: Model summary of log (N2O) as a function of log (NO3-N) in soils of different pH under different treatments, Table S8: Model summary of CH4 as a function of soil WFPS in soils of different pH under different treatments, Table S9: Model summary of CH4 as a function of soil temperature in soils of different pH under different treatments, Table S10: Model summary of CH4 as a function of soil pH in soils of different pH under different treatments, Table S11: Model summary of CH4 as a function of soil DOC in soils of different pH under different treatments, Table S12: Model summary of CH4 as a function of log (NH4+-N) in soils of different pH under different treatments, Table S13: Model summary of CH4 as a function of log (NO3-N) in soils of different pH under different treatments

Author Contributions

Conceptualization, T.N., E.U. and M.Z.; Data curation, T.N.; Formal analysis, T.N. and E.U.; Funding acquisition, M.Z.; Investigation, T.N., B.Z. (Bowen Zhang) and B.H.; Methodology, T.N., M.Z., B.Z. (Bowen Zhang) and B.H.; Project administration, M.Z.; Resources, M.Z.; Software, T.N. and E.U.; Supervision, M.Z.; Visualization, E.U.; Writing—original draft, T.N. and E.U.; Writing—review & editing, M.Z., B.Z. (Bowen Zhang), B.Z. (Bo Zhu), B.H., J.d.D.N., G.N. and P.N. All authors have read and agreed to the published version of the manuscript.

Funding

This study was supported by the National Key Research and Development Program (2019YFD1100503), the Strategic Priority Research Program of the Chinese Academy of Sciences (Grant No. XDA23090403).

Institutional Review Board Statement

Not applicable.

Informed Consent Statement

Not applicable.

Data Availability Statement

Not applicable.

Acknowledgments

T.N. would like to acknowledge the study funding provided by University of Chinese Academy of Sciences “UCAS Scholarship”. We would like to take this opportunity to thank the anonymous reviewers for their time and efforts devoted to the manuscript. Their comments, criticisms and suggestions have enormously helped us improve the quality of the manuscript.

Conflicts of Interest

The authors declare no conflict of interest.

References

  1. Smith, P.; Fang, C. A warm response by soils. Nature 2010, 464, 499–500. [Google Scholar] [CrossRef]
  2. Smith, P.; Bustamante, M.; Ahammad, H.; Clark, H.; Dong, H.; Elsiddig, E.A.; Haberl, H.; Harper, R.; House, J.; Jafari, M.; et al. Agriculture, Forestry and Other Land Use (AFOLU). In Climate Change. Mitigation of Climate Change; Contribution of Working Group III to the Fifth Assessment Report of the Intergovernmental Panel on Climate Change; Edenhofer, O., Pichs-Madruga, R., Sokona, Y., Farahani, E., Kadner, S., Seyboth, K., Adler, A., Baum, I., Brunner, S., Eickemeier, P., et al., Eds.; Cambridge University Press: Cambridge, UK; New York, NY, USA, 2014. [Google Scholar]
  3. Stocker, T.F.; Qin, D.; Plattner, G.K.; Tignor, M.; Allen, S.K.; Boschung, J.; Nauels, A.; Xia, Y.; Bex, V.; Midgley, P.M. (Eds.) Climate Change 2013: The Physical Science Basis. Contribution of Working Group I to the Fifth Assessment Report of the Intergovernmental Panel on Climate Change; Cambridge University Press: Cambridge, UK; New York, NY, USA, 2013. [Google Scholar]
  4. Wuebbles, D.J.; Hayhoe, K. Atmospheric methane and global change. Earth Sci. Rev. 2002, 57, 177–210. [Google Scholar] [CrossRef]
  5. Ravishankara, A.R.; Daniel, J.S.; Portmann, R.W. Nitrous oxide (N2O): The dominant ozone-depleting substance emitted in the 21st century. Science 2009, 326, 123–125. [Google Scholar] [CrossRef] [PubMed] [Green Version]
  6. Kim, D.G.; Giltrap, D. Determining optimum nitrogen input rate and optimum yield-scaled nitrous oxide emissions: Theory, field observations, usage, and limitations. Agric. Ecosyst. Environ. 2017, 247, 371–378. [Google Scholar] [CrossRef]
  7. Mutuo, P.K.; Cadisch, G.; Albrecht, A.; Palm, C.A.; Verchot, L. Potential of agroforestry for carbon sequestration and mitigation of greenhouse gas emissions from soils in the tropics. Nutr. Cycl. Agroecosyst. 2005, 71, 43–54. [Google Scholar] [CrossRef]
  8. Sainju, U.M.; Jabro, J.D.; Stevens, W.B. Soil carbon dioxide emission and carbon content as affected by irrigation, tillage, cropping system, and nitrogen fertilization. J. Environ. Qual. 2008, 37, 98–106. [Google Scholar] [CrossRef] [Green Version]
  9. Ball, B.C.; Griffiths, B.S.; Topp, C.F.; Wheatley, R.; Walker, R.L.; Rees, R.M.; Watson, C.A.; Gordon, H.; Hallett, P.D.; McKenzie, B.M.; et al. Seasonal nitrous oxide emissions from field soils under reduced tillage, compost application or organic farming. Agric. Ecosyst. Environ. 2014, 189, 171–180. [Google Scholar] [CrossRef]
  10. Lal, R. World crop residues production and implications of its use as a biofuel. Environ. Int. 2005, 31, 575–584. [Google Scholar] [CrossRef]
  11. Bi, L.; Zhang, B.; Liu, G.; Li, Z.; Liu, Y.; Ye, C.; Yu, X.; Lai, T.; Zhang, J.; Yin, J.; et al. Long-term effects of organic amendments on the rice yields for double rice cropping systems in subtropical China. Agric. Ecosyst. Environ. 2009, 129, 534–541. [Google Scholar] [CrossRef]
  12. Xu, C.; Han, X.; Ru, S.; Cardenas, L.; Rees, R.M.; Wu, D.; Wu, W.; Meng, F. Crop straw incorporation interacts with N fertilizer on N2O emissions in an intensively cropped farmland. Geoderma 2019, 341, 129–137. [Google Scholar] [CrossRef]
  13. Liao, Y.; Wu, W.L.; Meng, F.Q.; Smith, P.; Lal, R. Increase in soil organic carbon by agricultural intensification in northern China. Biogeosciences 2015, 12, 1403–1413. [Google Scholar] [CrossRef] [Green Version]
  14. Zhao, H.; Sun, B.; Lu, F.; Zhang, G.; Wang, X.; Ouyang, Z. Straw incorporation strategy on cereal crop yield in China. Crop Sci. 2015, 55, 1773–1781. [Google Scholar] [CrossRef]
  15. Han, X.; Xu, C.; Dungait, J.A.; Bol, R.; Wang, X.; Wu, W.; Meng, F. Straw incorporation increases crop yield and soil organic carbon sequestration but varies under different natural conditions and farming practices in China: A system analysis. Biogeosciences 2018, 15, 1933–1946. [Google Scholar] [CrossRef] [Green Version]
  16. Ghimire, R.; Machado, S.; Rhinhart, K. Long-term crop residue and nitrogen management effects on soil profile carbon and nitrogen in wheat–fallow systems. Agron. J. 2015, 107, 2230–2240. [Google Scholar] [CrossRef]
  17. Meng, F.; Dungait, J.A.; Xu, X.; Bol, R.; Zhang, X.; Wu, W. Coupled incorporation of maize (Zea mays L.) straw with nitrogen fertilizer increased soil organic carbon in Fluvic Cambisol. Geoderma 2017, 304, 19–27. [Google Scholar] [CrossRef]
  18. Frimpong, K.A.; Baggs, E.M. Do combined applications of crop residues and inorganic fertilizer lower emission of N2O from soil? Soil Use Manag. 2010, 26, 412–424. [Google Scholar] [CrossRef]
  19. Feng, J.; Chen, C.; Zhang, Y.; Song, Z.; Deng, A.; Zheng, C.; Zhang, W. Impacts of cropping practices on yield-scaled greenhouse gas emissions from rice fields in China: A meta-analysis. Agric. Ecosyst. Environ. 2013, 164, 220–228. [Google Scholar] [CrossRef]
  20. Procházková, B.; Hruby, J.; Dovrtel, J.; Dostál, O. Effects of different organic amendment on winter wheat yields under long-term continuous cropping. Plant Soil Environ. 2003, 49, 433–438. [Google Scholar] [CrossRef] [Green Version]
  21. Yuan, J.H.; Xu, R.K.; Qian, W.; Wang, R.H. Comparison of the ameliorating effects on an acidic ultisol between four crop straws and their biochars. J. Soils Sediments 2011, 11, 741–750. [Google Scholar] [CrossRef]
  22. Lehmann, J. A handful of carbon. Nature 2007, 447, 143–144. [Google Scholar] [CrossRef]
  23. Cha, J.S.; Park, S.H.; Jung, S.C.; Ryu, C.; Jeon, J.K.; Shin, M.C.; Park, Y.K. Production and utilization of biochar: A review. J. Ind. Eng. Chem. 2016, 40, 1–15. [Google Scholar] [CrossRef]
  24. Ulyett, J.; Sakrabani, R.; Kibblewhite, M.; Hann, M. Impact of biochar addition on water retention, nitrification and carbon dioxide evolution from two sandy loam soils. Eur. J. Soil Sci. 2014, 65, 96–104. [Google Scholar] [CrossRef]
  25. Kalus, K.; Koziel, J.A.; Opaliński, S. A review of biochar properties and their utilization in crop agriculture and livestock production. Appl. Sci. 2019, 9, 3494. [Google Scholar] [CrossRef] [Green Version]
  26. Lehmann, J.; Rillig, M.C.; Thies, J.; Masiello, C.A.; Hockaday, W.C.; Crowley, D. Biochar effects on soil biota—A review. Soil Biol. Biochem. 2011, 43, 1812–1836. [Google Scholar] [CrossRef]
  27. Huang, R.; Liu, J.; He, X.; Xie, D.; Ni, J.; Xu, C.; Zhang, Y.; Ci, E.; Wang, Z.; Gao, M. Reduced mineral fertilization coupled with straw return in field mesocosm vegetable cultivation helps to coordinate greenhouse gas emissions and vegetable production. J. Soils Sediments 2020, 20, 1834–1845. [Google Scholar] [CrossRef]
  28. Shen, Y.; Zhu, L.; Cheng, H.; Yue, S.; Li, S. Effects of biochar application on CO2 emissions from a cultivated soil under semiarid climate conditions in Northwest China. Sustainability 2017, 9, 1482. [Google Scholar] [CrossRef] [Green Version]
  29. Nelissen, V.; Saha, B.K.; Ruysschaert, G.; Boeckx, P. Effect of different biochar and fertilizer types on N2O and NO emissions. Soil Biol. Biochem. 2014, 70, 244–255. [Google Scholar] [CrossRef]
  30. Dong, W.; Walkiewicz, A.; Bieganowski, A.; Oenema, O.; Nosalewicz, M.; He, C.; Yuming, Z.; Hu, C. Biochar promotes the reduction of N2O to N2 and concurrently suppresses the production of N2O in calcareous soil. Geoderma 2020, 362, 114091. [Google Scholar] [CrossRef]
  31. Clough, T.J.; Bertram, J.E.; Ray, J.L.; Condron, L.M.; O’Callaghan, M.; Sherlock, R.R.; Wells, N.S. Unweathered wood biochar impact on nitrous oxide emissions from a bovine-urine-amended pasture soil. Soil Sci. Soc. Am. J. 2010, 74, 852–860. [Google Scholar] [CrossRef] [Green Version]
  32. Baggs, E.M. Soil microbial sources of nitrous oxide: Recent advances in knowledge, emerging challenges and future direction. Curr. Opin. Environ. Sustain. 2011, 3, 321–327. [Google Scholar] [CrossRef]
  33. Butterbach-Bahl, K.; Baggs, E.M.; Dannenmann, M.; Kiese, R.; Zechmeister-Boltenstern, S. Nitrous oxide emissions from soils: How well do we understand the processes and their controls? Philos. Trans. R. Soc. B Biol. Sci. 2013, 368, 13. [Google Scholar] [CrossRef] [PubMed]
  34. Tarin, M.W.K.; Khaliq, M.A.; Fan, L.; Xie, D.; Tayyab, M.; Chen, L.; He, T.; Rong, J.; Zheng, Y. Divergent consequences of different biochar amendments on carbon dioxide (CO2) and nitrous oxide (N2O) emissions from the red soil. Sci. Total Environ. 2021, 754, 19. [Google Scholar] [CrossRef] [PubMed]
  35. Wu, D.; Senbayram, M.; Zang, H.; Ugurlar, F.; Aydemir, S.; Brüggemann, N.; Kuzyakov, Y.; Bol, R.; Blagodatskaya, E. Effect of biochar origin and soil pH on greenhouse gas emissions from sandy and clay soils. Appl. Soil Ecol. 2018, 129, 121–127. [Google Scholar] [CrossRef]
  36. Senbayram, M.; Saygan, E.P.; Chen, R.; Aydemir, S.; Kaya, C.; Wu, D.; Bladogatskaya, E. Effect of biochar origin and soil type on the greenhouse gas emission and the bacterial community structure in N ertilized acidic sandy and alkaline clay soil. Sci. Total Environ. 2019, 660, 69–79. [Google Scholar] [CrossRef] [PubMed]
  37. He, X.; Bao, Y.; Nan, H.; Xiong, D.; Wang, L.; Liu, Y.; Zhao, J. Tillage pedogenesis of purple soils in southwestern China. J. Mount. Sci. 2009, 6, 205–210. [Google Scholar] [CrossRef]
  38. Zhou, M.; Zhu, B.; Butterbach-Bahl, K.; Zheng, X.; Wang, T.; Wang, Y. Nitrous oxide emissions and nitrate leaching from a rain-fed wheat-maize rotation in the Sichuan Basin, China. Plant Soil 2013, 362, 149–159. [Google Scholar] [CrossRef]
  39. Zhou, M.; Zhu, B.; Brüggemann, N.; Bergmann, J.; Wang, Y.; Butterbach-Bahl, K. N2O and CH4 emissions, and NO3− leaching on a crop-yield basis from a subtropical rain-fed wheat–maize rotation in response to different types of nitrogen fertilizer. Ecosystems 2014, 17, 286–301. [Google Scholar] [CrossRef]
  40. Tao, W.; Bo, Z.; Fuhong, K. Reducing interflow nitrogen loss from hillslope cropland in a purple soil hilly region in southwestern China. Nutr. Cycl. Agroecosyst. 2012, 93, 285–295. [Google Scholar] [CrossRef]
  41. Li, Y.; Yang, Y.; Shen, F.; Tian, D.; Zeng, Y.; Yang, G.; Zhang, Y.; Deng, S. Partitioning biochar properties to elucidate their contributions to bacterial and fungal community composition of purple soil. Sci. Total Environ. 2019, 648, 1333–1341. [Google Scholar] [CrossRef] [PubMed]
  42. Huang, Y.; Zou, J.; Zheng, X.; Wang, Y.; Xu, X. Nitrous oxide emissions as influenced by amendment of plant residues with different C:N ratios. Soil Biol. Biochem. 2004, 36, 973–981. [Google Scholar] [CrossRef]
  43. Zhang, A.; Liu, Y.; Pan, G.; Hussain, Q.; Li, L.; Zheng, J.; Zhang, X. Effect of biochar amendment on maize yield and greenhouse gas emissions from a soil organic carbon poor calcareous loamy soil from Central China Plain. Plant Soil 2012, 351, 263–275. [Google Scholar] [CrossRef]
  44. Shen, J.; Tang, H.; Liu, J.; Wang, C.; Li, Y.; Ge, T.; Davey, L.J.; Wu, J. Contrasting effects of straw and straw-derived biochar amendments on greenhouse gas emissions within double rice cropping systems. Agric. Ecosyst. Environ. 2014, 188, 264–274. [Google Scholar] [CrossRef]
  45. Cui, Y.F.; Jun, M.E.N.G.; Wang, Q.X.; Zhang, W.M.; Cheng, X.Y.; Chen, W.F. Effects of straw and biochar addition on soil nitrogen, carbon, and super rice yield in cold waterlogged paddy soils of North China. J. Integr. Agric. 2017, 16, 1064–1074. [Google Scholar] [CrossRef]
  46. Lewis, J.; Sjöstrom, J. Optimizing the experimental design of soil columns in saturated and unsaturated transport experiments. J. Contam. Hydrol. 2010, 115, 1–13. [Google Scholar] [CrossRef]
  47. Zhou, M.; Zhu, B.; Butterbach-Bahl, K.; Wang, T.; Bergmann, J.; Brüggemann, N.; Wang, Z.; Li, T.; Kuang, F. Nitrate leaching, direct and indirect nitrous oxide fluxes from sloping cropland in the purple soil area, southwestern China. Environ. Pollut. 2012, 162, 361–368. [Google Scholar] [CrossRef]
  48. Parkin, T.B.; Venterea, R.T.; Follett, R.F. Chamber-based trace gas flux measurements. In Sampling Protocols; Follett, R.F., Ed.; USDA-Agricultural Research Service: Washington, DC, USA, 2010. [Google Scholar]
  49. Yuesi, W.; Yinghong, W. Quick measurement of CH4, CO2 and N2O emissions from a short-plant ecosystem. Adv. Atmos. Sci. 2003, 20, 842–844. [Google Scholar] [CrossRef]
  50. Qi, L.; Pokharel, P.; Chang, S.X.; Zhou, P.; Niu, H.; He, X.; Wang, Z.; Gao, M. Biochar application increased methane emission, soil carbon storage and net ecosystem carbon budget in a 2-year vegetable–rice rotation. Agric. Ecosyst. Environ. 2020, 292, 106831. [Google Scholar] [CrossRef]
  51. Shi, Y.; Liu, X.; Zhang, Q. Effects of combined biochar and organic fertilizer on nitrous oxide fluxes and the related nitrifier and denitrifier communities in a saline-alkali soil. Sci. Total Environ. 2019, 686, 199–211. [Google Scholar] [CrossRef]
  52. Li, H.; Han, X.; Qiao, Y.; Hou, X.; Xing, B. Carbon dioxide emission from black soil as influenced by land-use change and long-term fertilization. Commun. Soil Sci. Plant Anal. 2009, 40, 1350–1368. [Google Scholar] [CrossRef]
  53. Yang, L.; Cai, Z. The effect of growing soybean (Glycine max. L.) on N2O emission from soil. Soil Biol. Biochem. 2005, 37, 1205–1209. [Google Scholar] [CrossRef]
  54. Wang, Y.Q.; Bai, R.; Di, H.J.; Mo, L.Y.; Han, B.; Zhang, L.M.; He, J.Z. Differentiated mechanisms of biochar mitigating straw-induced greenhouse gas emissions in two contrasting paddy soils. Front. Microbiol. 2018, 9, 2566. [Google Scholar] [CrossRef] [Green Version]
  55. Tan, K.H. Measurement of field capacity water. In Soil Sampling, Preparation, and Analysis; Marcel Dekker, Inc.: New York, NY, USA, 1996; pp. 67–68. [Google Scholar]
  56. Kachurina, O.M.; Zhang, H.; Raun, W.R.; Krenzer, E.G. Simultaneous determination of soil aluminum, ammonium-and nitrate-nitrogen using 1M potassium chloride extraction. Commun. Soil Sci. Plant Anal. 2000, 31, 893–903. [Google Scholar] [CrossRef]
  57. Team, R. Rstudio: Integrated Development for R. Rstudio. Rstudio Team (2020). Rstudio: Integrated Development for R. Rstudio: Boston, MA, USA, 2020. PBC. Available online: http://www.rstudio.com/ (accessed on 1 December 2020).
  58. Wickham, H. ggplot2: Elegant Graphics for Data Analysis; Springer: New York, NY, USA, 2016. [Google Scholar]
  59. Kassambara, A. ggpubr: ‘ggplot2′ Based Publication Ready Plots (R Package Version 0.4.0) [Computer Software]. Available online: https://CRAN.R-project.org/package=ggpubr (accessed on 12 September 2020).
  60. Dai, Z.; Wang, Y.; Muhammad, N.; Yu, X.; Xiao, K.; Meng, J.; Liu, X.; Xu, J.; Brookes, P.C. The effects and mechanisms of soil acidity changes, following incorporation of biochars in three soils differing in initial pH. Soil Sci. Soc. Am. J. 2014, 78, 1606–1614. [Google Scholar] [CrossRef]
  61. Pujol Pereira, E.I.; Léchot, J.; Feola Conz, R.; da Silva Cardoso, A.; Six, J. Biochar enhances nitrous oxide reduction in acidic but not in near-neutral pH soil. Soil Syst. 2019, 3, 69. [Google Scholar] [CrossRef] [Green Version]
  62. Wang, C.; Shen, J.; Liu, J.; Qin, H.; Yuan, Q.; Fan, F.; Wu, J. Microbial mechanisms in the reduction of CH4 emission from double rice cropping system amended by biochar: A four-year study. Soil Biol. Biochem. 2019, 135, 251–263. [Google Scholar] [CrossRef]
  63. Wang, H.; Yi, H.; Zhang, X.; Su, W.; Li, X.; Zhang, Y.; Gao, X. Biochar Mitigates Greenhouse Gas Emissions from an Acidic Tea Soil. Pol. J. Environ. Stud. 2020, 29, 323–330. [Google Scholar] [CrossRef]
  64. Case, S.D.; McNamara, N.P.; Reay, D.S.; Whitaker, J. The effect of biochar addition on N2O and CO2 emissions from a sandy loam soil–the role of soil aeration. Soil Biol. Biochem. 2012, 51, 125–134. [Google Scholar] [CrossRef]
  65. Yanai, Y.; Toyota, K.; Okazaki, M. Effects of charcoal addition on N2O emissions from soil resulting from rewetting air-dried soil in short-term laboratory experiments. Soil Sci. Plant Nutr. 2007, 53, 181–188. [Google Scholar] [CrossRef]
  66. Christiansen, J.R.; Levy-Booth, D.; Prescott, C.E.; Grayston, S.J. Different soil moisture control of net methane oxidation and production in organic upland and wet forest soils of the pacific coastal rainforest in Canada. Can. J. For. Res. 2017, 47, 628–635. [Google Scholar] [CrossRef]
  67. Chen, W.; Zheng, X.; Chen, Q.; Wolf, B.; Butterbach-Bahl, K.; Brüggemann, N.; Lin, S. Effects of increasing precipitation and nitrogen deposition on CH4 and N2O fluxes and ecosystem respiration in a degraded steppe in Inner Mongolia, China. Geoderma 2013, 192, 335–340. [Google Scholar] [CrossRef]
  68. Liu, Y.; Tang, H.; Muhammad, A.; Huang, G. Emission mechanism and reduction countermeasures of agricultural greenhouse gases—A review. Greenh. Gases Sci. Technol. 2019, 9, 160–174. [Google Scholar] [CrossRef]
  69. Cayuela, M.L.; Sánchez-Monedero, M.A.; Roig, A.; Hanley, K.; Enders, A.; Lehmann, J. Biochar and denitrification in soils: When, how much and why does biochar reduce N2O emissions? Sci. Rep. 2013, 3, 1–7. [Google Scholar] [CrossRef] [Green Version]
  70. Cayuela, M.L.; Van Zwieten, L.; Singh, B.P.; Jeffery, S.; Roig, A.; Sánchez-Monedero, M.A. Biochar’s role in mitigating soil nitrous oxide emissions: A review and meta-analysis. Agric. Ecosyst. Environ. 2014, 191, 5–16. [Google Scholar] [CrossRef]
  71. Van Zwieten, L.; Kimber, S.; Morris, S.; Downie, A.; Berger, E.; Rust, J.; Scheer, C. Influence of biochars on flux of N2O and CO2 from Ferrosol. Soil Res. 2010, 48, 555–568. [Google Scholar] [CrossRef]
  72. Prendergast-Miller, M.T.; Duvall, M.; Sohi, S.P. Localisation of nitrate in the rhizosphere of biochar-amended soils. Soil Biol. Biochem. 2011, 43, 2243–2246. [Google Scholar] [CrossRef]
  73. Williams, E.J.; Hutchinson, G.L.; Fehsenfeld, F.C. NOx and N2O emissions from soil. Glob. Biogeochem Cycles 1992, 6, 351–388. [Google Scholar] [CrossRef]
  74. Luo, G.J.; Kiese, R.; Wolf, B.; Butterbach-Bahl, K. Effects of soil temperature and moisture on methane uptake and nitrous oxide emissions across three different ecosystem types. Biogeosciences 2013, 10, 3205–3219. [Google Scholar] [CrossRef] [Green Version]
  75. Angst, T.E.; Patterson, C.J.; Reay, D.S.; Anderson, P.; Peshkur, T.A.; Sohi, S.P. Biochar diminishes nitrous oxide and nitrate leaching from diverse nutrient sources. J. Environ. Qual. 2013, 42, 672–682. [Google Scholar] [CrossRef]
  76. Verhoeven, E.; Six, J. Biochar does not mitigate field-scale N2O emissions in a Northern California vineyard: An assessment across two years. Agric. Ecosyst. Environ. 2014, 191, 27–38. [Google Scholar] [CrossRef]
  77. Yang, F.; Lee, X.; Theng, B.K.; Wang, B.; Cheng, J.; Wang, Q. Effect of biochar addition on short-term N2O and CO2 emissions during repeated drying and wetting of an anthropogenic alluvial soil. Environ. Geochem. Health 2017, 39, 635–647. [Google Scholar] [CrossRef]
  78. Yoo, G.; Kim, Y.J.; Lee, Y.O.; Ding, W. Investigation of greenhouse gas emissions from the soil amended with rice straw biochar. KSCE J. Civil Eng. 2016, 20, 2197–2207. [Google Scholar] [CrossRef]
  79. Li, S.; Song, L.; Jin, Y.; Liu, S.; Shen, Q.; Zou, J. Linking N2O emission from biochar-amended composting process to the abundance of denitrify (nirK and nosZ) bacteria community. AMB Express 2016, 6, 1–9. [Google Scholar] [CrossRef] [Green Version]
  80. Sun, X.; Ding, J.; Jiang, Z.; Xu, J. Biochar improved rice yield and mitigated CH4 and N2O emissions from paddy field under controlled irrigation in the Taihu Lake Region of China. Atmos. Environ. 2019, 200, 69–77. [Google Scholar]
  81. Wu, L.; Hu, R.; Tang, S.; Shaaban, M.; Zhang, W.; Shen, H.; Xu, M. Nitrous oxide emissions in response to straw incorporation is regulated by historical fertilization. Environ. Pollut. 2020, 266, 115292. [Google Scholar] [CrossRef]
  82. Lin, S.; Iqbal, J.; Hu, R.; Shaaban, M.; Cai, J.; Chen, X. Nitrous oxide emissions from yellow brown soil as affected by incorporation of crop residues with different carbon-to-nitrogen ratios: A case study in central China. Arch. Environ. Contam. Toxicol. 2013, 65, 183–192. [Google Scholar] [CrossRef]
  83. Ellis, S.; Dendooven, L.; Goulding, K.W.T. Quantitative assessment of soil nitrate disappearance and N2O evolution during denitrification: Nitrate disappearance during denitrification. Soil Biol. Biochem. 1996, 28, 589–595. [Google Scholar] [CrossRef]
  84. Luo, J.; White, R.E.; Roger, B.P.; Tillman, R.W. Measuring denitrification activity in soils under pasture: Optimizing conditions for the short-term denitrification enzyme assay and effect of soil storage on denitrification activity. Soil Biol. Biochem. 1996, 28, 409–417. [Google Scholar] [CrossRef]
  85. Wang, C.; Lu, H.; Dong, D.; Deng, H.; Strong, P.J.; Wang, H.; Wu, W. Insight into the effects of biochar on manure composting: Evidence supporting the relationship between N2O emission and denitrifying community. Environ. Sci. Technol. 2013, 47, 7341–7349. [Google Scholar] [CrossRef]
  86. Mosier, A.R.; Halvorson, A.D.; Reule, C.A.; Liu, X.J. Net global warming potential and greenhouse gas intensity in irrigated cropping systems in northeastern Colorado. J. Environ. Qual. 2006, 35, 1584–1598. [Google Scholar] [CrossRef] [Green Version]
  87. Scheer, C.; Grace, P.R.; Rowlings, D.W.; Kimber, S.; Van Zwieten, L. Effect of biochar amendment on the soil-atmosphere exchange of greenhouse gases from an intensive subtropical pasture in northern New South Wales, Australia. Plant Soil 2011, 345, 47–58. [Google Scholar] [CrossRef] [Green Version]
  88. Askaer, L.; Elberling, B.; Friborg, T.; Jørgensen, C.J.; Hansen, B.U. Plant-mediated CH4 transport and C gas dynamics quantified in-situ in a Phalaris arundinacea-dominant wetland. Plant Soil 2011, 343, 287–301. [Google Scholar] [CrossRef]
  89. Hall, S.J.; McDowell, W.H.; Silver, W.L. When wet gets wetter: Decoupling of moisture, redox biogeochemistry, and greenhouse gas fluxes in a humid tropical forest soil. Ecosystems 2013, 16, 576–589. [Google Scholar] [CrossRef] [Green Version]
  90. Zhang, A.; Cui, L.; Pan, G.; Li, L.; Hussain, Q.; Zhang, X.; Zheng, X.; Crowley, D. Effect of biochar amendment on yield and methane and nitrous oxide emissions from a rice paddy from Tai Lake plain, China. Agric. Ecosyst. Environ. 2010, 139, 469–475. [Google Scholar] [CrossRef]
  91. Yu, L.; Tang, J.; Zhang, R.; Wu, Q.; Gong, M. Effects of biochar application on soil methane emission at different soil moisture levels. Biol. Fertil. Soils 2013, 49, 119–128. [Google Scholar] [CrossRef]
  92. Dalal, R.C.; Allen, D.E.; Livesley, S.J.; Richards, G. Magnitude and biophysical regulators of methane emission and consumption in the Australian agricultural, forest, and submerged landscapes: A review. Plant Soil 2008, 309, 43–76. [Google Scholar] [CrossRef]
  93. Xie, Z.; Xu, Y.; Liu, G.; Liu, Q.; Zhu, J.; Tu, C.; Amonette, J.E.; Cadisch, J.W.Y.; Hu, S. Impact of biochar application on nitrogen nutrition of rice, greenhouse-gas emissions and soil organic carbon dynamics in two paddy soils of China. Plant Soil 2013, 370, 527–540. [Google Scholar] [CrossRef]
  94. Aguilar-Chávez, Á.; Díaz-Rojas, M.; del Rosario Cárdenas-Aquino, M.; Dendooven, L.; Luna-Guido, M. Greenhouse gas emissions from a wastewater sludge-amended soil cultivated with wheat (Triticum spp. L.) as affected by different application rates of charcoal. Soil Biol. Biochem. 2012, 52, 90–95. [Google Scholar] [CrossRef]
  95. Bodelier, P.L.; Laanbroek, H.J. Nitrogen as a regulatory factor of methane oxidation in soils and sediments. FEMS Microbiol. Ecol. 2004, 47, 265–277. [Google Scholar] [CrossRef]
  96. Yang, N.; Lü, F.; He, P.; Shao, L. Response of methanotrophs and methane oxidation on ammonium application in landfill soils. Appl. Microbiol. Biotechnol. 2011, 92, 1073–1082. [Google Scholar] [CrossRef]
  97. Sun, B.F.; Hong, Z.H.A.O.; Lü, Y.Z.; Fei, L.U.; Wang, X.K. The effects of nitrogen fertilizer application on methane and nitrous oxide emission/uptake in Chinese croplands. J. Integr. Agric. 2016, 15, 440–450. [Google Scholar] [CrossRef] [Green Version]
  98. Schnecker, J.; Bowles, T.; Hobbie, E.A.; Smith, R.G.; Grandy, A.S. Substrate quality and concentration control decomposition and microbial strategies in a model soil system. Biogeochemistry 2019, 144, 47–59. [Google Scholar] [CrossRef] [Green Version]
  99. China Statistical Yearbook. 2019. Available online: http://www.stats.gov.cn/tjsj/ndsj/2019/indexeh.htm (accessed on 22 February 2021).
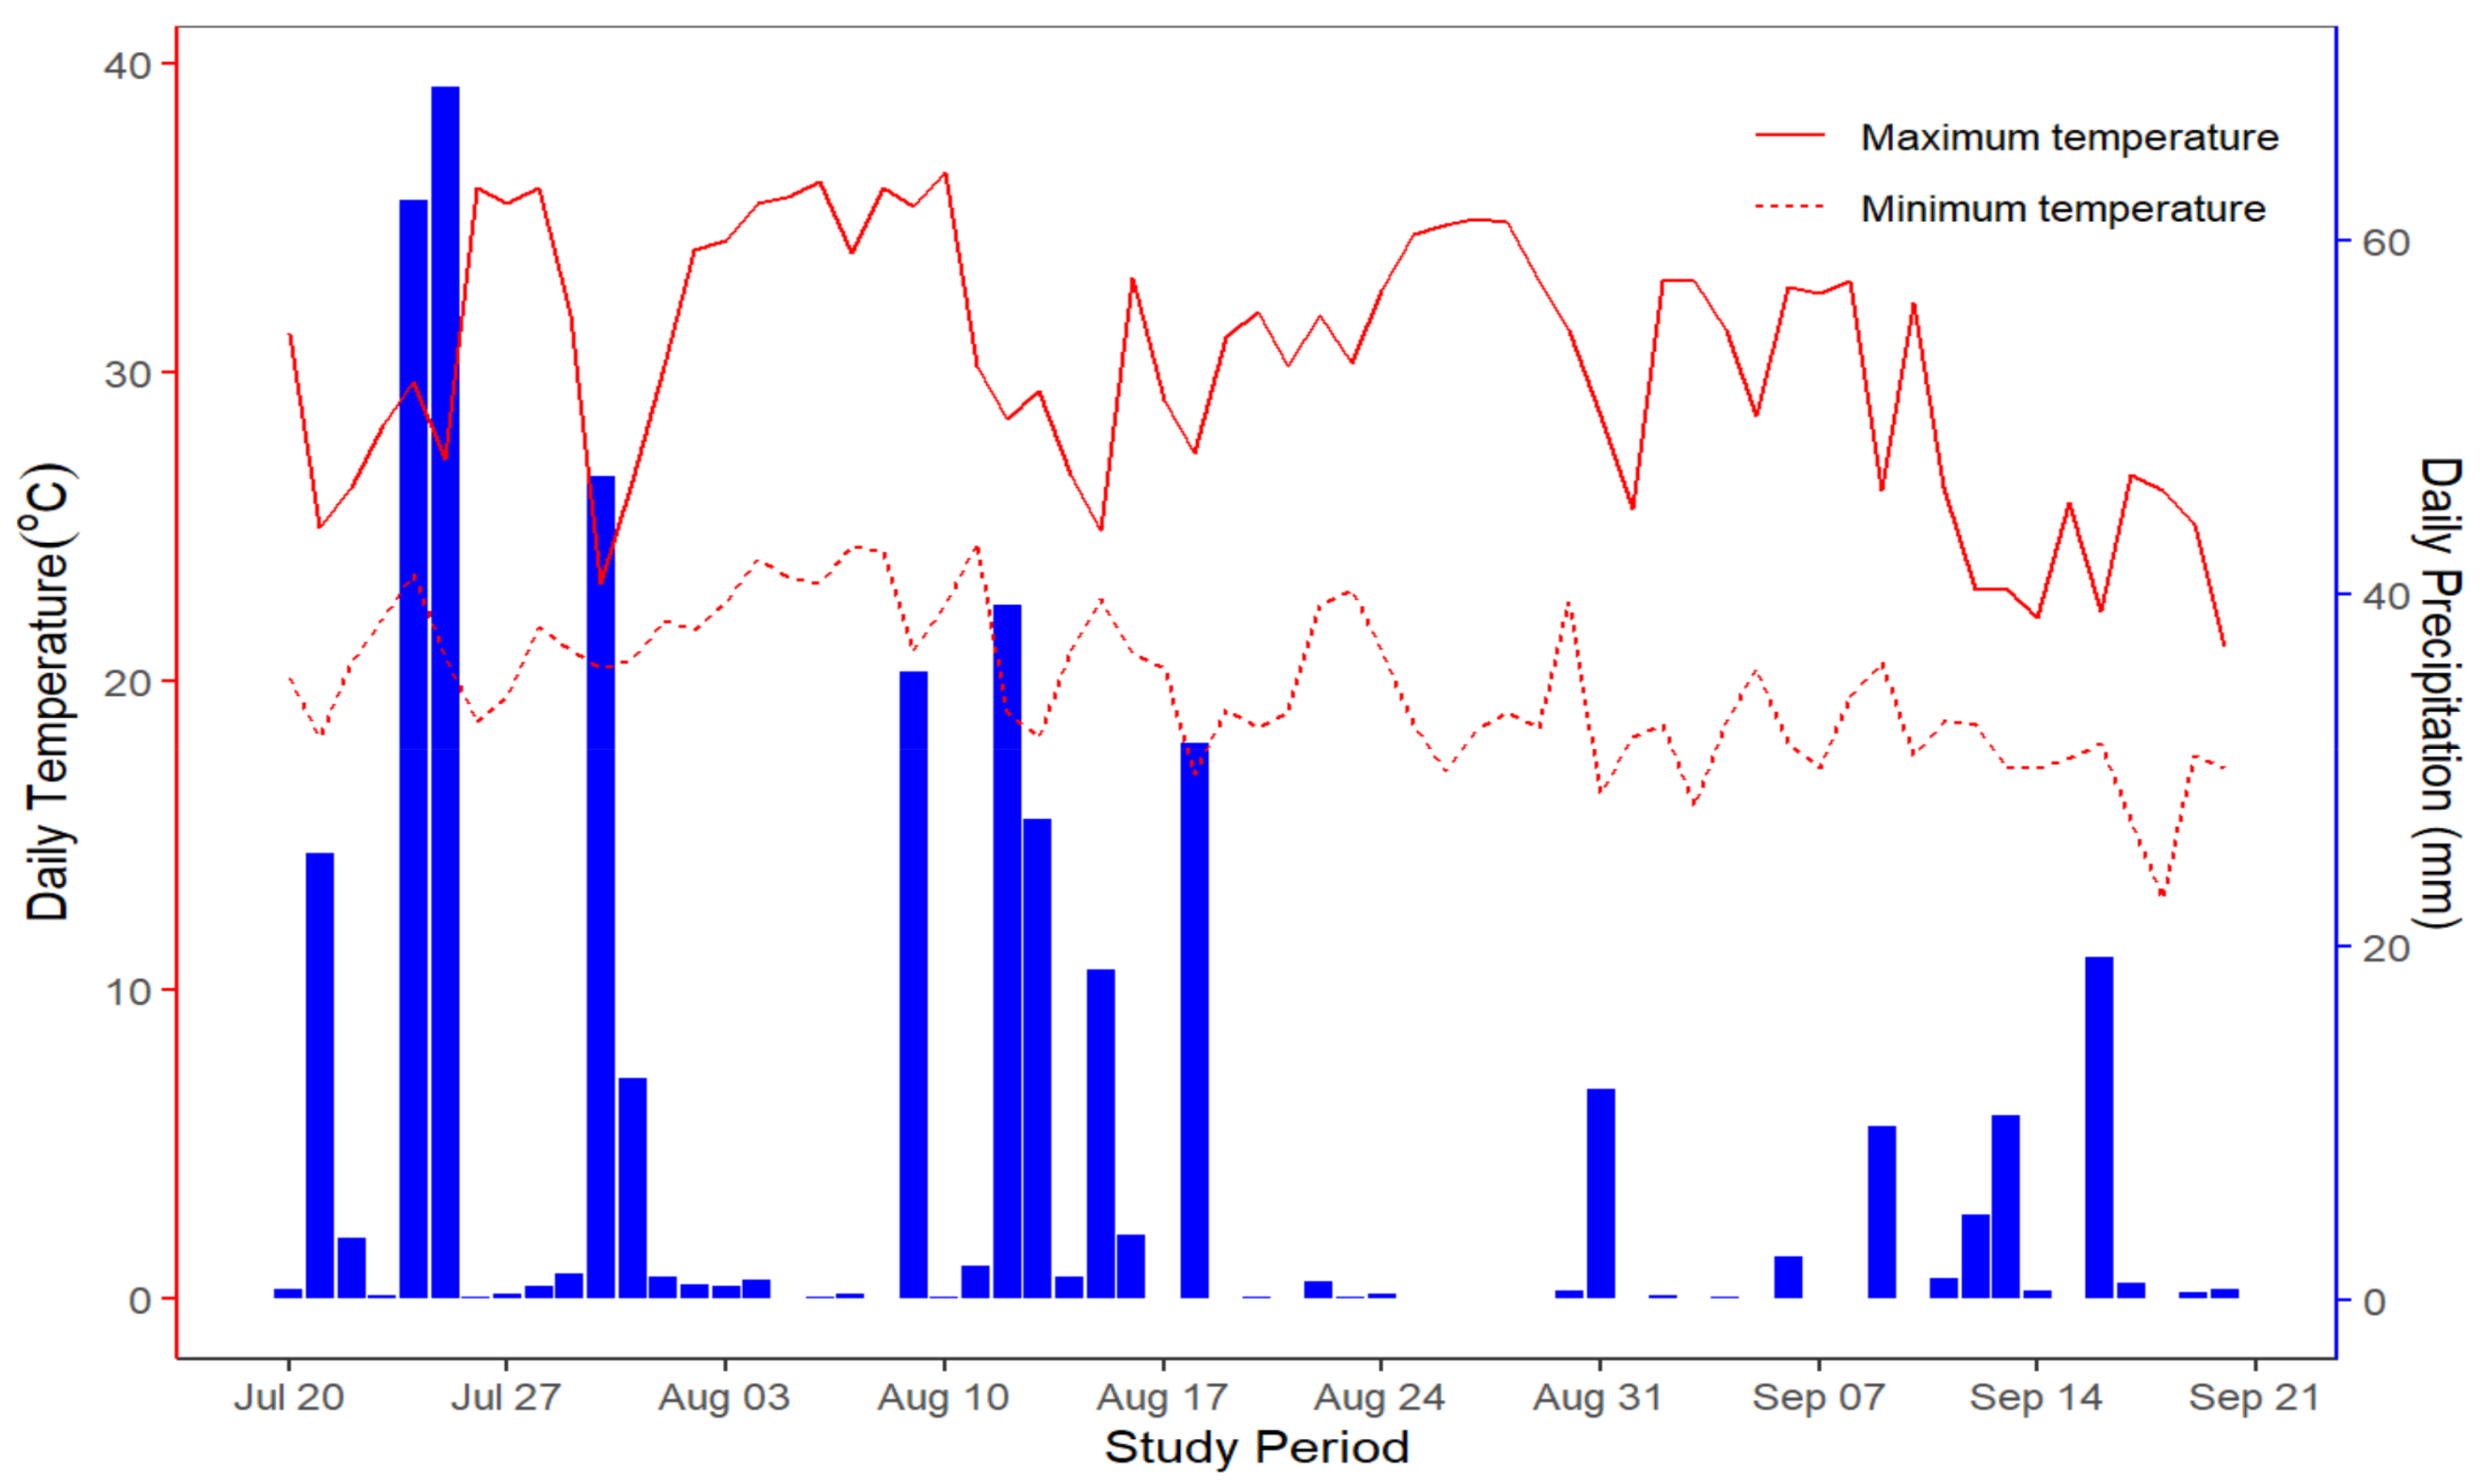
Figure 1. Variation in daily rainfall (mm) and daily maximum and minimum air temperature (°C) during the study period in Yanting, Sichuan, China in 2020.
Atmosphere 12 00729 g001
Figure 2. Temporal dynamics of the (a) N2O and (b) CH4 emissions from arable acidic soil following application of maize straw and corn biochar throughout the entire sampling time (July 2020–September 2020) of the outdoor mesocosm experiment. The vertical bars indicate the standard error of the mean (n = 3).
Atmosphere 12 00729 g002
Figure 3. Temporal variations (July 2020–September 2020) of the (a) N2O and (b) CH4 emissions from neutral soil after addition of maize straw and corn biochar in an outdoor packed soil column. The perpendicular lines indicate the standard error of the mean (n = 3).
Atmosphere 12 00729 g003
Figure 4. Soil (a) N2O and (b) CH4 emissions between 20 July 2020 and 16 September 2020 in alkaline soil amended with maize straw (6 t ha−1) and corn biochar (20 t ha−1) in the packed soil column study. The vertical bars denote the standard error of the mean (n = 3).
Atmosphere 12 00729 g004
Figure 5. Cumulative emissions of (a) N2O and (b) CH4 for soils with different pH in response to biochar and straw. The error bars indicate the standard error of the mean, and means that do not share any letter among a, b and c in (a) are significant different at the 5% level of significance, adjusted by the Tukey test. The segment above the error bars in (b) indicates that the study was not precise enough to see any significant difference among the sample means; hence, the data were not surprising, considering the null hypothesis is true.
Atmosphere 12 00729 g005
Figure 6. The relationships between N2O emissions and (a) soil water-filled pore space and (b) soil temperature in soils with different pH treated with biochar and straw, averaged over 19 days. Note: (*) shows that the strength of the relationship is significant at p-value ≤ 0.05, (**) shows that the strength of the relationship is significant at p-value ≤ 0.01. The axes of the different natural soil pH values are on different scales, and the log designation refers to natural logarithms.
Atmosphere 12 00729 g006
Figure 7. The relationships of N2O emissions and (a) soil pH and (b) DOC under different soil pH treated with biochar and straw averaged over 19 days. Note: (**) shows that the strength of the relationship is significant at p-value ≤ 0.01, and (***) shows that the strength of the relationship is significant at p-value ≤ 0.001. The axes of the different natural soil pH values are on different scales, and the log designation refers to natural logarithms.
Atmosphere 12 00729 g007
Figure 8. The relationships between N2O emissions and (a) soil NH4+-N and (b) soil NO3-N under soils with different pH treated with biochar and straw averaged over 19 days. Note: (*) shows that the strength of the relationship is significant at p-value ≤ 0.05, and (**) shows that the strength of relationship is significant at p-value ≤ 0.01. The axes of the different natural soil pH values are on different scales, and the log designation refers to natural logarithms.
Atmosphere 12 00729 g008
Figure 9. The relationships between CH4 emissions and (a) soil WFPS and (b) soil temperature in soils with different pH treated with biochar and straw averaged over 18 days. Note: (*) shows that the strength of relationship is significant at p-value ≤ 0.05, and (**) shows that the strength of relationship is significant at p-value ≤ 0.01. The axes of different natural soil pH are on different scales.
Atmosphere 12 00729 g009
Figure 10. The relationships between CH4 emissions and (a) soil pH and (b) soil dissolved organic carbon in soils of different pH treated with biochar and straw averaged over 18 days. Note: (*) shows that the strength of the relationship is significant at p-value ≤ 0.05. The axes of the different natural soil pH values are on different scales.
Atmosphere 12 00729 g010
Figure 11. The relationships between CH4 emissions and (a) soil ammonium-N and (b) soil nitrate-N in soils of different pH treated with biochar and straw averaged over 18 days. Note: (*) shows that the strength of relationship is significant at p-value ≤ 0.05, (**) shows that the strength of relationship is significant at p-value ≤ 0.01, and (***) shows that the strength of relationship is significant at p-value ≤ 0.001. The axes of different natural soil pH values are on different scales, and the log designation refers to natural logarithms.
Atmosphere 12 00729 g011
Table 1. The initial physical and chemical characteristics of soils, maize straw, and corn biochar.
ParameterspHClay
(%)
Silt
(%)
Sand
(%)
Total C
(g kg−1)
Total N
(g kg−1)
NH4+-N
(mg N l−1)
NO3-N
(mg N l−1)
DOC
(mg C l−1)
Acidic soil4.6924.09 ± 1.0743.85 ± 0.8632.06 ± 1.937.12 ± 0.030.88 ± 0.015.05 ± 0.088.46 ± 1.2313.32 ± 0.06
Neutral soil7.128.37 ± 0.2138.72 ± 0.8952.91 ± 0.6911.23 ± 0.061.05 ± 0.011.38 ± 0.545.87 ± 1.1612.49 ± 2.28
Alkaline soil8.3230.82 ± 0.3151.76 ± 1.8717.42 ± 2.1314.84 ± 0.020.91 ± 0.010.38 ± 0.0511.14 ± 0.017.29 ± 3.18
Biochar10.11N/AN/AN/A420.32 ± 5.4912.73 ± 0.66N/AN/AN/A
Straw6.28N/AN/AN/A315.25 ± 2.0511.2 ± 1.32N/AN/AN/A
Note: N/A: not determined, C: carbon, N: nitrogen.
Table 2. Effect of treatments on soil physiochemical parameters on day 57 of the packed soil column experiment (mean ± std error).
Soil Types
Acidic SoilNeutral SoilAlkaline Soil
TreatmentTreatmentTreatment
Soil PropertiesControlBiocharStrawControlBiocharStrawControlBiocharStraw
Soil pH5.15 ± 0.087 cd5.39 ± 0.071 c4.90 ± 0.038 d7.41 ± 0.074 b7.42 ± 0.109 b7.27 ± 0.142 b8.14 ± 0.104 a8.02 ± 0.027 a8.07 ± 0.029 a
Soil NH4-N3.85 ± 1.960.415 ± 0.1832.23 ± 1.140.88 ± 0.280.61 ± 0.161.06 ± 0.291.05 ± 0.321.24 ± 0.470.81 ± 0.11
Soil NO3-N12.7 ± 1.76 b5.21 ± 2.88 ab7.93 ± 2.28 ab3.54 ± 2.32 ab1.14 ± 0.59 a2.61 ± 0.98 ab4.24 ± 2.72 ab5.02 ± 2.49 ab3.14 ± 1.71 ab
Soil DOC17.4 ± 10.624.3 ± 11.518.4 ± 6.114.5 ± 6.718.0 ± 8.614.9 ± 4.919.4 ± 9.024.4 ± 8.116.4 ± 5.5
Soil WFPS50.5 ± 4.26 b44.7 ± 5.02 ab49.4 ± 3.82 ab34.5 ± 1.18 ab33.7 ± 2.00 ab30.9 ± 3.48 a40.1 ± 1.42 ab45.6 ± 1.65 ab34.8 ± 7.78 ab
Note: Means values that do not share any lowercase letters (i.e., a, b, c, d) in a row are significantly different at a 5% level of significance adjusted by Tukey test, while rows of means without letters show that there were no extreme values observed among the sample means, suggesting that the null hypothesis is true.
Publisher’s Note: MDPI stays neutral with regard to jurisdictional claims in published maps and institutional affiliations.