Abstract
The paper deals with issues related to analyzing the spread of air pollution and pollutants in large urban agglomerations, specifically, the search for causality between meteorological conditions and the concentrations of particular substances. The pollutants SO2 and PM10 were selected for analysis, which, in addition to NOx, CO, CO2 and PM2.5, contribute to smog, especially during the heating seasons. This analysis is particularly important because Polish environmental standards are more lenient than those in western EU states. Industrial activity, transport and heating systems based on coal-burning are still a big problem in Poland, and each year their gaseous and particulate emissions exceed air-quality limits. This paper presents a statistical analysis of data recorded at the air-quality monitoring station on Kossuth Street in Katowice concerning the heating seasons from 2013–2016. The verification of proposed parabolic models containing concentrations from previous time periods and statistically significant meteorological conditions was conducted for individual heating seasons as well for the whole set of data, which included the influence of wind speed and temperature. The models obtained proved that the selected form of a model is statistically significant, and its use may produce satisfactory forecast results and permit various environmental applications. The specified model might be used both for forecasting (verification and possibly updating coefficients to increase forecast accuracy) and analyzing the factors influencing pollution values. Such statistical analysis may be helpful in assessing the impact of measures adopted to reduce air pollution, particularly in large Polish cities.
1. Introduction
Air pollution is one of the world’s most noticeable consequences of urbanization and transportation development. Poland, as one of the main coal producers because of the predominance of outdated home coal-burning furnaces, exceeds acceptable concentrations of particulate air pollutants [1,2]. In addition, the burning of waste in household furnaces, creates low-emissions of carcinogenic pollutants, i.e., benzo[a]pyrene and PM2.5 (particulate matter ≤2.5 µm in diameter). A major reason for this level of pollution is the level of energy poverty, which is unfortunately high compared to that of western EU countries. Exceedence occurs particularly during the heating season, i.e., between October and March when smog from increased emissions most often occurs despite Poland’s huge expenditures on environmental protection over the last years, especially after it entered the EU. Levels of particulate pollutants still exceed the admissible values determined by the appropriate legal regulators, sometimes by several times: in this case, The Environmental Protection Act of 27 April 2001. In Poland, State Environmental Monitoring covers the whole country, with particular emphasis on places where the acceptable level of pollution is often exceeded. Levels of individual particulates in the air are assessed based on continuous automatic or manual measurement carried out in accordance with accepted reference methods at fixed measurement points that are the most suitable for the selected area. The applicable regulation in this respect is the Regulation of the Minister of Environment of 13 September 2012 on the evaluation of levels of substances in ambient air.
Over the last years, one might have observed increased society activity concerning air pollution, especially in highly industrialized, densely populated regions. A good example of such social action is the establishment of Polish Smog Alert, an initiative associating movements concerned about poor air quality in Poland. High public pressure focused on environmental pollution has resulted in increased involvement of local authorities, especially in areas with high air pollution, but efforts to combat smog still have to increase.
In our country, smog during the heating season is quite frequent in areas such as Upper Silesia, the cities of Kraków or Skawina in Małopolskie Province, as well as in Warsaw and Łódź. The harmfulness of air pollutants to humans is well known and has been the subject of many scientific publications that describe the consequences of polluted inhaling such air over a long time.
According to polskialarmsmogowy.pl [3], a social movement in Rybnik that brings together activists fighting for the improvement of air quality, the number of days in 2017 when the limit values were exceeded was 53. For Kraków, it was 41. In 2019, the cities that had the most days exceeding air pollution limit were Pszczyna with 106 and Rybnik with 89. Krakow, as well as Rybnik, can be counted among the cities where local authorities have taken intensive action to reduce air pollution, an example of which might be a total ban on burning coal and wood in households in Kraków that has been in force since September 2019. The Polish Smog Alert activists emphasize that the list includes only cities where measurement stations of State Environmental Monitoring are located, so the absence of other cities from the list does not mean that smog is not a problem there. Some of the most polluted cities in 2020 include health and tourist resorts, such as Nowy Targ or Sucha Beskidzka [3], which have been the subject of scientific analysis [4]. The overall situation concerning smog was researched, among others, in the paper [5].
The proposed statistical analysis of the models and their coefficients and correlation to parameters such as temperature or wind speed permits the evaluation of changes concerning air pollution values in light of actions taken and independent natural factors.
Despite state initiatives to change the existing situation, there will probably still be periods when permissible levels are exceeded. Actions aimed at eliminating old coal-burning boilers from the market or limiting their marketing through legal regulations have so far failed to produce visible, measurable effects. In 2018, the government launched the “Clean Air” program, which, as the government announced, involves the destruction of three million old boilers, the so-called “black-smoke-belching stoves”, and spending 103 billion PLN on home insulation and boiler replacement over 10 years. However, improved air quality depends on its implementation and will be visible after several years.
Those most vulnerable to the risks associated with inhaling polluted air are the elderly, children and people with diagnosed respiratory, circulatory and nervous system disorders. Constant exposure to pollution might lead to hospitalization and in some cases death.
In the case of smog, preferably even before its appearance, it is reasonable to inform the public through the media about the hazards connected with it. Stochastic models estimating pollution concentrations in a selected area can also be used for this purpose. The authors of this work highlighted this aspect of the issue in previous publications [6,7,8], proving (with the assumed significance level α = 0.05) the validity of applying a specific model for individual atmospheric conditions in the early warning system.
Therefore, from the prevention and warning point of view, it is important to develop the best possible statistical models to predict concentrations of gaseous pollutants (CO, CO2, SO2, NOx) or particulate pollutants (PM2.5 and PM10). In statistical models, the variables are usually the concentrations of selected pollutants from the previous day (i.e., “background” concentrations) and meteorological conditions, mainly temperature, wind strength and direction, air humidity, and precipitation. It is worth noting that air pollutant concentrations are usually stochastic. Therefore, in the authors’ previous works, apparent variables were introduced in addition to the variables representing meteorological conditions and concentrations from previous days, [9,10]. However, these works were only concerned with SO2 concentrations, whereas the present work takes into account concentrations of inhalable PM2.5 and PM10 dust, which are dangerous to human health and monitored by Provincial Environmental Protection Inspectorate stations.
The growth of dust concentrations, in particular of PM2.5, has also a big influence on the creation of smog. The elaborated models for dust permitted the verification and analysis of accepted model forms and compared their coefficients with heating seasons.
2. Models of Air Pollution Propagation
Generally, air pollution models can be divided according to the diagram in Figure 1.
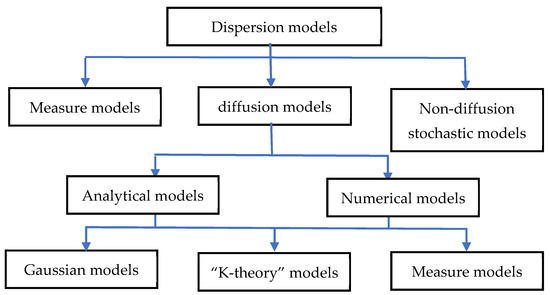
Figure 1.
Division of dispersion models.
Air pollution concentration models have been the subject of much research, the results of which have been implemented in urban areas with satisfying results. Among these works, are the Stockholm model, presented in [11], and the Vienna model [12] Among others, Hysenaj used dispersive models and their applications to predict air pollution in Tirana [13] to fulfill European emission norms. Markiewicz [14,15] discussed the methods used in air pollution dispersive models, among which the Eulerian, Lagrangian and Gaussian were distinguished. The division of these basic models is presented in Table 1 and Table 2.

Table 1.
Classification of air pollution dispersion models based on mathematical criteria [14].

Table 2.
Relationships between meteorological methods to determine meteorological data and air pollution dispersion models [14].
Furthermore, the methodology of applying dispersive models for the wet deposition of atmospheric pollutants was presented [16]. Such models include the Sulphur Transport and Emission Model (STEM II) [17], Regional Atmospheric Deposition Model RADM [18] and Atmospheric Deposition Oxidant Model ADOM [19]. Furthermore, the application of the Eulerian model for Nordic winter conditions was presented in [20]. Sulfur dioxide modeling of the industrial influence on air quality was also a main issue in [21,22]. Using Geographic Information System (GIS) to control the transportation air pollutants, including the application of previously developed models, was presented for Serbia in [23], for Bulgaria in [24] and for Egypt in [25]. Various improvements to the proposed dispersion models were discussed in many of the works. A review of them is presented in [26,27,28,29]. The introduction of a fuzzy synthetic evaluation model was done in [30]. Applications of the numerical simulation of pollution dispersion were conducted, for example, in [31,32], and various distribution functions were used for this in [33] and multiscale approaches were shown in [34,35]. Air pollution as a consequence of smog in big cities was discussed and modeled in [36,37,38,39,40]. The broad impact of different pollutants on the health of living organisms in different places of the world was discussed in [41,42,43,44,45,46]. The wide spectrum of modeling was discussed in [47], taking into consideration aspects of chemistry and meteorology as well different timescales with seasonal variation. The effect of the COVID-19 epidemic in the context of air pollution was analyzed in [48].
The station selected for analysis is on Kossuth Street in Katowice, located in the highly urbanized the Upper Silesian Industrial Region.
3. Correlation Analysis and Data Analysis
3.1. Information about Data
Data used to determine forecasting models for SO2 and PM10 concentrations originated from the automatic monitoring station located on Kossuth Street in Katowice. Measurements of pollutant concentrations and meteorological data are a result of increased interest in the environment and National Environment Monitoring (NEM), created at the beginning of the 1990s. NEM was founded to ensure reliable information about the environment following passage of the Inspection of Environmental Protection Act on 10 July 1991 [49]. One of the aspects of its activity was to create automatic monitoring stations for various sorts of pollutants. A system of such stations is found throughout the country, and 16 of them are located in the Silesian Voivodship (province). Furthermore, telemetric stations measure transport pollutants, and there is access to the mobile emission ambulance. Manual measurements cover SO2 and NO2 concentrations at 22 sites. The majority of the tasks of NEM after 2000 were related to integrating Poland into European Union structures and to adapt to European environmental management. The measuring station provides automatic hourly data measurements of pollutants: (PM10, PM2.5, SO2) and meteorological features (wind direction, temperature, wind speed and humidity).
The map presented in Figure 2 shows the location of measuring stations in Southern Poland. Decisive for the choice of the Katowice station was its location and the fact that it is one of the few stations in Silesia that measure the level of PM2.5. Both it and another station are characterized by continuity and recorded data availability.
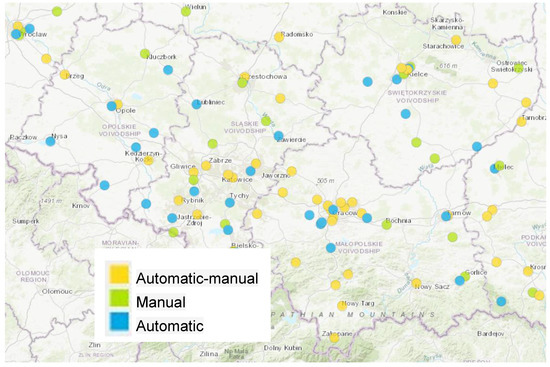
Figure 2.
Location of air quality measuring stations in Southern Poland [50].
3.2. Correlation
Table 3 presents the correlation coefficients between individual values measured at the monitoring station in Katowice for the heating seasons 2013–2016. The maximum temperature and wind speed (T0 = 22.6 °C, v0 = 4.4 m/s, respectively) were assumed as T0 and v0, respectively.

Table 3.
Correlation coefficients for values measured at the station in Katowice in the years 2013–2016 (Kossuth street, N = 10,957).
One might observe a high correlation between dust concentration on day t and on day (t − 1). It concerns both the smaller fraction, (PM2.5) and the larger one (PM10).
A similar trend may be observed in the case of sulfur dioxide. Correlation coefficients within the range of 0.9 indicated a high correlation between the current values and those measured on the previous day, which proved poor area ventilation caused by low wind speed and a high area roughness coefficient.
The correlation coefficients between dust and sulfur dioxide were quite high, about 0.6, because they originated from the combustion of low-quality fuel and low emissions from household boilers that lack devices to reduce the emission of dust and gases. It is worth emphasizing that almost all the correlations were statistically significant, which resulted from a very large data sample. Therefore, it is an excellent basis for the development of statistical models for the reliable assessment of the propagation of selected air pollutants.
3.3. Wind Roses
Figure 3 presents the wind roses for the analyzed heating seasons. The analysis of wind direction in individual seasons showed that the dominant directions for this monitoring station were southwest and to a lesser extent southeast.
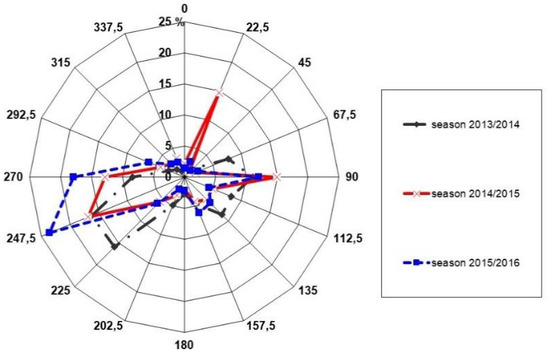
Figure 3.
Wind rose for meteorological station, Katowice, seasons 2013/2014, 2014/2015, 2015/2016.
The wind directions for this meteorological station were comparable to those of the station in the Katowice agglomeration area and were cited in papers dedicated to the analysis of pollution in this area (Figure 3). The wind roses indicate that these wind directions were dominant for this region, which is meaningful in the context of pollution transport for the location of emission sources or how highly urbanized areas influence low emissions. This situation is well presented in Figure 4, which presents the location of industrial plants treated as sources of high air pollution. These were placed on the list of the plants having the largest negative influence on the environment (List “80”), which can be found in [51]. The figure shows wind roses presented in [7] in which the authors determined the models for three stations in Upper Silesia—Gliwice, Bytom and Piekary Śląskie for three variants:
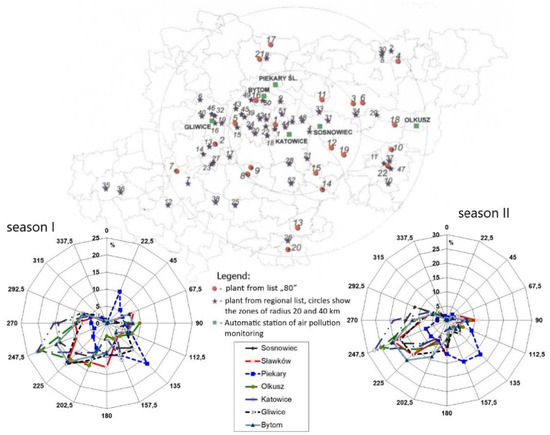
Figure 4.
Location of industrial plants and measuring stations in the Upper Silesian Industrial Region and wind roses for analyzed heating seasons 1996–1997 and 1997–1998 with wind roses [7].
- days in which air inflow at all stations came from quadrant (180°, 270°);
- days in which air inflow at certain station came from quadrant (180°, 270°);
- remaining days separately for heating seasons 1996–1997 and 1997–1998.
Such an approach to models made it possible to interpret coefficients and models for pollution transport or to search for rules (methods) of pollutant propagation in highly urbanized areas. Because of that, measuring stations are located small distances apart, so considering wind directions, one can expect that significant relocation of pollutants between stations may occur. It is important, then, that a station be located in an appropriate location, considering both the sources of the highest emissions and the direction of pollutant inflow from neighboring areas. Furthermore, the closest surrounding station is also important as it may influence changes in the parameters of pollution spreading. This was the basis for conducting analyses in this range.
3.4. Summary Statistics
In Table 2, the summary statistics for meteorological data and pollutant concentrations in the analyzed seasons were positioned. The data allowed us to analyze the obtained model forms in the context of coefficient values and their variation for individual seasons.
The analysis of averaged values in the heating seasons presented in Table 4 allowed initial comparisons of the levels of pollutant concentrations and meteorological conditions, which contribute in smog creation. Considering the temperature, the change between the lowest value in season 2014–2015 (4.31 °C) and highest (5.12 °C) is 0.81 °C. For wind speed, the season that had worst parameters for allowing an accumulation of pollutants because of low speed was 2014–2015 (mean speed = 0.63 m/s) while the best was season 2015–2016 (mean speed = 1.08 m/s, almost two times higher). When comparing the heating seasons for SO2 and PM air pollution values, it was worth noting that they were comparable in individual seasons for both mean and maximum values.

Table 4.
Summary statistics for data in individual seasons.
Figure 5, Figure 6, Figure 7 and Figure 8 show the comparison of the graphs of variation of SO2 and PM10 concentrations based on temperature and wind speed for individual heating seasons.
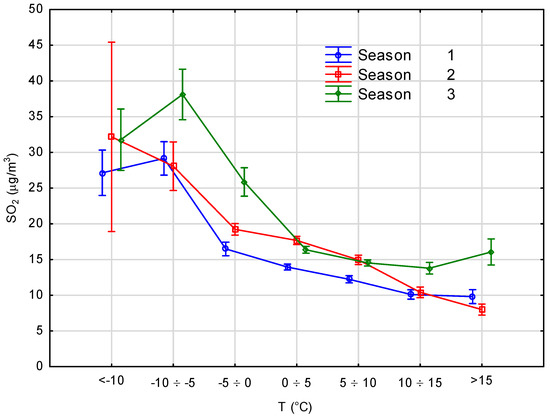
Figure 5.
Relation between SO2 concentration and temperature for the analyzed heating seasons.
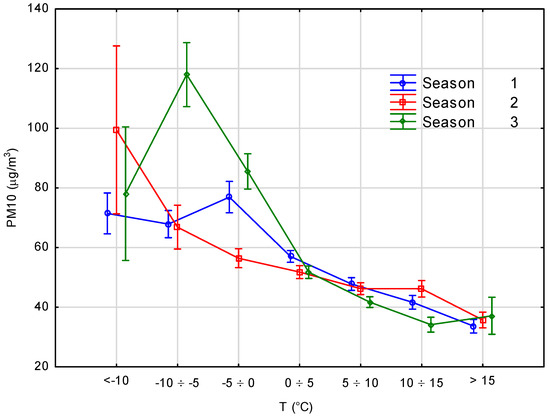
Figure 6.
Relation between PM10 concentration and temperature for the analyzed heating seasons.
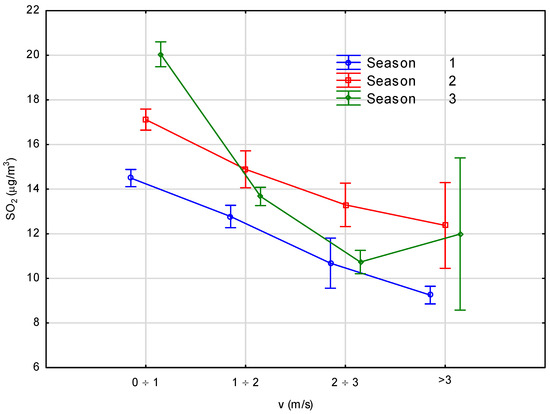
Figure 7.
Relation between SO2 concentration and wind speed for the analyzed heating seasons.
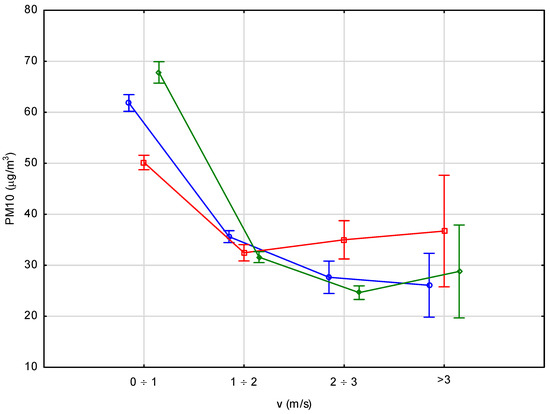
Figure 8.
Relation between PM10 concentration and wind speed for the analyzed heating seasons.
The graphs in Figure 5 and Figure 6 clearly show that the concentrations of both SO2 and PM10 decreased with the rise in temperature, thus confirming assumptions about their parabolic character. However, this decrease was mostly noticeable for SO2 in the range of negative temperatures and to a lesser extent for PM10. The highest changeability of concentrations was observed at low temperatures––the highest concentrations for SO2 were observed in 2015–2016––and the range of variation was very large below −5°, especially in 2014–2015. The variation of concentrations at higher temperatures was not high and related to a lower need for building heating.
Considering Figure 7 and Figure 8 it can be seen that growth of wind speed significantly influenced a decrease in the concentration of both SO2 and PM10. If there had been no wind or a very weak on a certain day, then the phenomenon of pollutants bedding (accumulation) would have created smog. The greatest change in the concentration level was when the wind speed was between 1 and 2 m/s, causing a 50% decrease in pollutants. This was especially apparent for PM10, which, together with PM2.5, is the main cause of smog. The change of wind speed to higher values (up to 3 m/s) did not cause a further decrease in concentrations values, but the highest changeability was noticed for winds stronger than 3 m/s. However, days with such strong wind are rare in heating seasons. One of the reasons for the observed relation could have been the result of secondary dusting by strong wind. Considering the concentrations levels in relation to wind speed, all heating seasons can be treated as comparable.
Figure 9 and Figure 10 show a deeper analysis of SO2 and PM10 concentrations taking into consideration the influence of temperature and wind speed.
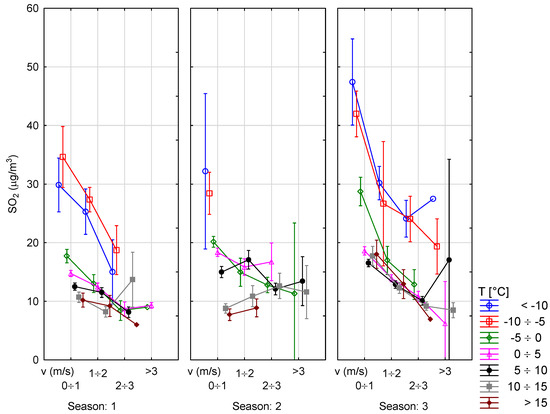
Figure 9.
Relation between SO2 concentration, temperature and wind speed.
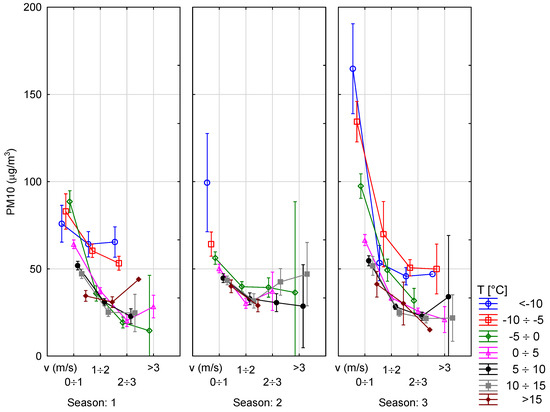
Figure 10.
Relation between PM10 concentration, temperature and wind speed.
Figure 9 and Figure 10 show that the data concerning the analyzed parameters were mostly similar. The biggest differences were observed for the lowest temperatures by low wind speed. In particular, season 2015–2016 stands out in this aspect. The largest variation of data also occurred because of a high wind speed value, but it concerned mainly the high value of standard deviation while the mean level was rather comparable. Furthermore, the features that noticeably influenced the analysis of the concentrations and their character were curvilinear and could be approximated by a parabolic function. That is why the parabolical model was accepted further in this paper.
4. Modelling Results and Discussion
A good mathematical model to describe the daily average SO2 concentrations in cities (measurement stations) of the Upper Silesian Industrial Region is
where T0 is the temperature (around 20°) determined from the peak of the parabolic function SO2 (T), and v0 is the wind speed (around 6 m/s) determined from the peak of parabolic function SO2 (v) [52].
Such a model was used between 2000 and 2013 to study the propagation of SO2 concentrations in the cities in Upper Silesia and was based on a similar model that was used in Vienna. The models obtained at that time were characterized by the level of the coefficient of determination R2 at 50–70% [9,10]. It was decided to verify the adopted form of the model by adapting it to the values from the 2013–2016 heating seasons. The data, collected by the air quality monitoring station in Katowice on Kossuth Street, were statistically processed and, based on them, regression equations were derived. For the collected data on both weather conditions and recorded concentration levels, a linear regression analysis was performed for the three heating seasons. The analysis gave us models which were used to obtain forecasts close to real values. A proper fit of the model was confirmed by high coefficients of determination R2. Comparing the concentrations obtained from the prediction to the concentrations measured at the stations, we also estimated errors using the mean square error MSE according to Formula (2), which were also at a satisfactory level.
where Si is the empirical concentration (measured at the station); is the theoretical concentration (obtained from the model); n is the number of measurements taken; and k is the number of variables in the model.
The obtained models were presented using formulas according to Equation (1), where: b is a parameter value; R is the correlation index; Cor. R2 is the corrected coefficient of distribution; F is the value of the F-Snedecor test; and p is a significance level for the F-Snedecor test. In the brackets below the model, the values of the coefficient errors were placed; we accept as a rule that the coefficient is statistically important if its absolute value is at least two times larger than the value of the error. The statistically important coefficients values at significance level 0.05 are marked by red color.
Therefore, the mathematical formulas for this model are:
- Regression model for SO2 concentrations in the heating season 2013–2014, Katowice, Kossuth Street.
N = 3938; R = 0.8626; Cor. R2 = 0.7440 F(3, 3934) = 3814.3 p < 0.0000 MSE = 5.0115
- Regression model for SO2 concentrations in the heating season 2014–2015, Katowice, Kossuth street.
N = 3776; R = 0.9092 Cor. R2 = 0.8264 F(3, 4324) = 6869.0 p < 0, MSE = 5.3768
- Regression model for SO2 concentrations in the heating season 2015–2016, Katowice, Kossuth street.
N = 4328; R = 0.9092 Cor. R2 = 0.8264 F(3, 4324) = 6869.0 p < 0, MSE = 5.0449
For the assumed significance level = 0.05, one can see that all coefficients of the regression equation concerning the heating seasons are statistically significant (except for the value of the absolute term). Furthermore, the value of the R2 coefficient exceeded 70%, which meant that these models were statistically better than models developed in previous years. It has to be stated that for all three heating seasons the models had a comparable form, i.e., the values of model parameters were similar and the level of R2 was comparable. This meant that the seasons were similar and could easily be adapted to subsequent seasons. This might be due to the fact that concerning winters in recent years, one did not see large fluctuations regarding meteorological conditions. In addition, the model obtained for all three periods combined was also presented.
- Regression model for SO2 concentrations in three heating seasons 2013–2016 total, Katowice, Kossuth Street.
N = 12042; R = 0.8924; Cor. R2 = 0.7963; F(3, 12038) = 15689 p < 0.0000 MSE = 5.1530
What is more, due to the smog in many Polish cities during winter, models for PM10 concentrations, taking into account analogous initial equation models, were developed.
- Regression model for PM10 concentration for heating season 2013–2014, Katowice, Kossuth Street.
N = 4111; R = 0.9327; Cor. R2 = 0.8699 F(3, 4107) = 9158.0; p < 0.0000 MSE = 14.972
- Regression model for PM10 concentration for heating season 2014–2015, Katowice, Kossuth Street.
N = 4295; R = 0.9321 Cor. R2 = 0.8687 F(3, 4291) = 9474.2; p < 0.0000 MSE = 14.073
- Regression model for PM10 concentration for heating season 2015–2016, Katowice, Kossuth Street.
N = 4249; R = 0.9473 Cor. R2 = 0.8973 F(3, 4245) = 12367; p < 0, MSE = 14.446
- Regression model for PM10 concentrations for all three heating seasons 2013–2016, Katowice, Kossuth Street.
N = 12655; R = 0.9375 Cor. R2 = 0.8789 F(3, 12651) = 30619; p < 0.0000 MSE = 14.583
Analyzing the coefficients of the models developed for PM10 concentrations, one could observe that the proposed model form is also effective for this type of air pollution. The R2 values concerning this model were close to 90%, which meant that statistically, these models give a fair amount of potential estimate accuracy. However, it should be noted that concerning heating season 2014–2015, the parameter of the regression equation concerning the influence of temperature was not found to be significant. Most likely, this was because of the autocorrelation, which caused the obtained coefficient to be subject to additional error. However, this did not change the fact that in the other two seasons, the model proved to be significant. Concerning the 2014–2015 season, the significance level for the obtained parameter related to temperature change was only slightly higher than the assumed level of 5%.
This meant that the proposed regression model can be successfully applied for the purpose of warning and preventing practices concerning concentrations of selected air pollutants. There is no other work concerning this aspect of forecasting pollutant concentrations (SO2 and PM10), which makes it difficult to compare this with other works. These problems were the subject of older works [11,12]. Currently, thanks to the environmental protection activities, this topic is no longer such an interesting area of research.
5. Conclusions
The statistical analysis of concentration and meteorological data presented in the paper, obtained at the monitoring station in Katowice in the heating seasons 2013–2016, allows the following conclusions to be drawn:
- -
- There is a high correlation between SO2 and dust concentrations at moment t and previous concentrations. The correlation coefficients between individual pollutants measured at the same time are at a satisfactory level.
- -
- The proposed form of the model can generate good starting material when attempting to create a stochastic model that, depending on the direction of research, might provide better results for predicting concentrations of the studied type of air pollution. The analyses confirmed the parabolic character of the relationship between SO2 and PM10 concentrations and the meteorological parameters of wind speed and temperature. This was especially visible for low temperature values. Forr SO2, the mean concentration for low temperatures was around 30–40 µg/m3 and for higher values around 15. In case of PM10 the same relations were 70–120 µg/m3 and for positive values, 30–50 µg/m3.
- -
- The results obtained from individual heating seasons were similar to the results obtained from analyzing the years 2013–2016, as a whole.
- -
- The application of the above-mentioned statistical methods describing the measurement data obtained from the station allows for the analysis of their quantitative and qualitative dependencies, which is not always possible when using only numerical models or estimation methods (e.g., neural networks). The obtained errors were quite comparable for all seasons. In case of SO2 it was equal to about 5 µg/m3 and in case of PM10 around 15 µg/m3.
- -
- The proposed model can be treated as a unified form. Even if the model from a previous year is used for a new one, the fit is quite good. The very important parameter in the model is the accumulation of s pollutant from a previous time. That means that the model coefficients are quite stable for s certain area. They may change if area’s urbanization or location of industrial plants changes.
- -
- The observation of the model coefficient values and variations, as well as the influence of meteorological conditions (wind speed and temperature) allows an eventual evaluation of the effects of activities to change heating systems in buildings as described at the beginning of the paper.
Author Contributions
Conceptualization; formal analysis; methodology; validation; writing—original draft preparation; investigation, D.F. and T.N.; data curation; formal analysis; resources; J.S.; writing—review and editing, T.N. and J.S. All authors have read and agreed to the published version of the manuscript.
Funding
This research received no external funding.
Institutional Review Board Statement
Not applicable.
Informed Consent Statement
Not applicable.
Data Availability Statement
Not applicable.
Acknowledgments
The authors want to express gratitude towards the late prof. dr hab. Tadeusz Tumidajski for his invaluable contribution to research on monitoring and modelling of air pollutions propagation. The article is developed as a part of the project No. 16.16.100.215.
Conflicts of Interest
The authors declare no conflict of interest.
References
- Kleczkowski, P. Smog w Polsce; Wydawnictwo Naukowe PWN: Warszawa, Poland, 2019. [Google Scholar]
- Moussiopoulos, N. (Ed.) Air Quality in Cities; SATURN—EUROTRAC 2 Subproject Report; Springer: Berlin/Heidelberg, Germany, 2003. [Google Scholar]
- Polski Alarm Smogowy. Available online: polskialarmsmogowy.pl (accessed on 30 November 2020).
- Kobus, D.; Merenda, B.; Sówka, I.; Chlebowska-Styś, A.; Wroniszewska, A. Ambient air quality as a condition of effective healthcare therapy on the example of selected Polish health resorts. Atmosphere 2020, 11, 882. [Google Scholar] [CrossRef]
- Wielgosiński, G.; Czerwińska, J. Smog Episodes in Poland. Atmosphere 2020, 11, 277. [Google Scholar] [CrossRef]
- Foszcz, D.; Niedoba, T.; Saramak, D.; Gawenda, T. The Methodology of the SO2 Concentration Forecasting in the Cities for the Preventive Purposes in the Example of the City of Kraków. In Proceedings of the 3rd International Conference of PhD Students, Engineering Sciences, Miskolc, Hungary, 13–19 August 2001; Volume 2, pp. 569–576. [Google Scholar]
- Foszcz, D.; Niedoba, T.; Siewior, J. The Methods of Forecasting of SO2 and Suspended Dust Concentrations for Warning Purposes in the Example of Selected Polluted Regions in Poland. In Ecosystems and Sustainable Development; Tiezzi, E., Brebbia, C.A., Jorgensen, S., Almorza Gomar, D., Eds.; WIT Press: Southampton/Boston, UK, 2005; pp. 477–491. [Google Scholar]
- Kunysz, J.; Foszcz, D.; Gawenda, T.; Tumidajski, T. Modele adaptacyjne jako metoda prognozowania średniodobowych stężeń SO2. Ochr. Powietrza Probl. Odpadów 2001, 35, 138–143. [Google Scholar]
- Siewior, J.; Tumidajski, T.; Foszcz, D.; Niedoba, T. Prognozowanie stężeń zanieczyszczeń powietrza w GOP-ie modelami statystycznymi. Rocz. Ochr. Sr. 2011, 13, 1261–1274. [Google Scholar]
- Tumidajski, T.; Siewior, J.; Foszcz, D.; Niedoba, T. Ocena wpływu stężeń zanieczyszczeń powietrza w GOP-ie na jakość powietrza w rejonie Opola i Kędzierzyna-Koźla. Rocz. Ochr. Sr. 2014, 16, 519–533. [Google Scholar]
- Bringfelt, B. Important factors for the sulphur dioxide concentration in central Stockholm. Atmos. Environ. 1971, 5, 949–972. [Google Scholar] [CrossRef]
- Bolzern, P.; Fronza, G.; Runze, E.; Uberhuber, C. Statistical analysis of winter sulphur dioxide concentration data in Vienna. Atmos. Environ. 1982, 16, 1899–1906. [Google Scholar] [CrossRef]
- Hysenaj, M. Dispersion model prospective of air pollution in Tirana. Geogr. Tech. 2019, 14, 10–19. [Google Scholar] [CrossRef]
- Markiewicz, M.T. Methods of determining meteorological data used in air pollution dispersion models. Environ. Prot. Eng. 2007, 33, 75–86. [Google Scholar]
- Markiewicz, M.T. Podstawy Modelowania Rozprzestrzeniania Się Zanieczyszczeń w Powietrzu Atmosferycznym; Oficyna Wydawnicza Politechniki Warszawskiej: Warsaw, Poland, 2004. [Google Scholar]
- Markiewicz, M.T. Methods of the wet deposition description in air pollution dispersion models. Environ. Prot. Eng. 2007, 33, 113–120. [Google Scholar]
- Carmichael, C.R.; Peters, L.K.; Saylor, R.D. The STEM II regional scale acid deposition model: Physical concept and formulation. Part I. Atmos. Environ. 1991, 25, 2077–2090. [Google Scholar] [CrossRef]
- Chang, J.S.; Brost, R.A.; Isaksen, P.S.A.; Madronich, S.; Middleton, P.; Stockwell, W.R.; Walcek, C.J. A three-dimensional Eulerian acid desposition model. Physical concepts and formulation. J. Geophys. Res. 1987, 92, 14681–14700. [Google Scholar] [CrossRef]
- Venkatram, A.; Karamandani, P.K. Testing a comprehensive acid deposition model. Atmos. Environ. 1989, 22, 737–747. [Google Scholar] [CrossRef]
- Hamer, P.D.; Walker, S.-E.; Sousa-Santos, C.; Vogt, M.; Vo-Thanh, D.; Lopez-Aparicio, S.; Schneider, P.; Ramacher, M.O.P.; Karl, M. The urban dispersion model EPISODE v. 10.0—Part I: An Eulerian and sub-grid scale air quality model and its application in Nordic winter conditions. Geosci. Model. Dev. 2020, 13, 4323–4353. [Google Scholar] [CrossRef]
- Cirtina, D.; Pecingina, J.; Cirtina, L. Study on Mathematical Modeling of the Dispersion Sulfur Dioxide by Burning Fossil Fuels. In Proceedings of the International Multidisciplinary Scientific GeoConference and EXPO SGEM, Albena, Bulgaria, 17–26 June 2014; pp. 523–531. [Google Scholar]
- Morawska-Horawska, M. Stochastyczne modele prognozy średniego dobowego stężenia SO2 dla Krakowa. Wiadomości IMGW 1988, 9, 3. [Google Scholar]
- Ilić, I.; Vuković, M.; Štrbac, N.; Urošević, S. Applying GIS to control transportation air pollutants. Pol. J. Environ. Stud. 2014, 23, 1849–1860. [Google Scholar]
- Vlaknenski, T.; Stoychev, P.; Chuturkova, R. Dispersion modeling of atmospheric emissions of particulate matter (PM10) and evaluation of the contribution of different sources of air pollution in the town of Svishtov, Bulgaria. J. Sci. Appl. Res. 2014, 5, 202–212. [Google Scholar]
- Zahron, E.M.M. A novel approach to improve the air quality predictions of air pollution dispersion modelling systems. Int. J. Environ. Res. 2013, 7, 205–218. [Google Scholar]
- El-Harbawi, M. Air quality model ling, simulation and computational methods: A review. Environ. Rev. 2013, 21, 149–179. [Google Scholar] [CrossRef]
- Juda-Rezler, K. Oddziaływanie Zanieczyszczeń Powietrza na Środowisko; Wyd. OWPW: Warsaw, Poland, 2006. [Google Scholar]
- Holnicki-Szulc, P. Modele Propagacji Zanieczyszczeń Atmosferycznych w Zastosowaniu do Kontroli i Sterowania Jakością Środowiska; Akademicka Oficyna Wydawnicza EXIT: Warsaw, Poland, 2006. [Google Scholar]
- Khoo, H.H.; Spedding, T.A.; Houston, D.; Taplin, D. Application of modeling and simulation tools in costs and pollution monitoring. Environmentalist 2001, 21, 161–168. [Google Scholar] [CrossRef]
- Gorai, A.K.; Upadhyay, A.K.; Goyal, P. Design of fuzzy synthetic evaluation model for air quality assessment. Environ. Syst. Decis. 2014, 34, 456–469. [Google Scholar] [CrossRef]
- Billiaiev, M.M.; Slavinska, O.S.; Kyrychenko, R.V. Numerical simulation of pollution dispersion in urban street. Ekol. Transporti 2017, 70, 23–28. [Google Scholar] [CrossRef]
- Jury, M.R.; Wilczak, J.M. Mesoscale numerical models: Cost-effective input to dispersion prediction schemes. Clean Air 1992, 8, 12–14. [Google Scholar] [CrossRef]
- Preto, W.H.; Cremasco, M.A. Application of probability density functions in modelling annual data of atmospheric NOx temporal concentration. Chem. Eng. Trans. 2017, 57, 487–492. [Google Scholar]
- Hammond, J.K.; Chen, R.; Mallet, V. Meta-modeling of a simulation chain for urban air quality. Adv. Mod. Simul. Eng. Sci. 2020, 7, 1–22. [Google Scholar]
- Kim, Y.; Wu, Y.; Seigneur, C.; Roustan, Y. Multi-scale modeling of urban air pollution: Development and application of a Street-in-Grid model (v1.0) by coupling MUNICH (v1.0) and Polair3D (v1.8.1). Geosci. Model Dev. 2018, 11, 611–629. [Google Scholar] [CrossRef]
- Chen, H.; Xue, B. Research on the factors affecting regional smog in China—Based on spatial panel model. Mod. Econ. 2019, 10, 1292–1309. [Google Scholar] [CrossRef][Green Version]
- Deng, L.; Yu, M.; Zhang, Z. Statistical learning of the worst regional smog extremes with dynamic conditional modeling. Atmosphere 2020, 11, 665. [Google Scholar] [CrossRef]
- Hu, D.; Jiang, J. A study of smog issues and PM2.5 pollutant control strategies in China. J. Environ. Prot. 2013, 4, 746–752. [Google Scholar] [CrossRef][Green Version]
- Yu, X.; Shen, M.; Shen, W.; Zhang, X. Effects of land urbanization on smog pollution in China: Estimation of spatial autoregressive panel data models. Land 2020, 9, 337. [Google Scholar] [CrossRef]
- Zwoździak, J. Prognozy i Analizy Stężeń Zanieczyszczeń w Powietrzu w Regionie Czarnego Trójkąta; Oficyna Wydawnicza Politechniki Wrocławskiej: Wrocław, Poland, 1998. [Google Scholar]
- Finzi, G.; Tebaldi, G. A mathematical model for air pollution forecast and alarm in an urban area. Atmos. Environ. 1982, 16, 2055–2090. [Google Scholar] [CrossRef]
- Rani, N.L.A.; Azid, A.; Khalit, S.I.; Juahi, H.; Samsudin, M.S. Air pollution index trend analysis in Malaysia, 2010–2015. Pol. J. Environ. Stud. 2018, 27, 801–807. [Google Scholar] [CrossRef]
- Hamid, A.; Atique, S.A.; Huma, Z.; Uddin, S.G.M.; Asghar, S. Ambient air quality & noise level monitoring of different areas of Lahore (Pakistan) and its health impacts. Pol. J. Environ. Stud. 2019, 28, 623–629. [Google Scholar]
- Huete-Morales, M.D.; Quesada-Rubio, J.-M.; Navarette Álvarez, E.; Rosales-Moreno, M.J.; Del-Moral-Ávila, M.J. Air quality analysis in the European union. Pol. J. Environ. Stud. 2017, 26, 1113–1119. [Google Scholar] [CrossRef]
- Saramak, A. Comparative analysis of indoor and outdoor concentration of PM10 particulate matter on example of Cracow City center. Int. J. Environ. Sci. Techol. 2019, 16, 6609–6616. [Google Scholar] [CrossRef]
- Spychała, M.; Domagajska, J.; Ćwieląg-Drabek, M.; Marchwińska-Wyrwał, E. Correlation between length of life and exposure to air pollution. Pol. J. Environ. Stud. 2020, 29, 1361–1368. [Google Scholar] [CrossRef]
- Baklanov, A.; Zhang, Y. Advances in air quality modeling and forecasting. Glob. Transit. 2020, 2, 261–270. [Google Scholar] [CrossRef]
- Nichol, J.E.; Bilal, M.; Qiu, Z. Air pollution scenario over China during COVID-19. Remote Sens. 2020, 12, 2100. [Google Scholar] [CrossRef]
- Dziennik Ustaw. J. Laws 2019, pos. 1355, as amended.
- Inspekcja Ochrony Środowiska. Available online: http://powietrze.gios.gov.pl/pjp/maps/measuringstation (accessed on 20 January 2021).
- Jarzębski, L. Raport o Stanie Środowiska w Województwie Katowickim w Latach 1995–1996; Biblioteka Monitoringu Środowiska: Katowice, Poland, 1997. [Google Scholar]
- Tumidajski, T.; Foszcz, D.; Gawenda, T. Wybrane aspekty zmian zanieczyszczeń powietrza miast Górnośląskiego Okręgu Przemysłowego. Zesz. Nauk. Wydziału Budownictwa Ŝynierii Sr. 2001, 20, 573–580. [Google Scholar]
Publisher’s Note: MDPI stays neutral with regard to jurisdictional claims in published maps and institutional affiliations. |
© 2021 by the authors. Licensee MDPI, Basel, Switzerland. This article is an open access article distributed under the terms and conditions of the Creative Commons Attribution (CC BY) license (https://creativecommons.org/licenses/by/4.0/).