Article

Agrometeorological Conditions and Agroclimatic Trends for the Maize and Wheat Crops in the Balkan Region

by
Ioannis Charalampopoulos
Laboratory of General and Agricultural Meteorology, Agricultural University of Athens, Iera Odos 75, 11855 Athens, Greece
Atmosphere 2021, 12(6), 671; https://doi.org/10.3390/atmos12060671
Submission received: 23 April 2021 / Revised: 20 May 2021 / Accepted: 23 May 2021 / Published: 24 May 2021
(This article belongs to the Section Biometeorology)

Abstract

:
The Balkan peninsula is a transitional zone, in terms of bioclimatic conditions, with an extended and dynamic agricultural sector. Its potential is in peril due to climate change and socioeconomic factors. To assess and evaluate the agrometeorological conditions and the related trends which affect the widely cultivated wheat and maize, a big dataset with high spatiotemporal analysis was utilized. The thermal indices of Growing Degree Days (GDD) and Heat Stress Index (HSI) along with the main frost parameters (frost days, last spring frost, first autumn frost, and free of frost days) were calculated over ten countries for 42 years on a daily basis over a grid of 25 × 25 km. The results indicate a clear cultivations’ expansion ability to northern areas, and higher altitudes and an increased risk of heat caused plants’ injuries. The thermal indices’ trends for maize and wheat cultivation are always positive (Maize: GDD 7.26–11.05 units/yr, HSI 0.52–3.51 units/yr Wheat: GDD 7.2–12.7 units/yr, HSI 0.22–1.77 units/yr). The free of frost (FFD) season is getting longer (trend −0.04 to 0.34 d/yr) because of earlier last spring frost and delayed first autumn frost. The results consist of spatial and temporal illustrations, along with summary statistics and probability density plots for the entire study area and per country.

1. Introduction

Local and regional climate change affects the quality and quantity of agricultural production [1,2,3,4,5,6,7,8]. Simultaneously, the global population faces increasing food requirements and limits to the potential for opening up new farmlands; this finding is very worrying and can only aggravate the world food crisis [9,10]. Thus, agricultural production and global food security are directly affected by global climate change [11,12,13]. More specifically, food security relies on the resilience of staple food crops to climatic variability. Even with moderate warming, reducing the cardinal cereals’ yield will cause increased yield’s variability [14]. The main challenge that affects the growth and development of the crops is the changing weather patterns, along with the extreme weather events that can lead to intra-seasonal changes in yield [15].
The European region consists of a wide variety of agroecological zones from boreal in the North and semi-arid in the South [16,17,18,19], pinpointing the diversity of the continent’s natural and agricultural ecosystems. In general, Olesen and Bindi [20] identified that in Europe, a possible increase in water shortages and extreme weather events would cause lower harvestable yields, higher yield variability, and a reduction in suitable areas for traditional crops such as wheat and maize. Moreover, Moriondo and Bindi [21] concluded that in the Mediterranean basin, climate change would cause an increment in mean air temperature and extreme weather events. These changes are expected to have a significant impact on agriculture in general and on crops’ phenology in particular. As a consequence of the above, crop development is expected to be faster; thus, phenological stages will be reached early, and the length of the growth period of crops, such as grapevine and cereals, will be shorter. The potential impact of extreme events during sensitive phenological phases may have strong negative effects on final yield and yield quality [21]. The impact of predicted prolonged summer drought periods and heatwaves for the next decades may be smoothed and prevented for the winter crops due to their faster development, allowing them to escape these avoid the reduction in final yields. In contrast, crops that have a major part in their growing cycle during summer are likely to experience a severe reduction of final yield due to the increased frequency of extreme climatic events and a reduced time of biomass accumulation to yield [21].
The research is focused particularly on the Balkan region on the southeastern part of the European continent, which is a significant contributor to food production with high agrometeorological sensitivity. The Balkan Peninsula is in a transitional climatic zone which will face abrupt changes in the key atmospheric parameters of temperature and precipitation. As anticipated, the Balkan region’s crops will be directly affected by these changes [22,23,24,25,26,27,28]. So, it is of utmost importance to obtain reliable information about the abiotic factors to plan and implement the appropriate mitigation measures [29,30]. Despite the importance of this region, there is a lack of empirical evidence focused on the agrometeorological conditions and trends related to the crops’ thermal requirements and the frost conditions in a high-detail spatial grid over the Balkan area.
The parameter of temperature controls the rate of plants metabolic process that ultimately influences the production of biomass, fruits and grains [13], and a wide range of other atmospheric parameters related to the thermal requirements of the cultivations define the suitability of the climatic regime of a region. On the one hand, the plants need an accumulation of thermal conditions to fulfil their biological cycle productively; on the other hand, and it is favorable for the plants to face less frequently damaging phenomena such as frost or extremely hot conditions. In the first case of their thermal requirements, the Growing Degree Days (GDD) is a well-established and widely used index for research and production purposes [6,31,32,33,34]. Due to the need for detailed information for the low-temperature crops limitations, indices such as Frost Days (FD), Free of Frost Days (FFD), First Autumn Frost (FAF) and Last Spring Frost (LSF) were used [35,36,37,38,39]. Moreover, we utilized the Heat Stress Index (HSI), which accumulates the extremely hot time during the growing season. Using the previous indices, it is possible to determine the growing season length, the potential frost damage and finally evaluate if a region is under suitable climatic conditions for the growth and productivity of the crops [32,40,41,42].
Based on these premises, this paper provides an updated analysis of the above agrometeorological indices and their trends based on a high spatiotemporal resolution dataset. The research is mainly focused on wheat and maize cultivations over ten Balkanian countries for the period 1978 to 2020, and it is the first part of ongoing research. This study analyses in detail the past and the present (by 2020) of the agrometeorological—agroclimatic conditions of the Balkan area. The following research will present the results analytically on future trends based on major climatic models under specific climatic scenarios.

2. Materials and Methods

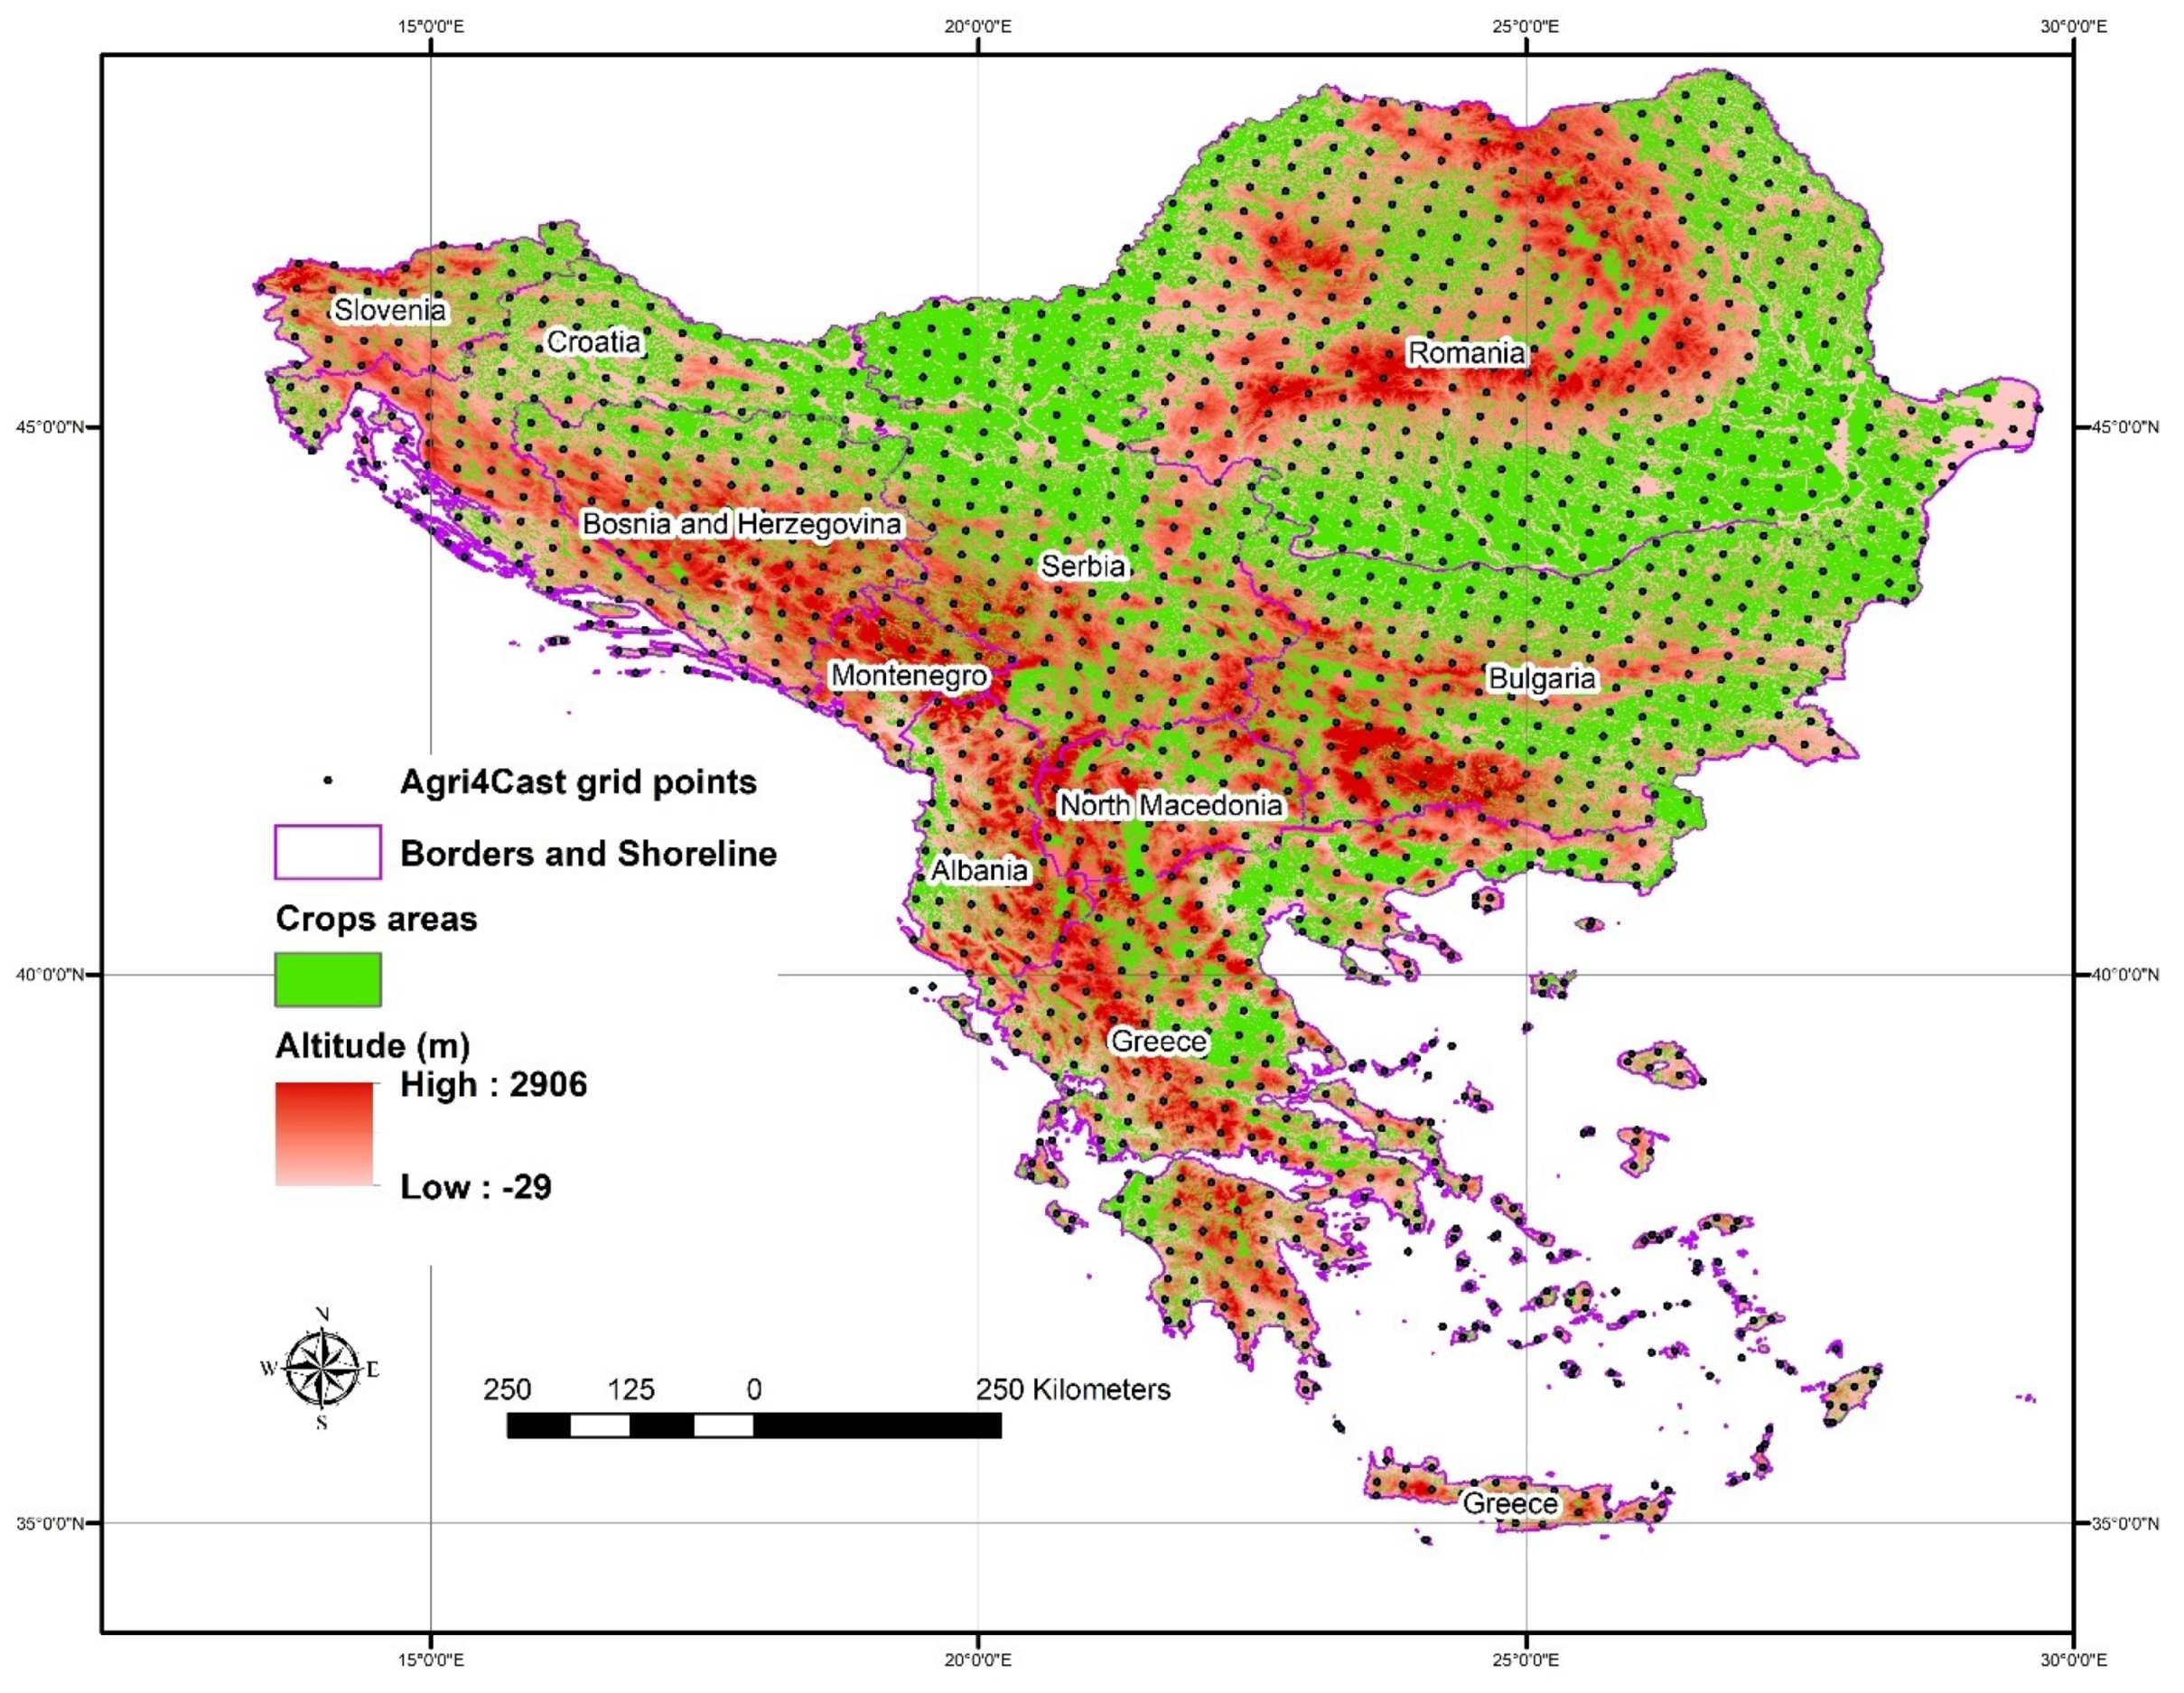
2.1. Study Area and Data

The present research is focused on the Balkan area, covering Albania, Bosnia and Herzegovina, Bulgaria, Croatia, Greece, Montenegro, North Macedonia, Romania, Serbia, and Slovenia. The criterion for this selection is twofold, taking into account the areas’ agricultural production potential and their sensitivity to climate variations. According to the Corine Land Cover (CLC) dataset and the statistics of the Food and Agriculture Organization (FAO) of the United Nations (Table 1), there is a high percentage of the agricultural land use and arable land, which is defined by the FAO as the land under temporary crops (double-cropped areas are counted once), temporary meadows for mowing or pasture, land under market or kitchen gardens, and land temporarily fallow.
To examine the agrometeorological conditions and the agroclimatic trends of the study area, we utilized the fine-scale gridded meteorological dataset Agri4Cast of the JRC MARS Meteorological Database. This dataset contains meteorological observations from weather stations, interpolated to a regular 25 × 25 km grid on a daily basis. The initial data carried out from synoptic weather stations, mainly on the European continent, and after an interpolation process, the dataset is freely available. The primary purpose of the Agri4Cast dataset is the deriving of agrometeorological indicators for crop modelling when at the same time it is a valuable dataset for agroclimatic assessment [43,44]. Moreover, the Agri4Cast, according to its evaluation, has a high spatial and temporal accuracy and can be a reasonable basis for agroclimatic and agrometeorological research [45]. For the selected study area, there are 1532 grid points (Figure 1) covering canonically every part of the Balkan peninsula.
The acquired data consist of the grid number, the day/month/year and the temperature parameters (maximum and minimum) from 1978 to 2020, covering 42 years on a daily scale. The total amount of data rows is greater than 22 million, and to manage and analyze this extensive dataset, the R language [46] and the specialized packages “dplyr” [47] and “fst” [48] were used. The mapping procedure, made with the ArcMap 10.8.1, and for the summary statistics calculations (median, max, min and kernel densities) and visualization, “gtsummary” [49] and “ggpubr” [50] packages, respectively, were used.
The selected crops are maize (Zea mays L.) and wheat, as emblematic cultivations of worldwide agricultural production. Wheat and maize (corn) are two of the most widely grown cereals in the world. Along with soybeans, rice, barley, and sorghum, they account for approximately 40% of the global cropland and 55% of non-meat calories worldwide [51]. Considering the Crop Calendar of the Agri4Cast resources portal [52], the growing season for maize is defined as the period from 1 April to 15 November, and for wheat from 15 September to 1 August (to be in compliance with the whole study area).

2.2. Agrometeorological Indices and Calculations

This study examines three agroclimatic indices focused on the growing seasons of maize and wheat and four indicators of frost for the full-year period over the study area. The agroclimatic indices are the Growing Degree Days (GDD), the Frost Days (FD), the Heat Stress Index (HSI), along with their trends. GDD (or thermal time) is the number of accumulated degrees within certain thresholds related to the selected crop [6]. For the calculation of the GDD, the R package “climatrends” was used [53]. The essential Equation (1) is utilized with the adjustment of T m i n = T b a s e if T m i n < T b a s e and T m a x = T b a s e if T m a x < T b a s e , where G b , G e is the beginning and the ending of the growing period of the crop, and T m a x ,   T m i n , and T b a s e are the daily maximum, minimum air temperature and the limiting temperature for the specific crop, respectively. The Tbase for the maize GDD is 10 °C and for the wheat is 5.5 °C.
G D D = G b G e T m a x + T m i n 2 T b a s e
The HSI index (Equation (2)), similarly to the aforementioned, is the accumulated degrees above a specific temperature threshold, which is 30 °C. As Wilhelm et al. [54] indicate, the temperatures above this threshold can negatively impact key processes, driving reduced biomass production and lower crop yield. For the selected crops, this temperature threshold (Tbase) is 30 °C [6,33]. When the TmaxTbase is negative, we count 0 values.
H S I = G b G e T m a x T b a s e
Also, the FD has been calculated as the sum of days where the minimum air temperature is equal to or below 0 °C [6,40] for each crop’s growing season. The GDD can be a measure of the abundance of thermal energy for plant growth, and HSI and FD can be measurements of the potential restriction’s factors for each cultivation.
In addition to the above indices, the Frost Free Days (FFD), which is the free of frost period of a year, was calculated, and it is the period between the Last Spring Frost (LSF) and the First Autumn Frost (FAF). The LSF is the last frost from the beginning of the year to 15 July. This parameter is of utmost importance because the crops are in higher sensitivity in frost damages during the spring. To be more precise, the late spring frosts are the most dangerous in the specific geographic area [42,55,56]. Finally, the FAF is the first frost after 15 July.
Except for the indices and frost parameters, their related trends were calculated. More specifically, for every grid point, a least square regression was conducted for the parameters of time (Year) and the value of the index. So, the trend is the regression’s coefficient, and the related R2 indicated the significance. The spatial distribution of the indices and their trends have been made by interpolating the values of the gridded data. Specifically, the ordinary kriging method [57] was implanted taking advantage of the regularly placed gridded data [6].

3. Results and Discussion

The results of this research are divided into three sub-sections; the first two are focused on maize and wheat and the agrometeorological conditions during their annual growth period. The last sub-section presents the frost indices of the study area calculated for the whole year period. The primary scope of this study is to examine the conditions and trends in the Balkan’s area in relation to the selected crops, from the point of view of the spatiotemporal expansion of the crops’ (GDD) cultivation and the restriction factors (HSI and frost).

3.1. Maize Agrometeorological Conditions and Trends

The presented results give a brief but comprehensive image of the potential growth expansion or agrometeorological restriction factors of maize cultivation.

3.1.1. Maize Growing Degree Days (GDD)

The left part of the spatial distribution map (Figure 2) depicts the GDD for the year 2020, and in the right part of the figure, there is the trend of the same parameter. As it is anticipated, the high values of the thermal time are presented over the southern parts of the Balkan’s peninsula and over the coastal areas with low altitude. The value of the 2000 GDD units can be achieved over most of Greece, along with the lowland of Bulgaria and Romania. Moreover, coastal Albania is suitable for maize cultivation according to this criterion. Lower GDD values are calculated over the Carpathians, northern Montenegro and Slovenia.
The trend of GDD (calculated for the 1978 to 2020 period) is positive over the research area. This finding indicates that if this trend persists, the Balkan area will gain more territory suitable for maize cultivation. High trends have been calculated over the inland of Croatia and Bosnia and Herzegovina, and the northern part of Romania, counting values higher than 10 GDD units per year. The western part of Greece presents low trend units (always positive), and the lowest trends have been calculated over the southern part of Bulgaria.
The spatiotemporal analysis of maize GDD (Figure 3) indicates a straightforward zonal transposition from the lower altitude areas to the higher.
Taking as a reference the isoline of 2000 GDD units, we watch the shifting of the thermal aggregation to higher altitudes and latitudes. The red line, which represents the places with 2000 GDD units during the maize cultivation (from 1 April to 15 November), covers the southern part of the map, mainly the Greek territory and a part of coastal Albania. Twenty years later (2000), the isoline of 2000 GDD units (with green color) has shifted considerably, allowing maize cultivation in most of Bulgaria’s territory, in the southern part of Romania and the northern basin of Serbia. Moreover, almost the entire coastal Balkan area of the Adriatic Sea is aggregating the 2000 GDD units. Finally, during the year 2020, the isoline is shifted further to higher altitudes. It is worth mentioning that the sprawling from 2000 to 2020 is smaller than the 1980 to 2000 time period.

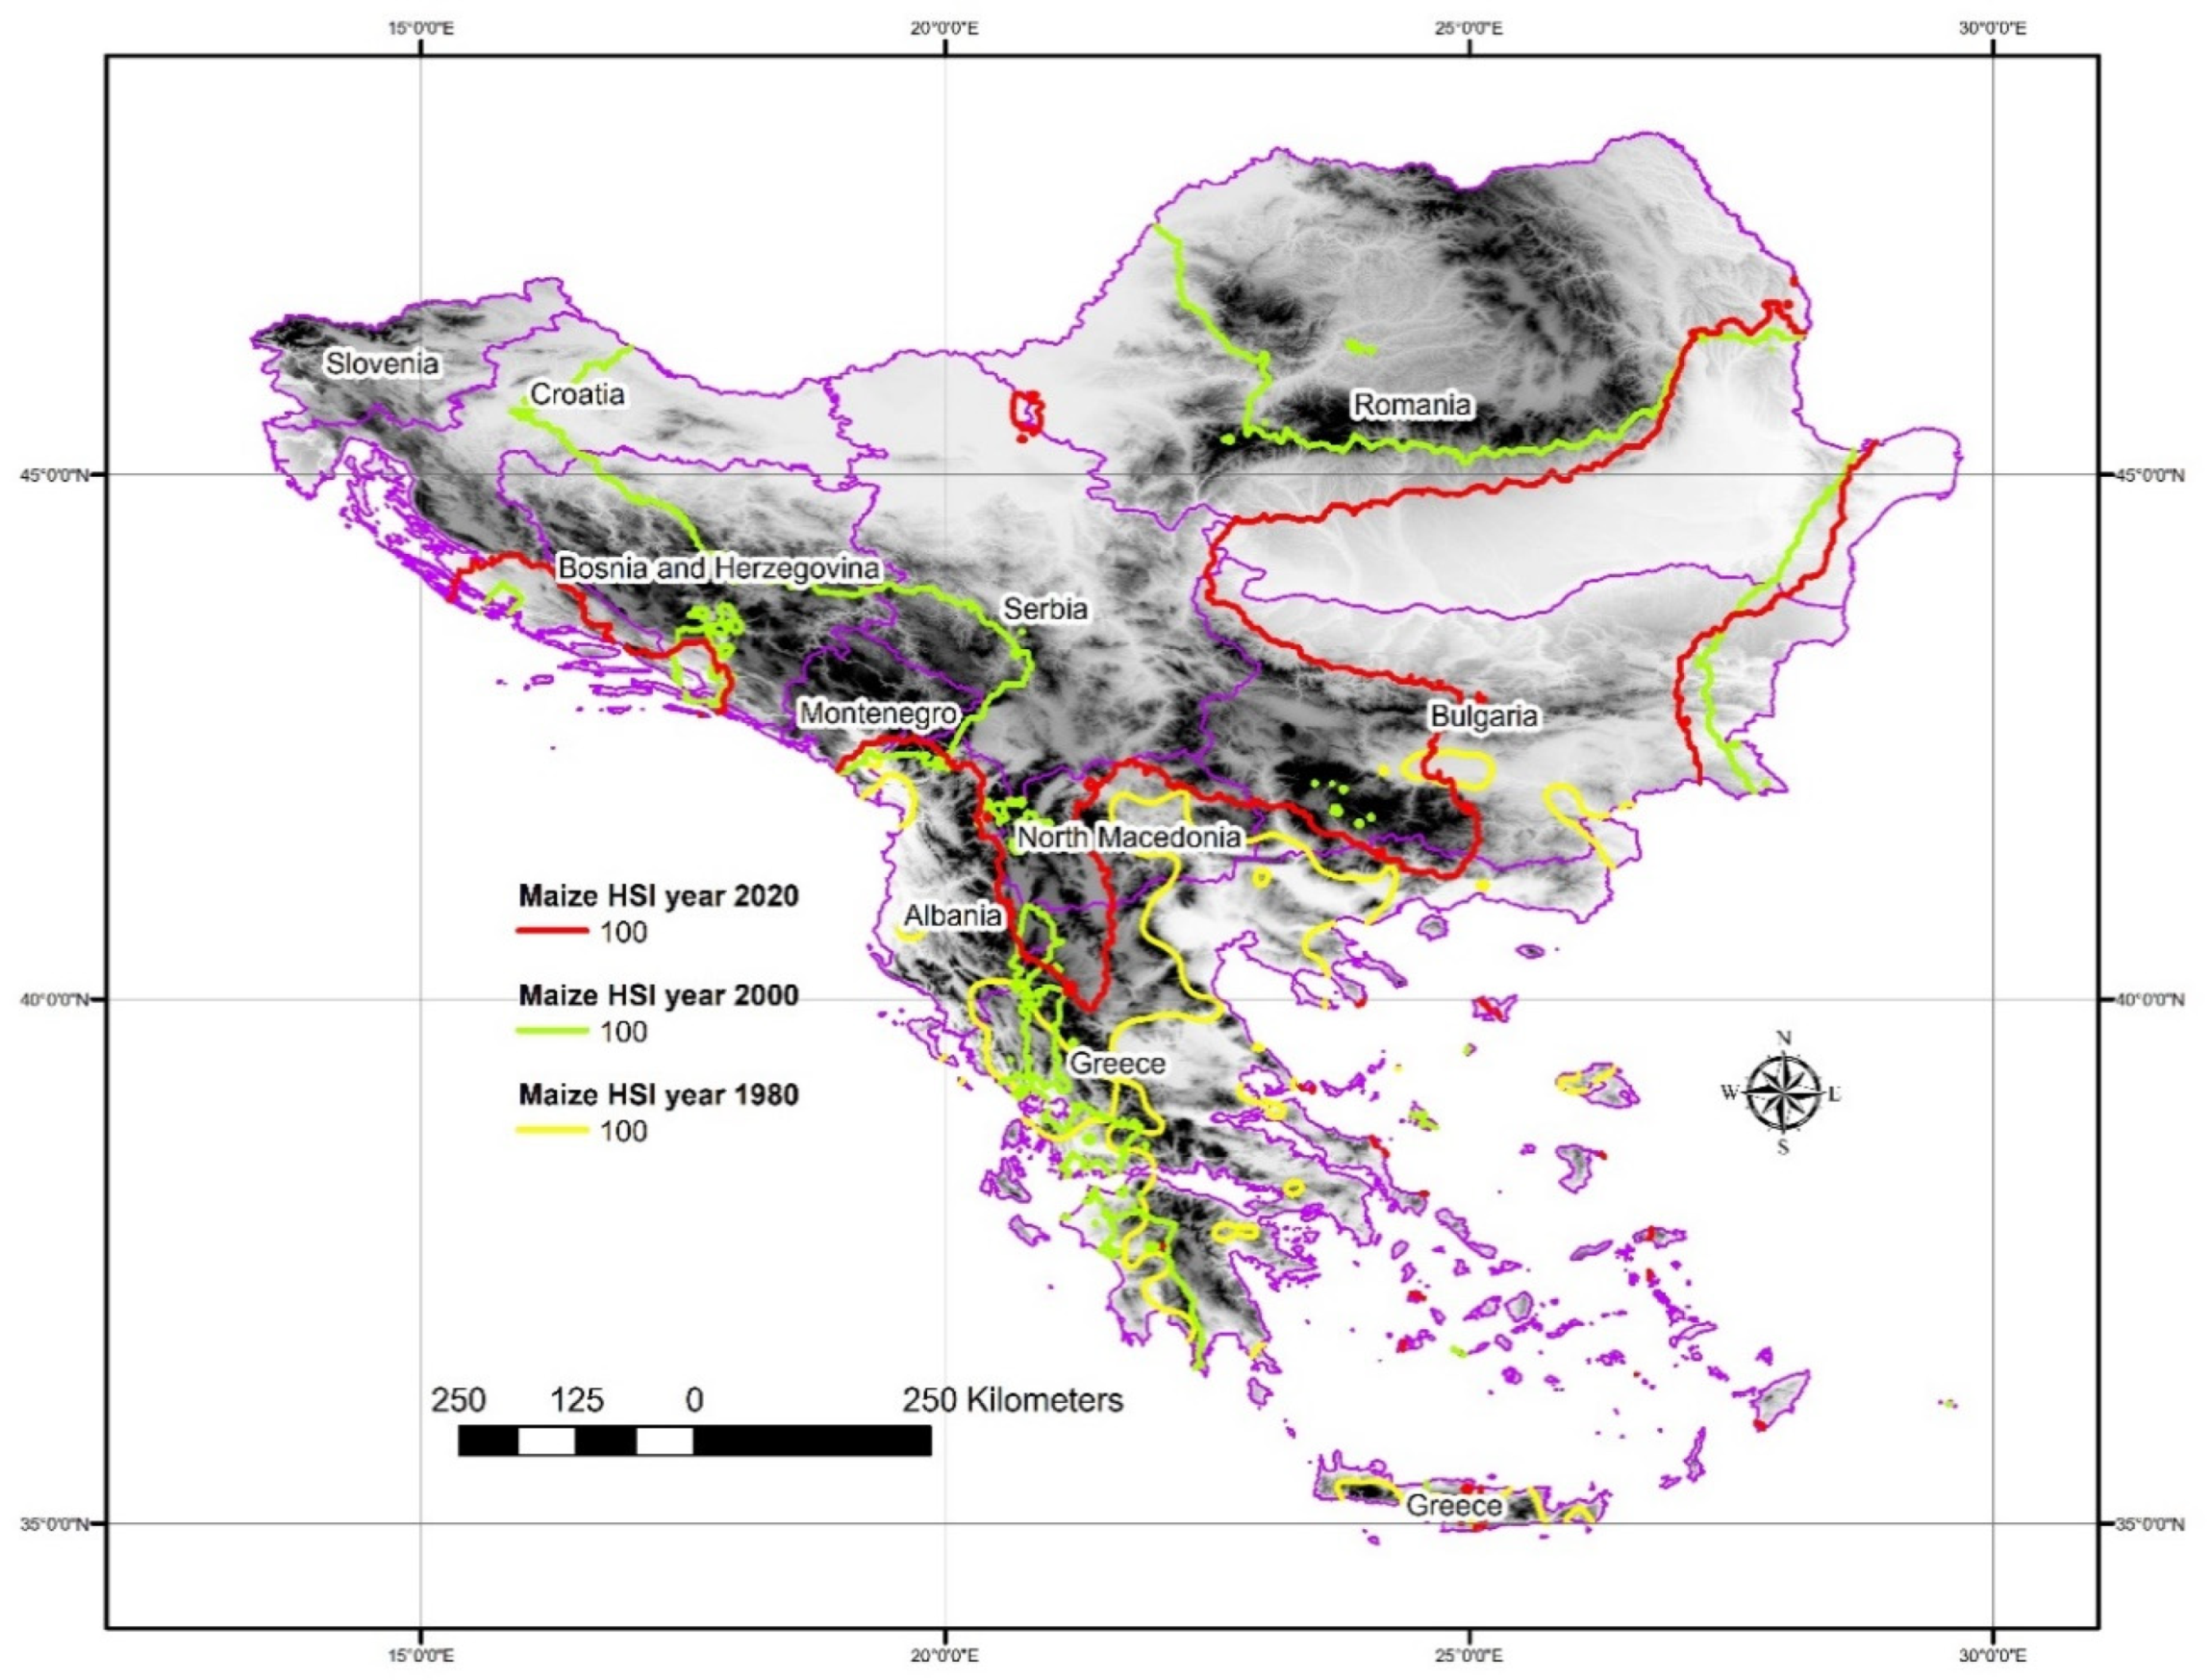
3.1.2. Maize Heat Stress Index (HSI)

The Growing Degree Days is an indicator of the climatic suitability of a place for cultivation when Heat Stress Index is an indicator of thermal climatic restriction. Figure 4 presents the spatial distribution of HSI over the study area for the year 2020, along with the trend of this index calculated by the 1978 to 2020 dataset.
The high values of HSI indicate more stress for maize cultivation because temperature above the threshold of 30 °C it can negatively affect key plant processes such as grain filing, resulting in reduced biomass and yield [6]. Maize cultivation faces stressful conditions over the Albanian coastal area, the southern part of Greece and over the eastern borders of Bulgaria and Greece. Also, there is a spot of high HSI values in north-central Greece. Considering the map of the righthand side of Figure 4, it is obvious that the areas with high HSI values have a higher trend to become more stressful for maize cultivation. The only negative trend areas are located in eastern Greece over the Aegean Sea’s islands and the half of eastern Crete. Also, the negative trend is considerably lower than the positive trend of the HSI, provided that the trend direction does not change. Combining the two maps of Figure 4, we can form a general estimation about the potential future pressure for maize cultivation in the near future. It is clear that the eastern part of Greece and coastal Albania will face stressful agrometeorological conditions for the specific cultivation, especially considering a potential future shortage of irrigation water.
Figure 5 presents the spatiotemporal distribution of the HSI index for the study area, revealing a clear evolution.
The selected isoline of the 100 HSI units reveals a connection of this indicator with the altitude and probably with the latitude. We can see that the higher pressure for the maize due to high air temperature is exerted at the lower (in terms of altitude) areas of the Balkans and the south of Greece and Albania. Moreover, the valley of Donau (between Romania and Bulgaria) faces a high pressure of rising temperatures during the maize cultivation season. The temporal shifting of the 100 HSI units isoline is not so straightforward as in the case of GDD, but there is also a clear spatial sprawl to northern and higher areas of the Balkan’s peninsula.

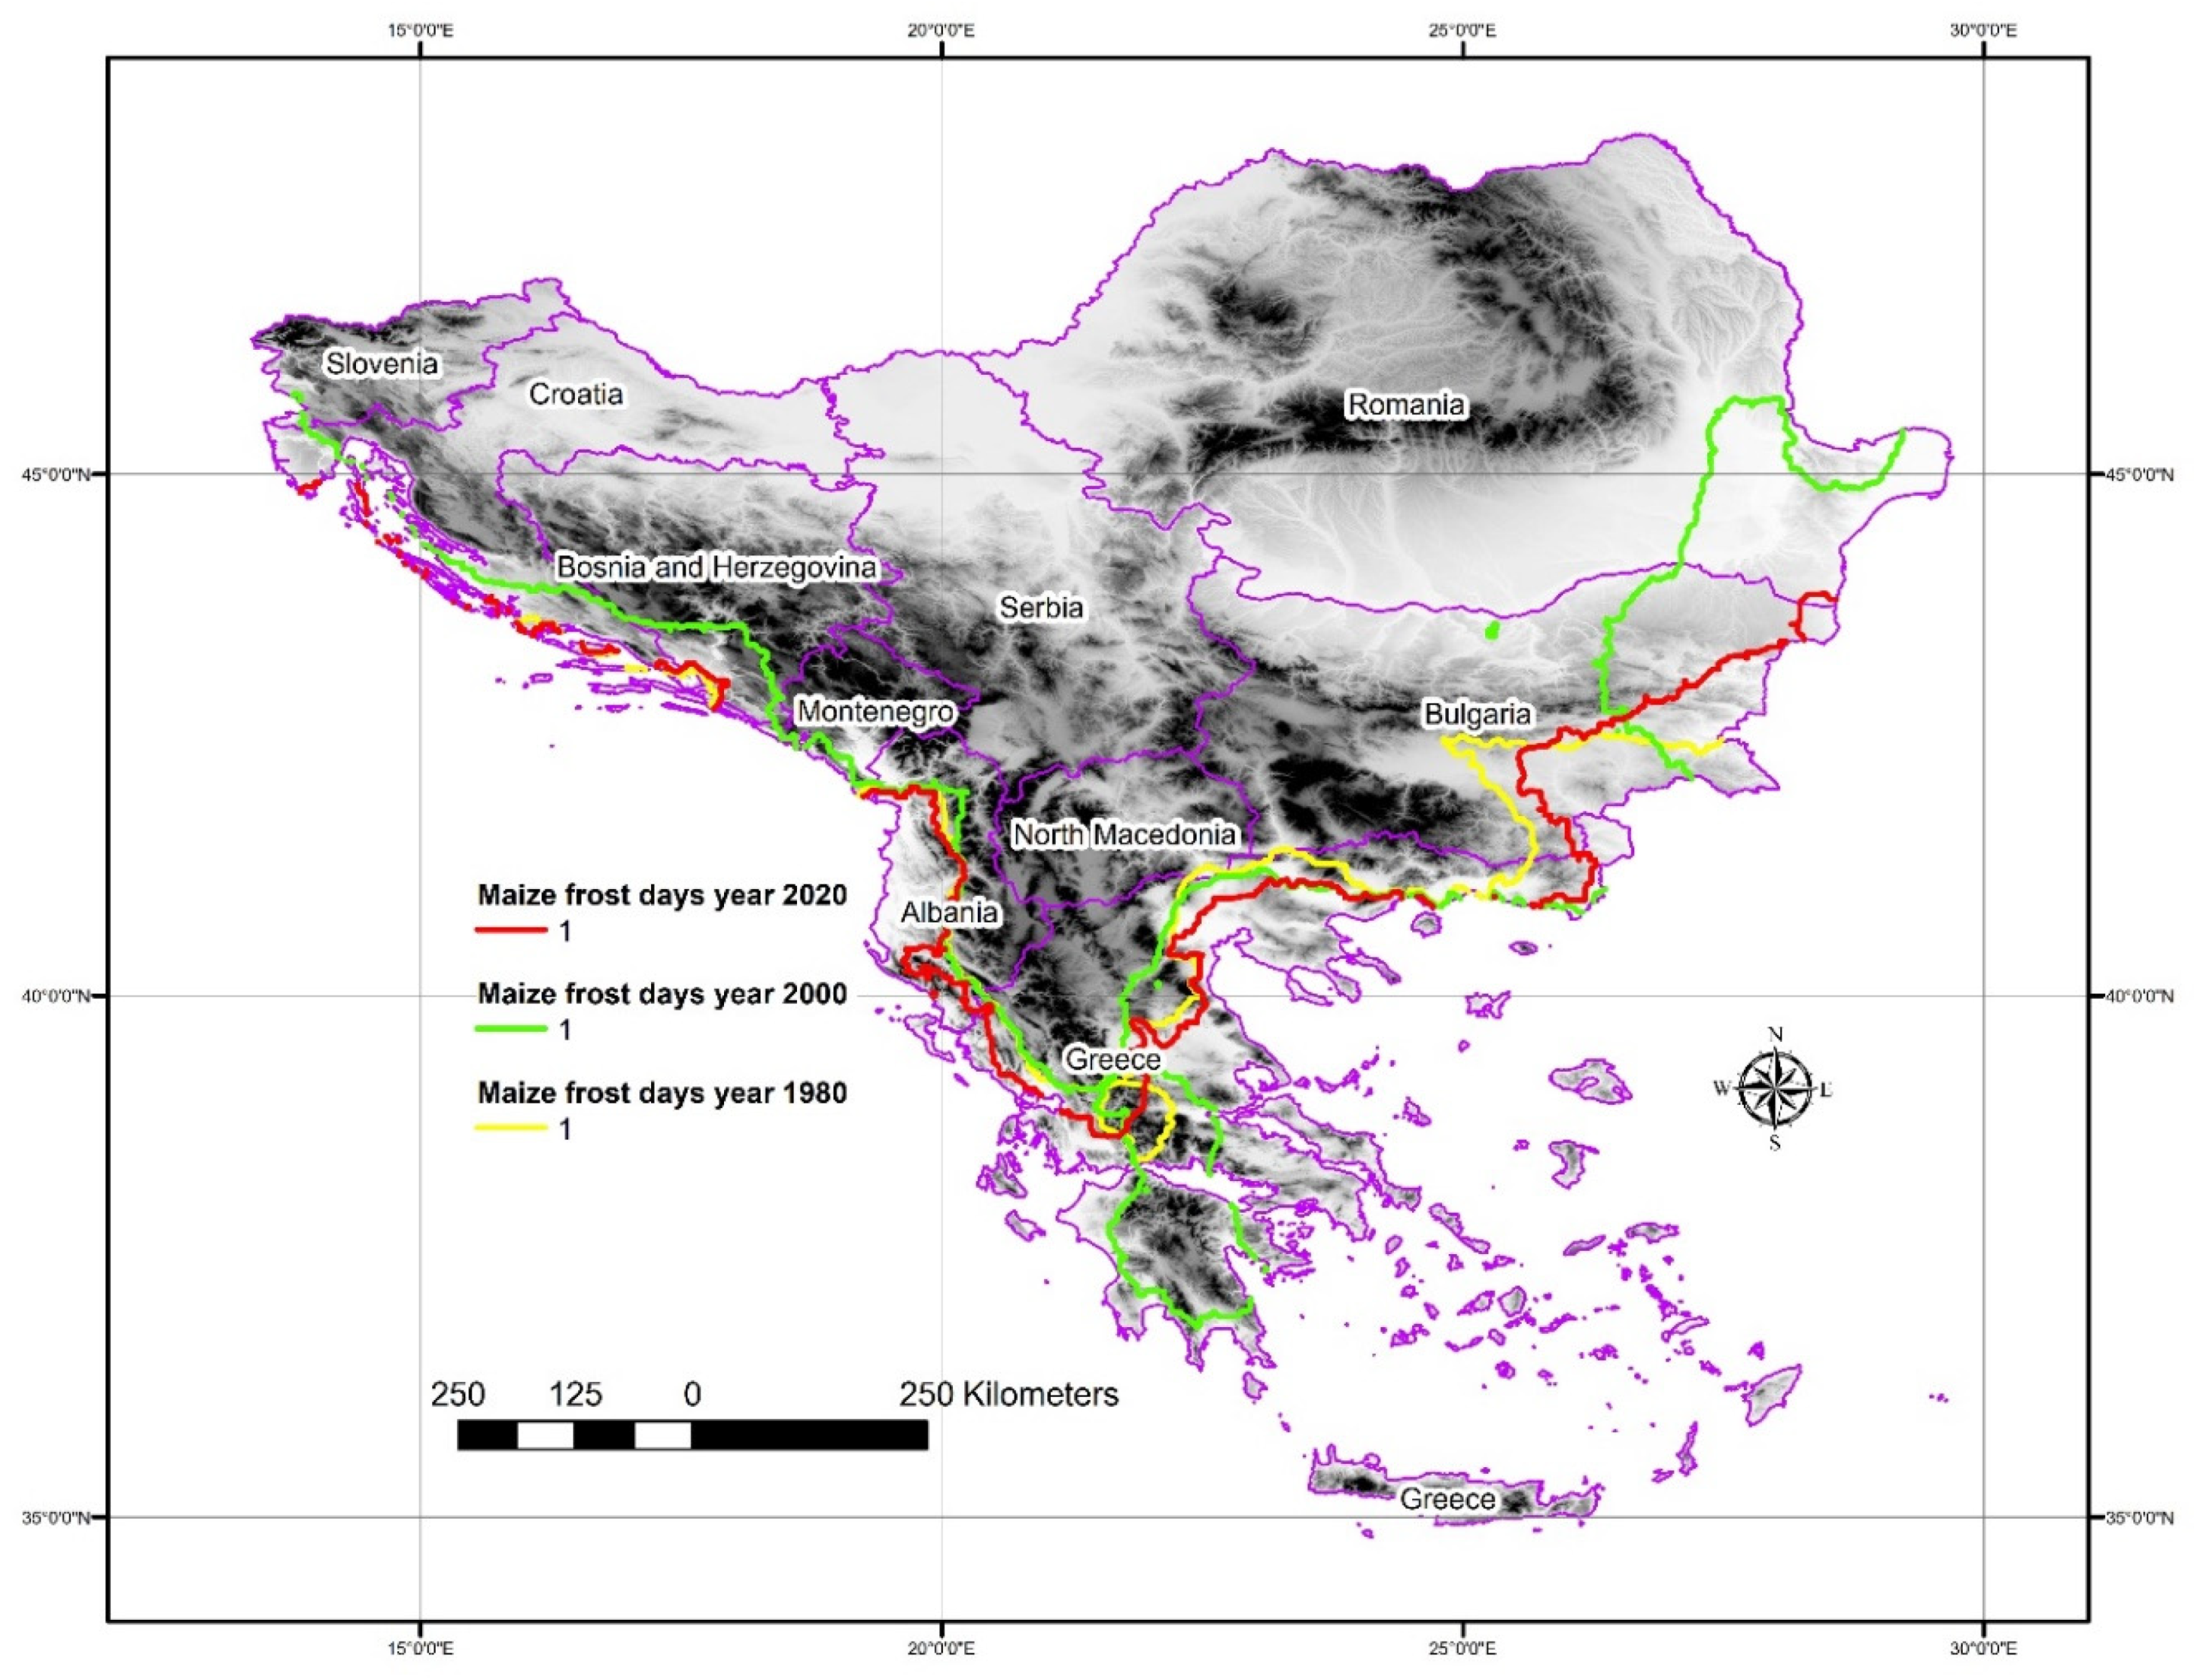
3.1.3. Maize Frost Days (FD)

Another well-known and examined restriction factor for the cultivation of maize is frost. It can cause severe damages to the plants’ growth process and can drive to a drastically reduced yield. The frost days in the year 2020 and their trend (calculated from 1978 to 2020) are presented in Figure 6.
The regions without frost incidents during the maize cultivation period for the year 2020 is the southeastern part of Greece. In contrast, the most harmful conditions in terms of frost occurred over the northern part of Romania and the mountainous area on the borders of Serbia and Montenegro. In connection with the spatial distribution of the frost trend, we can assume that the frost risk is getting lower because of the negative trend across the studied area. The exceptions of this negative trend occurred only in some coastal areas of southern Albania and in central Romania. Despite the nearly uniform distribution of the frost trend, there are many grid points with non-significant statistical relations.
Figure 7 illustrates the spatiotemporal evolution of the frost days of the research area. The distribution of the isoline of one frost day during the maize cultivation season reveals a geographic separation between the southern and northern part of the Balkans. Despite the fuzziness of the different years’ isolines, it is evident that the frost occurrence is displaced from the coastal areas to higher altitudes and from the southern regions to the northern. Therefore, more expansive cultivation areas are under lower frost frequency over time.
Table 2 combines the medians of the calculated indices and trends per country. The higher GDD median is calculated for Greece (EL), and it is 2611 units during the maize cultivation period. The lower median (1258) is calculated for Montenegro (ME). Moreover, the trend of the GDD per country reveals a generally positive trend. The prevailing trends are close to 10 GDD units per year. That means that over the Balkan’s area, the GDD will rise in the near future, fulfilling the thermal needs of maize cultivation.
Looking at the frost days (FD), we see that the lowest median is recorded over Greece with zero days. The higher frost days were recorded over Montenegro, with 13 days as a consequence of the country’s mountainous terrain. The trend of the frost over the Balkan countries, as calculated for the period 1978 to 2020, is low when for most countries is slightly negative (except Greece, which is zero). This finding is in corroboration with other previously published studies, which found that the low temperatures and frost will be less frequent in the near future due to anticipated climate change [58,59,60].
In the above table, we see the median of the HSI index, which indicate the potential crop’s injury sustained by exposure to supra-optimal temperatures [61]. The country with the most stressful conditions is Albania, followed by Greece and Bulgaria. Conversely, the lowest HSI value is recorded over Montenegro and Slovenia with three and eight units of median HSI, respectfully. The calculated HSI trend during maize cultivation is positive for all the countries. The highest trend of maize HSI is recorded over Albania (3.51), followed by North Macedonia (3.02) and Serbia (2.58). On the other hand, Greece has a relatively low score of the HSI trend, despite its geographic position in the southeastern part of the study area.

3.2. Wheat Agroclimatic Conditions and Trends

The following subsections contain the results related to wheat cultivation from the 1st of September to the end of July. For this period, the aggregation of the thermal requirements by the GDD, the potential heat injury by the HSI and the frost days which occurred over the study area were calculated. For the above parameters, the trends were calculated along with their statistical significance.

3.2.1. Wheat Growing Degree Days (GDD)

Figure 8 shows the GDD spatial distribution over the Balkans for the year 2020 and the related trend as calculated for the period 1978 to 2020.
The 2020 GDD distribution reveals that almost the entire Greek territory is suitable for the cultivation of wheat, except for the high mountainous regions. Half of Albania is above the 3000 GDD units annually, and the coastal zone reaches 4000 GDD units. Also, a wide area on the eastern part of the map covering almost all Bulgaria and the southern half of Romania outreaches 2000 GDD units. The regions below the critical limit of the 2000 GDD units are the higher altitude areas of Montenegro, Bosnia and Herzegovina, Slovenia, and the Carpathians in Romania. So, it is easy to conclude that the GDD is not a restriction factor for the cultivation of wheat in the Balkans. The trend’s distribution (right) indicates high positive values over the entire area. The higher values can be found in coastal Croatia and Albania and the lower over southern and western Bulgaria.
Figure 9 depicts the spatiotemporal transposition of the isoline of 2000 GDD units from 1980 to 2020. It is evident that the shifting of the selected isoline is profound from 1980 to 2000 and subtle from 2000 to 2020. This spatial behaviour is similar to the findings of recent studies [43,62,63].
Examining Figure 9 in detail, it is clear that the only regions in which the GDD units are lower than 2000 are the mountainous areas of the Dinaric Alps parallel to the Adriatic coast, the Balkan Mountains in the southern part of Bulgaria and almost the entire Carpathians. Thus, all the agricultural regions of the study area are suitable for wheat cultivation in terms of GDD. Considering the calculated trends of the GDD, in the near future (provided that the trends will remain as calculated), the GDD climatic suitability will expand the ability to cultivate wheat in high altitude areas of the Balkans’ peninsula.

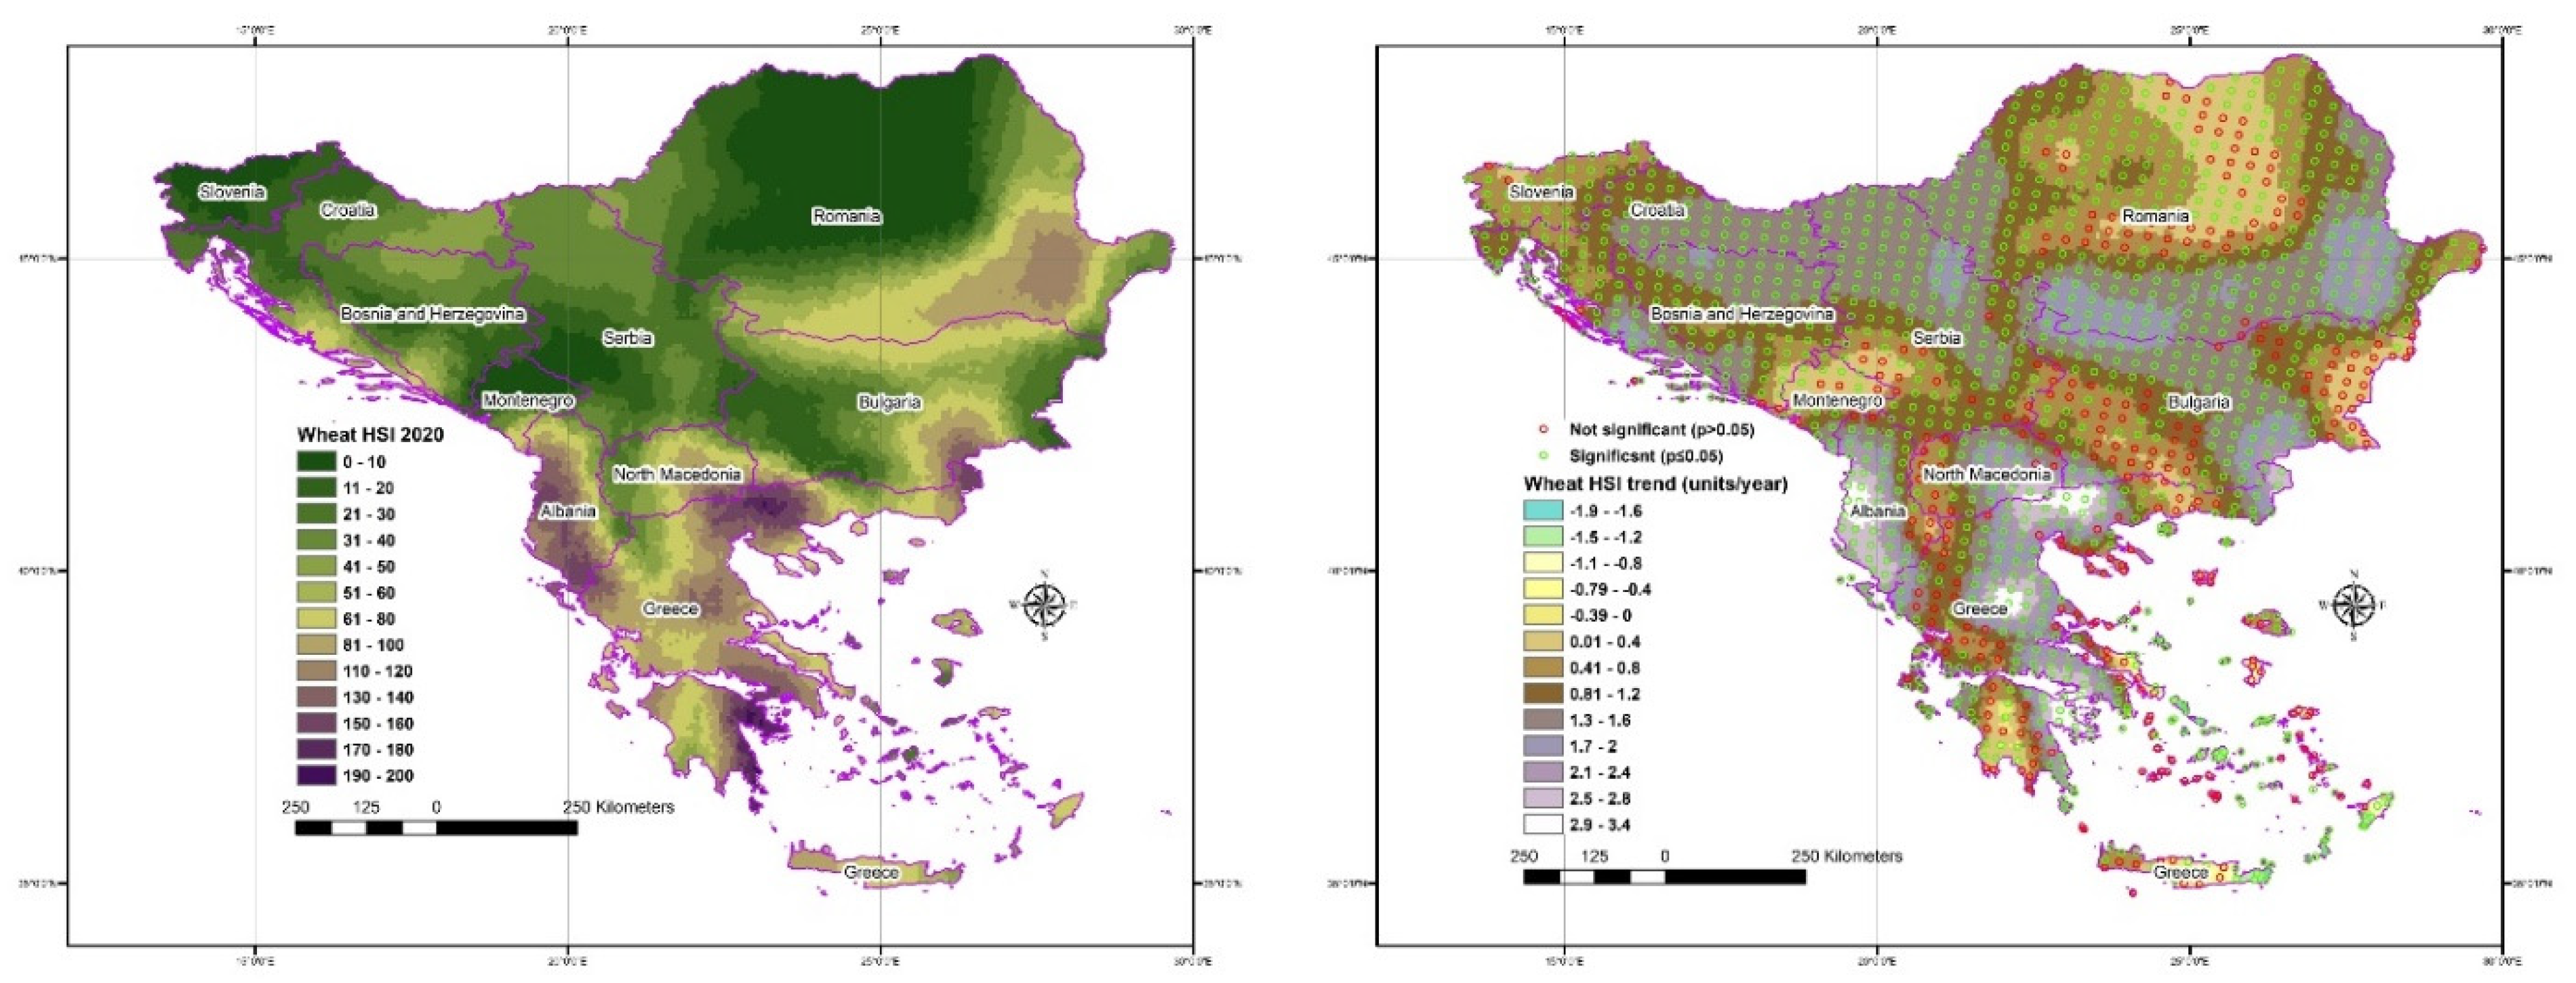
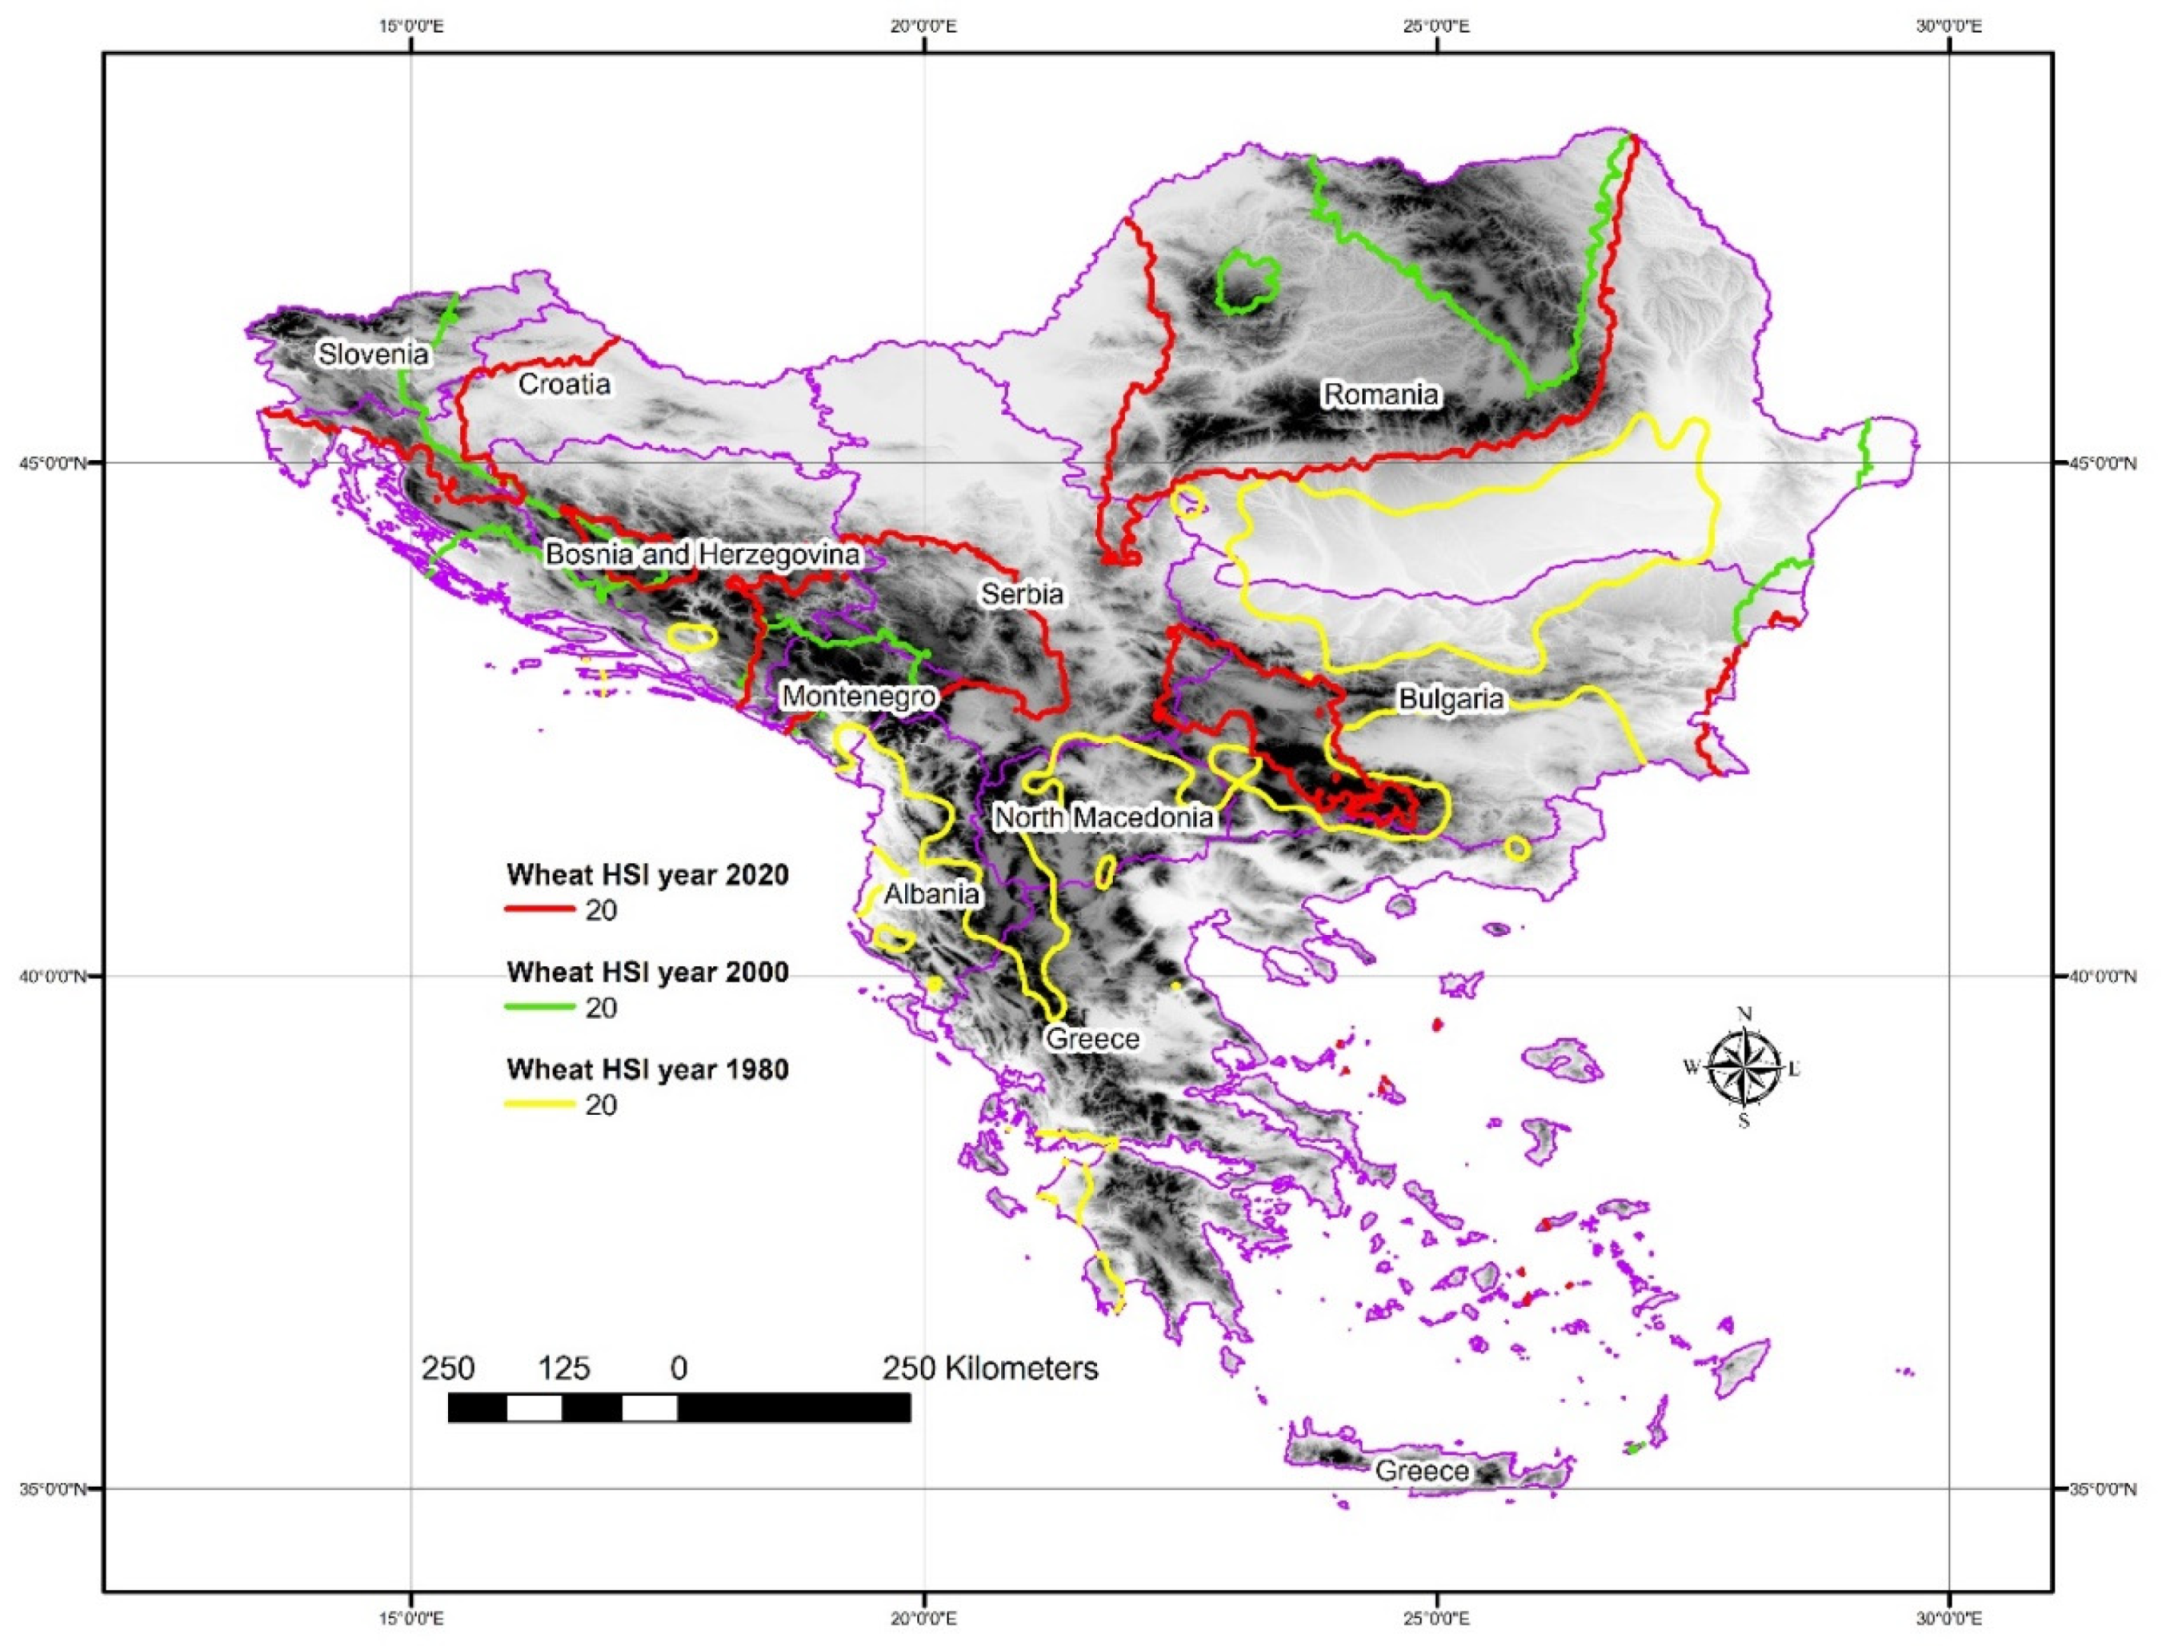
3.2.2. Wheat Heat Stress Index (HSI)

Figure 10 presents the potential thermal injury (HSI) of wheat, making it evident that the risk is lower in the northern part of the Balkan’s area. Almost the entire part of Greece and Albania are under pressure, caused by the frequent occurrence of temperatures exceeding the value of 30 °C. Besides, over the Danubian Lowland, during 2020, aggregated HSI higher than 60 units which is a signal of pressure over this agricultural area due to potential heat stress conditions.
In conjunction with the above findings, the HSI trend in Figure 10 (right) shows that the thermal conditions will aggravate wheat cultivation. We see that the trend is positive everywhere (except a part of eastern Crete and some islands of the Southeastern Aegean Sea) by considering the higher trend values over the places with the higher HSI units. This emerging condition will probably drive to a higher aquatic demand for wheat cultivation, a finding supported by previous studies [64,65,66]. Figure 11 reveals a not so clear spatial pattern of 20 units of HSI but shows the apparent tense, which is in accordance with the general behaviour of the thermal conditions of the area.
What can at least be concluded from this set of maps, is that there is a rapid HSI rising from the lower and southern to the higher and northern areas.

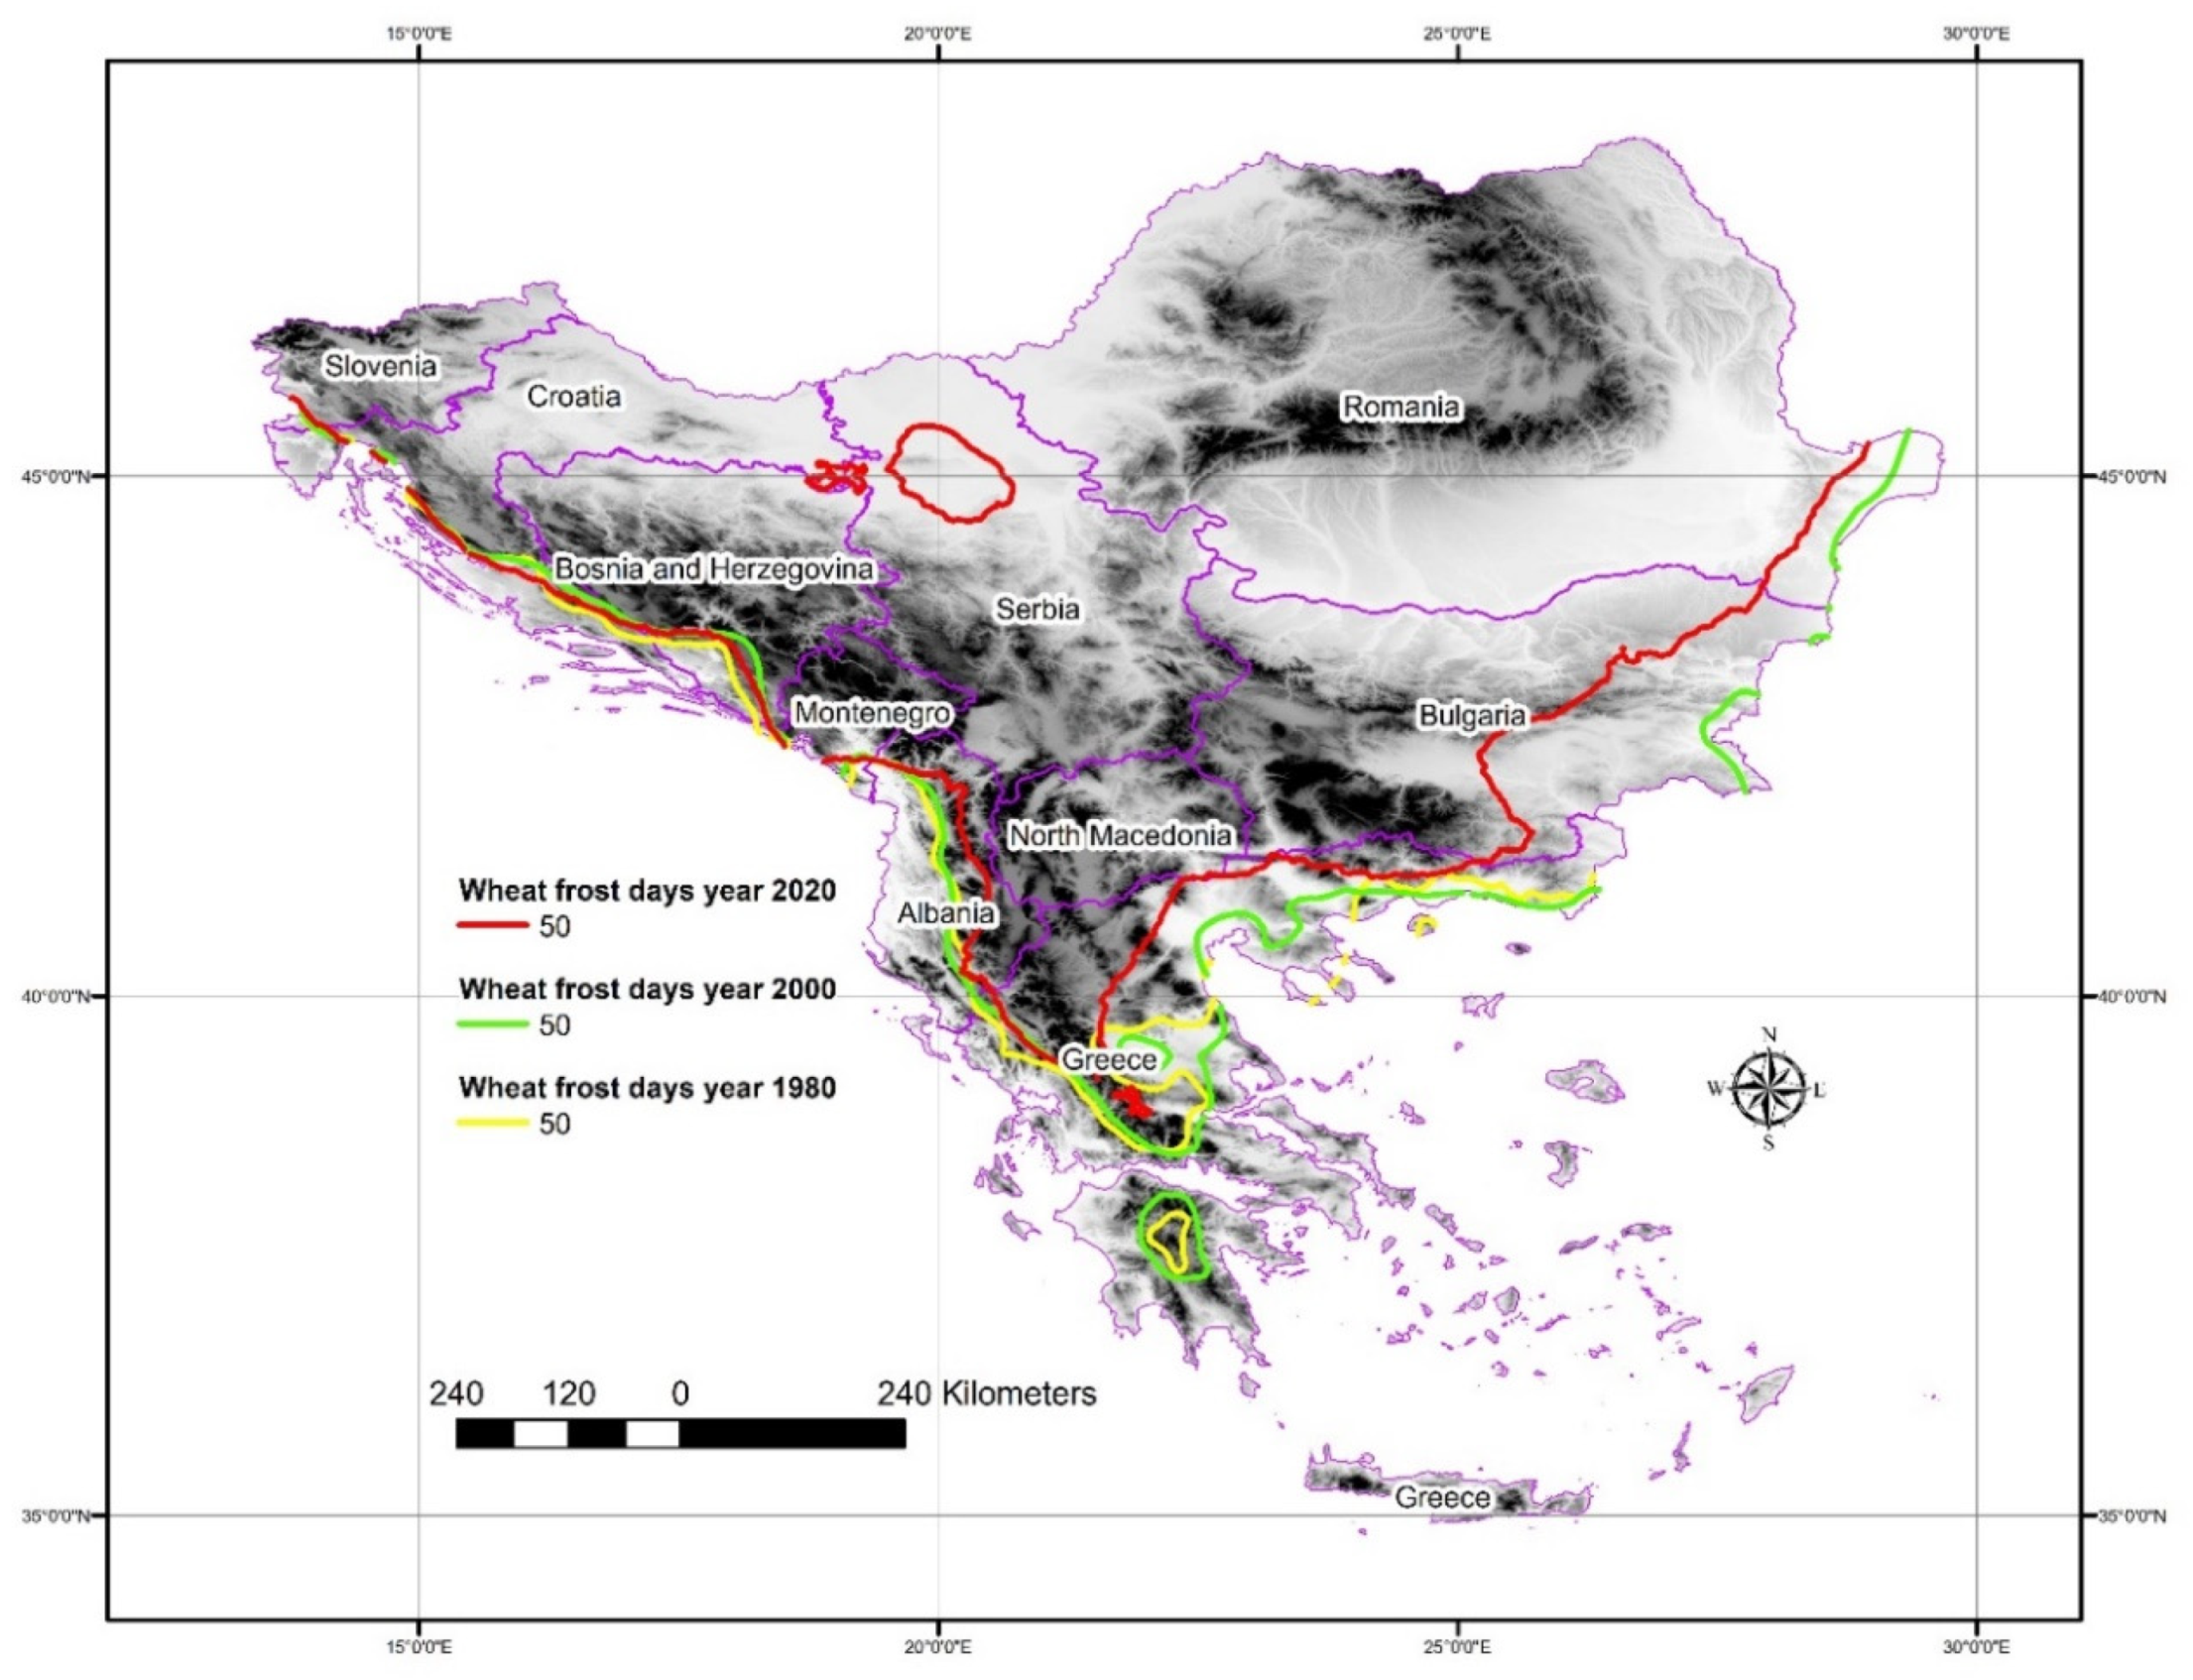
3.2.3. Wheat Frost Days (FD)

Figure 12 shows the frost days during the cultivation period in the year 2020 and the frost trend calculated from 1978 to 2020. It is evident that there is a belt from southern Greece to the Adriatic coast in which the occurrence of frost is not frequent (0 to 10 days per year). The risk of frost is higher with the transition from the shoreline to the continental areas. In the Danubian lowland, the frost can reach 60 days per cultivation period which is a high restriction factor, a finding which is in line with previous studies [67,68,69]. Considering the frost trend, we see that the frost occurrence will be less frequent in the near future over most of the study area.
The only region with a positive frost trend is coastal Albania and the eastern part of Crete island. The other areas, especially those at high altitude, show a high negative trend, which is consistent with the findings of climate change studies [20,39,70,71].
Figure 13 illustrates the spatiotemporal shift of the isoline of 50 frost days during the wheat cultivation period. The pattern is clear but not straightforward.
To be more precise, the spatial shifting is not so dramatic as in the case of HSI and GDD distributions. In some places, the trend is not so clear, or it is in the reverse direction compared with the cases of GDD and HSI.
Table 3 presents the median values of the aforementioned parameters (per country) and their trends. The higher GDD during the wheat cultivation period is accumulated over Greece (3511 units), followed by the GDD recorded in Albania (2898 units), when the lower GDD in country-level is recorded in Montenegro (1653 units), as a consequence of the mountainous terrain. The trend’s median is positive for all the studied countries with the highest score in Croatia with 12.7 GDD units/yr. The lowest trend is recorded in the Montenegro territory with 7.2 GDD units/yr.
In terms of frost days during wheat cultivation, we see that the highest frequency was recorded in Montenegro (89 d) and Slovenia (87 d) and the lowest in Greece (3 d). The median trend is negative everywhere, with the higher reduction rate recorded in Bosnia & Herzegovina (−0.91 d/yr) and the lower in Greece (0.18 d/yr). The higher median values for 2020 of the HSI were calculated in Albania (78 units) and the lowest in Montenegro (3.0 units).
The trend of HSI is positive for all the countries, indicating an increased risk of thermal injuries for wheat as time passes. The higher trend value is calculated for Albania and North Macedonia with 1.77 units/yr and 1.51 units/yr, respectively. Opposingly, the lowest score of 0.22 units/yr is calculated for Montenegro.

3.3. Annually Calculated Frost Parameters

To evaluate the agroclimatic trends and the agrometeorological conditions over the Balkan region, three more frost parameters were calculated annually. The last spring frost (LSF) is the last frost day before the summer. It is considered the beginning of the cultivation period. The first autumn frost (FAF) is the first frost day after the summer and the free of frost days (FFD) is the period from the LSF to FAF. The first two parameters have been calculated in Julian days and the last one in days. For a more comprehensive presentation of the agroclimatic conditions of the study area, the spatial distribution of each parameter for the year 2020, along with the trend’s spatial distribution as calculated for the period 1978 to 2020, was illustrated.

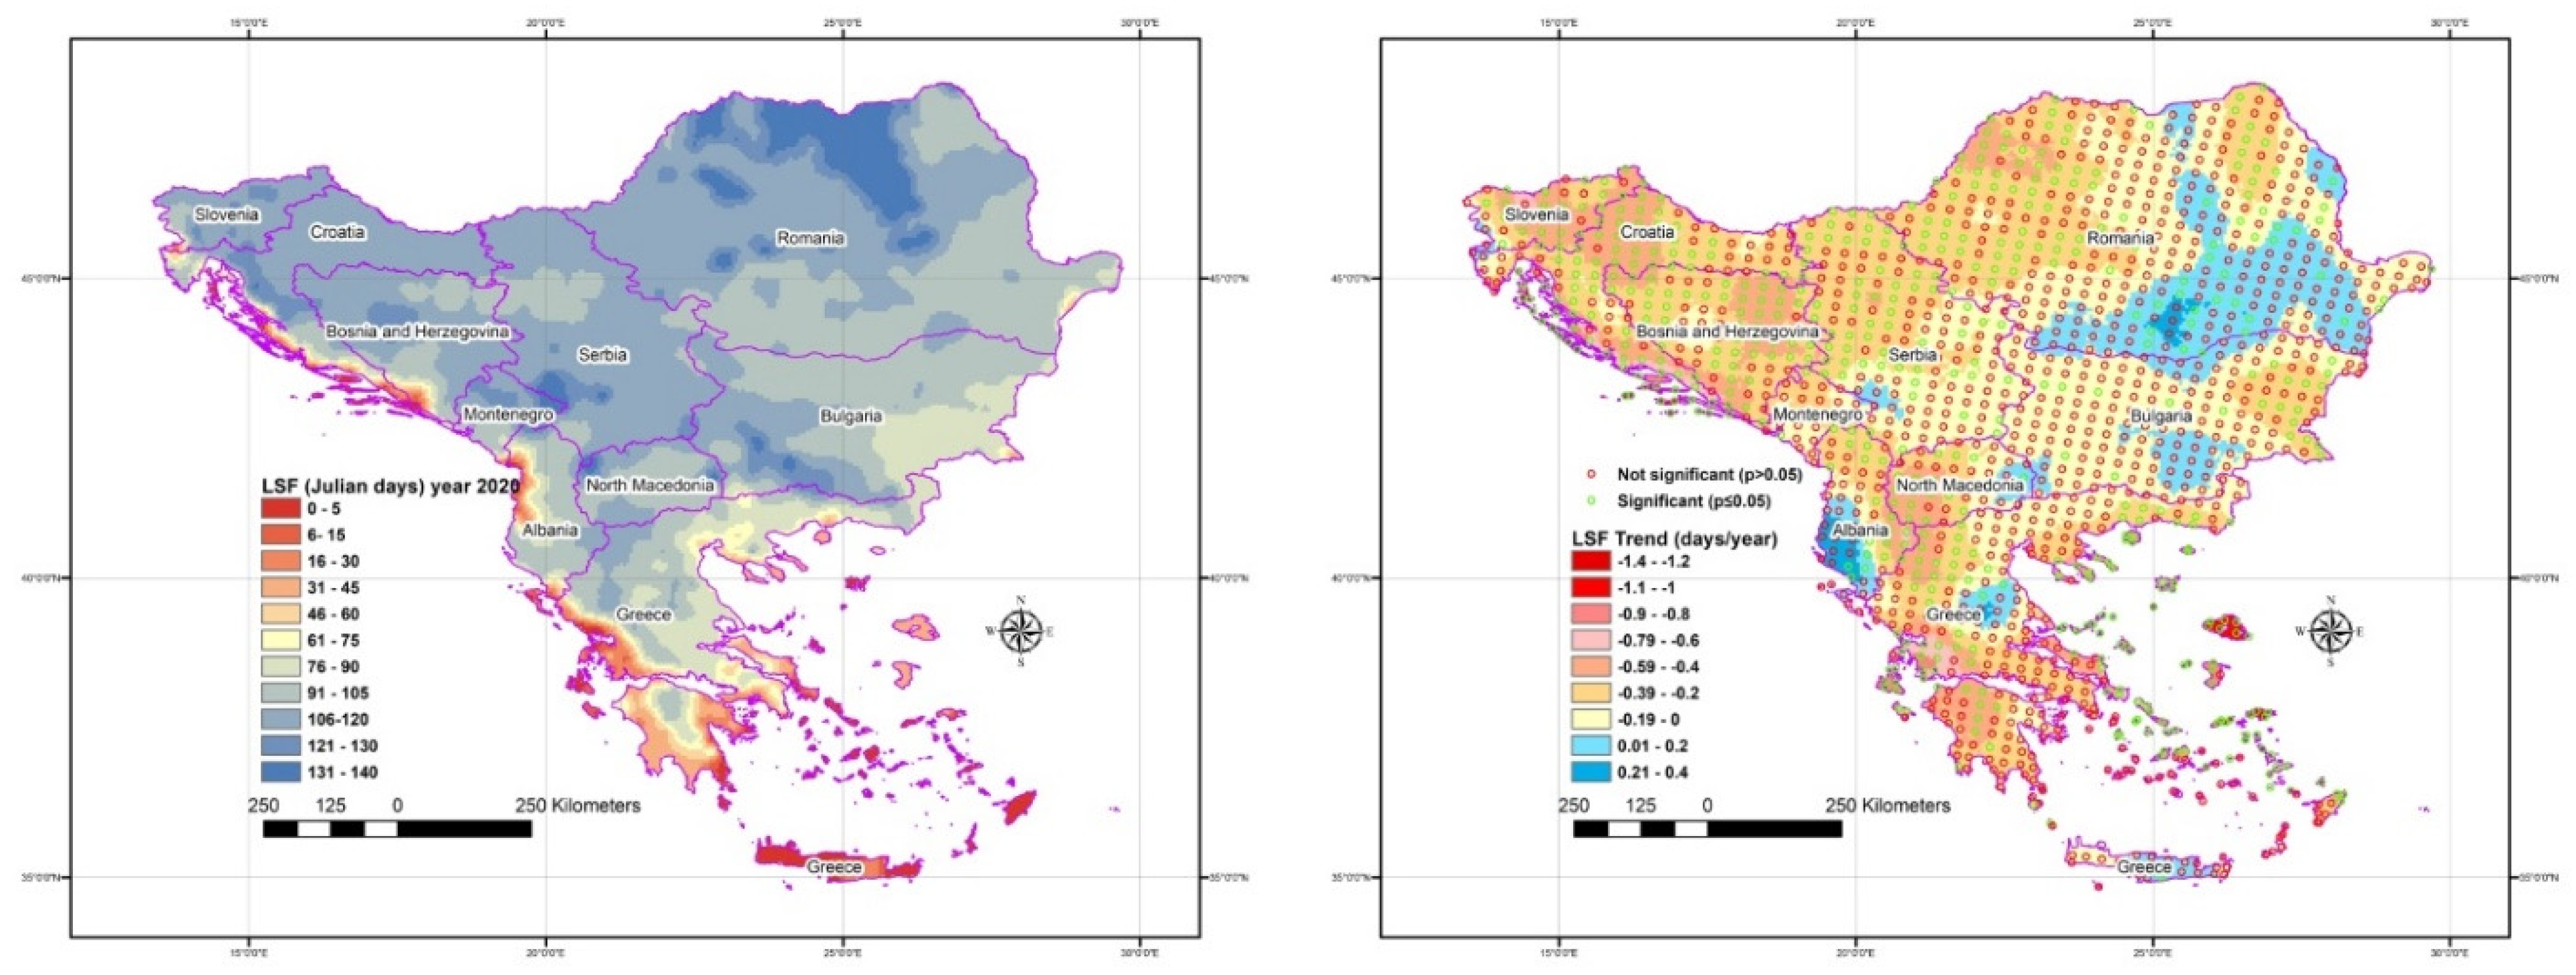
3.3.1. Last Spring Frost (LSF)

Figure 14 presents the last spring frost (LSF) in Julian days and the related trend (right). The Adriatic coast in the western part of the map is a region in which the LSF indicates an almost free of frost spring. On the opposite, there are some mountainous areas in northern Romania and in the south of Bulgaria, in which the LSF reaches the second half of May.
Considering that the spring frosts are harmful, compromising directly and indirectly yields [72,73], we see a strip of land under low spring frost risk. Combining this information with the right-hand side map, southern Albania has a positive trend from 0.01 d/yr to 0.4 d/yr. This specific area will face increased spring frost risk in the future. A similar trend is recorded over the Thessalian plain in central Greece, which is one of the most productive areas of the country in terms of agricultural production. Also, a positive LSF trend was calculated over the great Danubian plain on both sides of the Bulgarian—Romanian borders along with the Thracian basin in the southeastern part of Bulgaria. The rest of the area is under a negative trend, indicating that the risk of late spring frost will be reduced in the near future. Looking at the medians of Table 4, we see an exceptionally low value of 40 for Greece (~10 February) when for Romania, Serbia, Montenegro, Croatia and Slovenia, the median of the LSF is 106 or 107 (~15 April). The time difference between the above cases is almost two months. In terms of LSF median trends, the higher negative values that come from Croatia are followed by Greece, Bosnia—Herzegovina, and Slovenia. These countries, in general, tend to have a lower risk of late spring frost. On the other hand, the negative trend is lower over Bulgaria and Romania.

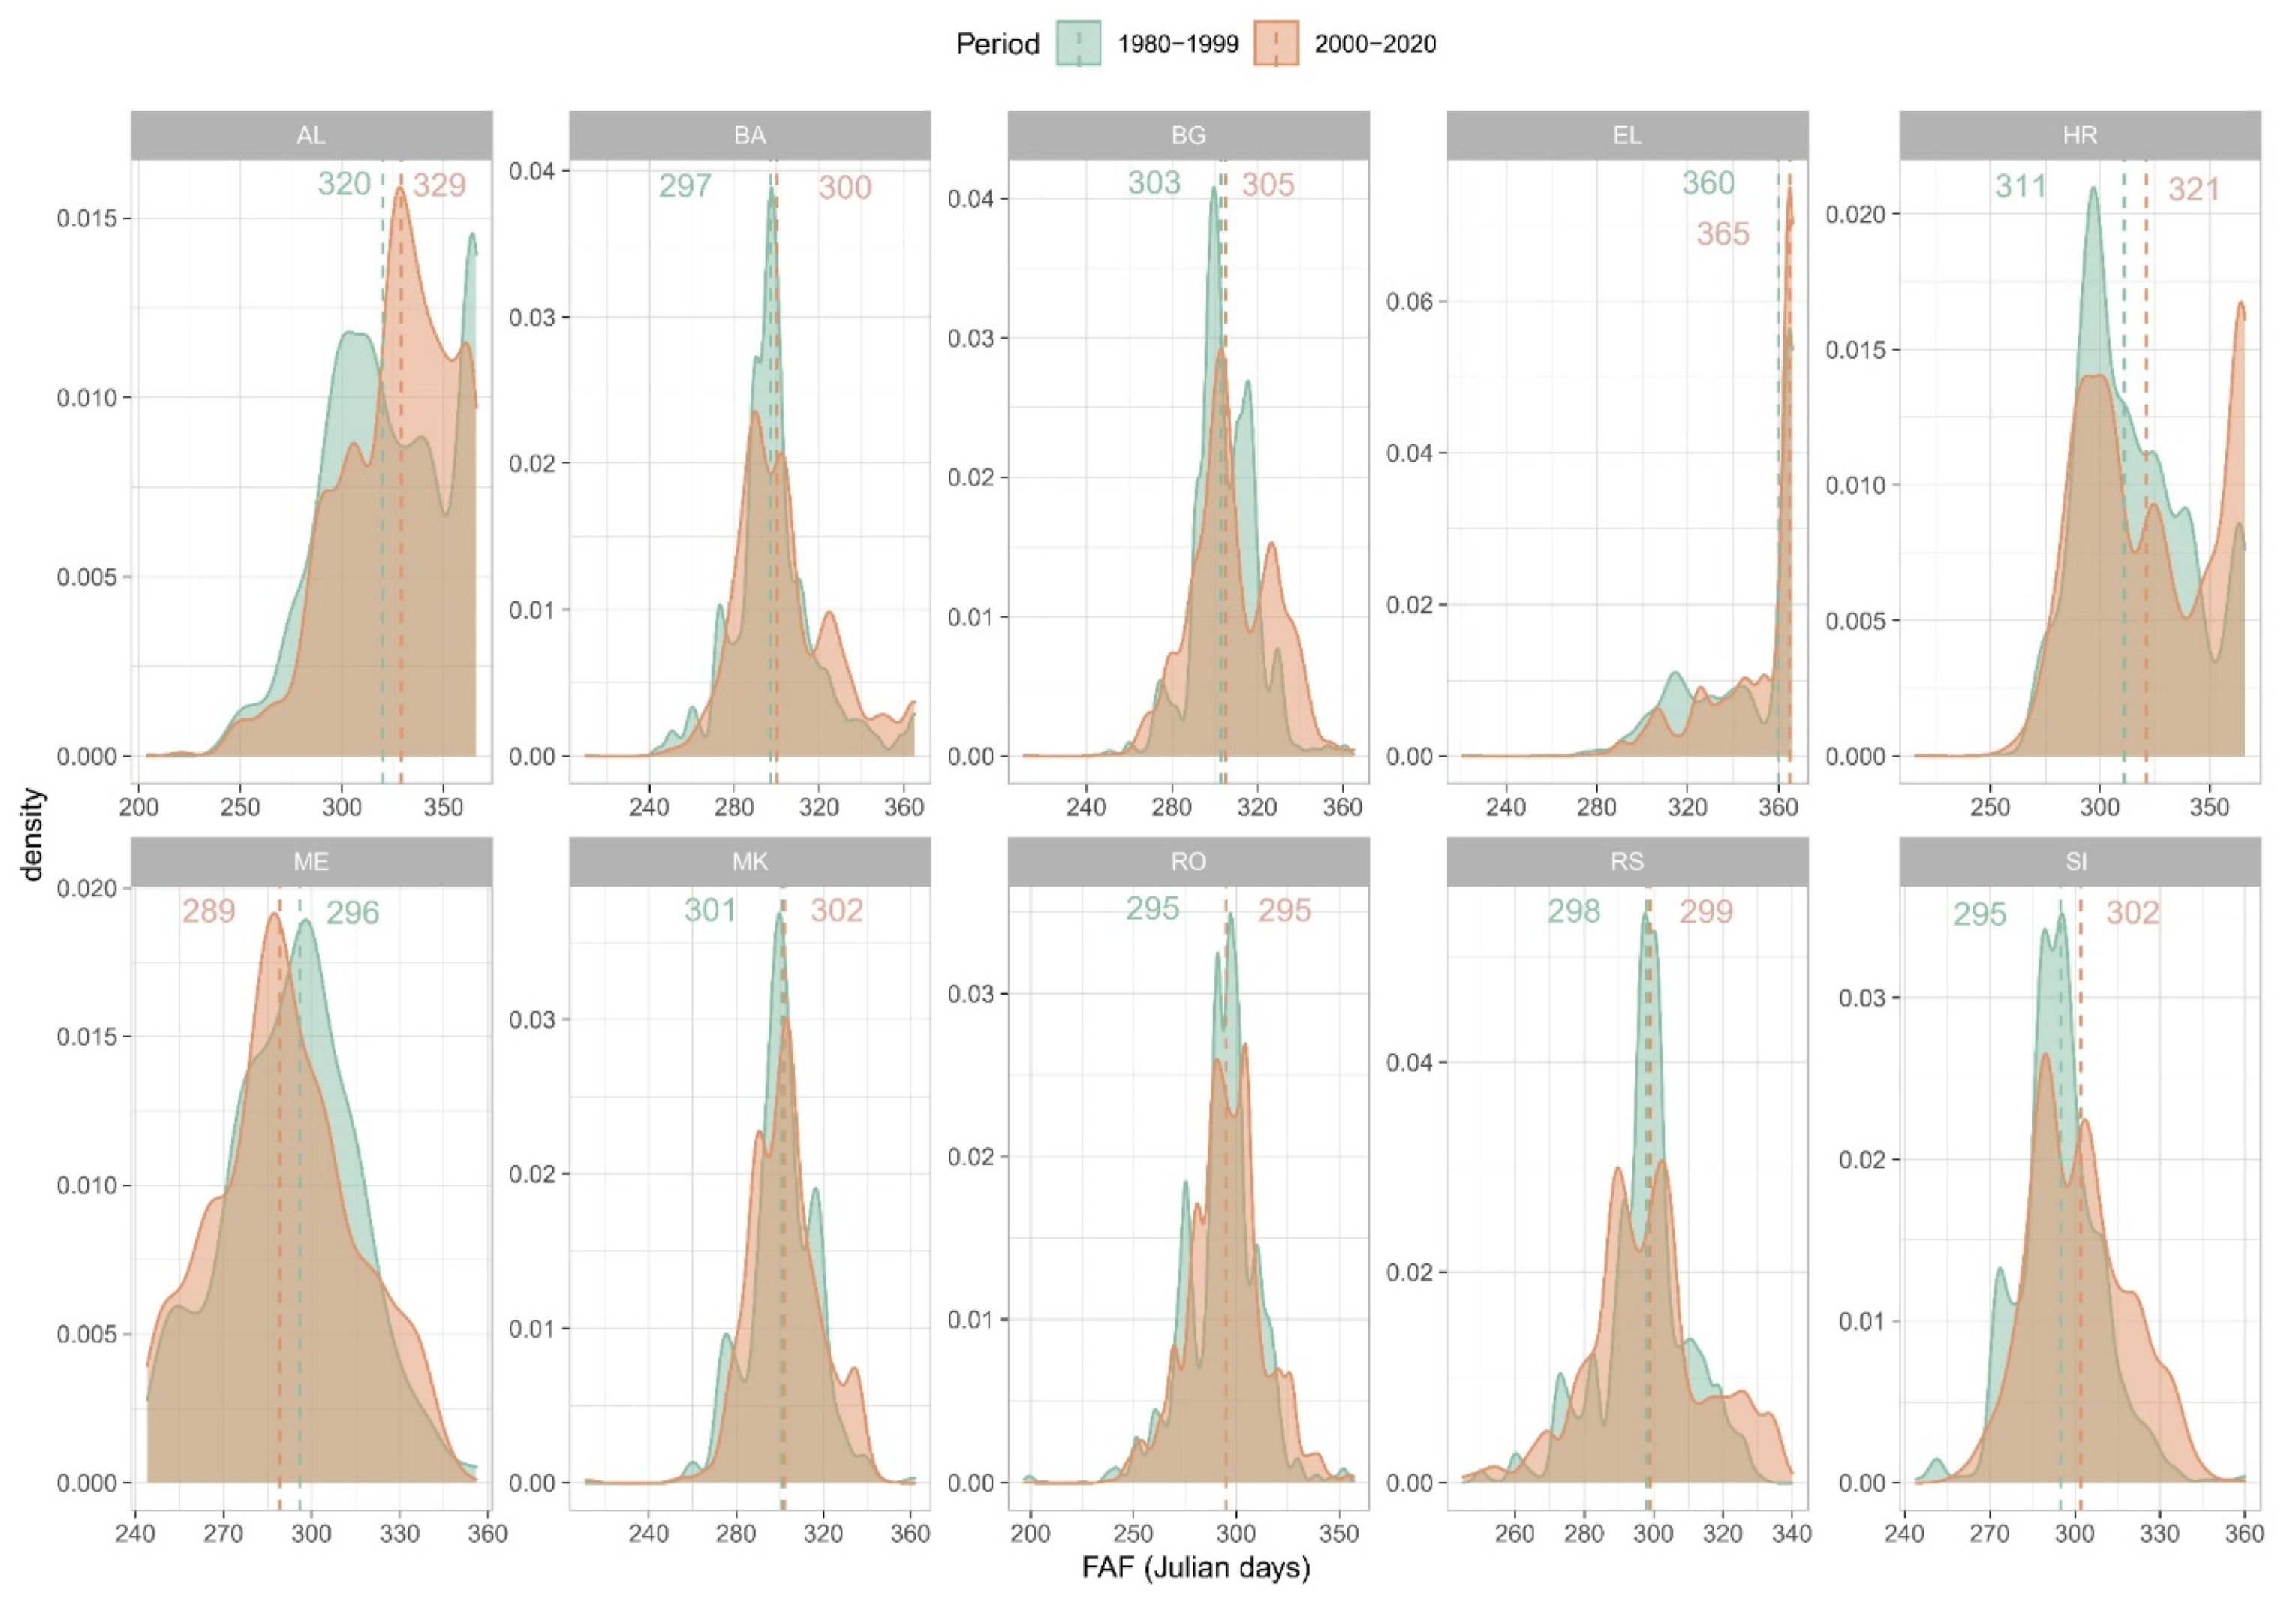
3.3.2. First Autumn Frost (FAF)

In Figure 15, the lower values of the FAF have been calculated over the Eastern Carpathian in the northern part of Romania, with the first frost occurrence in late September. Similar FAF values have been calculated over the mountainous areas of Montenegro. On the other hand, the coastal region from eastern Bulgaria to northern Croatia faces the first frost after the summer (FAF) in December.
Considering the FAF trends’ map (Figure 15), the negative values have been calculated over the southeastern Aegean Sea’s islands (Crete, Rhode, etc.), in the plain area of central Serbia and the southwestern part of Bulgaria. Over the above areas, earlier autumn frosts are expected in the near future. The opposite trend occurs in the rest areas of the Balkans. The anticipated risk of early autumn frost will be lower over most of the studied regions. However, the risk will be slightly higher over the agricultural areas, as illustrated by the green and blue colors of the right map. Considering the median values of the FAF (Table 4), we see that Greece scores a value of 328 (~24 November), while the lowest value is calculated for Montenegro with 293 (~20 October).
Regarding the FAF trends, the values are positive in all cases, with the highest trend calculated for Greece (0.34 d/yr) and the lowest in Serbia (0.01 d/yr). As we see in the right map, the trend is clear but often non-significant, a finding which is in line with the related finding of the research of Wypych et al. [42] for the frost in central Europe. The generalized result is that the first autumn frost shifts to the cold period, extending the cultivation period.

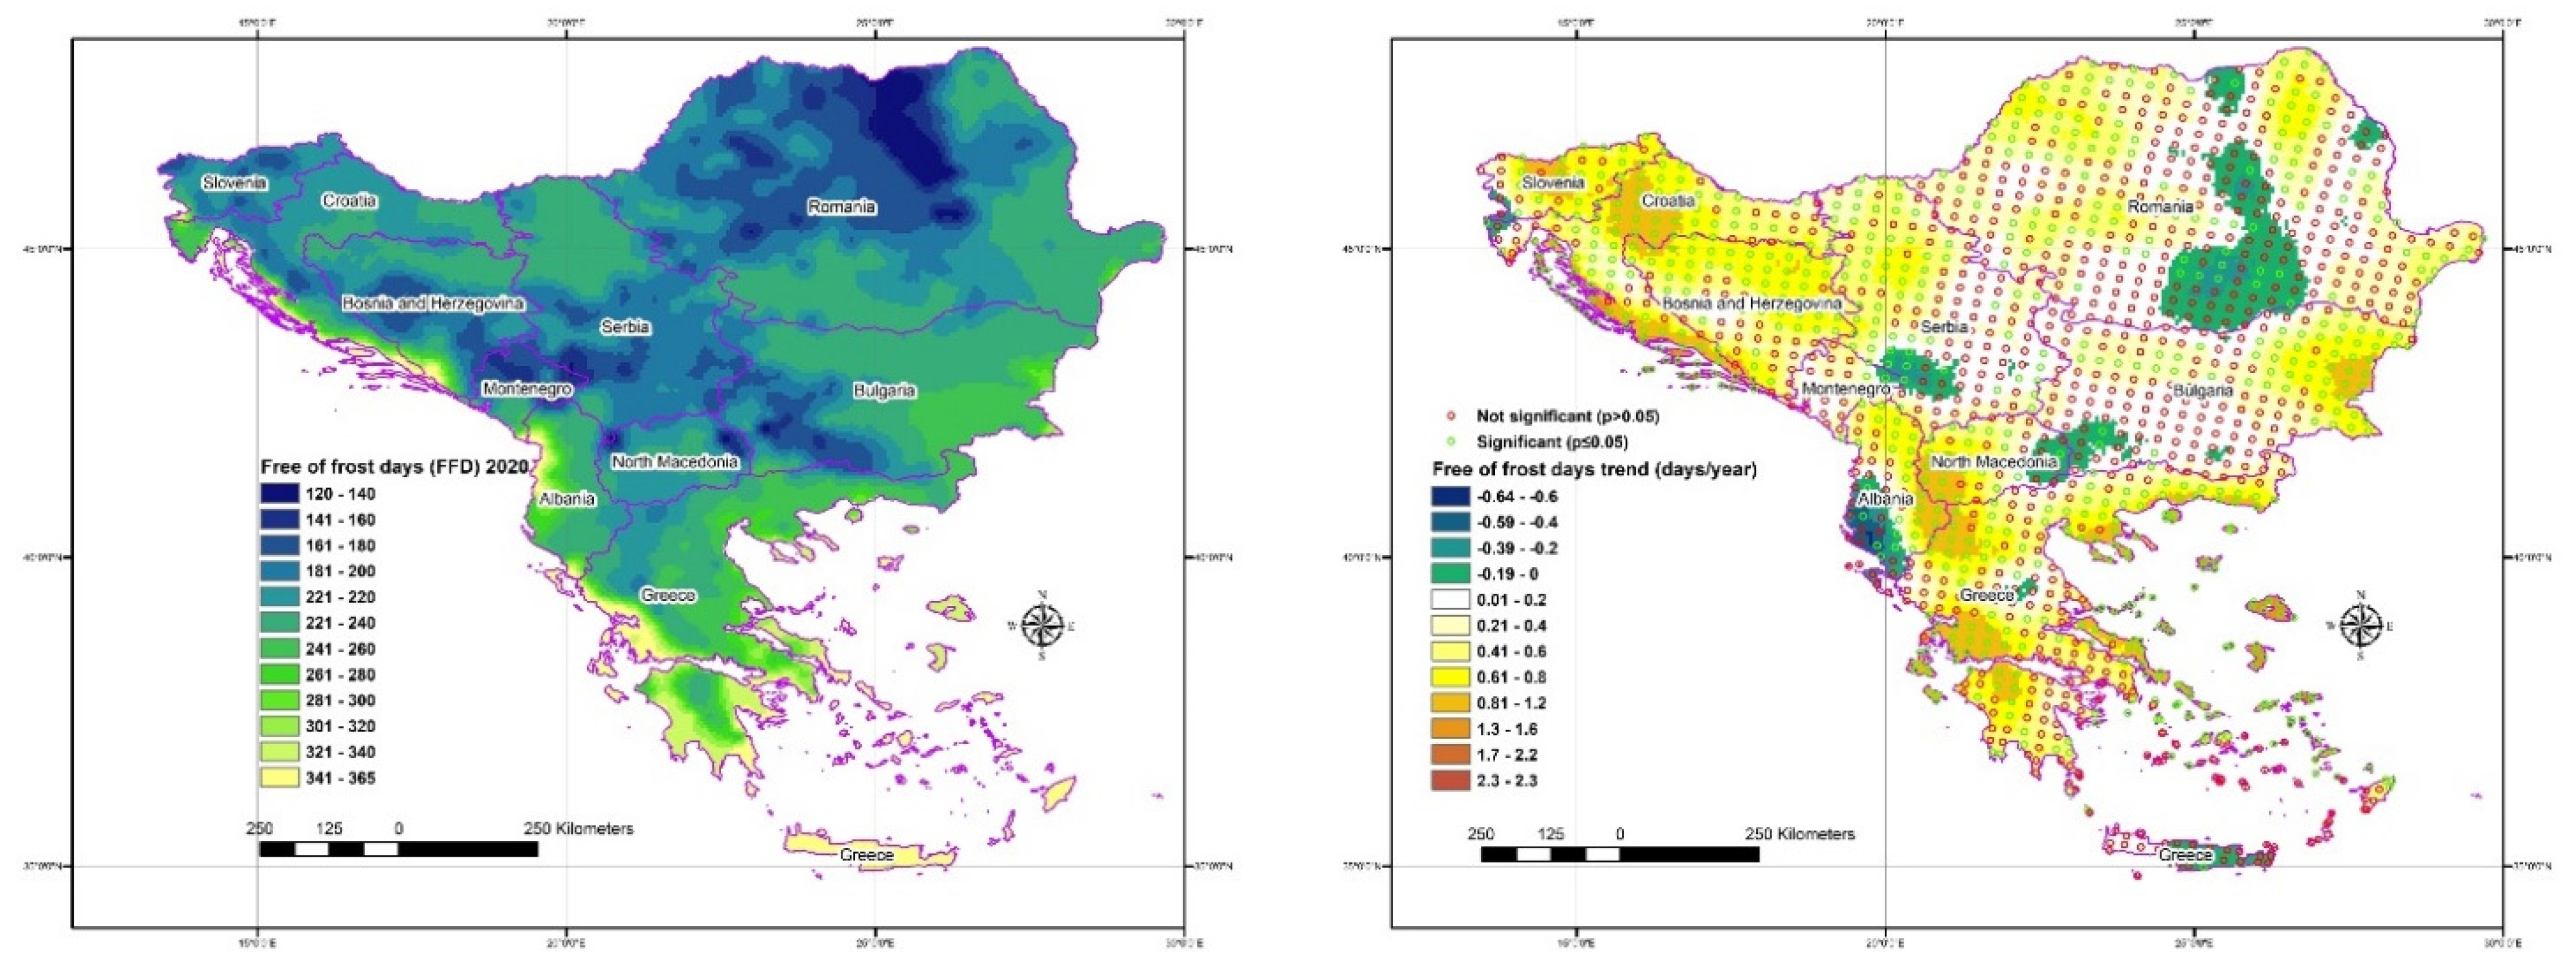
3.3.3. Free of Frost Days (FFD)

Another significant agrometeorological indicator for the agricultural sector is the FFD, which gives helpful information about the length of the free of frost period. The spatial distribution (Figure 16) for the year 2020 reveals beneficial conditions as a consequence of long FFD in the southern part of the Balkans and along the coastal strip of the Adriatic Sea. Also, the areas with a free of frost window are located over the eastern part of Bulgaria and the Danubian plain. On the other hand, the mountainous regions of the central Balkan area form a free of frost period smaller than 200 consecutive days.
It is worth mentioning that the regions in which a reduction of the free frost period will be shortened are the agricultural zone northern than the Romano-Bulgarian borders and the southern coastal part of Albania. The same trend is calculated for the eastern part of Crete island and a small part of southwestern Serbia. On the other hand, the rest Balkanian area is under a positive trend of FFD, indicating more extended cultivation periods between the LSF and FAF. The median values of the FFD (Table 4) show that the Greek region has a wider free of frost period with 325 days, followed by Albania with 234 days. In comparison, the narrowest free of frost period is recorded over Montenegro and Serbia with 186 and 187 days, respectively.
The median of the FFD trends is positive along with all the countries with the highest value recorded over Croatia (0.70 d/yr) and the lowest over Montenegro (0.10 d/yr). This means that the potential growing season is expected to expand almost all over the Balkanian peninsula.
The following images are the illustration of the probability density plots [74] for two distinct time periods, 1980–1999 and 2000–2020, for all the studied countries (in the supplementary material there is the Table S1 with the related quantiles). Figure 17 depicts the LSF probability distribution per country for the two time periods. The most apparent case in terms of the distribution’s shape is presented in North Macedonia’s graph, in which a clear shift as time passes is displayed. The medians of North Macedonia show a clear time shift of 10 days (104–94). The higher shift is calculated for Greece with a difference between the two periods’ median of 16 days, followed by 12 days for Slovenia. The lowest difference is recorded in the cases of Albania and Bulgaria, with a difference equal to 2 days.
These findings are in line with the spatial distributions of Figure 14, which show the mixed trends in Albania and Bulgaria. Considering both the density graphs and the related maps, it is obvious that the last spring frost tends to come earlier with a consequential lower risk for the crops. This finding is the opposite of what we see in previously published research such as Lavalle et al. [70] and Vitasse and Rebetez [75], which concluded that the frost damage would increase as a consequence of the delayed spring frosts at southern latitudes.
Figure 18 presents the first autumn frost (FAF) probability distributions per country for the two selected time periods. The highest medians’ difference is calculated in Croatia with a shifting of ten days followed by Albania with nine days. The only negative difference, which indicates shifting to earlier FAF, occurred for Montenegro, indicating a higher frost risk for cultivated crops.
The above findings are consistent with other related research for the agroclimatic conditions in the European region, such as Graczyk and Kundzewicz [59] for Poland and Moonen et al. [76] for Italy.
Figure 19 shows the alteration of total frost days (FD) aggregated on an annual basis per country for the two selected time periods. In general, a high frost days reduction is calculated over all the countries. The highest reductions occurred in Slovenia, with 23 frost days on an annual basis for the 2000–2020 period compared to the 1980–1999 period. Bosnia and Herzegovina follows with a reduction of 21 frost days. On the other hand, the lowest reduction is recorded in Greece (EL), with four frost days.
This graph is more straightforward compared to the previous, given that the density distributions are unimodal in most cases. It is evident that the frost days are getting decreased from 1980–1999 to the 2000–2020 period. The general finding of the reducing trend of the frost days on an annual basis is in line with similar studies such as Trnka et al. [56], Kostopoulou and Jones [39] Lavelle et al. [70] and Ruml et al. [77].
The probability density plots of the free of frost days (FFD) per country for the two selected time periods are shown in Figure 20. In general, the FFD is increasing, especially over the countries of Slovenia, Croatia, and Greece. The free of frost period expanded in Greece for 18 days according to the periods’ medians, followed by Slovenia (SI) with 17 days.
On the other hand, the smallest free of frost period expansion is calculated in Bulgaria and Montenegro, with only two additional free of frost days. In general, the FFD is increasing between the two time periods on a country scale. The above findings are in agreement with other published studies that focused on the European agroclimatic conditions [42,75,78,79,80,81].

4. Concluding Remarks

The present research aimed to explore the agrometeorological conditions of the Balkans and the agroclimatic trends for the maize and wheat cultivations in high spatial resolutions. The dataset has been derived from meteorological stations, and it is interpolated in a dense canonical grid. For capturing the spatiotemporal evolution of the Balkan’s agroclimatic/agrometeorological conditions, GIS map illustrations of the Growing Degree Days (GDD), Heat Stress Index (HSI), and Frost Days (FD) for each cultivation were presented. Moreover, Last Spring Frost (LSF), First Autumn Frost (FAF), and Free of Frost Days (FFD) maps, along with the probability density plots per country, were illustrated. The main findings are the following:
  • The thermal requirements (GDD) for both maize and wheat have been fulfilled in the year 2020 for most of the agricultural land in the Balkans.
  • The GDD trend indicates clearly that the studied cultivations could sprawl to higher and northern places of the studied area.
  • The HSI spatial distribution for 2020 and the related trend reveal that in the near future, the potential heat injuries will increase, even over mountainous areas. The HSI trend is increased over the high agricultural production areas of Greece and the entire Albania.
  • The frost during the cultivation period of maize and wheat, in not frequent in a significant part of the Balkans, except in the high altitude areas of the Carpathians and of Montenegro, when the related trends are negative except of some areas of the Adriatic coast (Albania, Croatia) and some small, isolated areas of Romania, Serbia and Bulgaria.
  • The frost risk is low over the Balkans’ agricultural areas, and all the related indices (and their trends) reveal a potential reduction.
  • The LSF trend is negative over almost the entire Balkans’ peninsula, indicating an earlier occurrence of LSF. A positive trend is recorded over coastal Albania, central Greece, and the Donau plain between Romania and Bulgaria.
  • The FAF trend indicates a potential later autumn occurrence over most of the study area, except some mountainous regions of the central Balkans.
  • The trends of FFD reveals that in the near future, the free of frost season would be lengthened for all the studied area, except for south-central Romania, coastal Albania, and an isolated area between Bulgaria and North Macedonia.
  • The probability density plots indicate a clear shift to earlier LSF, delayed FAF and longer FFD from the 1980–1999 period to 2000–2020 period, strengthening the estimation of lower frost risk during the near future.
  • The agrometeorological conditions and their trends indicate that both maize and wheat cultivations will face improved conditions in terms of GDD accumulation and reduced frost. The HSI index and its trends reveal increasing thermal pressure and potentially increased need for irrigation.

Supplementary Materials

The following are available online at https://www.mdpi.com/article/10.3390/atmos12060671/s1, Table S1: 1st and 9th quantile.

Funding

This research received no external funding.

Institutional Review Board Statement

Not applicable.

Informed Consent Statement

Not applicable.

Acknowledgments

I would like to thank D. Kalivas and the GIS research group of the Agricultural University of Athens, Greece, for the ArcMap 10.8.1 borrowed license. Also, I would like to thank Fotoula Droulia for the comprehensive review and English language polishing during the review process.

Conflicts of Interest

The author declares no conflict of interest.

References

  1. Trnka, M.; Hlavinka, P.; Semenov, M.A. Adaptation Options for Wheat in Europe Will Be Limited by Increased Adverse Weather Events under Climate Change. J. R. Soc. Interface 2015, 12, 20150721. [Google Scholar] [CrossRef] [PubMed] [Green Version]
  2. Trnka, M.; Olesen, J.E.; Kersebaum, K.C.; Skjelvåg, A.O.; Eitzinger, J.; Seguin, B.; Peltonen-Sainio, P.; Rötter, R.; Iglesias, A.; Orlandini, S.; et al. Agroclimatic Conditions in Europe under Climate Change. Glob. Chang. Biol. 2011, 17, 2298–2318. [Google Scholar] [CrossRef] [Green Version]
  3. Wolf, J.; Van Diepen, C.A. Effects of Climate Change on Grain Maize Yield Potential in the European Community. Clim. Chang. 1995, 29, 299–331. [Google Scholar] [CrossRef] [Green Version]
  4. Kostopoulou, E.; Tolika, K.; Tegoulias, I.; Giannakopoulos, C.; Somot, S.; Anagnostopoulou, C.; Maheras, P. Evaluation of a Regional Climate Model Using in Situ Temperature Observations over the Balkan Peninsula. Tellus A 2009, 61, 357–370. [Google Scholar] [CrossRef]
  5. Ma, S.; Churkina, G.; Trusilova, K. Investigating the Impact of Climate Change on Crop Phenological Events in Europe with a Phenology Model. Int. J. Biometeorol. 2012, 56, 749–763. [Google Scholar] [CrossRef] [PubMed]
  6. Terando, A.; Easterling, W.E.; Keller, K.; Easterling, D.R. Observed and Modeled Twentieth-Century Spatial and Temporal Patterns of Selected Agro-Climate Indices in North America. J. Clim. 2012, 25, 473–490. [Google Scholar] [CrossRef]
  7. Rötter, R.P.; Palosuo, T.; Kersebaum, K.C.; Angulo, C.; Bindi, M.; Ewert, F.; Ferrise, R.; Hlavinka, P.; Moriondo, M.; Nendel, C.; et al. Simulation of Spring Barley Yield in Different Climatic Zones of Northern and Central Europe: A Comparison of Nine Crop Models. Field Crops Res. 2012, 133, 23–36. [Google Scholar] [CrossRef]
  8. Droulia, F.; Charalampopoulos, I. Future Climate Change Impacts on European Viticulture: A Review on Recent Scientific Advances. Atmosphere 2021, 12, 495. [Google Scholar] [CrossRef]
  9. Brisson, N.; Gate, P.; Gouache, D.; Charmet, G.; Oury, F.-X.; Huard, F. Why Are Wheat Yields Stagnating in Europe? A Comprehensive Data Analysis for France. Field Crops Res. 2010, 119, 201–212. [Google Scholar] [CrossRef]
  10. Spiertz, J.H.J.; Ewert, F. Crop Production and Resource Use to Meet the Growing Demand for Food, Feed and Fuel: Opportunities and Constraints. NJAS Wagening. J. Life Sci. 2009, 56, 281–300. [Google Scholar] [CrossRef] [Green Version]
  11. Ainsworth, E.A.; Ort, D.R. How Do We Improve Crop Production in a Warming World? Plant Physiol. 2010, 154, 526–530. [Google Scholar] [CrossRef] [PubMed] [Green Version]
  12. Schmidhuber, J.; Tubiello, F.N. Global Food Security under Climate Change. Proc. Natl. Acad. Sci. USA 2007, 104, 19703–19708. [Google Scholar] [CrossRef] [PubMed] [Green Version]
  13. Teixeira, E.I.; Fischer, G.; van Velthuizen, H.; Walter, C.; Ewert, F. Global Hot-Spots of Heat Stress on Agricultural Crops Due to Climate Change. Agric. For. Meteorol. 2013, 170, 206–215. [Google Scholar] [CrossRef]
  14. Kahiluoto, H.; Kaseva, J.; Balek, J.; Olesen, J.E.; Ruiz-Ramos, M.; Gobin, A.; Kersebaum, K.C.; Takáč, J.; Ruget, F.; Ferrise, R.; et al. Decline in Climate Resilience of European Wheat. Proc. Natl. Acad. Sci. USA 2019, 116, 123–128. [Google Scholar] [CrossRef] [PubMed] [Green Version]
  15. Kogo, B.K.; Kumar, L.; Koech, R.; Langat, P. Modelling Impacts of Climate Change on Maize (Mays, Z.L.) Growth and Productivity: A Review of Models, Outputs and Limitations. J. Geosci. Environ. Prot. 2019. [Google Scholar] [CrossRef] [Green Version]
  16. Migliorini, P.; Gkisakis, V.; Gonzalvez, V.; Raigón, M.D.; Bàrberi, P. Agroecology in Mediterranean Europe: Genesis, State and Perspectives. Sustainability 2018, 10, 2724. [Google Scholar] [CrossRef] [Green Version]
  17. Sommer, S.G.; Olesen, J.E.; Petersen, S.O.; Weisbjerg, M.R.; Valli, L.; Rodhe, L.; Béline, F. Region-Specific Assessment of Greenhouse Gas Mitigation with Different Manure Management Strategies in Four Agroecological Zones. Glob. Chang. Biol. 2009, 15, 2825–2837. [Google Scholar] [CrossRef]
  18. Aguilera, E.; Díaz-Gaona, C.; García-Laureano, R.; Reyes-Palomo, C.; Guzmán, G.I.; Ortolani, L.; Sánchez-Rodríguez, M.; Rodríguez-Estévez, V. Agroecology for Adaptation to Climate Change and Resource Depletion in the Mediterranean Region. A Review. Agric. Syst. 2020, 181, 102809. [Google Scholar] [CrossRef]
  19. van Wart, J.; van Bussel, L.G.J.; Wolf, J.; Licker, R.; Grassini, P.; Nelson, A.; Boogaard, H.; Gerber, J.; Mueller, N.D.; Claessens, L.; et al. Use of Agro-Climatic Zones to Upscale Simulated Crop Yield Potential. Field Crops Res. 2013, 143, 44–55. [Google Scholar] [CrossRef] [Green Version]
  20. Olesen, J.E.; Bindi, M. Consequences of Climate Change for European Agricultural Productivity, Land Use and Policy. Eur. J. Agron. 2002, 16, 239–262. [Google Scholar] [CrossRef]
  21. Moriondo, M.; Bindi, M. Impact of Climate Change on the Phenology of Typical Mediterranean Crops. Ital. J. Agrometeorol. 2007, 3, 5–12. [Google Scholar]
  22. Prăvălie, R.; Sîrodoev, I.; Patriche, C.; Roșca, B.; Piticar, A.; Bandoc, G.; Sfîcă, L.; Tişcovschi, A.; Dumitraşcu, M.; Chifiriuc, C.; et al. The Impact of Climate Change on Agricultural Productivity in Romania. A Country-Scale Assessment Based on the Relationship between Climatic Water Balance and Maize Yields in Recent Decades. Agric. Syst. 2020, 179, 102767. [Google Scholar] [CrossRef]
  23. Giannakopoulos, C.; Kostopoulou, E.; Varotsos, K.V.; Tziotziou, K.; Plitharas, A. An Integrated Assessment of Climate Change Impacts for Greece in the near Future. Reg. Environ. Chang. 2011, 11, 829–843. [Google Scholar] [CrossRef] [Green Version]
  24. Vučetić, V. Modelling of Maize Production in Croatia: Present and Future Climate. J. Agric. Sci. 2011, 149, 145–157. [Google Scholar] [CrossRef] [PubMed] [Green Version]
  25. Alexandrov, V.A.; Hoogenboom, G. The Impact of Climate Variability and Change on Crop Yield in Bulgaria. Agric. For. Meteorol. 2000, 104, 315–327. [Google Scholar] [CrossRef]
  26. Trbic, G.; Djurdjevic, V.; Mandic, M.V.; Ivanisevic, M.; Cupac, R.; Bajic, D.; Zahirovic, E.; Filipovic, D.; Dekic, R.; Popov, T.; et al. The Impact of Climate Change on Grapevines in Bosnia and Herzegovina. Euro Mediterr. J. Environ. Integr. 2020, 6, 4. [Google Scholar] [CrossRef]
  27. Teqja, Z.; Kopali, A.; Libohova, Z.; Owens, P.R. A Study of the Impacts of Climate Change Scenarios on the Plant Hardiness Zones of Albania. J. Appl. Meteorol. Climatol. 2017, 56, 615–631. [Google Scholar] [CrossRef]
  28. Cheval, S.; Dumitrescu, A.; Birsan, M.-V. Variability of the Aridity in the South-Eastern Europe over 1961–2050. CATENA 2017, 151, 74–86. [Google Scholar] [CrossRef]
  29. Knox, J.; Daccache, A.; Hess, T.; Haro, D. Meta-Analysis of Climate Impacts and Uncertainty on Crop Yields in Europe. Environ. Res. Lett. 2016, 11, 113004. [Google Scholar] [CrossRef]
  30. Önol, B.; Semazzi, F.H.M. Regionalization of Climate Change Simulations over the Eastern Mediterranean. J. Clim. 2009, 22, 1944–1961. [Google Scholar] [CrossRef]
  31. Spinoni, J.; Vogt, J.; Barbosa, P. European Degree-Day Climatologies and Trends for the Period 1951–2011. Int. J. Climatol. 2015, 35, 25–36. [Google Scholar] [CrossRef] [Green Version]
  32. Ci, H.; Zhang, Q.; Singh, V.P.; Xiao, M.; Liu, L. Spatiotemporal Properties of Growing Season Indices during 1961–2010 and Possible Association with Agroclimatological Regionalization of Dominant Crops in Xinjiang, China. Meteorol. Atmos. Phys. 2016, 128, 513–524. [Google Scholar] [CrossRef]
  33. Abendroth, L.J.; Miguez, F.E.; Castellano, M.J.; Hatfield, J.L. Climate Warming Trends in the U.S. Midwest Using Four Thermal Models. Agron. J. 2019, 111, 3230–3243. [Google Scholar] [CrossRef] [Green Version]
  34. Feng, S.; Hu, Q. Changes in Agro-Meteorological Indicators in the Contiguous United States: 1951–2000. Appl. Clim. 2004, 78, 247–264. [Google Scholar] [CrossRef]
  35. Kukal, M.S.; Irmak, S.U.S. Agro-Climate in 20th Century: Growing Degree Days, First and Last Frost, Growing Season Length, and Impacts on Crop Yields. Sci. Rep. 2018, 8, 6977. [Google Scholar] [CrossRef]
  36. Liu, B.; Henderson, M.; Xu, M. Spatiotemporal Change in China’s Frost Days and Frost-Free Season, 1955–2000. J. Geophys. Res. Atmos. 2008, 113. [Google Scholar] [CrossRef] [Green Version]
  37. Gobbett, D.L.; Nidumolu, U.; Crimp, S. Modelling Frost Generates Insights for Managing Risk of Minimum Temperature Extremes. Weather Clim. Extrem. 2020, 27, 100176. [Google Scholar] [CrossRef]
  38. Erlat, E.; Türkeş, M. Analysis of Observed Variability and Trends in Numbers of Frost Days in Turkey for the Period 1950–2010. Int. J. Climatol. 2012, 32, 1889–1898. [Google Scholar] [CrossRef]
  39. Kostopoulou, E.; Jones, P.D. Assessment of Climate Extremes in the Eastern Mediterranean. Meteorol. Atmos. Phys. 2005, 89, 69–85. [Google Scholar] [CrossRef]
  40. Biazar, S.M.; Ferdosi, F.B. An Investigation on Spatial and Temporal Trends in Frost Indices in Northern Iran. Appl. Clim. 2020, 141, 907–920. [Google Scholar] [CrossRef]
  41. Frich, P.; Alexander, L.V.; Della-Marta, P.; Gleason, B.; Haylock, M.; Tank, A.M.G.K.; Peterson, T. Observed Coherent Changes in Climatic Extremes during the Second Half of the Twentieth Century. Clim. Res. 2002, 19, 193–212. [Google Scholar] [CrossRef] [Green Version]
  42. Wypych, A.; Ustrnul, Z.; Sulikowska, A.; Chmielewski, F.-M.; Bochenek, B. Spatial and Temporal Variability of the Frost-Free Season in Central Europe and Its Circulation Background. Int. J. Climatol. 2017, 37, 3340–3352. [Google Scholar] [CrossRef]
  43. Charalampopoulos, I.; Polychroni, I.; Psomiadis, E.; Nastos, P. Spatiotemporal Estimation of the Olive and Vine Cultivations’ Growing Degree Days in the Balkans Region. Atmosphere 2021, 12, 148. [Google Scholar] [CrossRef]
  44. Korycinska, A.; Baker, R. Exploiting the High-Resolution JRC-MARS European Climatic Dataset for Pest Risk Mapping. Bull. OEPP/EPPO Bull. 2017, 47, 246–254. [Google Scholar] [CrossRef]
  45. Mavromatis, T.; Voulanas, D. Evaluating ERA-Interim, Agri4Cast and E-OBS Gridded Products in Reproducing Spatiotemporal Characteristics of Precipitation and Drought over a Data Poor Region: The Case of Greece. Int. J. Climatol. 2020. [Google Scholar] [CrossRef]
  46. Charalampopoulos, I. The R Language as a Tool for Biometeorological Research. Atmosphere 2020, 11, 682. [Google Scholar] [CrossRef]
  47. Wickham, H.; François, R.; Henry, L.; Müller, K. Dplyr: A Grammar of Data Manipulation. Available online: https://CRAN.R-project.org/package=dplyr (accessed on 25 April 2020).
  48. Klik, M.; Collet, Y. Fst: Lightning Fast Serialization of Data Frames for R. Available online: https://CRAN.R-project.org/package=fst (accessed on 1 July 2020).
  49. Sjoberg, D.D.; Curry, M.; Hannum, M.; Larmarange, J.; Whiting, K.; Zabor, E.C.; Drill, E.; Flynn, J.; Lavery, J.; Lobaugh, S.; et al. Gtsummary: Presentation-Ready Data Summary and Analytic Result Tables. Available online: https://CRAN.R-project.org/package=gtsummary (accessed on 21 April 2021).
  50. Kassambara, A. Ggpubr: “ggplot2” Based Publication Ready Plots. Available online: https://CRAN.R-project.org/package=ggpubr (accessed on 20 April 2021).
  51. Trnka, M.; Olesen, J.E.; Kersebaum, K.C.; Rötter, R.P.; Brázdil, R.; Eitzinger, J.; Jansen, S.; Skjelvåg, A.O.; Peltonen-Sainio, P.; Hlavinka, P.; et al. Changing Regional Weather-Crop Yield Relationships across Europe between 1901 and 2012. Clim. Res. 2016, 70, 195–214. [Google Scholar] [CrossRef] [Green Version]
  52. Agri4Cast Data. Available online: https://agri4cast.jrc.ec.europa.eu/DataPortal/Index.aspx?o=sd (accessed on 29 March 2021).
  53. De Sousa, K.; van Etten, J.; Solberg, S.Ø. Climatrends: Climate Variability Indices for Ecological Modelling. Available online: https://CRAN.R-project.org/package=climatrends (accessed on 13 October 2020).
  54. Wilhelm, E.P.; Mullen, R.E.; Keeling, P.L.; Singletary, G.W. Heat Stress during Grain Filling in Maize: Effects on Kernel Growth and Metabolism. Crop Sci. 1999, 39, 1733–1741. [Google Scholar] [CrossRef]
  55. Scheifinger, H.; Menzel, A.; Koch, E.; Peter, C. Trends of Spring Time Frost Events and Phenological Dates in Central Europe. Appl. Clim. 2003, 74, 41–51. [Google Scholar] [CrossRef]
  56. Trnka, M.; Brázdil, R.; Dubrovský, M.; Semerádová, D.; Štěpánek, P.; Dobrovolný, P.; Možný, M.; Eitzinger, J.; Málek, J.; Formayer, H.; et al. A 200-Year Climate Record in Central Europe: Implications for Agriculture. Agron. Sustain. Dev. 2011, 31, 631–641. [Google Scholar] [CrossRef] [Green Version]
  57. Cressie, N.; Wikle, C.K. Statistics for Spatio-Temporal Data; John Wiley & Sons: Hoboken, NJ, USA, 2015; ISBN 1-119-24304-1. [Google Scholar]
  58. Mihailović, D.T.; Lalić, B.; Drešković, N.; Mimić, G.; Djurdjević, V.; Jančić, M. Climate Change Effects on Crop Yields in Serbia and Related Shifts of Köppen Climate Zones under the SRES-A1B and SRES-A2. Int. J. Climatol. 2015, 35, 3320–3334. [Google Scholar] [CrossRef]
  59. Graczyk, D.; Kundzewicz, Z.W. Changes of Temperature-Related Agroclimatic Indices in Poland. Theor. Appl. Climatol. 2016, 124, 401–410. [Google Scholar] [CrossRef] [Green Version]
  60. Trnka, M.; Eitzinger, J.; Semerádová, D.; Hlavinka, P.; Balek, J.; Dubrovský, M.; Kubu, G.; Štěpánek, P.; Thaler, S.; Možný, M.; et al. Expected Changes in Agroclimatic Conditions in Central Europe. Clim. Chang. 2011, 108, 261–289. [Google Scholar] [CrossRef]
  61. Bristow, K.L.; Abrecht, D.G. Daily Temperature Extremes as an Indicator of High Temperature Stress. Soil Res. 1991, 29, 377–385. [Google Scholar] [CrossRef]
  62. Burić, D.; Doderović, M. Changes in Temperature and Precipitation in the Instrumental Period (1951–2018) and Projections up to 2100 in Podgorica (Montenegro). Int. J. Climatol. 2021, 41, E133–E149. [Google Scholar] [CrossRef]
  63. Solaraju-Murali, B.; Caron, L.-P.; Gonzalez-Reviriego, N.; Doblas-Reyes, F.J. Multi-Year Prediction of European Summer Drought Conditions for the Agricultural Sector. Environ. Res. Lett. 2019, 14, 124014. [Google Scholar] [CrossRef] [Green Version]
  64. Mäkinen, H.; Kaseva, J.; Trnka, M.; Balek, J.; Kersebaum, K.C.; Nendel, C.; Gobin, A.; Olesen, J.E.; Bindi, M.; Ferrise, R.; et al. Sensitivity of European Wheat to Extreme Weather. Field Crops Res. 2018, 222, 209–217. [Google Scholar] [CrossRef]
  65. Wilcox, J.; Makowski, D. A Meta-Analysis of the Predicted Effects of Climate Change on Wheat Yields Using Simulation Studies. Field Crops Res. 2014, 156, 180–190. [Google Scholar] [CrossRef]
  66. Olesen, J.E.; Børgesen, C.D.; Elsgaard, L.; Palosuo, T.; Rötter, R.P.; Skjelvåg, A.O.; Peltonen-Sainio, P.; Börjesson, T.; Trnka, M.; Ewert, F.; et al. Changes in Time of Sowing, Flowering and Maturity of Cereals in Europe under Climate Change. Food Addit. Contam. Part A 2012, 29, 1527–1542. [Google Scholar] [CrossRef]
  67. Di Paola, A.; Caporaso, L.; Di Paola, F.; Bombelli, A.; Vasenev, I.; Nesterova, O.V.; Castaldi, S.; Valentini, R. The Expansion of Wheat Thermal Suitability of Russia in Response to Climate Change. Land Use Policy 2018, 78, 70–77. [Google Scholar] [CrossRef]
  68. Boer, R.; Campbell, L.C.; Fletcher, D.J. Characteristics of Frost in a Major Wheat-Growing Region of Australia. Aust. J. Agric. Res. 1993, 44, 1731–1743. [Google Scholar] [CrossRef] [Green Version]
  69. Barlow, K.M.; Christy, B.P.; O’Leary, G.J.; Riffkin, P.A.; Nuttall, J.G. Simulating the Impact of Extreme Heat and Frost Events on Wheat Crop Production: A Review. Field Crops Res. 2015, 171, 109–119. [Google Scholar] [CrossRef] [Green Version]
  70. Lavalle, C.; Micale, F.; Houston, T.D.; Camia, A.; Hiederer, R.; Lazar, C.; Conte, C.; Amatulli, G.; Genovese, G. Climate Change in Europe. 3. Impact on Agriculture and Forestry. A Review. Agron. Sustain. Dev. 2009, 29, 433–446. [Google Scholar] [CrossRef] [Green Version]
  71. Pulatov, B.; Linderson, M.-L.; Hall, K.; Jönsson, A.M. Modeling Climate Change Impact on Potato Crop Phenology, and Risk of Frost Damage and Heat Stress in Northern Europe. Agric. For. Meteorol. 2015, 214–215, 281–292. [Google Scholar] [CrossRef]
  72. Risbey, J.S.; Monselesan, D.P.; O’Kane, T.J.; Tozer, C.R.; Pook, M.J.; Hayman, P.T. Synoptic and Large-Scale Determinants of Extreme Austral Frost Events. J. Appl. Meteorol. Climatol. 2019, 58, 1103–1124. [Google Scholar] [CrossRef]
  73. Lake, L.; Chauhan, Y.S.; Ojeda, J.J.; Cossani, C.M.; Thomas, D.; Hayman, P.T.; Sadras, V.O. Modelling Phenology to Probe for Trade-Offs between Frost and Heat Risk in Lentil and Faba Bean. Eur. J. Agron. 2021, 122, 126154. [Google Scholar] [CrossRef]
  74. Vermeesch, P. On the Visualisation of Detrital Age Distributions. Chem. Geol. 2012, 312–313, 190–194. [Google Scholar] [CrossRef]
  75. Vitasse, Y.; Rebetez, M. Unprecedented Risk of Spring Frost Damage in Switzerland and Germany in 2017. Clim. Chang. 2018, 149, 233–246. [Google Scholar] [CrossRef]
  76. Moonen, A.C.; Ercoli, L.; Mariotti, M.; Masoni, A. Climate Change in Italy Indicated by Agrometeorological Indices over 122 Years. Agric. For. Meteorol. 2002, 111, 13–27. [Google Scholar] [CrossRef]
  77. Ruml, M.; Vuković, A.; Vujadinović, M.; Djurdjević, V.; Ranković-Vasić, Z.; Atanacković, Z.; Sivčev, B.; Marković, N.; Matijašević, S.; Petrović, N. On the Use of Regional Climate Models: Implications of Climate Change for Viticulture in Serbia. Agric. For. Meteorol. 2012, 158–159, 53–62. [Google Scholar] [CrossRef]
  78. Walther, A.; Linderholm, H.W. A Comparison of Growing Season Indices for the Greater Baltic Area. Int. J. Biometeorol. 2006, 51, 107–118. [Google Scholar] [CrossRef] [PubMed]
  79. Vitasse, Y.; Schneider, L.; Rixen, C.; Christen, D.; Rebetez, M. Increase in the Risk of Exposure of Forest and Fruit Trees to Spring Frosts at Higher Elevations in Switzerland over the Last Four Decades. Agric. For. Meteorol. 2018, 248, 60–69. [Google Scholar] [CrossRef]
  80. Unkašević, M.; Tošić, I. Trends in Temperature Indices over Serbia: Relationships to Large-Scale Circulation Patterns. Int. J. Climatol. 2013, 33, 3152–3161. [Google Scholar] [CrossRef]
  81. Sgubin, G.; Swingedouw, D.; Dayon, G.; García de Cortázar-Atauri, I.; Ollat, N.; Pagé, C.; van Leeuwen, C. The Risk of Tardive Frost Damage in French Vineyards in a Changing Climate. Agric. For. Meteorol. 2018, 250–251, 226–242. [Google Scholar] [CrossRef]
Figure 1. The study area with the Agri4Cast grid points and the potential crops are from Corine Land Cover (CLC) 2018 dataset.
Atmosphere 12 00671 g001
Figure 2. The GDD spatial distribution for the maize cultivation in 2020 (left) and the GDD trend with statistical significance marks (right).
Atmosphere 12 00671 g002
Figure 3. The spatiotemporal variation of the isolines of the 2000 GDD units for the maize cultivation (for the years 1980, 2000, 2020).
Atmosphere 12 00671 g003
Figure 4. The HSI distribution for the maize cultivation in 2020 (left) and the HSI trend with statistical significance marks (right).
Atmosphere 12 00671 g004
Figure 5. The spatiotemporal variation of the isolines of the 100 HSI units for the maize cultivation (for the years 1980, 2000, 2020).
Atmosphere 12 00671 g005
Figure 6. The distribution of frost days during the maize cultivation in 2020 (left) and the frost days’ trend with statistical significance marks (right).
Atmosphere 12 00671 g006
Figure 7. The spatiotemporal variation of the isolines of the one (1) frost day for the maize cultivation (for the years 1980, 2000, 2020).
Atmosphere 12 00671 g007
Figure 8. The GDD distribution for the wheat cultivation in 2020 (left) and the GDD trend with statistical significance marks (right).
Atmosphere 12 00671 g008
Figure 9. The spatiotemporal variation of the isolines of the 2000 GDD units for the wheat cultivation (for the years 1980, 2000, 2020).
Atmosphere 12 00671 g009
Figure 10. The HSI distribution for the wheat cultivation in 2020 (left) and the HSI trend with statistical significance marks (right).
Atmosphere 12 00671 g010
Figure 11. The spatiotemporal variation of the isolines of 20 HSI units for the wheat cultivation (for the years 1980, 2000, 2020).
Atmosphere 12 00671 g011
Figure 12. The frost days during the wheat cultivation in 2020 (left) and the frost days’ trend with statistical significance marks (right).
Atmosphere 12 00671 g012
Figure 13. The spatiotemporal variation of the isolines of the 50 frost days for the wheat cultivation (for the years 1980, 2000, 2020).
Atmosphere 12 00671 g013
Figure 14. The distribution of the last spring frost in Julian days (left) in 2020 and the last spring frost trend (right).
Atmosphere 12 00671 g014
Figure 15. The first autumn frost in Julian days (left) in 2020 and the first autumn frost trend (right).
Atmosphere 12 00671 g015
Figure 16. The free of frost days (FFD) in 2020 (left) and the FFD trend (right).
Atmosphere 12 00671 g016
Figure 17. The last spring frost (LSF) probability density per country for the 1980–1999 and the 2000–2020 time periods, with the medians (line).
Atmosphere 12 00671 g017
Figure 18. The first autumn frost (FAF) probability density per country for the 1980–1999 and the 2000–2020 time periods.
Atmosphere 12 00671 g018
Figure 19. The frost days (FD) probability density per country for the 1980–1999 and the 2000–2020 time periods.
Atmosphere 12 00671 g019
Figure 20. The free of frost days (FFD) probability density per country for the 1980–1999 and the 2000–2020 time periods.
Atmosphere 12 00671 g020
Table 1. Study area’s information about the total and agricultural area’s grid points and the percentage of the arable land per country.
Country NameCountry CodeGrid Points(%) Agricultural Grid Points (CLC) 1Agricultural Land 2 (%)Arable Land 3 (%)
AlbaniaAL702843.122.6
Bosnia & HerzegovinaBA1143243.120.0
BulgariaBG2245346.232.2
GreeceGR4013647.616.6
CroatiaHR1234227.915.5
MontenegroME191618.90.6
North MacedoniaKM323450.116.4
RomaniaRO4115458.737.3
SerbiaRS1055139.329.7
SloveniaSI333030.69.1
1 Corine Land Cover codes: 211, 212, 213, 221, 222, 223, 231, 241, 242, 243, 244. 2 FAOSTAT. 3 FAOSTAT 2016.
Table 2. The medians per variable and country for maize cultivation.
VariableAL 1BABGELHRMEMKRORSSI
GDD 2 20202271170120972611188812582005181418431477
GDD Trend 310.1110.718.659.4211.057.269.6510.009.318.73
Frost Days 4 20201.08.04.00.04.013.05.08.08.010.0
Frost Days Trend 5−0.03−0.13−0.060.00−0.04−0.07−0.08−0.10−0.06−0.19
HIS 6 2020168.050.0119.0143.071.03.0112.051.056.08.0
HIS 7 Trend3.512.172.511.562.020.523.022.002.580.86
1 Country Code, 2 GDD units, 3 GDD units/yr, 4 Days, 5 Days/yr, 6 HSI units, 7 units/yr.
Table 3. The medians per variable and country for wheat cultivation.
VariableAL 1BABGELHRMEMKRORSSI
GDD 2 20202898216925303511234616532484219322861880
GDD Trend 311.912.18.711.312.77.210.610.19.710.4
Frost Days 4 202045.076.061.03.055.089.065.075.075.087.0
Frost Days Trend 5−0.40−0.91−0.47−0.18−0.63−0.54−0.63−0.65−0.54−0.80
HIS 6 202078.027.042.072.034.03.068.021.026.04.0
HSI Trend 71.771.241.090.571.160.221.510.981.280.53
1 Country Code, 2 GDD units, 3 GDD units/yr, 4 Days, 5 Days/yr, 6 HSI units, 7 units/yr.
Table 4. The medians per variable and country for the frost parameters.
VariableAL 1BABGELHRMEMKRORSSI
LSF 2 202093.0107.099.040.0106.0107.0102.0107.0107.0106.0
LSF Trend−0.16−0.38−0.07−0.38−0.42−0.19−0.24−0.13−0.25−0.37
FAF 3 2020325.0320.0327.0328.0326.0293.0314.0307.0294.0312.0
FAF Trend0.280.250.180.340.26−0.040.200.110.010.22
FFD 4 2020234.0219.0228.0325.0221.0186.0214.0198.0187.0205.0
FFD Trend0.320.590.230.680.700.100.470.240.260.67
1 Country Code, 2 Last Spring Frost, 3 First Autumn Frost, 4 Free of Frost Days.
Publisher’s Note: MDPI stays neutral with regard to jurisdictional claims in published maps and institutional affiliations.

