
Geochemical Characterization and Heavy Metal Sources in PM10 in Arequipa, Peru


 , , ,
, , ,  and
and
Abstract
1. Introduction
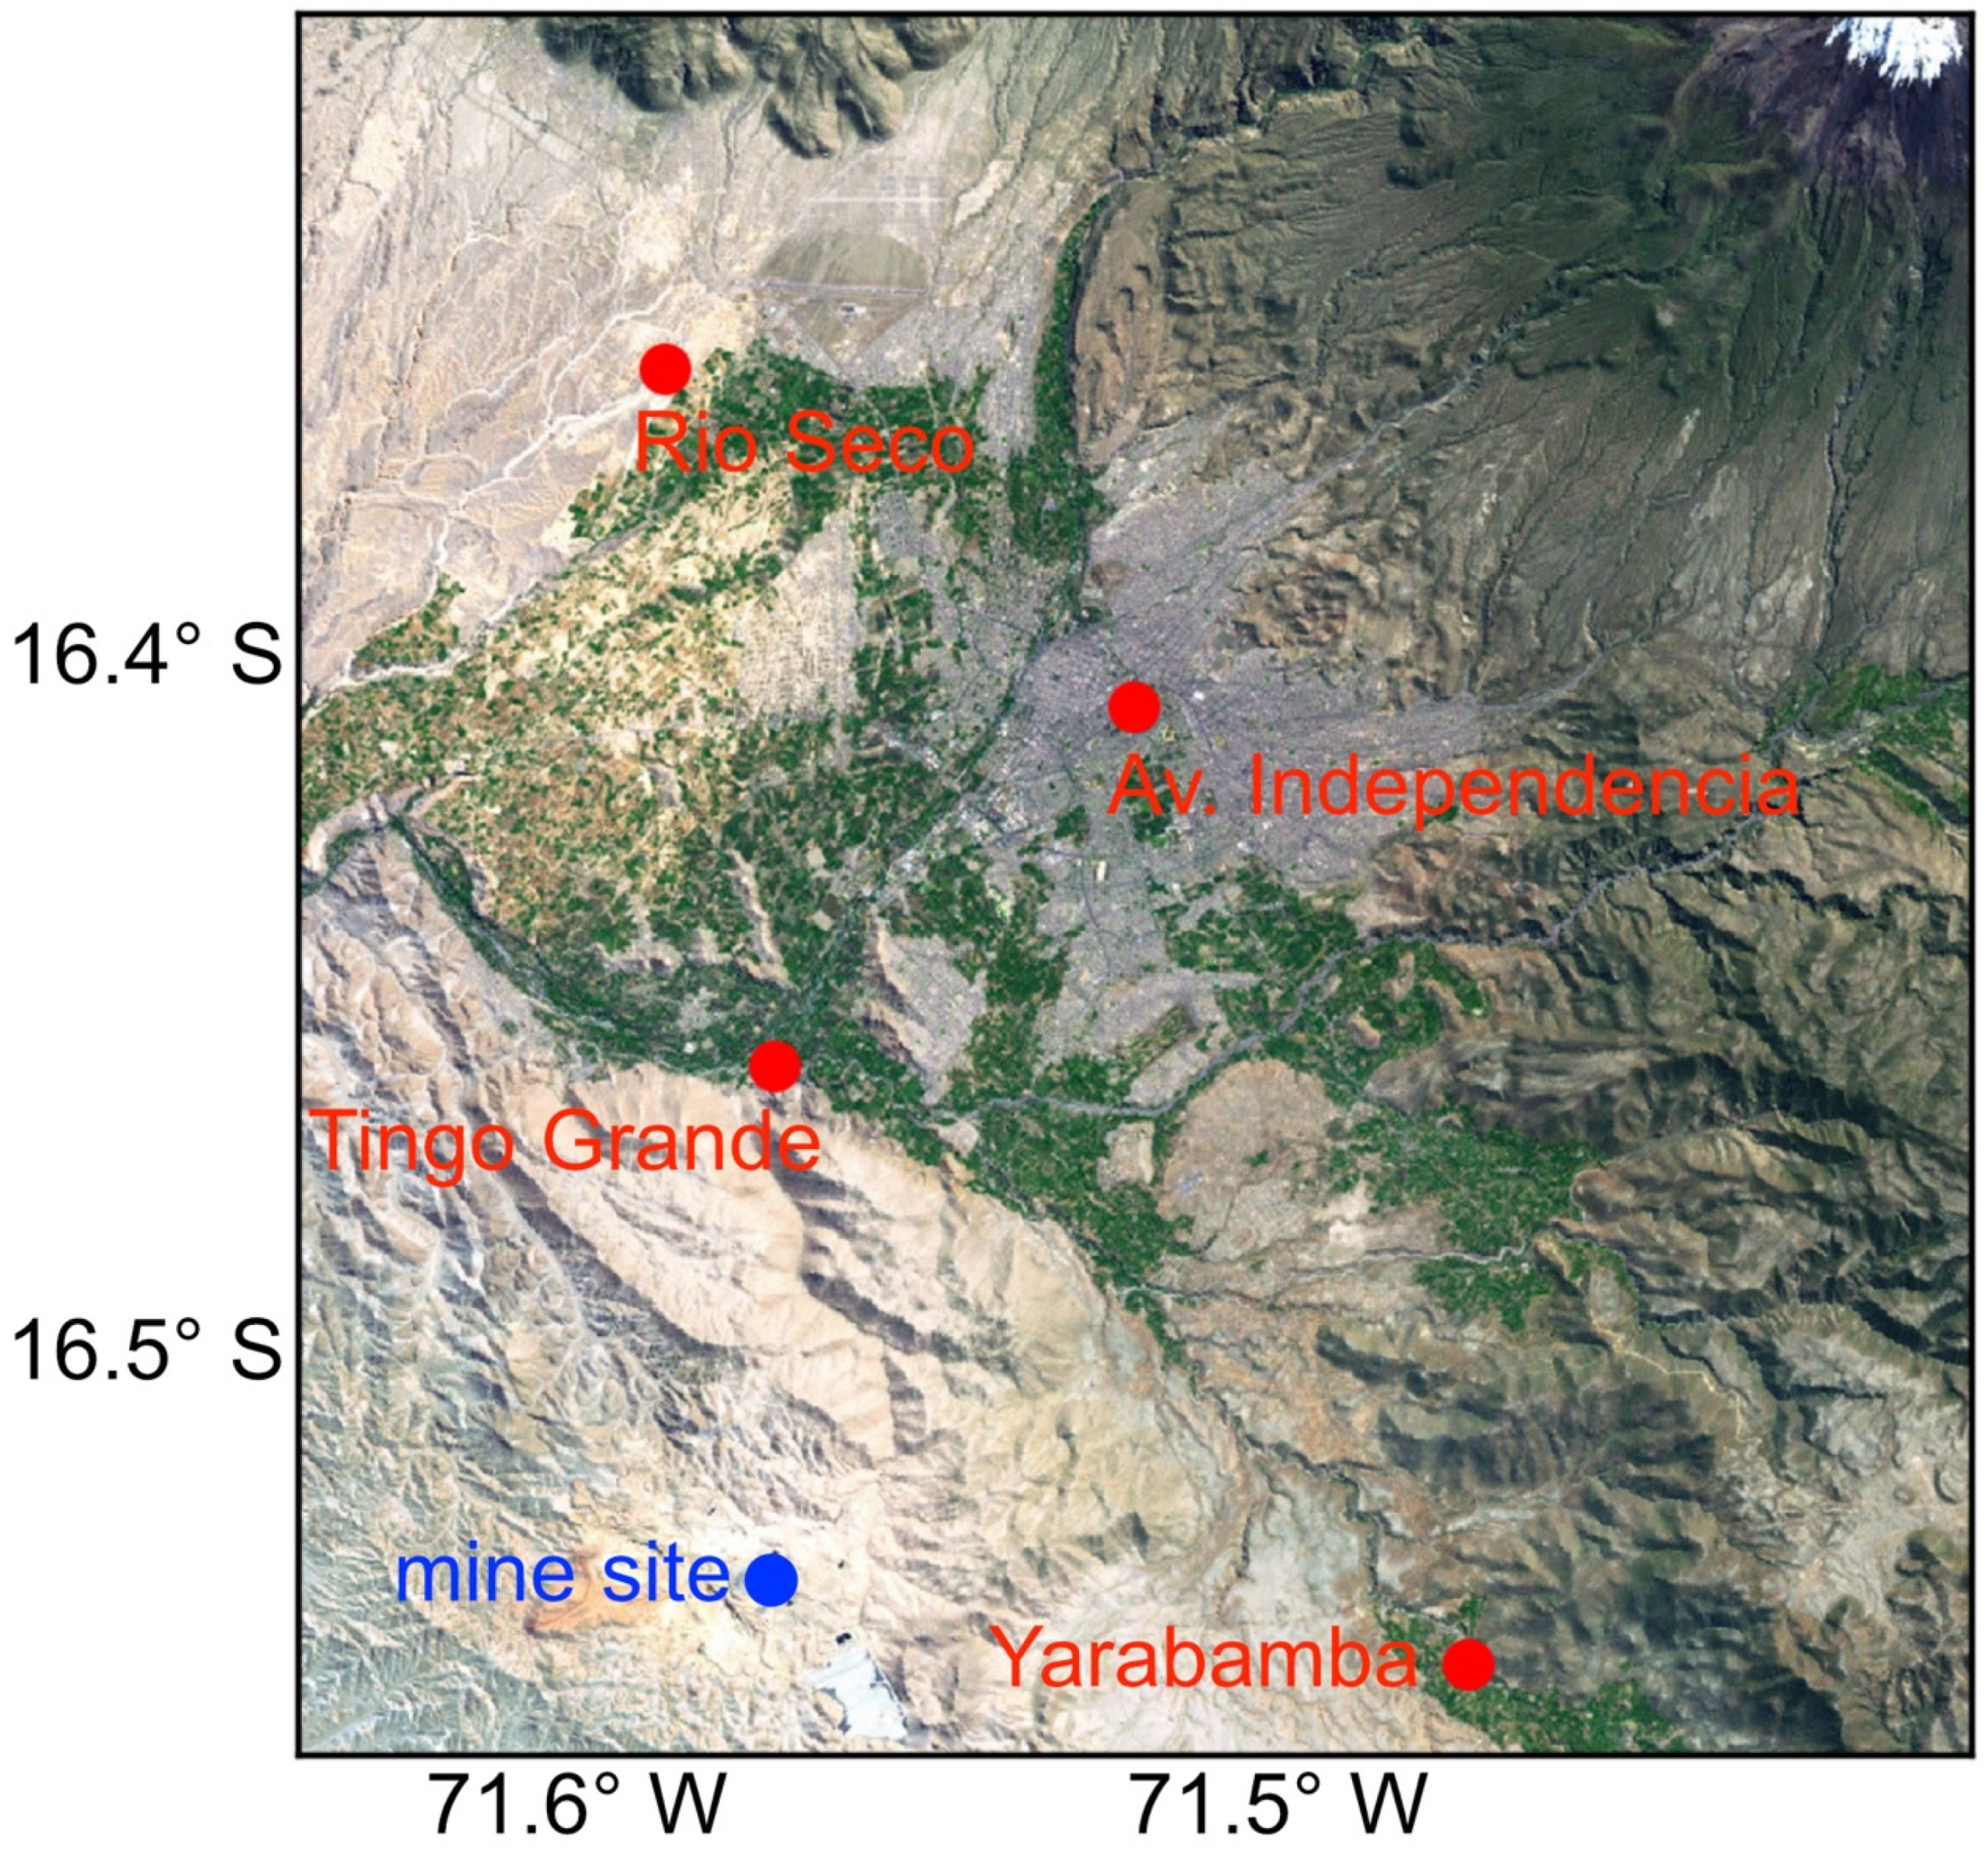
2. Methods
3. Results and Discussions
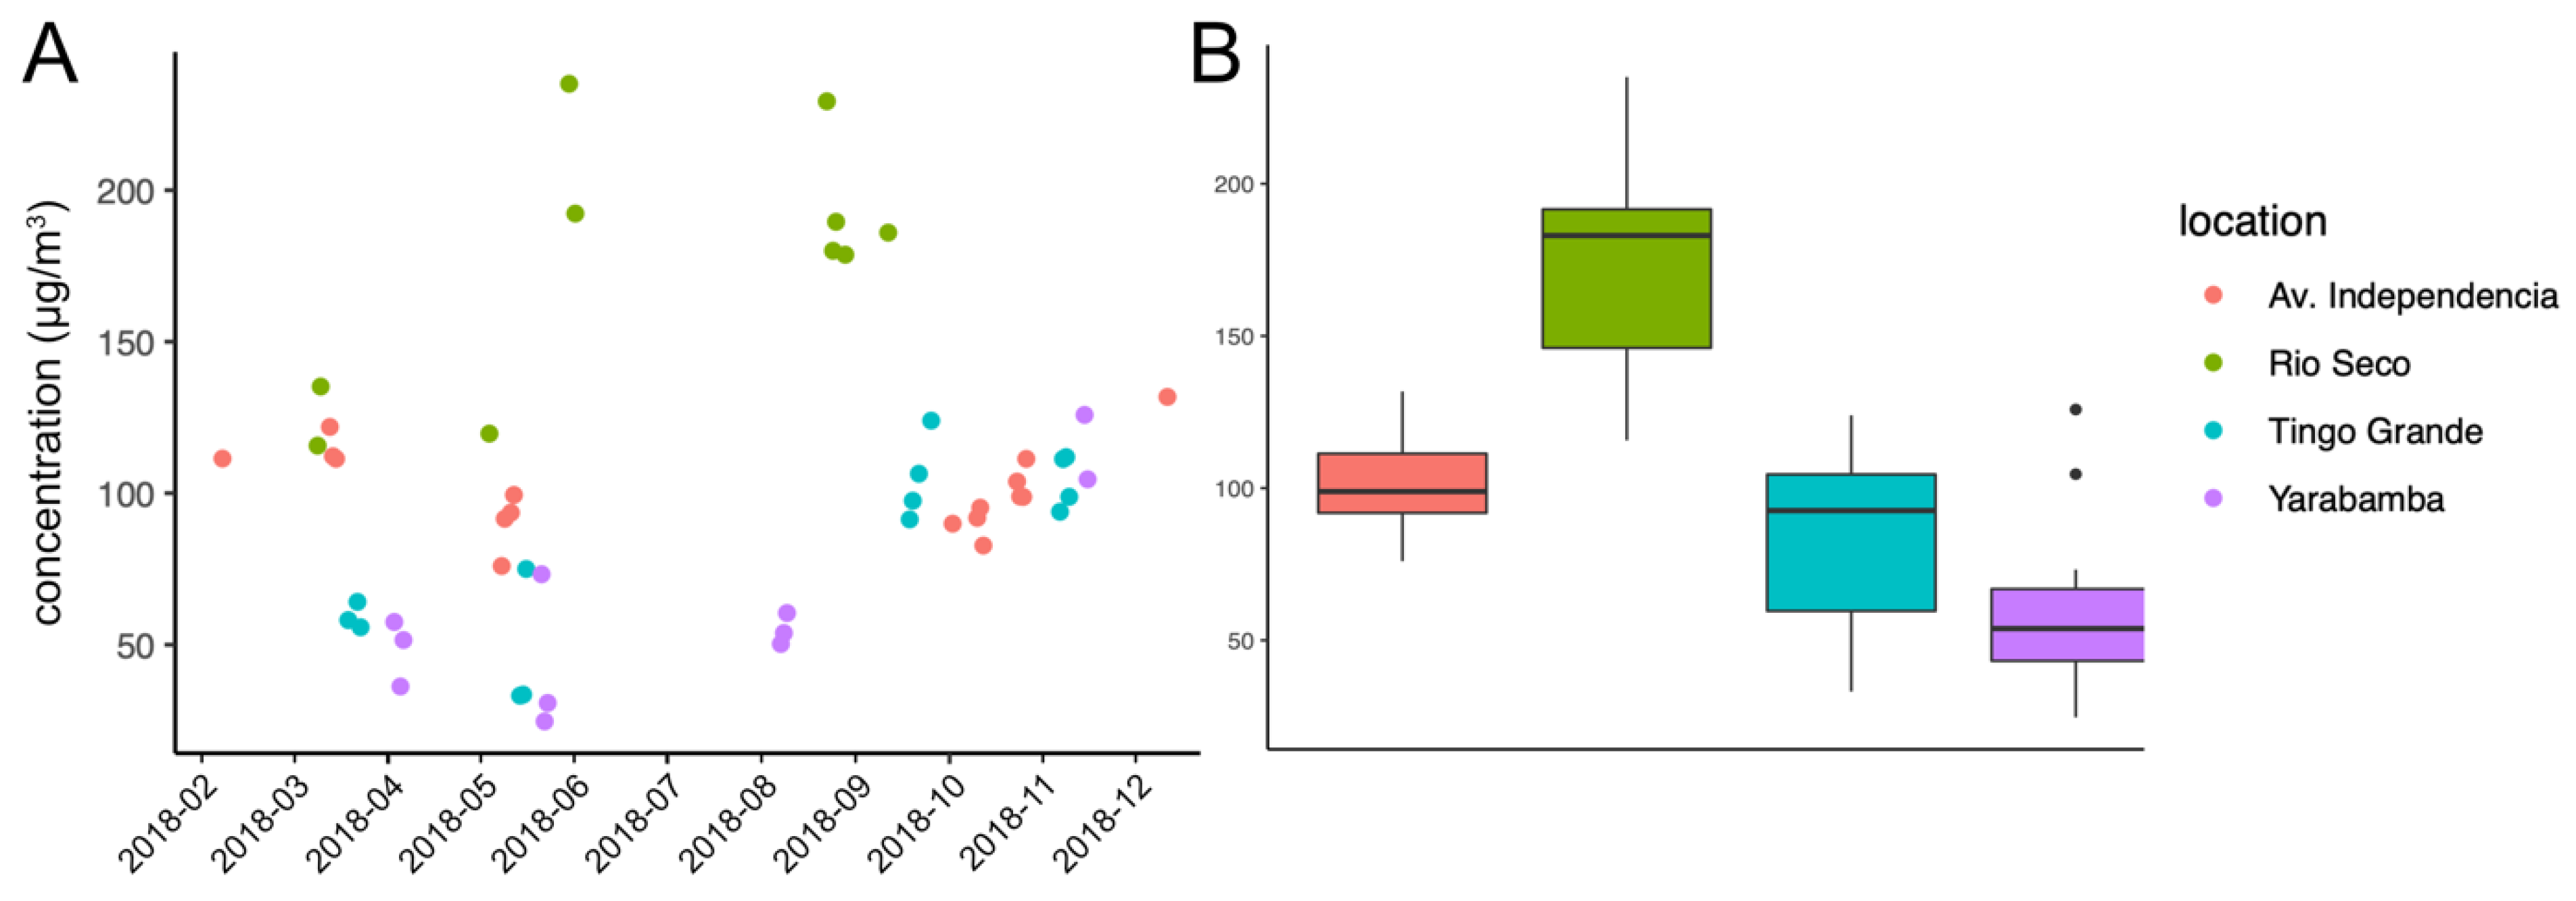
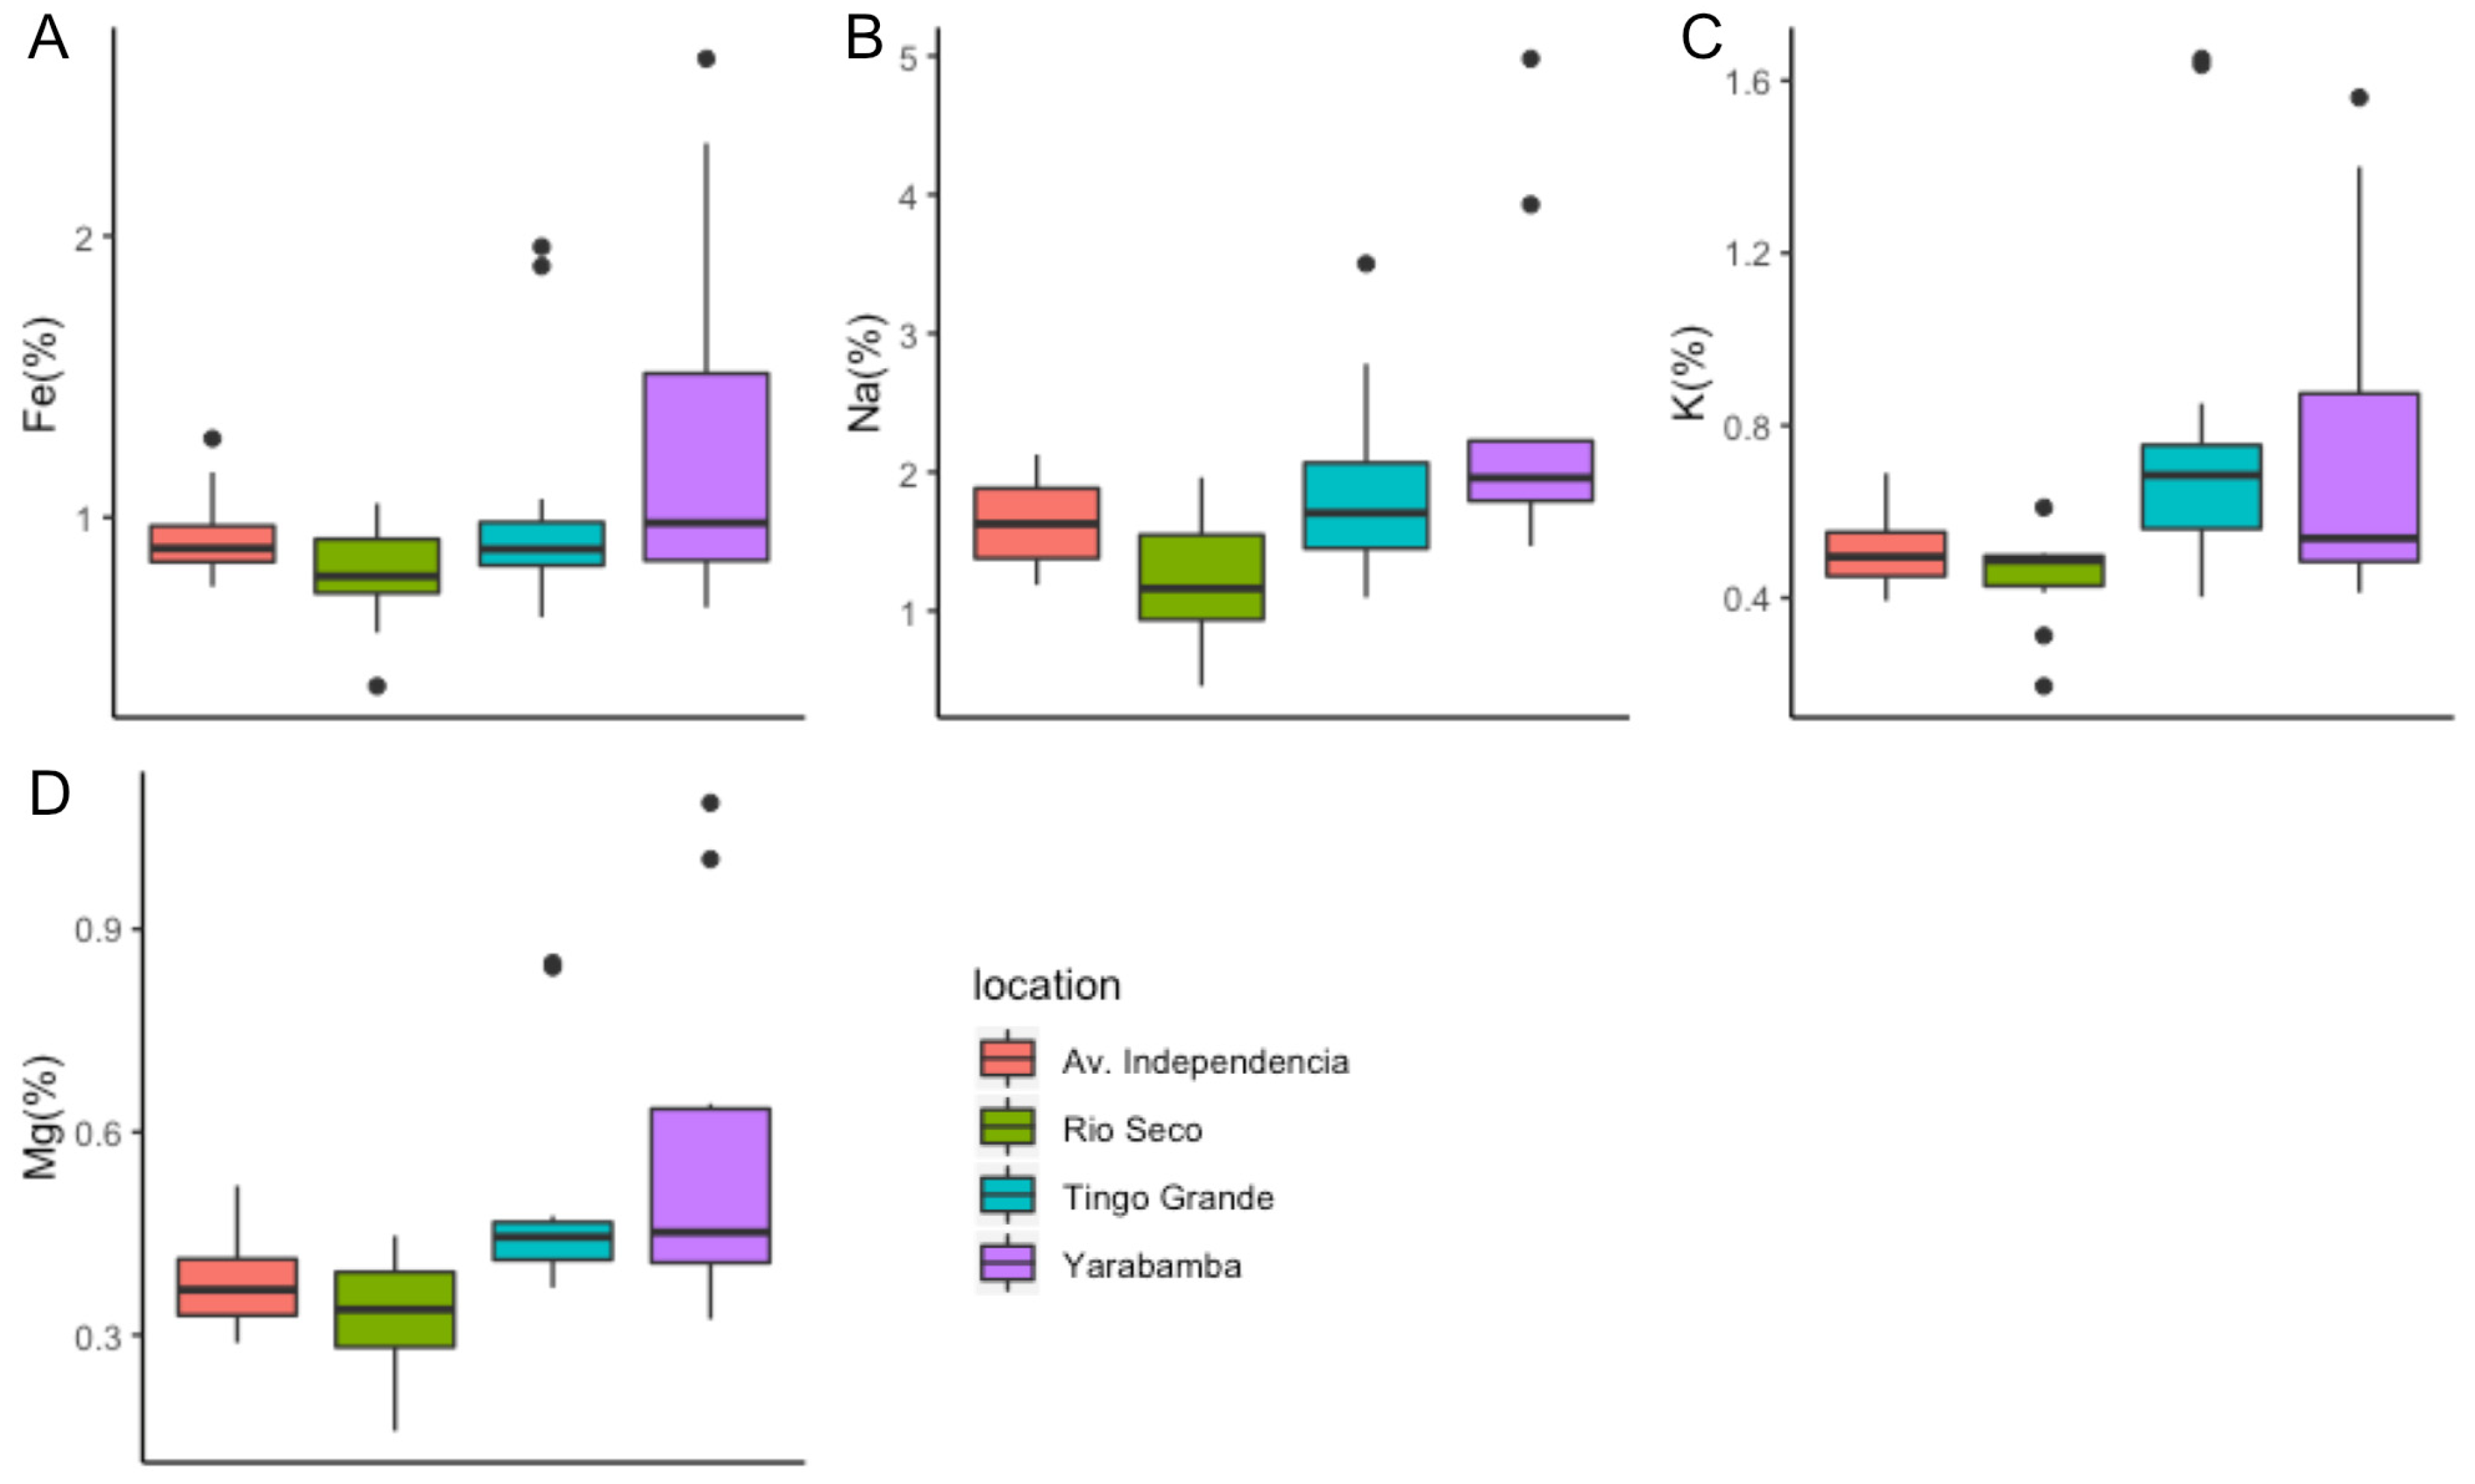
3.1. PM10 and Major Element Concentrations
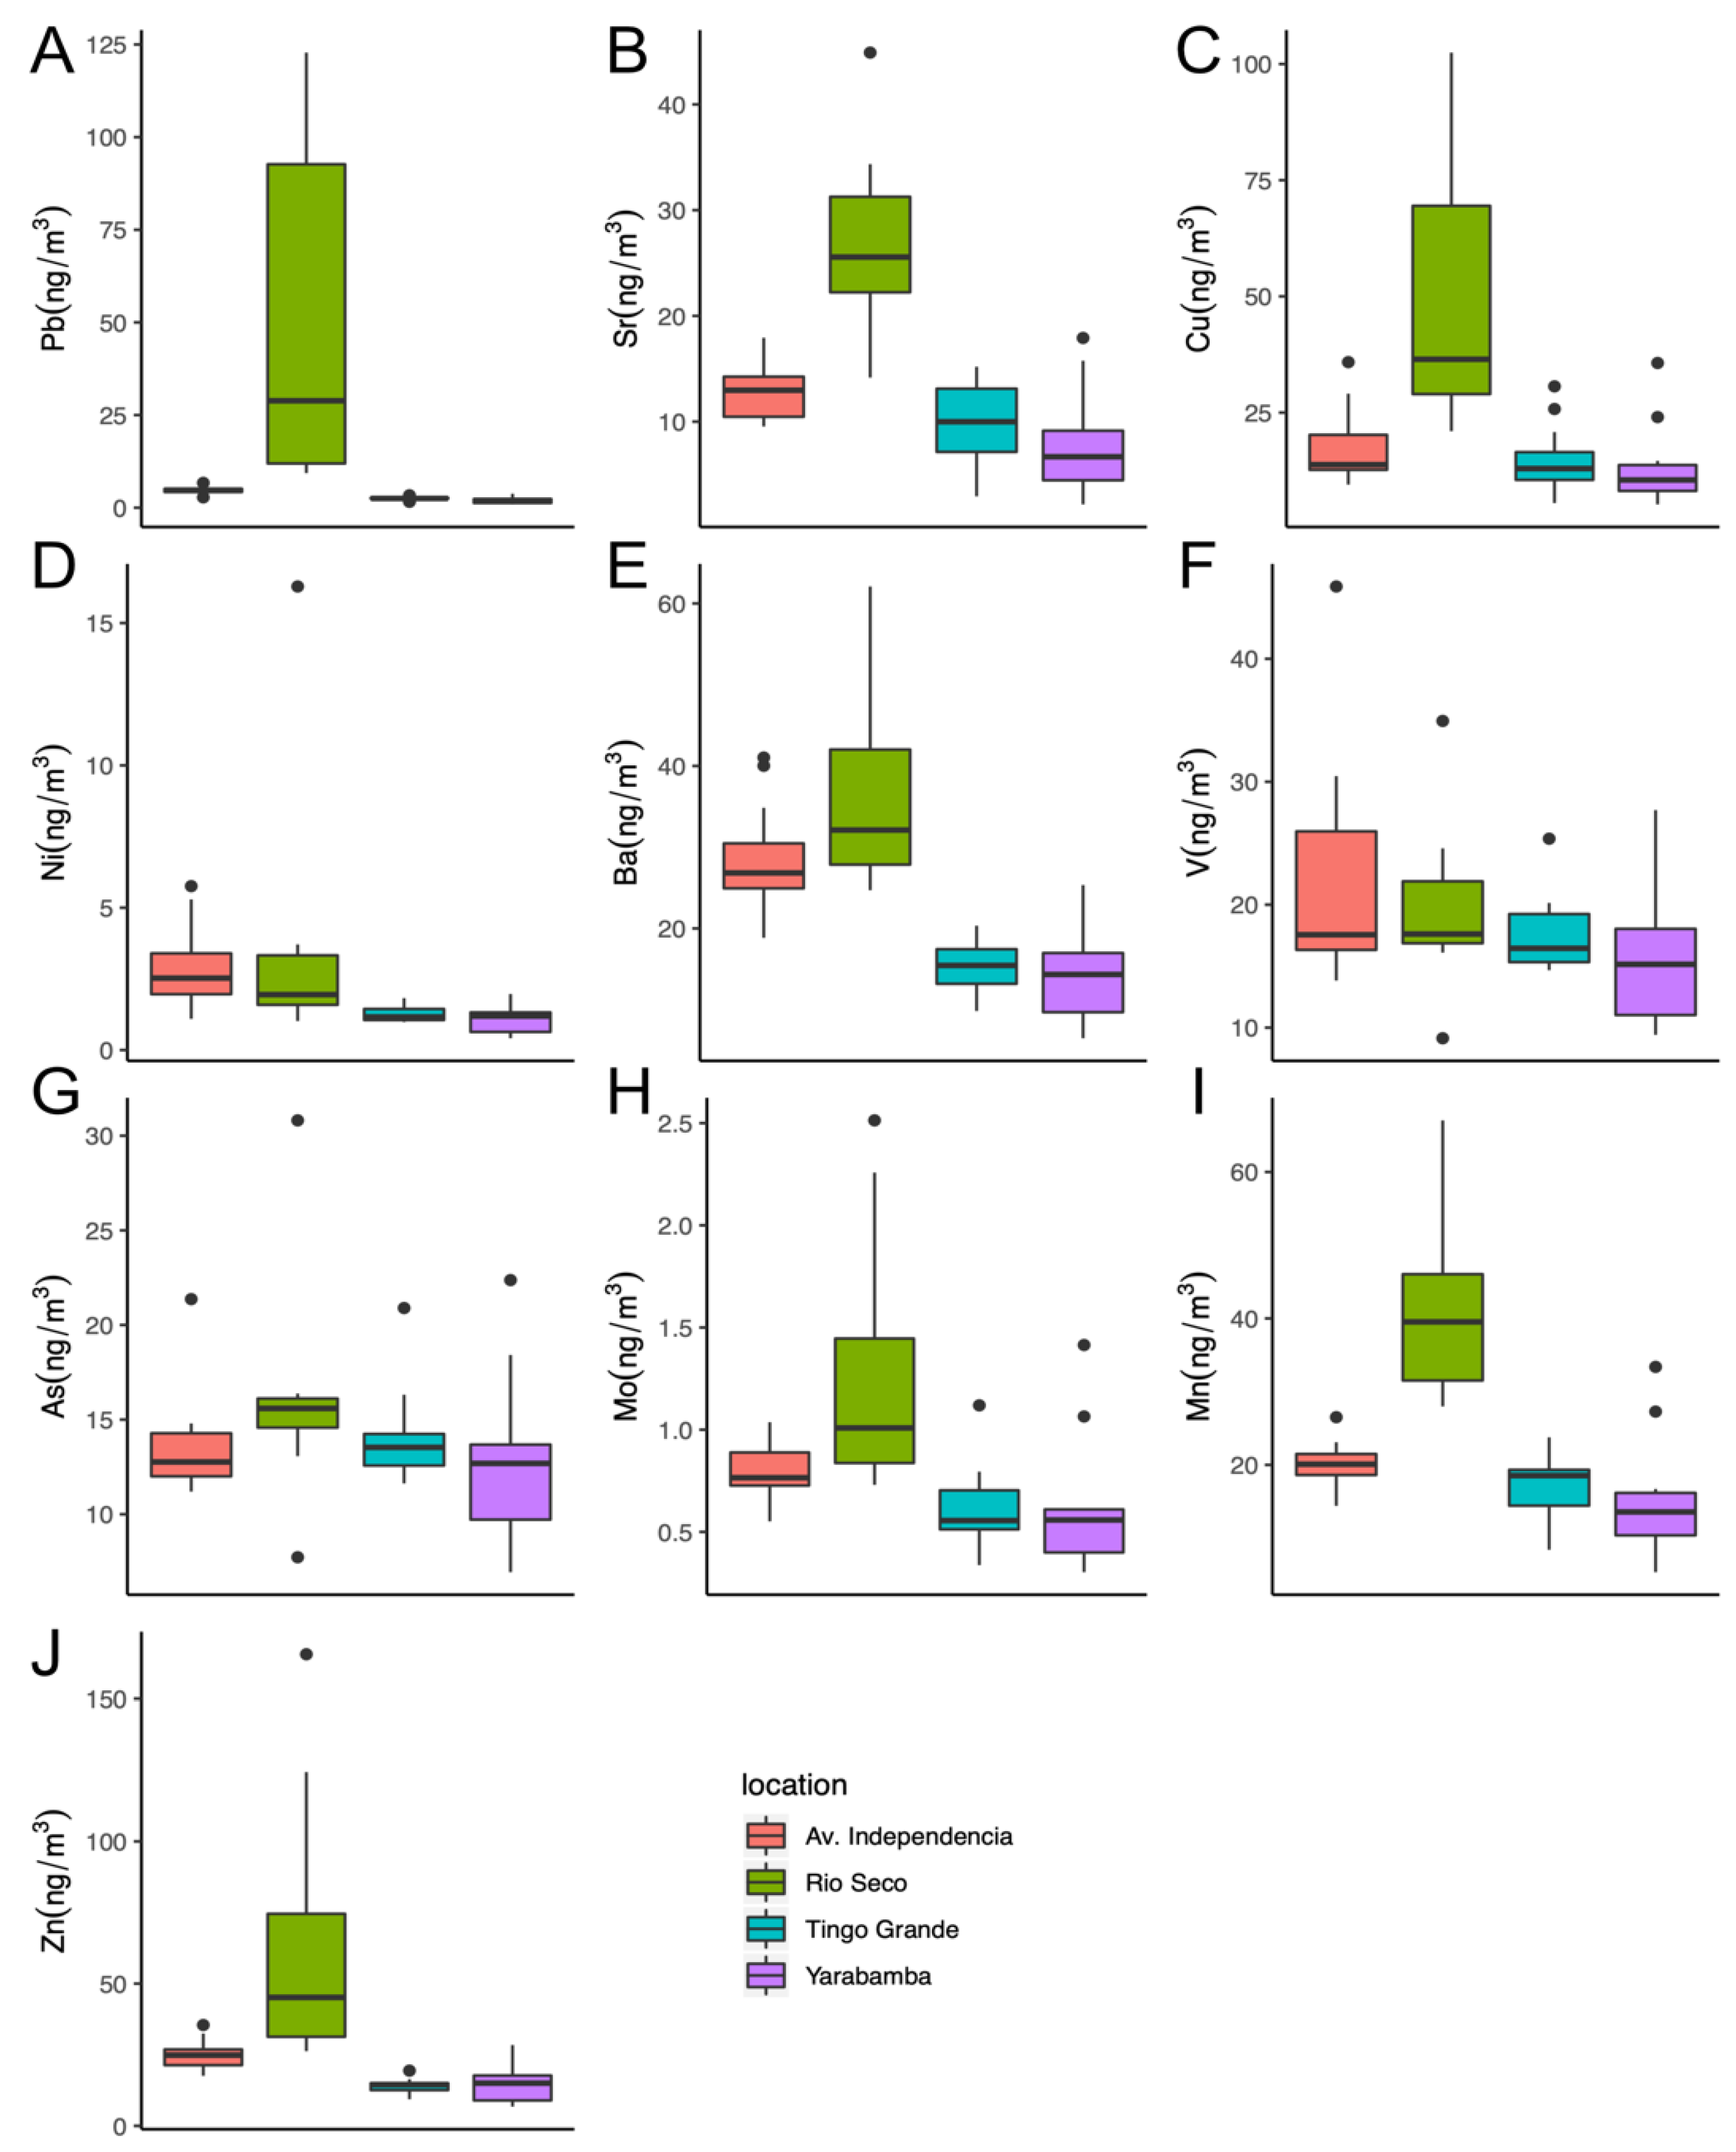
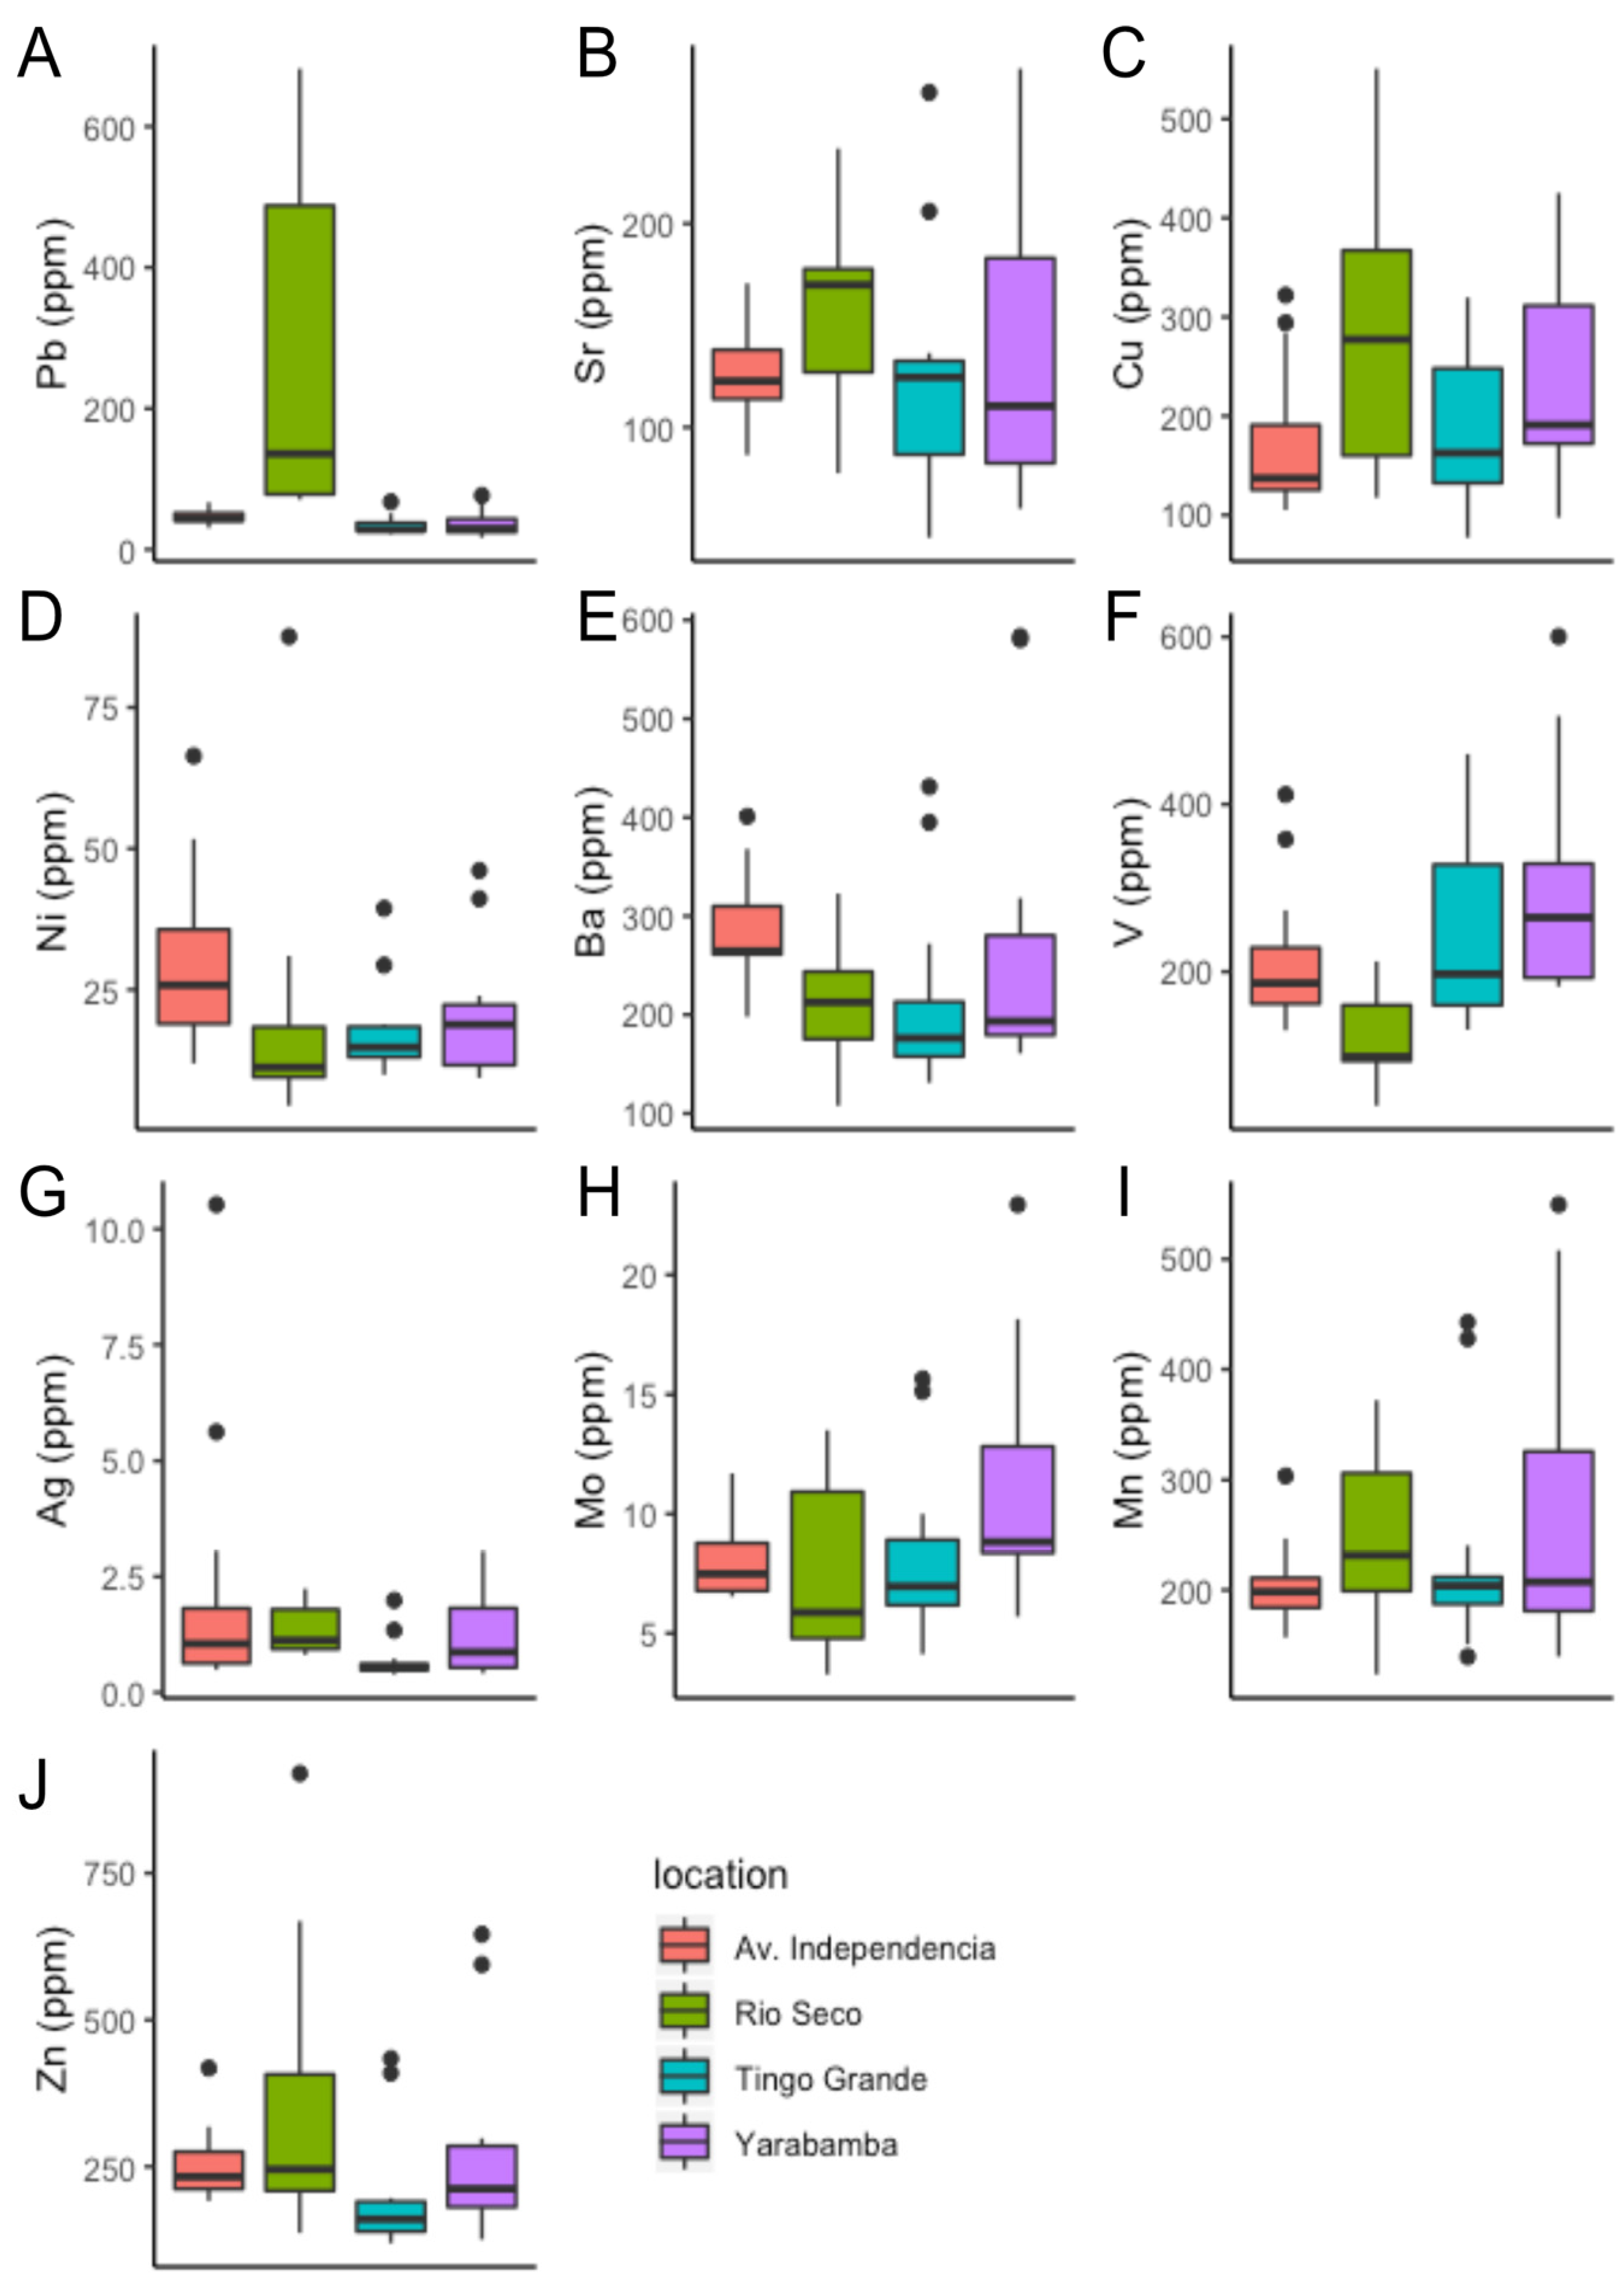
3.2. Trace Elements in PM10
3.3. Metal Emissions for Pb, Cu, Sr, Ba, Ni, V, and As
4. Conclusions
Author Contributions
Funding
Data Availability Statement
Acknowledgments
Conflicts of Interest
References
- Dockery, D.W.; Pope, C.A.; Xu, X.; Spengler, J.D.; Ware, J.H.; Fay, M.E.; Ferris, B.G., Jr.; Speizer, F.E. An association between air pollution and mortality in six US cities. N. Engl. J. Med. 1993, 329, 1753–1759. [Google Scholar] [CrossRef]
- Wilson, A.M.; Salloway, J.C.; Wake, C.P.; Kelly, T. Air pollution and the demand for hospital services: A review. Environ. Int. 2004, 30, 1109–1118. [Google Scholar] [CrossRef] [PubMed]
- Karar, K.; Gupta, A. Seasonal variations and chemical characterization of ambient PM10 at residential and industrial sites of an urban region of Kolkata (Calcutta), India. Atmos. Res. 2006, 81, 36–53. [Google Scholar] [CrossRef]
- Künzli, N.; Mudway, I.S.; Götschi, T.; Shi, T.; Kelly, F.J.; Cook, S.; Burney, P.; Forsberg, B.; Gauderman, J.W.; Hazenkamp, M.E.; et al. Comparison of Oxidative Properties, Light Absorbance, and Total and Elemental Mass Concentration of Ambient PM2.5 Collected at 20 European Sites. Environ. Health Perspect. 2006, 114, 684–690. [Google Scholar] [CrossRef] [PubMed]
- Hu, M.; Jia, L.; Wang, J.; Pan, Y. Spatial and temporal characteristics of particulate matter in Beijing, China using the Empirical Mode Decomposition method. Sci. Total Environ. 2013, 458–460, 70–80. [Google Scholar] [CrossRef] [PubMed]
- Silva, J.; Rojas, J.; Norabuena, M.; Molina, C.; Toro, R.A.; Leiva-Guzmán, M.A. Particulate matter levels in a South American megacity: The metropolitan area of Lima-Callao, Peru. Environ. Monit. Assess. 2017, 189, 635. [Google Scholar] [CrossRef]
- Duce, R.A.; Hoffman, G.L.; Zoller, W.H. Atmospheric Trace Metals at Remote Northern and Southern Hemisphere Sites: Pollution or Natural? Science 1975, 187, 59–61. [Google Scholar] [CrossRef]
- Chow, J.C.; Watson, J.G.; Lowenthal, D.H.; Hackney, R.; Magliano, K.; Lehrman, D.; Smith, T. Temporal Variations of PM2.5, PM10, and Gaseous Precursors during the 1995 Integrated Monitoring Study in Central California. J. Air Waste Manag. Assoc. 1999, 49, 16–24. [Google Scholar] [CrossRef]
- Rodríguez, S.; Querol, X.; Alastuey, A.; Viana, M.-M.; Alarcón, M.; Mantilla, E.; Ruiz, C. Comparative PM10–PM2.5 source contribution study at rural, urban and industrial sites during PM episodes in Eastern Spain. Sci. Total. Environ. 2004, 328, 95–113. [Google Scholar] [CrossRef]
- Sweet, C.W.; Vermette, S.J.; Landsberger, S. Sources of toxic trace elements in urban air in Illinois. Environ. Sci. Technol. 1993, 27, 2502–2510. [Google Scholar] [CrossRef]
- Al-Momani, I.F.; Daradkeh, A.; Haj-Hussein, A.T.; Yousef, Y.A.; Jaradat, Q.; Momani, K. Trace elements in daily collected aerosols in Al-Hashimya, central Jordan. Atmos. Res. 2005, 73, 87–100. [Google Scholar] [CrossRef]
- D’Alessandro, A.; Lucarelli, F.; Mandò, P.; Marcazzan, G.; Nava, S.; Prati, P.; Valli, G.; Vecchi, R.; Zucchiatti, A. Hourly elemental composition and sources identification of fine and coarse PM10 particulate matter in four Italian towns. J. Aerosol Sci. 2003, 34, 243–259. [Google Scholar] [CrossRef]
- Quiterio, S.L.; Da Silva, C.R.S.; Arbilla, G.; Escaleira, V. Metals in airborne particulate matter in the industrial district of Santa Cruz, Rio de Janeiro, in an annual period. Atmos. Environ. 2004, 38, 321–331. [Google Scholar] [CrossRef]
- Tsai, Y.I.; Kuo, S.-C.; Lin, Y.-H. Temporal characteristics of inhalable mercury and arsenic aerosols in the urban atmosphere in southern Taiwan. Atmos. Environ. 2003, 37, 3401–3411. [Google Scholar] [CrossRef]
- Nriagu, J.O.; Davidson, C.I. Toxic Metals in the Atmosphere; John Wiley & Sons: Hoboken, NJ, USA, 1986. [Google Scholar]
- Manoli, E.; Voutsa, D.; Samara, C. Chemical characterization and source identification/apportionment of fine and coarse air particles in Thessaloniki, Greece. Atmos. Environ. 2002, 36, 949–961. [Google Scholar] [CrossRef]
- Monaci, F.; Moni, F.; Lanciotti, E.; Grechi, D.; Bargagli, R. Biomonitoring of airborne metals in urban environments: New tracers of vehicle emission, in place of lead. Environ. Pollut. 2000, 107, 321–327. [Google Scholar] [CrossRef]
- Moreno, T.; Oldroyd, A.; McDonald, I.; Gibbons, W. Preferential Fractionation of Trace Metals–Metalloids into PM10 Resuspended from Contaminated Gold Mine Tailings at Rodalquilar, Spain. Water Air Soil Pollut. 2006, 179, 93–105. [Google Scholar] [CrossRef]
- Aneja, V.P.; Isherwood, A.; Morgan, P. Characterization of particulate matter (PM10) related to surface coal mining operations in Appalachia. Atmos. Environ. 2012, 54, 496–501. [Google Scholar] [CrossRef]
- Romero, Y.; Diaz, C.; Meldrum, I.; Velasquez, R.A.; Noel, J. Temporal and spatial analysis of traffic—Related pollutant under the influence of the seasonality and meteorological variables over an urban city in Peru. Heliyon 2020, 6, e04029. [Google Scholar] [CrossRef]
- Valdivia, A.E.L.; Larico, J.A.R.; Peña, J.S.; Wannaz, E.D. Health risk assessment of polycyclic aromatic hydrocarbons (PAHs) adsorbed in PM2.5 and PM10 in a region of Arequipa, Peru. Environ. Sci. Pollut. Res. 2019, 27, 3065–3075. [Google Scholar] [CrossRef]
- U.S. EPA. IO Compendium Method IO-3.5: Compendium of Methods for the Determination of Inorganic Compounds in Ambient Air: Determination of Metals in Ambient Particulate Matter Using Inductively Coupled Plasma/Mass Spectrometry (ICP/MS); EPA/625/R-96/010a; U.S. EPA: Cincinnati, OH, USA, 1999.
- MINAM. Informe Nacional de la Calidad de Aire 2013–2014; MINAM: Lima, Peru, 2014.
- INSIDEO S.A.C. Informe de Monitoreo Ambiental Participativo de Calidad de Aire Distrito Uchumayo; INSIDEO S.A.C.: Lima, Peru, 2014. [Google Scholar]
- Karydis, V.A.; Tsimpidi, A.P.; Pozzer, A.; Astitha, M.; Lelieveld, J. Effects of mineral dust on global atmospheric nitrate concentrations. Atmos. Chem. Phys. Discuss. 2016, 16, 1491–1509. [Google Scholar] [CrossRef]
- Prospero, J.M.; Olmez, I.; Ames, M. Al and Fe in PM 2.5 and PM 10 Suspended Particles in South-Central Florida: The Impact of the Long Range Transport of African Mineral Dust. Water Air Soil Pollut. 2001, 125, 291–317. [Google Scholar] [CrossRef]
- Zhu, X.R.; Prospero, J.M.; Millero, F.J. Diel variability of soluble Fe(II) and soluble total Fe in North African dust in the trade winds at Barbados. J. Geophys. Res. Space Phys. 1997, 102, 21297–21305. [Google Scholar] [CrossRef]
- Lafon, S.; Sokolik, I.N.; Rajot, J.L.; Caquineau, S.; Gaudichet, A. Characterization of iron oxides in mineral dust aerosols: Implications for light absorption. J. Geophys. Res. Space Phys. 2006, 111. [Google Scholar] [CrossRef]
- Li, J.; Wang, F.; Michalski, G.; Wilkins, B. Atmospheric deposition across the Atacama Desert, Chile: Compositions, source distributions, and interannual comparisons. Chem. Geol. 2019, 525, 435–446. [Google Scholar] [CrossRef]
- Olson, E.J.; Michalski, G.; Welp, L.R.; Larrea Valdivia, A.; Reyes, J.; Mamani, A.E., Sr.; Salcedo Pena, J.M.; Magara-Gomez, K.T.; Li, J.; Palma Arhuire, Y.E., Sr. Sulfur Isotope Constraints on PM2.5 Sulfate Aerosol Sources in Arequipa, Peru. AGU Fall Meet. Abstr. 2019, 2019, A23K-2926. [Google Scholar]
- Valdivia-Silva, J.; Ortega, F. Mineralogical study of the hyper-arid Mars like-soils from Pampas de La Joya, southern Peru and its implications in the geochemistry of dry environments. EPSC-DPS Jt. Meet. 2011, 2011, 1798. [Google Scholar]
- Valdivia-Silva, J.E.; Navarro-González, R.; Ortega-Gutierrez, F.; Fletcher, L.E.; Perez-Montaño, S.; Apaza, R.M.C.; McKay, C.P. Multidisciplinary approach of the hyperarid desert of Pampas de La Joya in southern Peru as a new Mars-like soil analog. Geochim. Cosmochim. Acta 2011, 75, 1975–1991. [Google Scholar] [CrossRef]
- De La Cruz, A.H.; Roca, Y.B.; Suarez-Salas, L.; Pomalaya, J.; Tolentino, D.A.; Gioda, A. Chemical Characterization of PM2.5 at Rural and Urban Sites around the Metropolitan Area of Huancayo (Central Andes of Peru). Atmosphere 2019, 10, 21. [Google Scholar] [CrossRef]
- Somoano, M.M.D.; Kylander, M.E.; López-Antón, M.A.; Suárez-Ruiz, I.; Tarazona, M.R.M.; Ferrat, M.; Kober, B.; Weiss, D.J. Stable Lead Isotope Compositions In Selected Coals From Around The World And Implications For Present Day Aerosol Source Tracing. Environ. Sci. Technol. 2009, 43, 1078–1085. [Google Scholar] [CrossRef]
- Bozlaker, A.; Prospero, J.M.; Price, J.; Chellam, S. Linking Barbados Mineral Dust Aerosols to North African Sources Using Elemental Composition and Radiogenic Sr, Nd, and Pb Isotope Signatures. J. Geophys. Res. Atmos. 2018, 123, 1384–1400. [Google Scholar] [CrossRef]
- Dong, S.; Weiss, D.J.; Strekopytov, S.; Kreissig, K.; Sun, Y.; Baker, A.R.; Formenti, P. Stable isotope ratio measurements of Cu and Zn in mineral dust (bulk and size fractions) from the Taklimakan Desert and the Sahel and in aerosols from the eastern tropical North Atlantic Ocean. Talanta 2013, 114, 103–109. [Google Scholar] [CrossRef] [PubMed]
- Quang, C.X.; Clark, A.H.; Lee, J.K.W.; Guillén, J. 40Ar-39Ar ages of hypogene and supergene mineralization in the Cerro Verde-Santa Rosa porphyry Cu-Mo cluster, Arequipa, Peru. Econ. Geol. 2003, 98, 1683–1696. [Google Scholar] [CrossRef]
- Haroun, M.; Idris, A.; Omar, S.S. A study of heavy metals and their fate in the composting of tannery sludge. Waste Manag. 2007, 27, 1541–1550. [Google Scholar] [CrossRef] [PubMed]
- Jiang, Q.; Yang, X. Sedimentological and Geochemical Composition of Aeolian Sediments in the Taklamakan Desert: Implications for Provenance and Sediment Supply Mechanisms. J. Geophys. Res. Earth Surf. 2019, 124, 1217–1237. [Google Scholar] [CrossRef]
- Bencharif-Madani, F.; Ali-Khodja, H.; Kemmouche, A.; Terrouche, A.; Lokorai, K.; Naidja, L.; Bouziane, M. Mass concentrations, seasonal variations, chemical compositions and element sources of PM10 at an urban site in Constantine, northeast Algeria. J. Geochem. Explor. 2019, 206, 106356. [Google Scholar] [CrossRef]
- Galindo, N.; Yubero, E.; Nicolás, J.; Varea, M.; Crespo, J. Characterization of metals in PM1 and PM10 and health risk evaluation at an urban site in the western Mediterranean. Chemosphere 2018, 201, 243–250. [Google Scholar] [CrossRef]
- White, W.H.; Hyslop, N.P.; Trzepla, K.; Yatkin, S.; Rarig, R.S., Jr.; Gill, T.E.; Jin, L. Regional transport of a chemically distinctive dust: Gypsum from White Sands, New Mexico (USA). Aeolian Res. 2015, 16, 1–10. [Google Scholar] [CrossRef]
- Rech, J.; Quade, J.; Hart, W.S. Isotopic evidence for the source of Ca and S in soil gypsum, anhydrite and calcite in the Atacama Desert, Chile. Geochim. Cosmochim. Acta 2003, 67, 575–586. [Google Scholar] [CrossRef]
- Manno, E.; Varrica, D.; Dongarrà, G. Metal distribution in road dust samples collected in an urban area close to a petrochemical plant at Gela, Sicily. Atmos. Environ. 2006, 40, 5929–5941. [Google Scholar] [CrossRef]
- Sternbeck, J.; Sjödin, Å.; Andréasson, K. Metal emissions from road traffic and the influence of resuspension—Results from two tunnel studies. Atmos. Environ. 2002, 36, 4735–4744. [Google Scholar] [CrossRef]
- Duong, T.T.; Lee, B.-K. Partitioning and mobility behavior of metals in road dusts from national-scale industrial areas in Korea. Atmos. Environ. 2009, 43, 3502–3509. [Google Scholar] [CrossRef]
- Kong, S.; Lu, B.; Ji, Y.; Zhao, X.; Chen, L.; Li, Z.; Han, B.; Bai, Z. Levels, risk assessment and sources of PM10 fraction heavy metals in four types dust from a coal-based city. Microchem. J. 2011, 98, 280–290. [Google Scholar] [CrossRef]
- Xu, H.; Ho, S.S.H.; Cao, J.; Guinot, B.; Kan, H.; Shen, Z.; Ho, K.F.; Liu, S.; Zhao, Z.; Li, J.; et al. A 10-year observation of PM2.5-bound nickel in Xi’an, China: Effects of source control on its trend and associated health risks. Sci. Rep. 2017, 7, 41132. [Google Scholar] [CrossRef] [PubMed]
- Valdés, A.; Polvé, M.; Munoz, M.; Toutain, J.P.; Morata, D. Geochemical features of aerosols in Santiago de Chile from time series analysis. Environ. Earth Sci. 2013, 69, 2073–2090. [Google Scholar] [CrossRef][Green Version]
- Monakhov, I.N.; Khromov, S.V.; Chernousov, P.I.; Yusfin, Y.S. The Flow of Vanadium-Bearing Materials in Industry. Metallurgist 2004, 48, 381–385. [Google Scholar] [CrossRef]
- Pandolfi, M.; Gonzalez-Castanedo, Y.; Alastuey, A.; De La Rosa, J.D.; Mantilla, E.; De La Campa, A.S.; Querol, X.; Pey, J.; Amato, F.; Moreno, T. Source apportionment of PM10 and PM2.5 at multiple sites in the strait of Gibraltar by PMF: Impact of shipping emissions. Environ. Sci. Pollut. Res. 2011, 18, 260–269. [Google Scholar] [CrossRef] [PubMed]
- Ali, M.F.; Bukhari, A.; Saleem, M. Trace metals in crude oils from Saudi Arabia. Ind. Eng. Chem. Prod. Res. Dev. 1983, 22, 691–694. [Google Scholar] [CrossRef]
- Amato, F.; Pandolfi, M.; Viana, M.; Querol, X.; Alastuey, A.; Moreno, T. Spatial and chemical patterns of PM10 in road dust deposited in urban environment. Atmos. Environ. 2009, 43, 1650–1659. [Google Scholar] [CrossRef]
- Chow, J.C.; Watson, J.G.; Ashbaugh, L.L.; Magliano, K.L. Similarities and differences in PM10 chemical source profiles for geological dust from the San Joaquin Valley, California. Atmos. Environ. 2003, 37, 1317–1340. [Google Scholar] [CrossRef]
- Ho, K.; Lee, S.; Chow, J.C.; Watson, J.G. Characterization of PM10 and PM2.5 source profiles for fugitive dust in Hong Kong. Atmos. Environ. 2003, 37, 1023–1032. [Google Scholar] [CrossRef]
- Vega, E.; Mugica, V.; Reyes, E.; Sánchez, G.; Chow, J.; Watson, J. Chemical composition of fugitive dust emitters in Mexico City. Atmos. Environ. 2001, 35, 4033–4039. [Google Scholar] [CrossRef]
- López, L.; Mónaco, S.L.; Galarraga, F.; Lira, A.; Cruz, C. VNi ratio in maltene and asphaltene fractions of crude oils from the west Venezuelan basin: Correlation studies. Chem. Geol. 1995, 119, 255–262. [Google Scholar] [CrossRef]
- Chow, J.C.; Watson, J.G.; Fujita, E.M.; Lu, Z.; Lawson, D.R.; Ashbaugh, L.L. Temporal and spatial variations of PM2.5 and PM10 aerosol in the Southern California air quality study. Atmos. Environ. 1994, 28, 2061–2080. [Google Scholar] [CrossRef]
- Sánchez-Rodas, D.; De La Campa, S.; De La Rosa, J.D.; Oliveira, V.; Gómez-Ariza, J.L.; Querol, X.; Alastuey, A. Arsenic speciation of atmospheric particulate matter (PM10) in an industrialised urban site in southwestern Spain. Chemosphere 2007, 66, 1485–1493. [Google Scholar] [CrossRef]
- Zheng, J.; Tan, M.; Shibata, Y.; Tanaka, A.; Li, Y.; Zhang, G.; Zhang, Y.; Shan, Z. Characteristics of lead isotope ratios and elemental concentrations in PM10 fraction of airborne particulate matter in Shanghai after the phase-out of leaded gasoline. Atmos. Environ. 2004, 38, 1191–1200. [Google Scholar] [CrossRef]
- Xie, R.; Seip, H.M.; Wibetoe, G.; Nori, S.; McLeod, C.W. Heavy coal combustion as the dominant source of particulate pollution in Taiyuan, China, corroborated by high concentrations of arsenic and selenium in PM10. Sci. Total Environ. 2006, 370, 409–415. [Google Scholar] [CrossRef]
- Lu, H.; Chen, H.; Li, W.; Li, B. Transformation of arsenic in Yima coal during fluidized-bed pyrolysis. Fuel 2004, 83, 645–650. [Google Scholar] [CrossRef]
- Zhao, C.; Luo, K. Sulfur, arsenic, fluorine and mercury emissions resulting from coal-washing byproducts: A critical component of China’s emission inventory. Atmos. Environ. 2017, 152, 270–278. [Google Scholar] [CrossRef]
- Kavouras, I.G.; Koutrakis, P.; Cereceda-Balic, F.; Oyola, P. Source Apportionment of PM10 and PM25 in Five Chilean Cities Using Factor Analysis. J. Air Waste Manag. Assoc. 2001, 51, 451–464. [Google Scholar] [CrossRef]
- Goldberg, S. Competitive adsorption of arsenate and arsenite on oxides and clay minerals. Soil Sci. Soc. Am. J. 2002, 66, 413–421. [Google Scholar] [CrossRef]
- Escalante, G.; Campos, V.L.; Valenzuela, C.; Yañez, J.; Zaror, C.; Mondaca, M.A. Arsenic resistant bacteria isolated from arsenic contaminated river in the Atacama Desert (Chile). Bull. Environ. Contam. Toxicol. 2009, 83, 657–661. [Google Scholar] [CrossRef] [PubMed]


| Element | Rio Seco | Av. Independencia | Tingo Grande | Yarabamba | ||||||||||||
|---|---|---|---|---|---|---|---|---|---|---|---|---|---|---|---|---|
| Min | Max | Mean | Stdev | Min | Max | Mean | Stdev | Min | Max | Mean | Stdev | Min | Max | Mean | Stdev | |
| Pb | 9.3 | 122.8 | 51.1 | 48.0 | 2.8 | 6.7 | 4.6 | 1.0 | 1.6 | 3.4 | 2.5 | 0.5 | 0.9 | 3.8 | 2.0 | 0.9 |
| Sr | 14.2 | 44.5 | 27.0 | 8.9 | 9.5 | 7.9 | 12.8 | 2.5 | 2.9 | 15.2 | 9.6 | 4.2 | 2.2 | 17.9 | 7.8 | 5.0 |
| Cu | 21.0 | 102.4 | 51.3 | 30.6 | 9.5 | 35.9 | 17.1 | 7.4 | 5.5 | 30.6 | 14.5 | 7.1 | 5.2 | 35.7 | 13.4 | 9.0 |
| Ni | 1.0 | 16.3 | 3.5 | 4.6 | 1.1 | 5.8 | 3.0 | 1.4 | 1.0 | 1.8 | 1.3 | 0.3 | 0.4 | 2.0 | 1.1 | 0.5 |
| Ba | 24.7 | 62.1 | 36.6 | 12.4 | 18.8 | 41.0 | 28.3 | 6.2 | 9.8 | 20.3 | 15.3 | 2.8 | 6.5 | 25.3 | 14.4 | 6.1 |
| V | 9.1 | 35.0 | 19.6 | 6.8 | 13.8 | 45.9 | 21.3 | 8.1 | 14.7 | 25.4 | 17.4 | 3.0 | 7.4 | 27.7 | 15.8 | 5.8 |
| As | 7.7 | 30.8 | 16.1 | 5.8 | 11.2 | 21.4 | 13.4 | 2.4 | 11.6 | 20.9 | 14.0 | 2.3 | 6.9 | 22.4 | 12.7 | 4.6 |
| Zn | 26.3 | 165.6 | 63.6 | 46.9 | 17.6 | 35.4 | 25.1 | 5.0 | 9.3 | 19.4 | 13.9 | 2.6 | 6.8 | 28.4 | 14.9 | 7.0 |
| Mn | 28.0 | 67.0 | 41.6 | 13.2 | 14.4 | 26.5 | 20.2 | 2.7 | 8.4 | 23.8 | 16.9 | 4.6 | 5.4 | 33.4 | 15.1 | 8.4 |
| Mo | 0.7 | 2.5 | 1.3 | 0.6 | 0.6 | 1.0 | 0.8 | 0.1 | 0.3 | 1.1 | 0.6 | 0.2 | 0.3 | 1.4 | 0.6 | 0.3 |
| Fe | 0.9 | 1.9 | 1.3 | 0.3 | 0.7 | 1.3 | 0.9 | 0.1 | 0.4 | 1.1 | 0.8 | 0.2 | 0.3 | 1.5 | 0.7 | 0.4 |
| Na | 1.0 | 3.5 | 2.0 | 0.7 | 1.1 | 2.5 | 1.7 | 0.4 | 0.8 | 2.1 | 1.4 | 0.4 | 0.7 | 2.3 | 1.3 | 0.5 |
| K | 0.4 | 0.9 | 0.8 | 0.2 | 0.4 | 0.7 | 0.5 | 0.1 | 0.2 | 0.9 | 0.6 | 0.2 | 0.1 | 0.9 | 0.4 | 0.2 |
| Mg | 0.4 | 0.7 | 0.6 | 0.1 | 0.3 | 0.6 | 0.4 | 0.1 | 0.3 | 0.5 | 0.4 | 0.1 | 0.1 | 0.7 | 0.3 | 0.2 |
| Ca | 1.3 | 2.9 | 2.1 | 0.6 | 1.1 | 1.7 | 1.3 | 0.2 | 0.6 | 1.6 | 1.1 | 0.3 | 0.4 | 1.9 | 0.9 | 0.5 |
| Element | Rio Seco | Av. Independencia | Tingo Grande | Yarabamba | ||||||||||||
|---|---|---|---|---|---|---|---|---|---|---|---|---|---|---|---|---|
| Min | Max | Mean | Stdev | Min | Max | Mean | Stdev | Min | Max | Mean | Stdev | Min | Max | Mean | Stdev | |
| Pb | 71 | 682 | 277 | 256 | 30 | 67 | 46 | 9 | 22 | 67 | 34 | 13 | 17 | 77 | 37 | 20 |
| Sr | 77 | 237 | 157 | 47 | 86 | 171 | 127 | 24 | 46 | 264 | 122 | 58 | 60 | 276 | 134 | 70 |
| Cu | 117 | 551 | 293 | 155 | 105 | 322 | 170 | 69 | 77 | 320 | 187 | 80 | 97 | 425 | 230 | 105 |
| Ni | 4 | 88 | 21 | 25 | 12 | 66 | 30 | 15 | 10 | 39 | 17 | 8 | 9 | 46 | 21 | 12 |
| Ba | 108 | 323 | 213 | 62 | 198 | 401 | 281 | 55 | 131 | 431 | 211 | 93 | 161 | 583 | 273 | 159 |
| V | 40 | 212 | 121 | 56 | 130 | 412 | 211 | 76 | 131 | 460 | 248 | 117 | 182 | 600 | 297 | 140 |
| As | 34 | 172 | 97 | 39 | 97 | 192 | 134 | 24 | 104 | 384 | 197 | 89 | 137 | 514 | 240 | 120 |
| Zn | 137 | 920 | 362 | 251 | 191 | 418 | 250 | 55 | 119 | 434 | 195 | 99 | 126 | 646 | 282 | 175 |
| Mn | 123 | 373 | 245 | 80 | 157 | 304 | 203 | 36 | 140 | 443 | 225 | 93 | 139 | 550 | 271 | 142 |
| Mo | 3 | 14 | 8 | 4 | 7 | 12 | 8 | 2 | 4 | 16 | 8 | 3 | 6 | 23 | 11 | 5 |
| Fe | 0.4 | 1.1 | 0.8 | 0.2 | 0.8 | 1.3 | 0.9 | 0.1 | 0.6 | 2.0 | 1.0 | 0.4 | 0.7 | 2.6 | 1.3 | 0.7 |
| Na | 0.5 | 2.0 | 1.2 | 0.5 | 1.2 | 2.1 | 1.6 | 0.3 | 1.1 | 3.5 | 1.9 | 0.6 | 1.5 | 5.0 | 2.4 | 1.1 |
| K | 0.2 | 0.6 | 0.4 | 0.1 | 0.4 | 0.7 | 0.5 | 0.1 | 0.4 | 1.7 | 0.8 | 0.4 | 0.4 | 1.6 | 0.7 | 0.4 |
| Mg | 0.2 | 0.4 | 0.3 | 0.1 | 0.3 | 0.5 | 0.4 | 0.1 | 0.4 | 0.9 | 0.5 | 0.2 | 0.3 | 1.1 | 0.6 | 0.3 |
| Ca | 0.7 | 1.6 | 1.2 | 0.3 | 1.1 | 1.7 | 1.3 | 0.2 | 0.9 | 3.0 | 1.5 | 0.6 | 1.0 | 3.3 | 1.7 | 0.8 |
Publisher’s Note: MDPI stays neutral with regard to jurisdictional claims in published maps and institutional affiliations. |
© 2021 by the authors. Licensee MDPI, Basel, Switzerland. This article is an open access article distributed under the terms and conditions of the Creative Commons Attribution (CC BY) license (https://creativecommons.org/licenses/by/4.0/).
Share and Cite
Li, J.; Michalski, G.; Olson, E.J.; Welp, L.R.; Larrea Valdivia, A.E.; Larico, J.R.; Zapata, F.A.; Paredes, L.M. Geochemical Characterization and Heavy Metal Sources in PM10 in Arequipa, Peru. Atmosphere 2021, 12, 641. https://doi.org/10.3390/atmos12050641
Li J, Michalski G, Olson EJ, Welp LR, Larrea Valdivia AE, Larico JR, Zapata FA, Paredes LM. Geochemical Characterization and Heavy Metal Sources in PM10 in Arequipa, Peru. Atmosphere. 2021; 12(5):641. https://doi.org/10.3390/atmos12050641
Chicago/Turabian StyleLi, Jianghanyang, Greg Michalski, Elizabeth Joy Olson, Lisa R. Welp, Adriana E. Larrea Valdivia, Juan Reyes Larico, Francisco Alejo Zapata, and Lino Morales Paredes. 2021. "Geochemical Characterization and Heavy Metal Sources in PM10 in Arequipa, Peru" Atmosphere 12, no. 5: 641. https://doi.org/10.3390/atmos12050641
APA StyleLi, J., Michalski, G., Olson, E. J., Welp, L. R., Larrea Valdivia, A. E., Larico, J. R., Zapata, F. A., & Paredes, L. M. (2021). Geochemical Characterization and Heavy Metal Sources in PM10 in Arequipa, Peru. Atmosphere, 12(5), 641. https://doi.org/10.3390/atmos12050641