
Improved Algorithms for Remote Sensing-Based Aerosol Retrieval during Extreme Biomass Burning Events

Abstract
1. Introduction
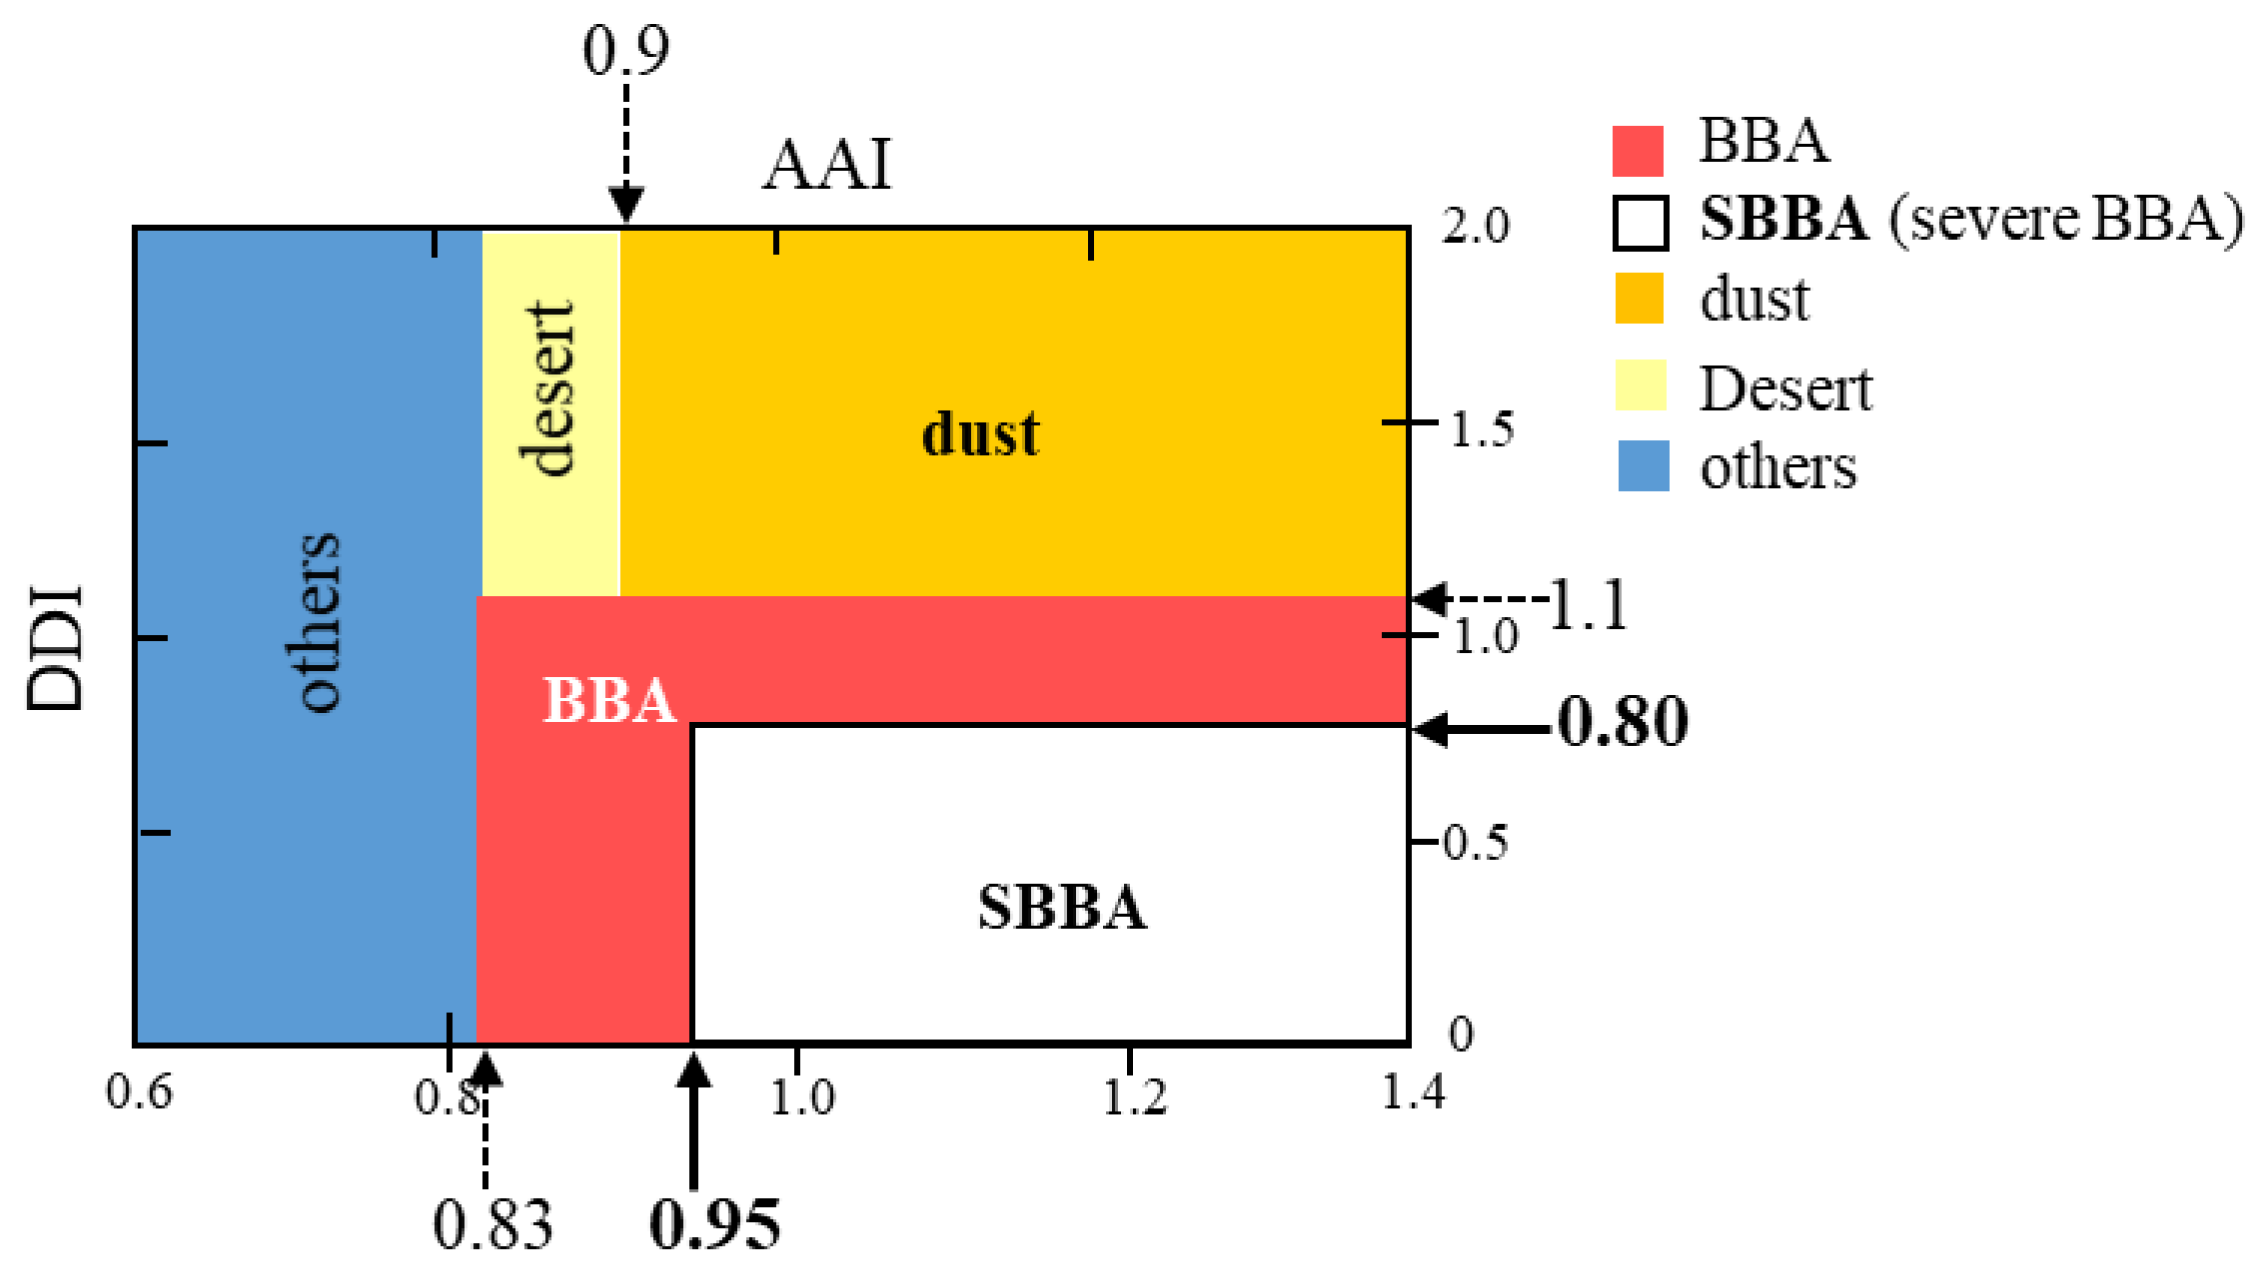
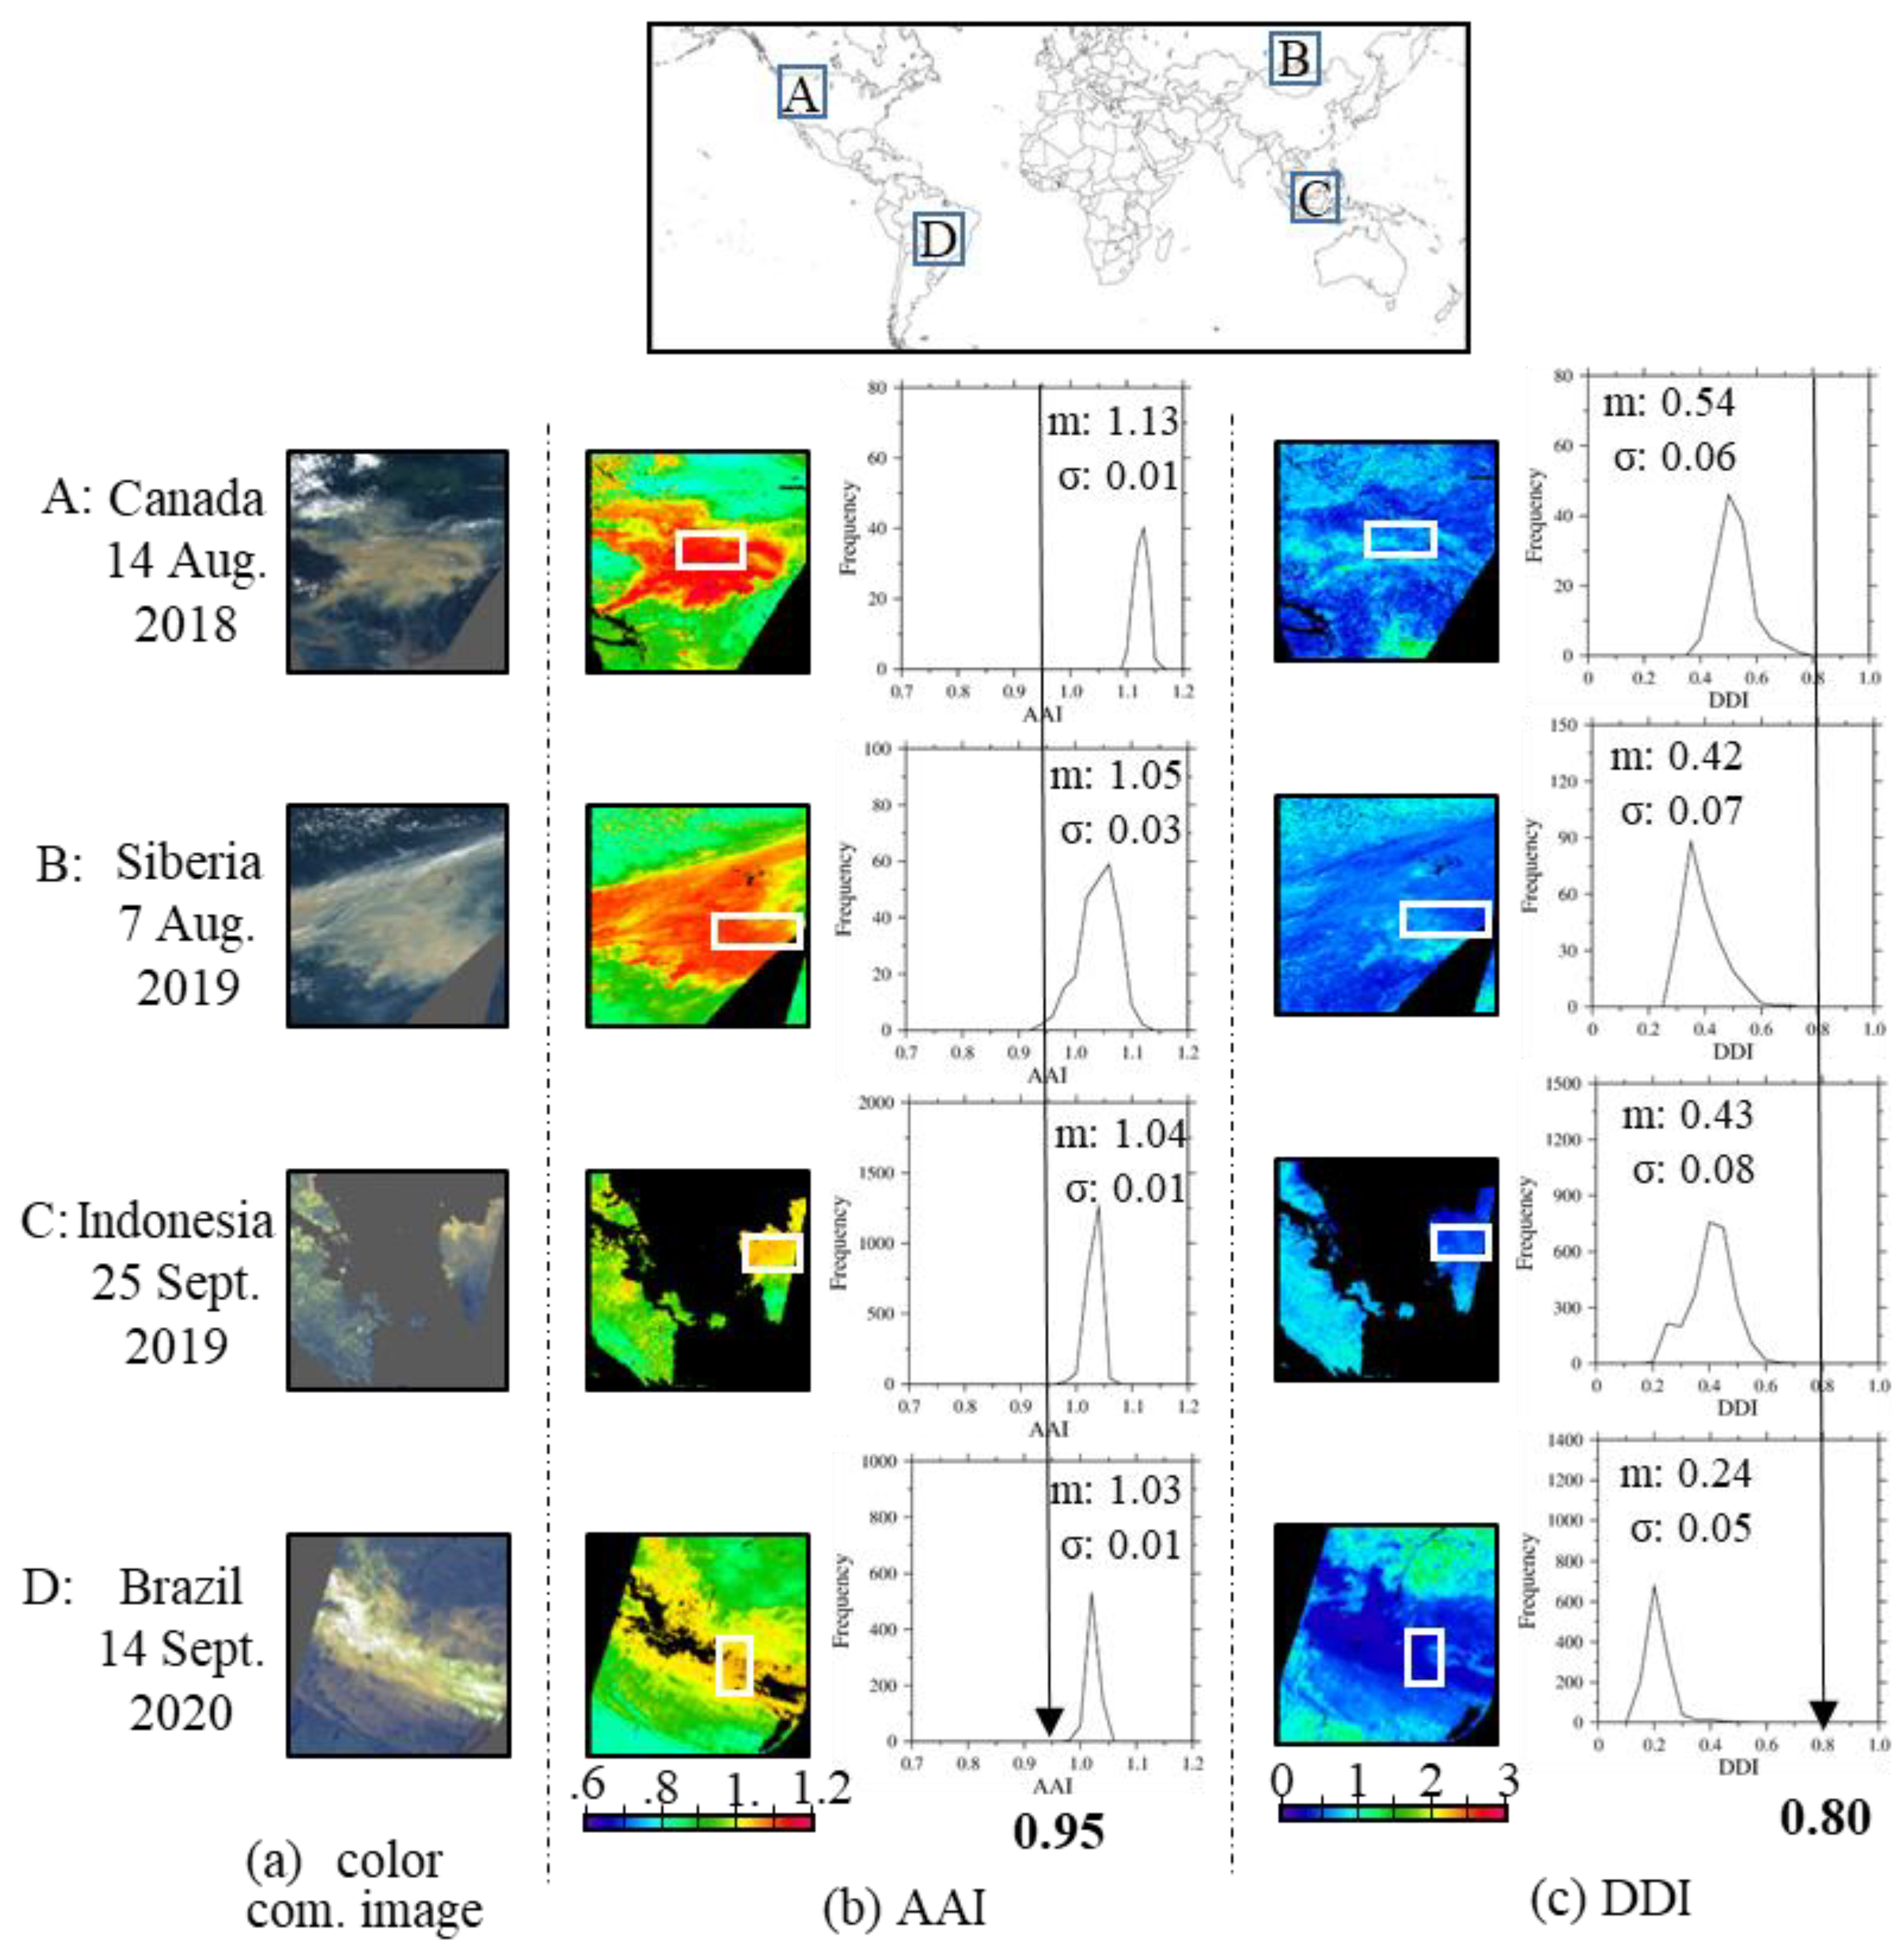
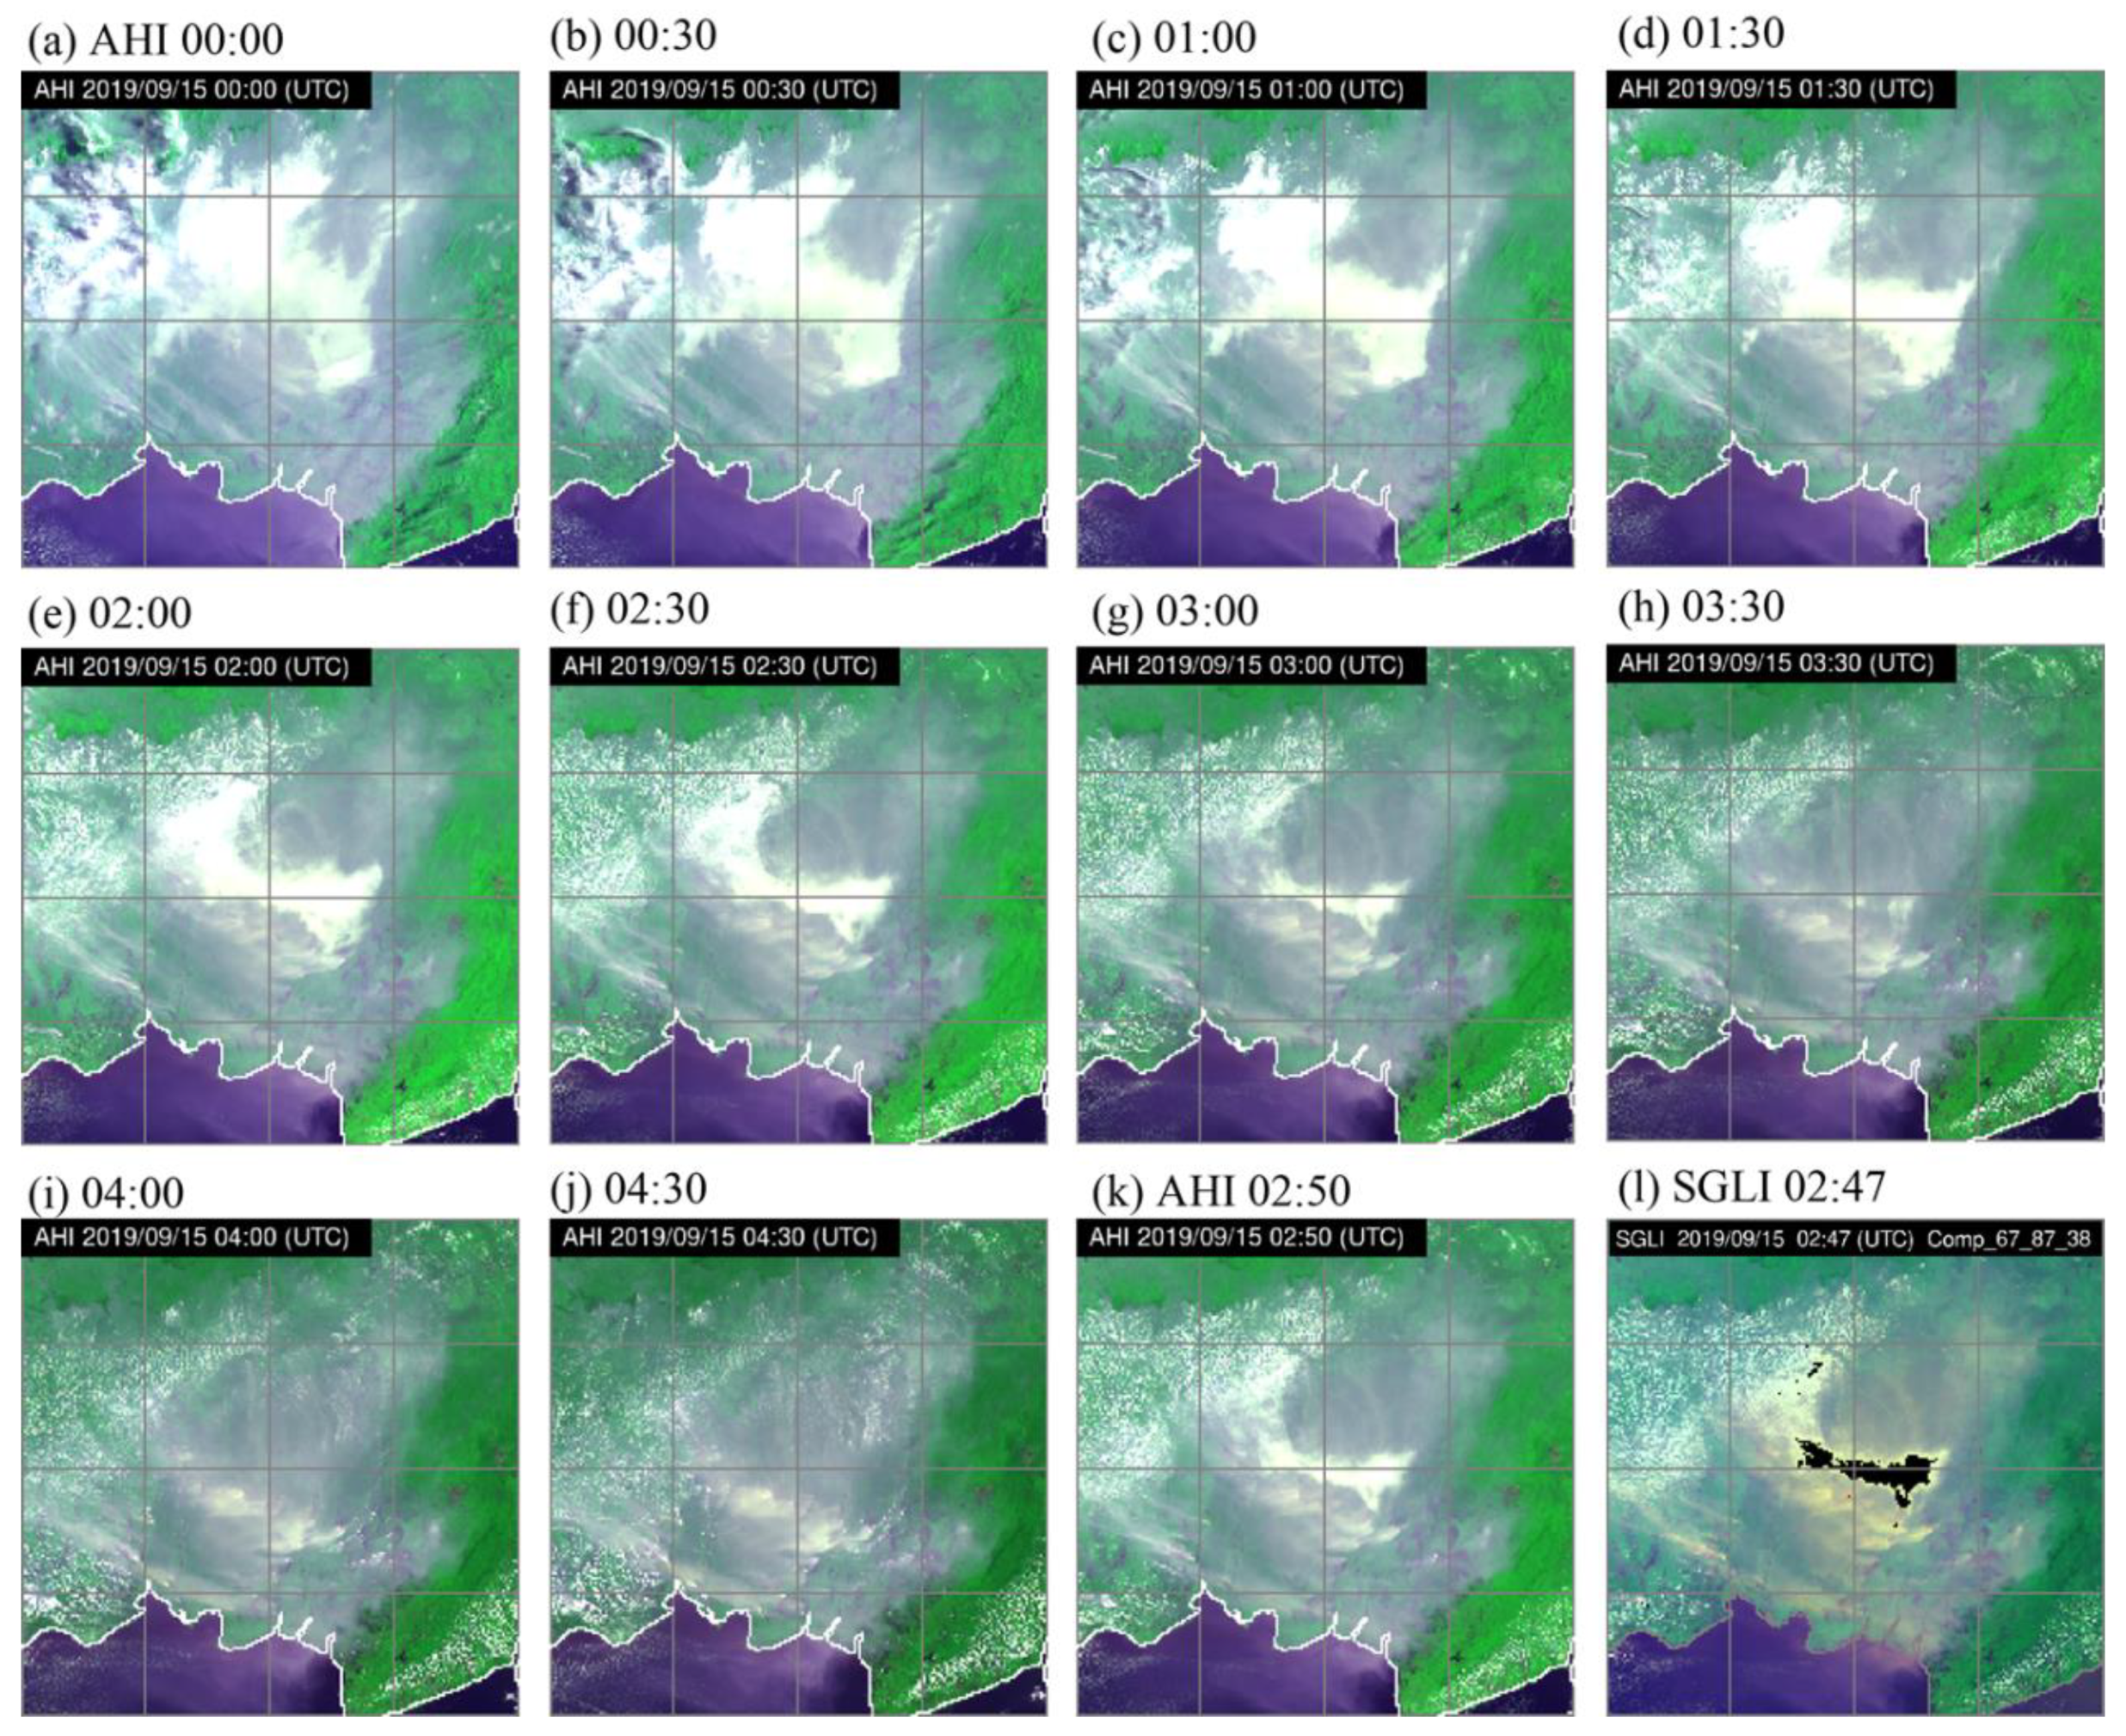
2. Detecting SBBAs
3. Method of Aerosol Retrieval
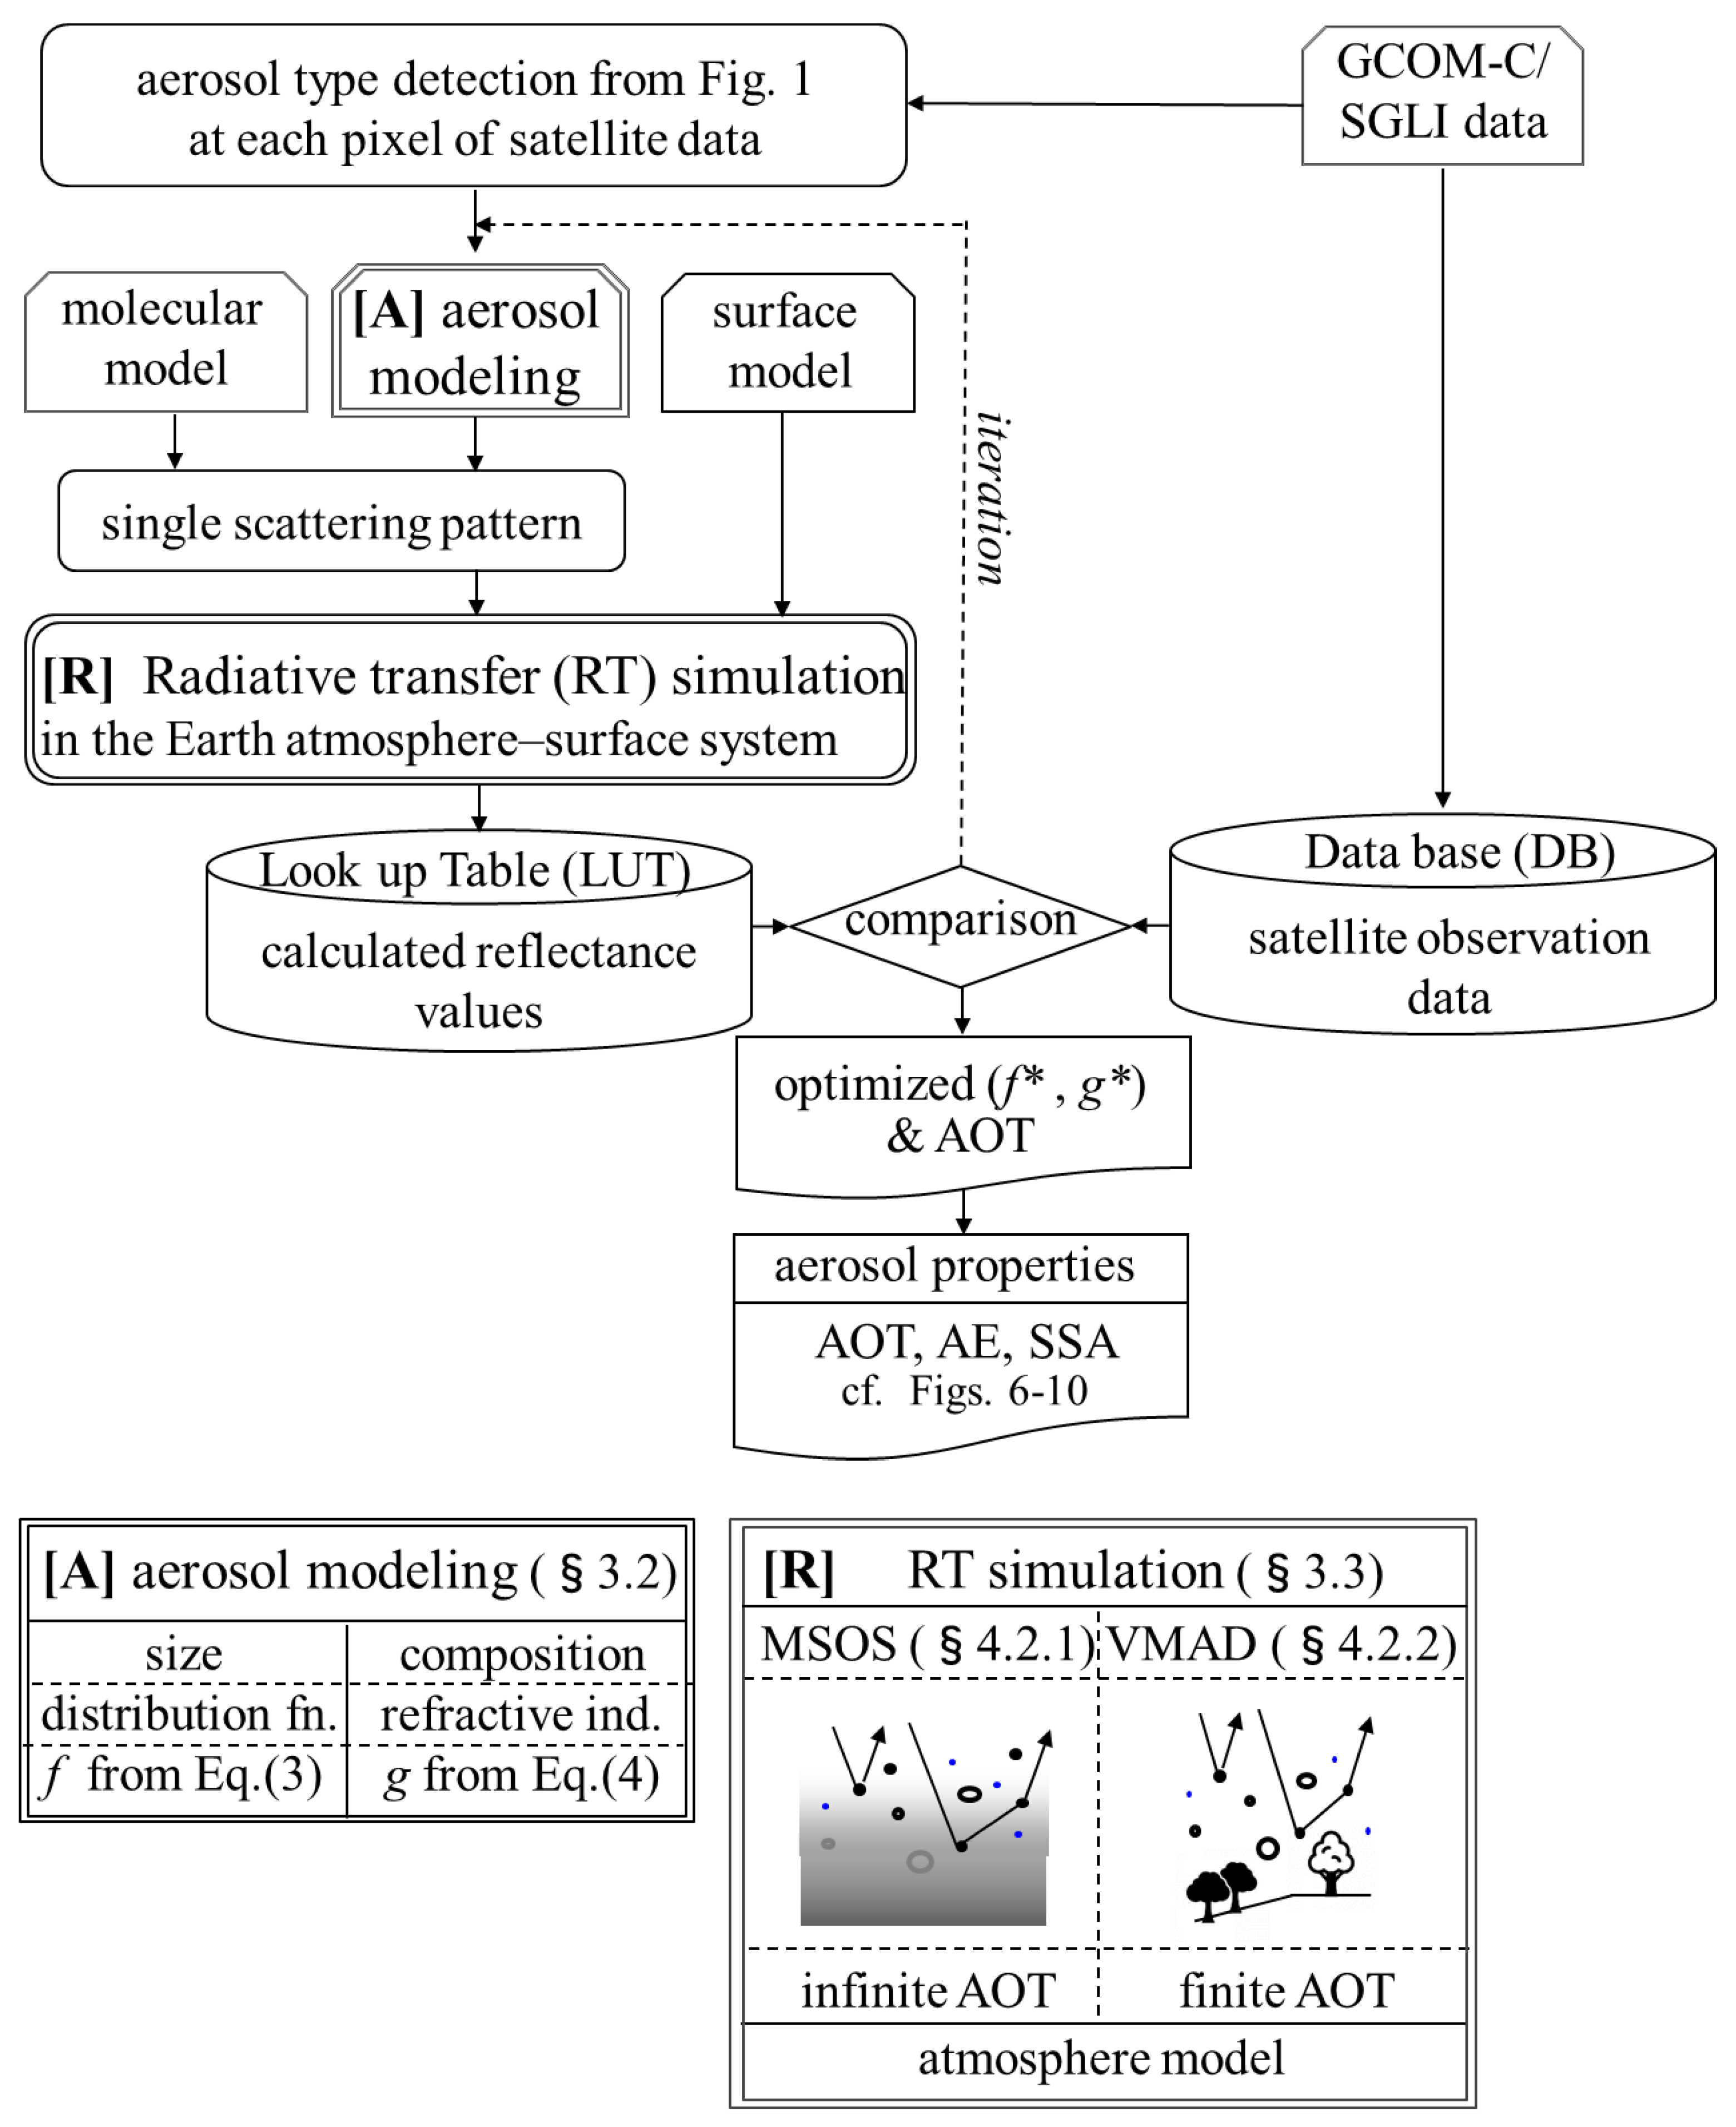
3.1. Method Framework
3.2. Aerosol Modeling
3.3. RT Simulation Method
- (1)
- no radiation falling except in direction Ω0 at the top of the atmosphere (τ = 0),
- (2)
- light reflection occurs according to the surface characteristics at the bottom of the atmosphere (τ = τ*), wherein τ* may be regarded as the AOT.
4. Results for the Case Study
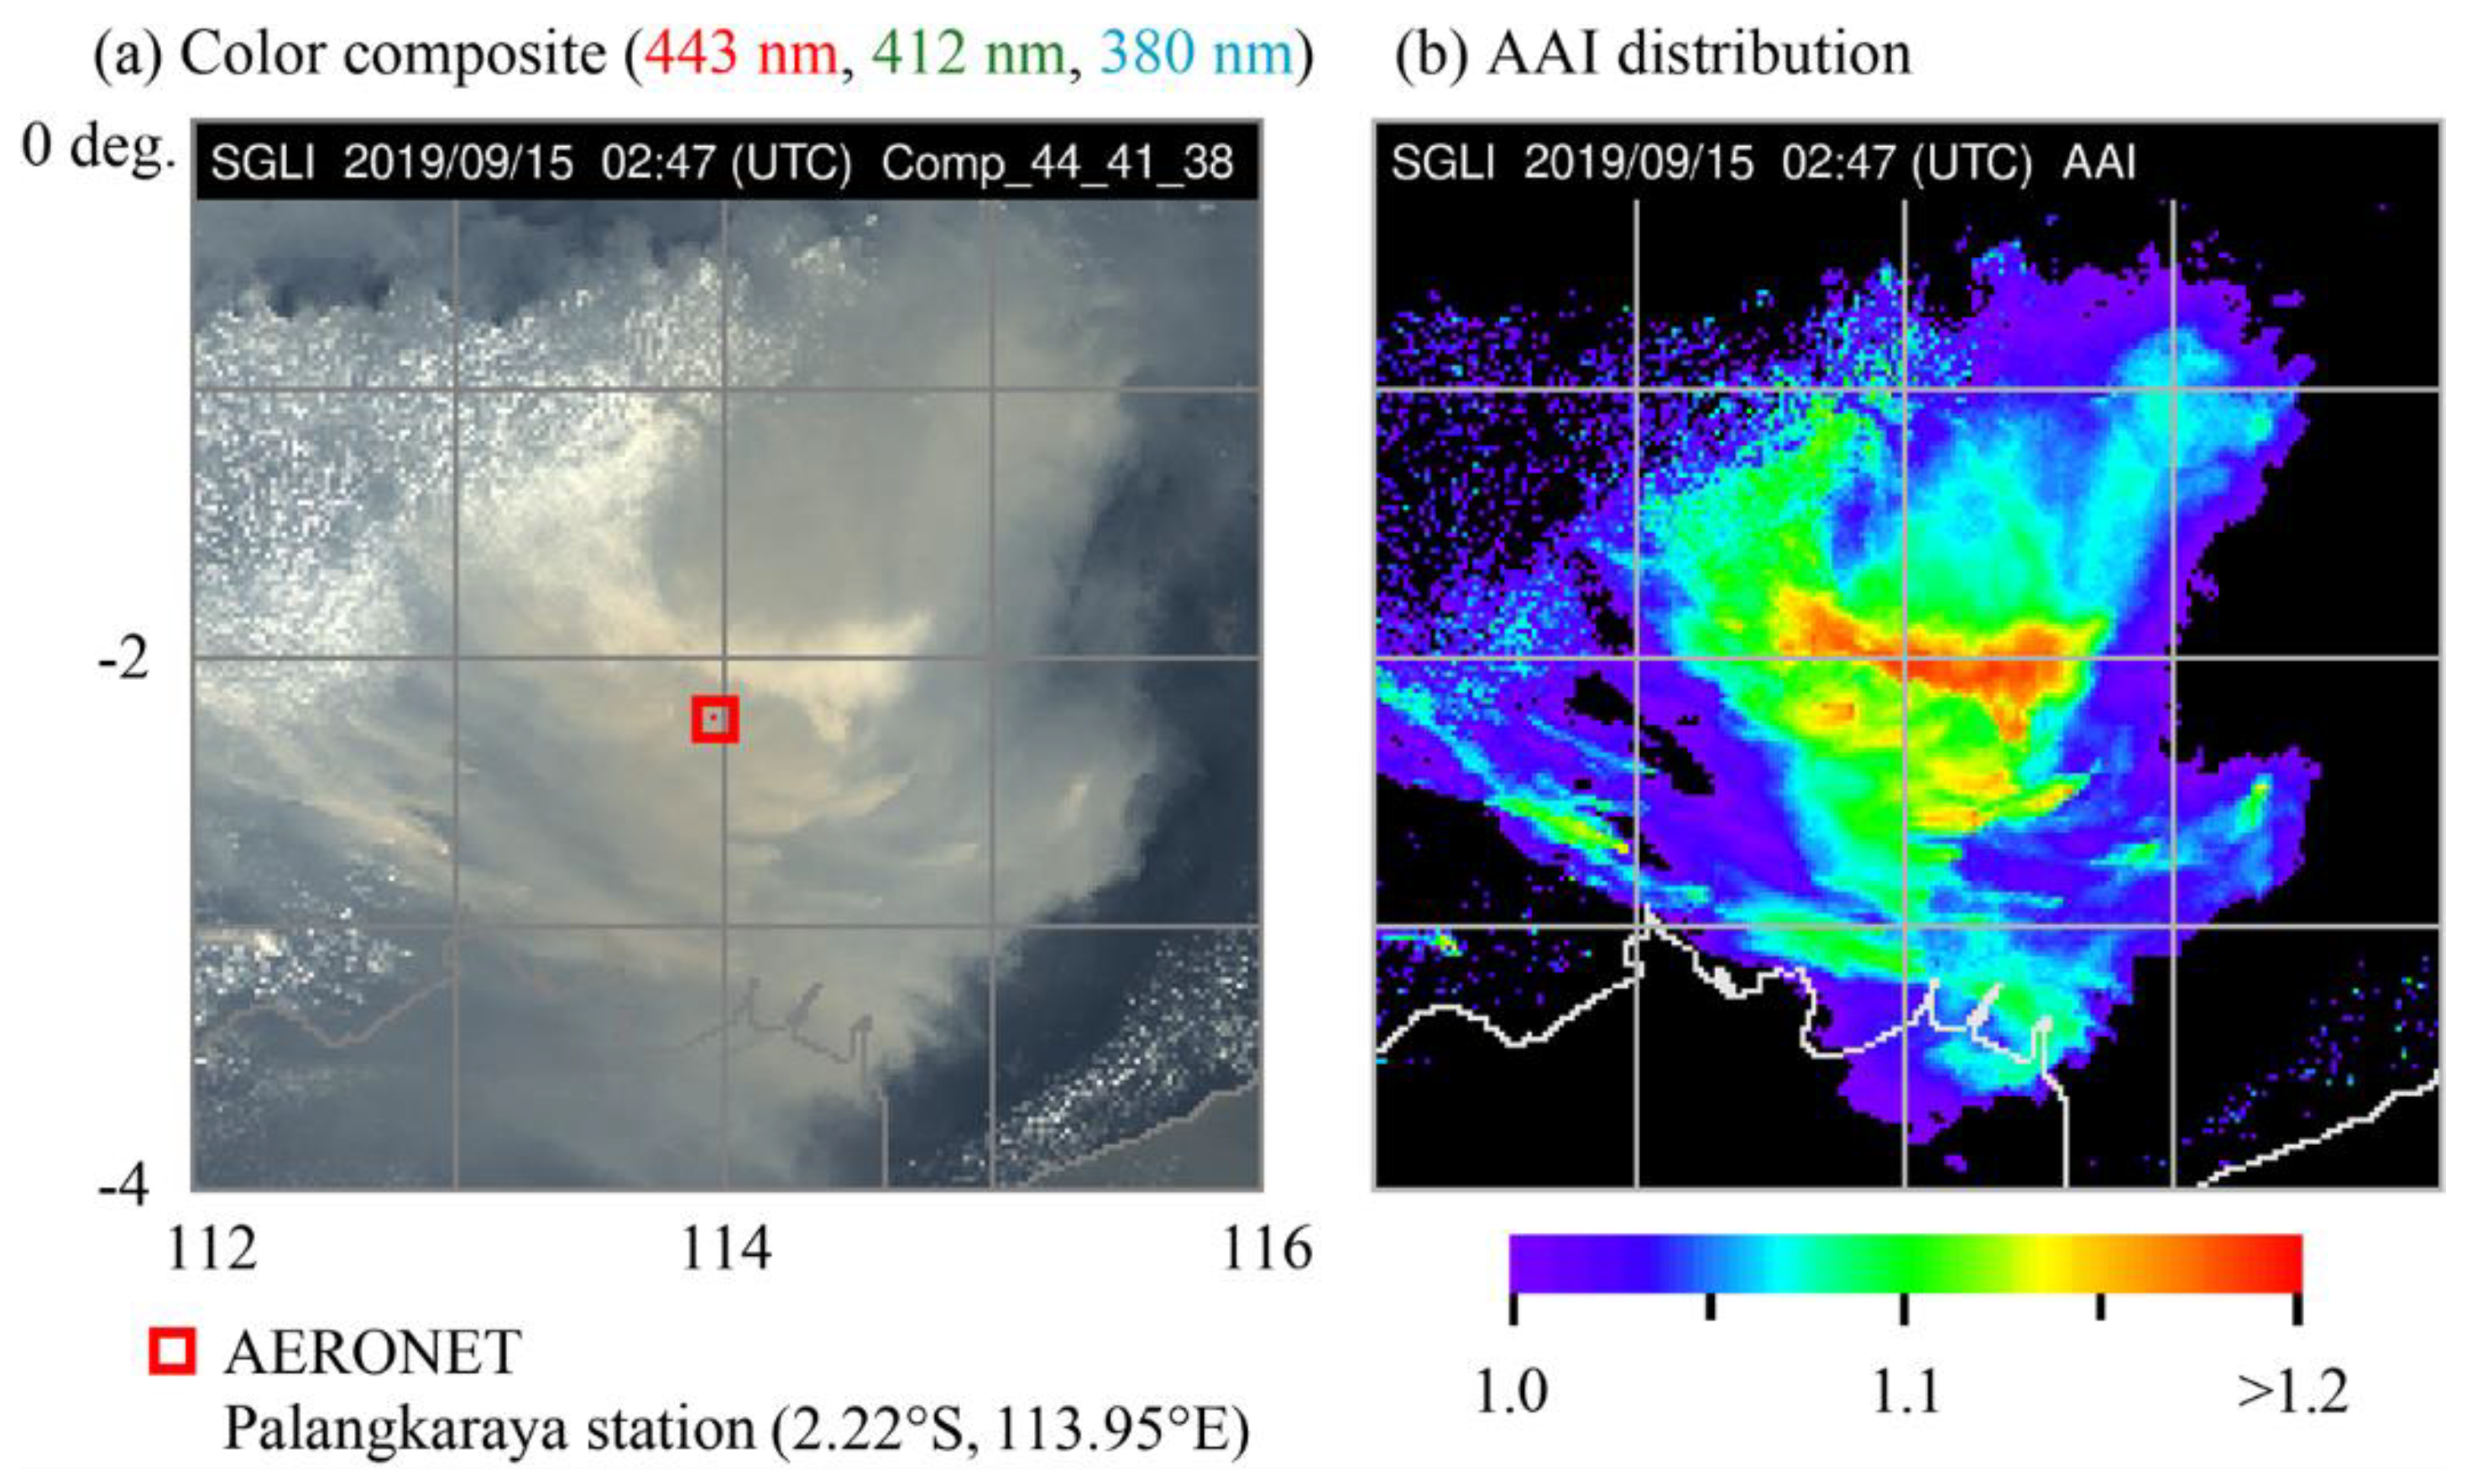
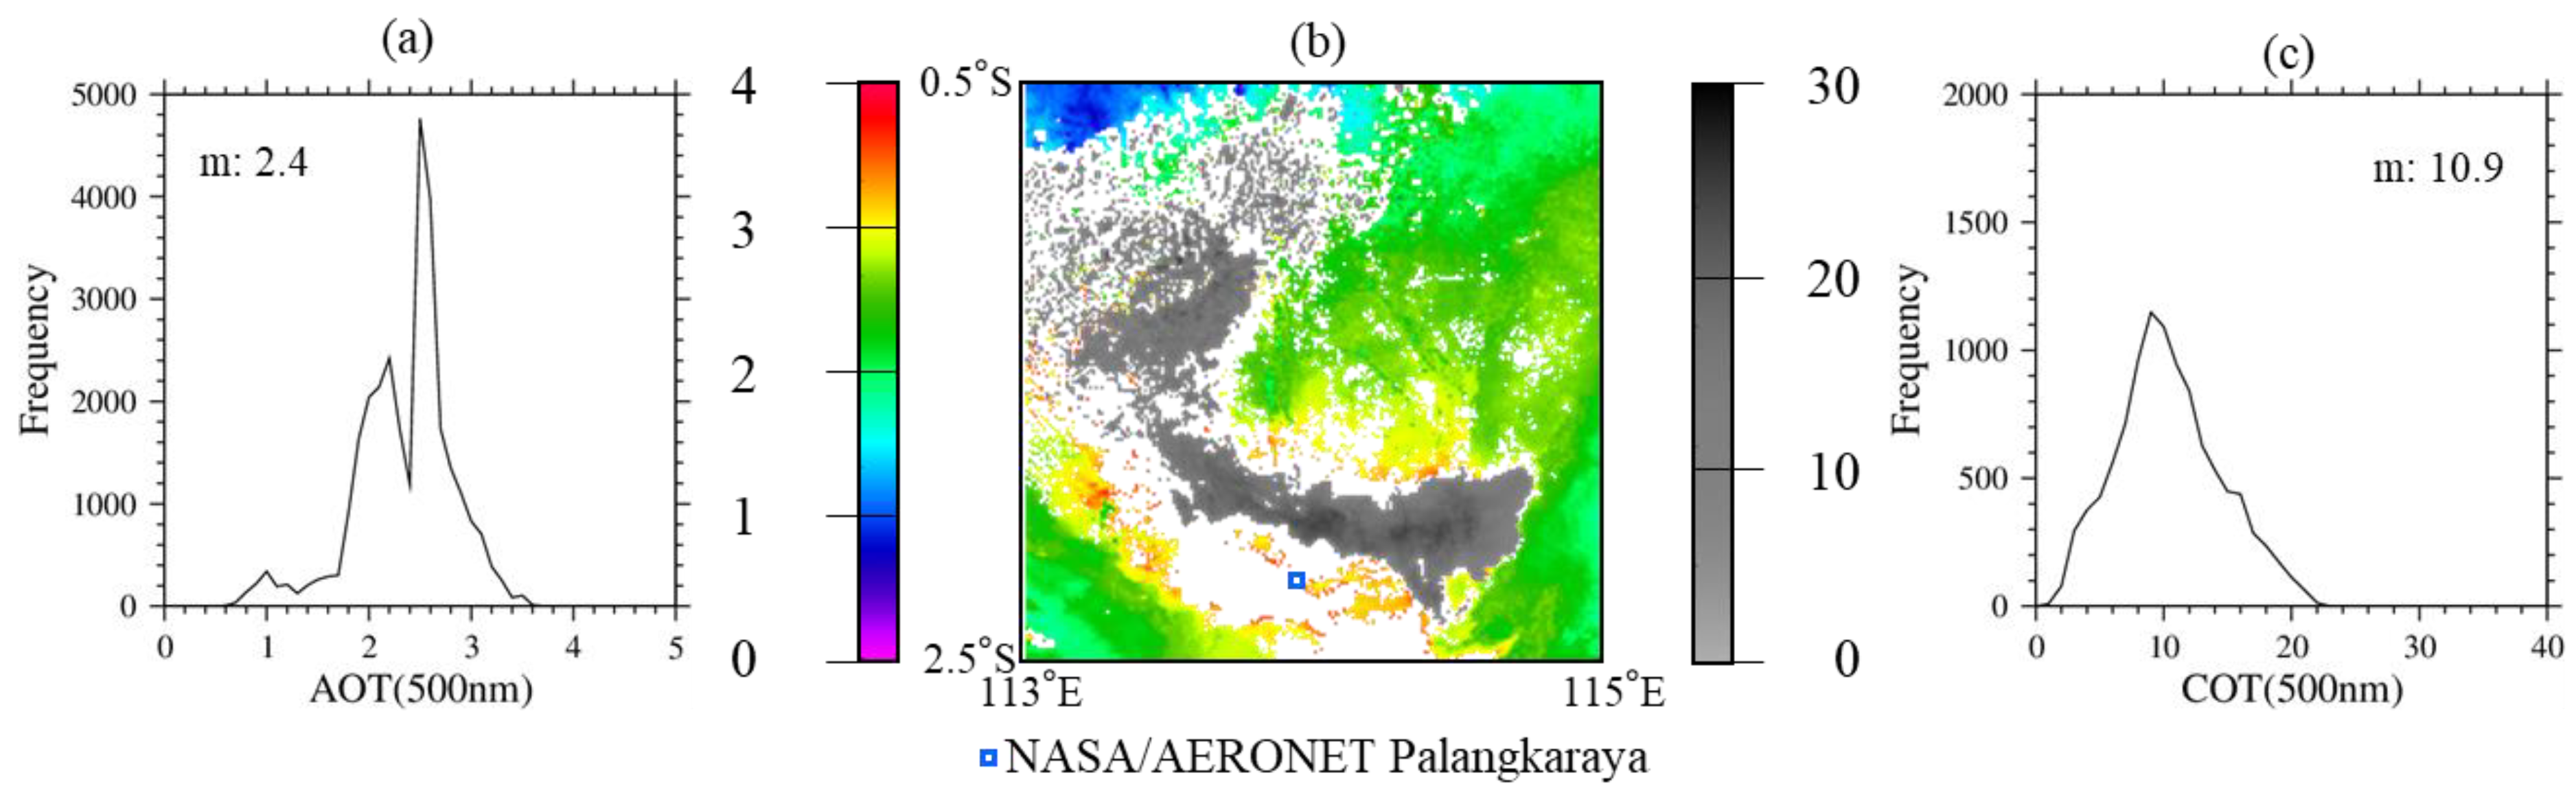
4.1. Wildfire in Kalimantan, Indonesia
4.2. Aerosol Retrieval with Switching RT Simulation
4.2.1. RT Simulation with the MSOS for Radiance Data at Short-Wavelength Channels
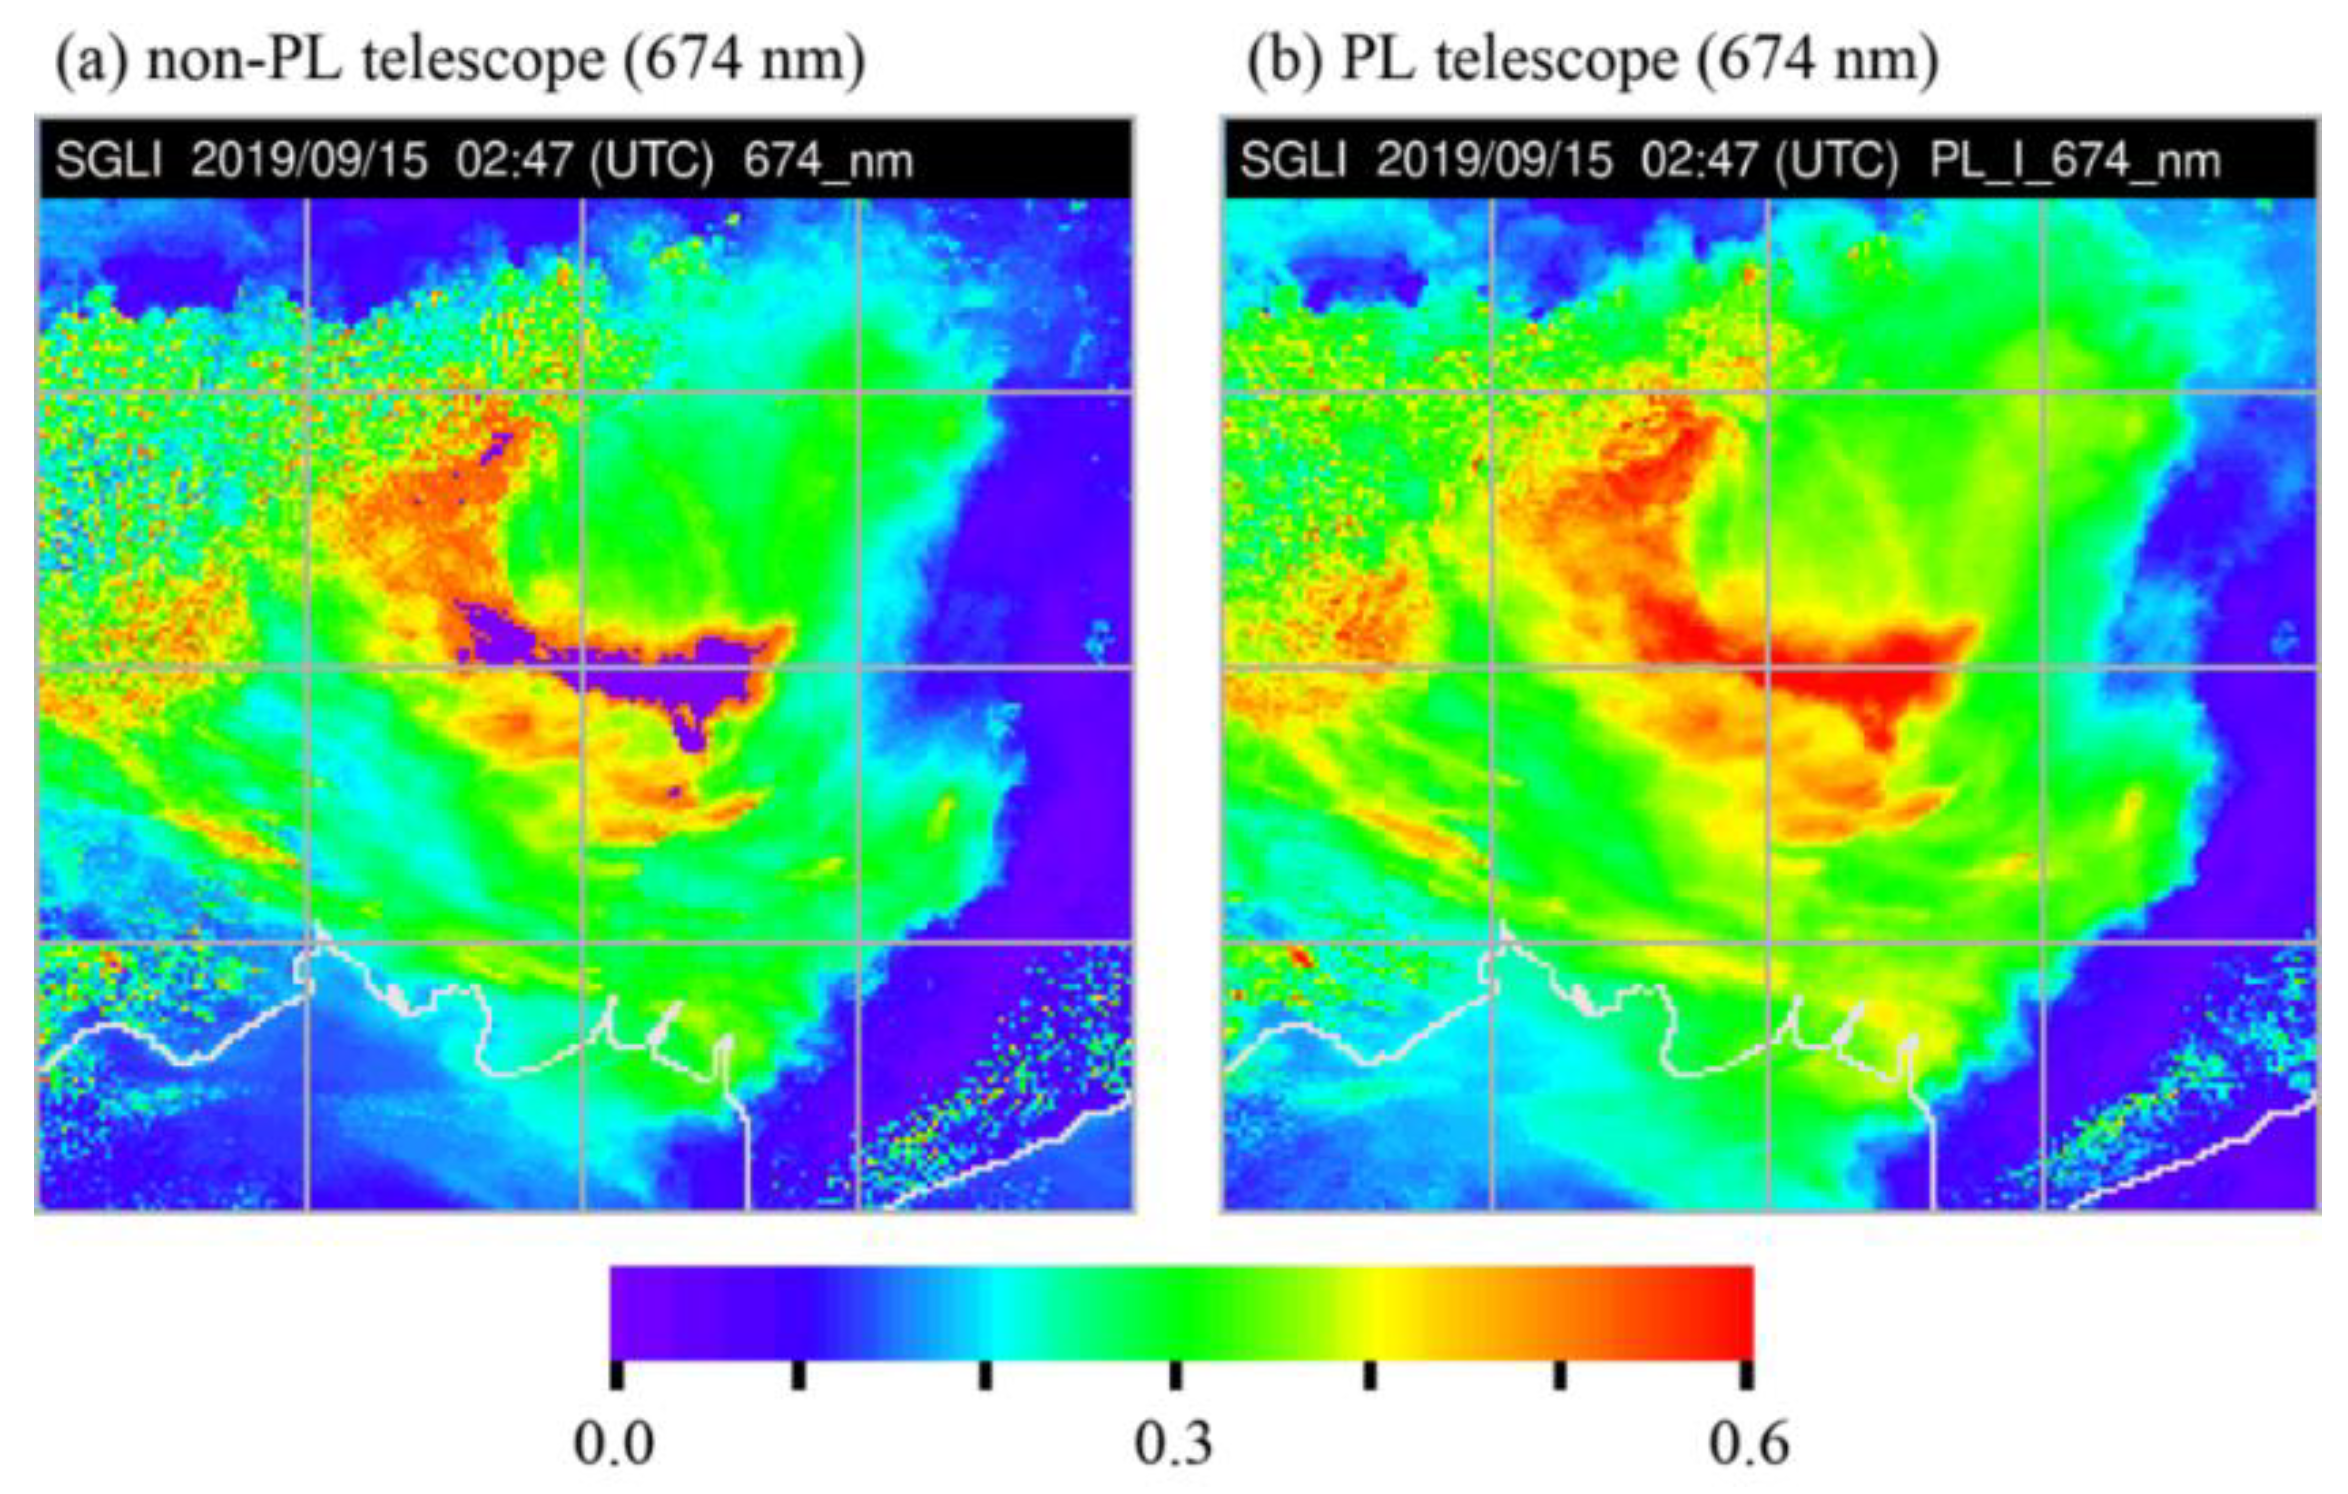
4.2.2. RT Simulation with VMAD for Polarization Data at PL1 and PL2 Channels
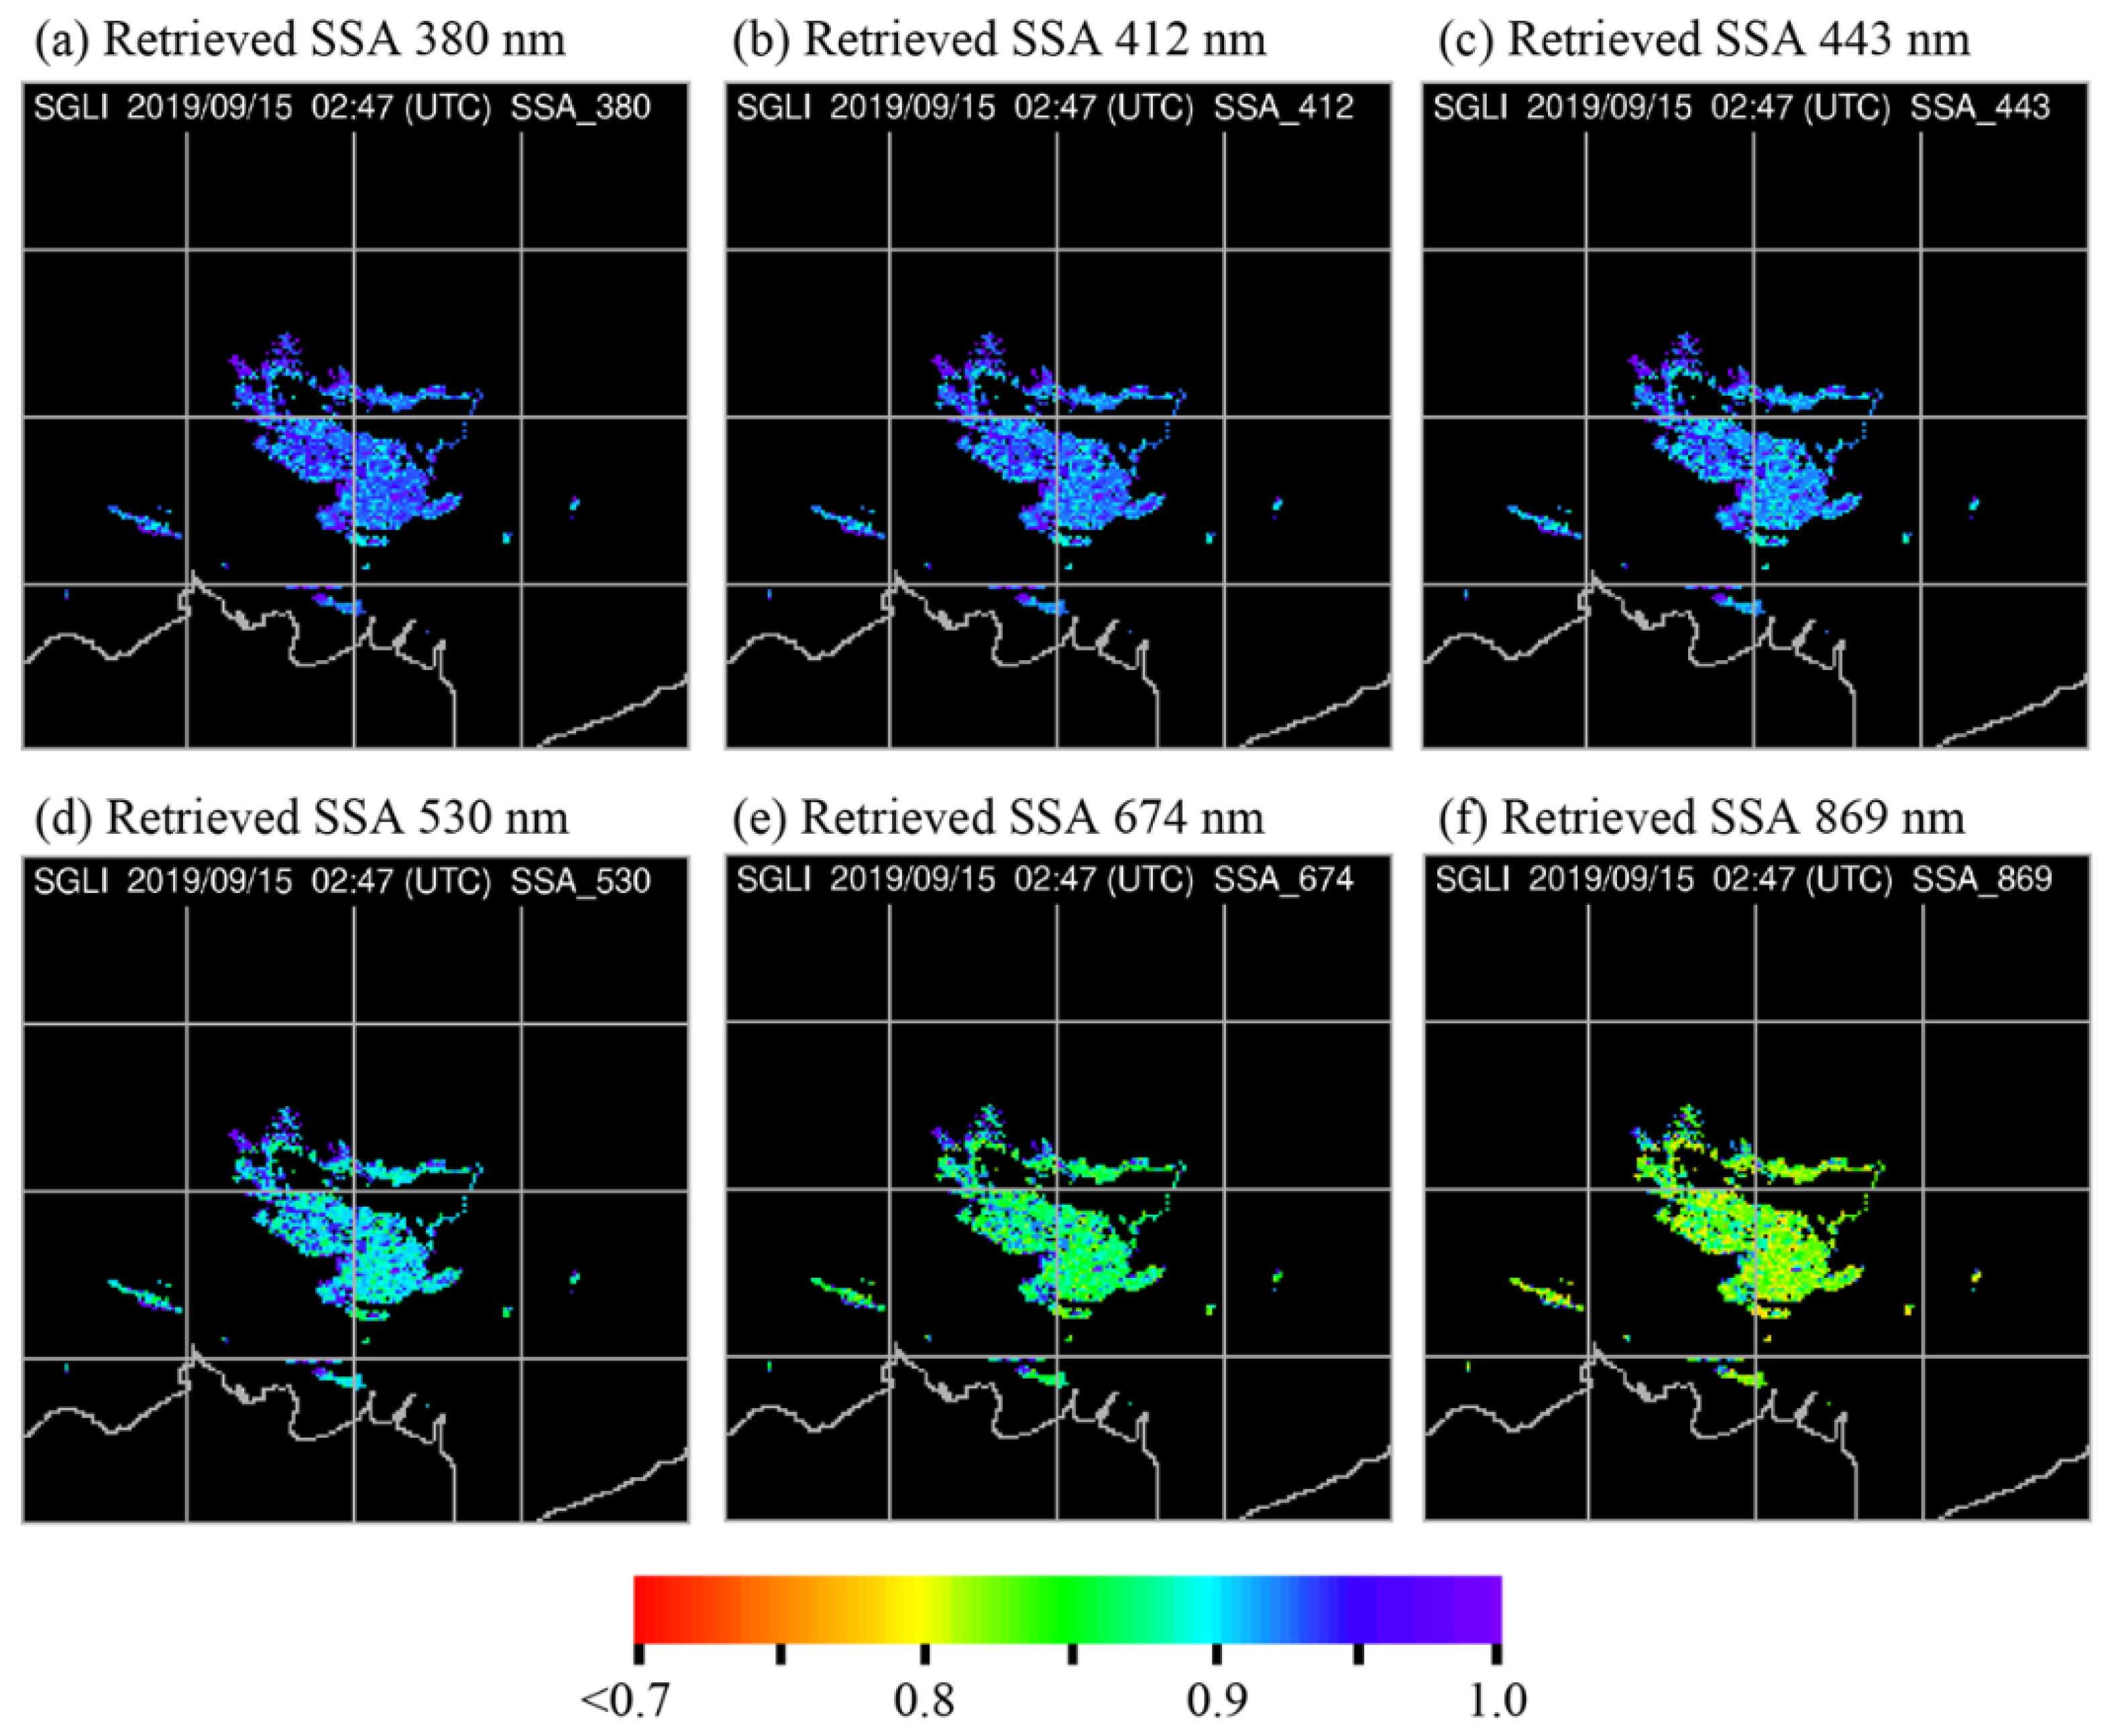
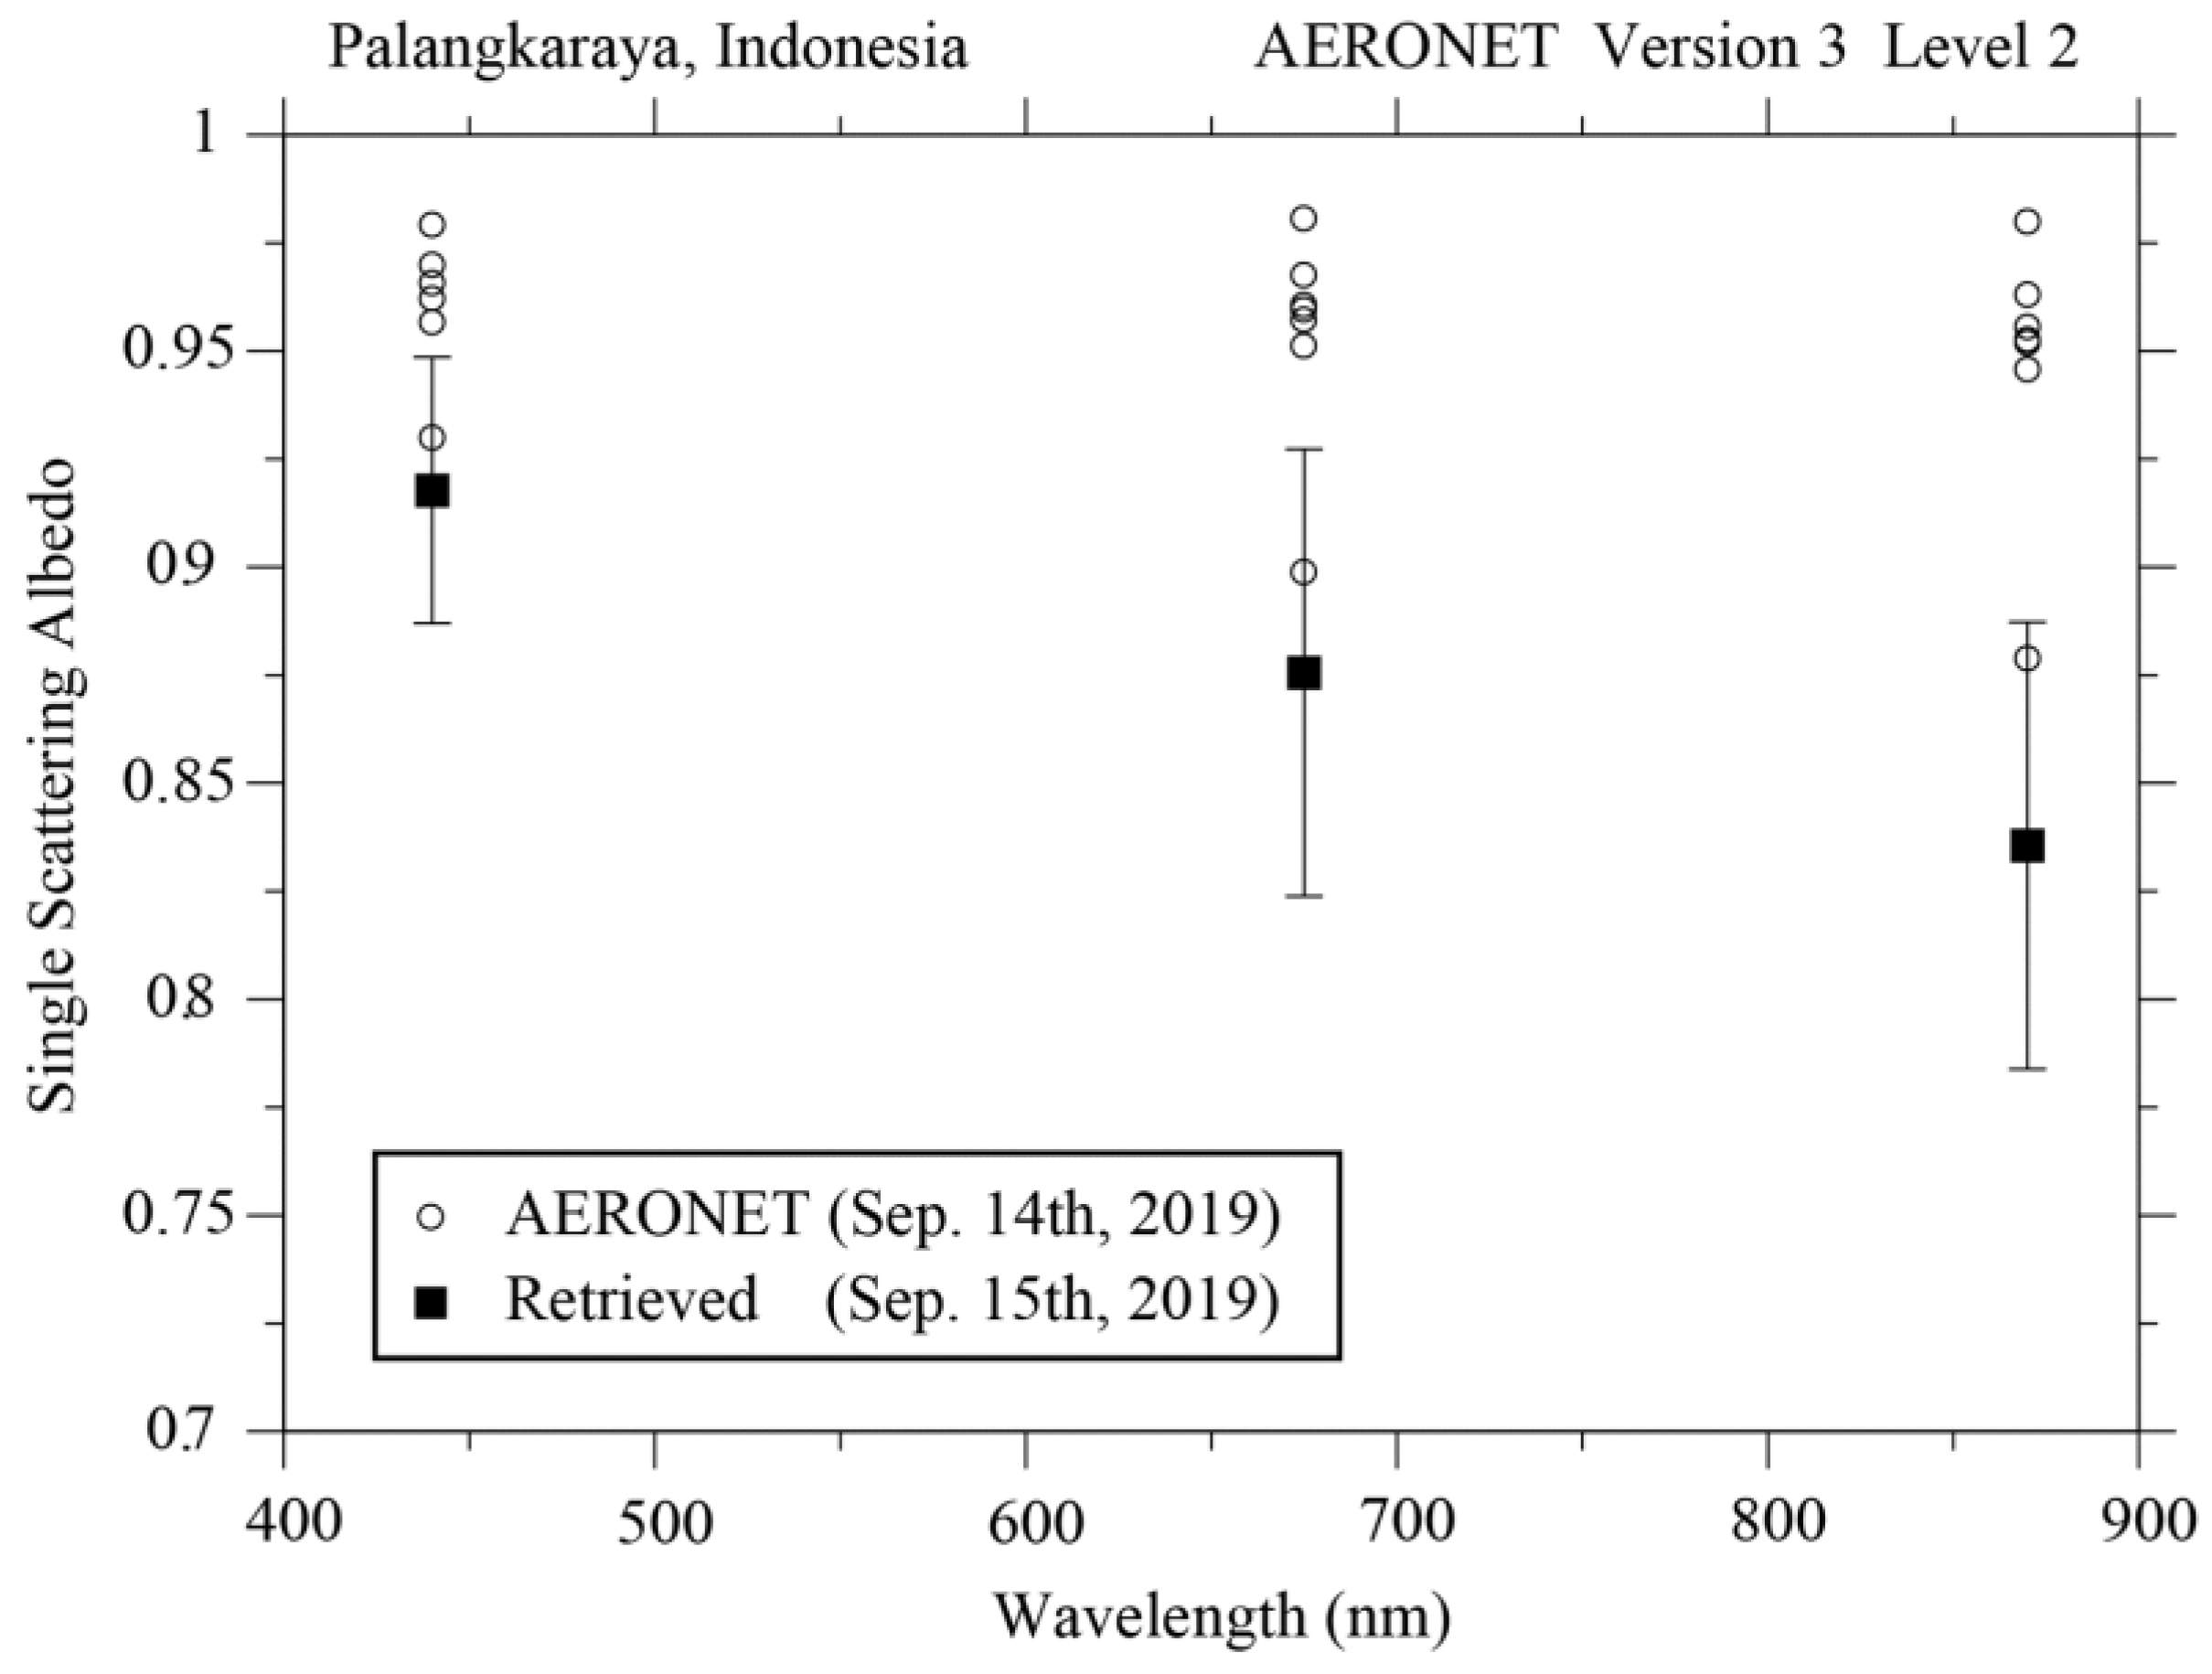
4.3. Properties of SBBAs
5. Discussion
6. Conclusions
- Detecting SBBAs is based on the expansion of the aerosol type classification method using two types of color ratio indices, the AAI and DDI, which are primarily used for near-UV measurements.
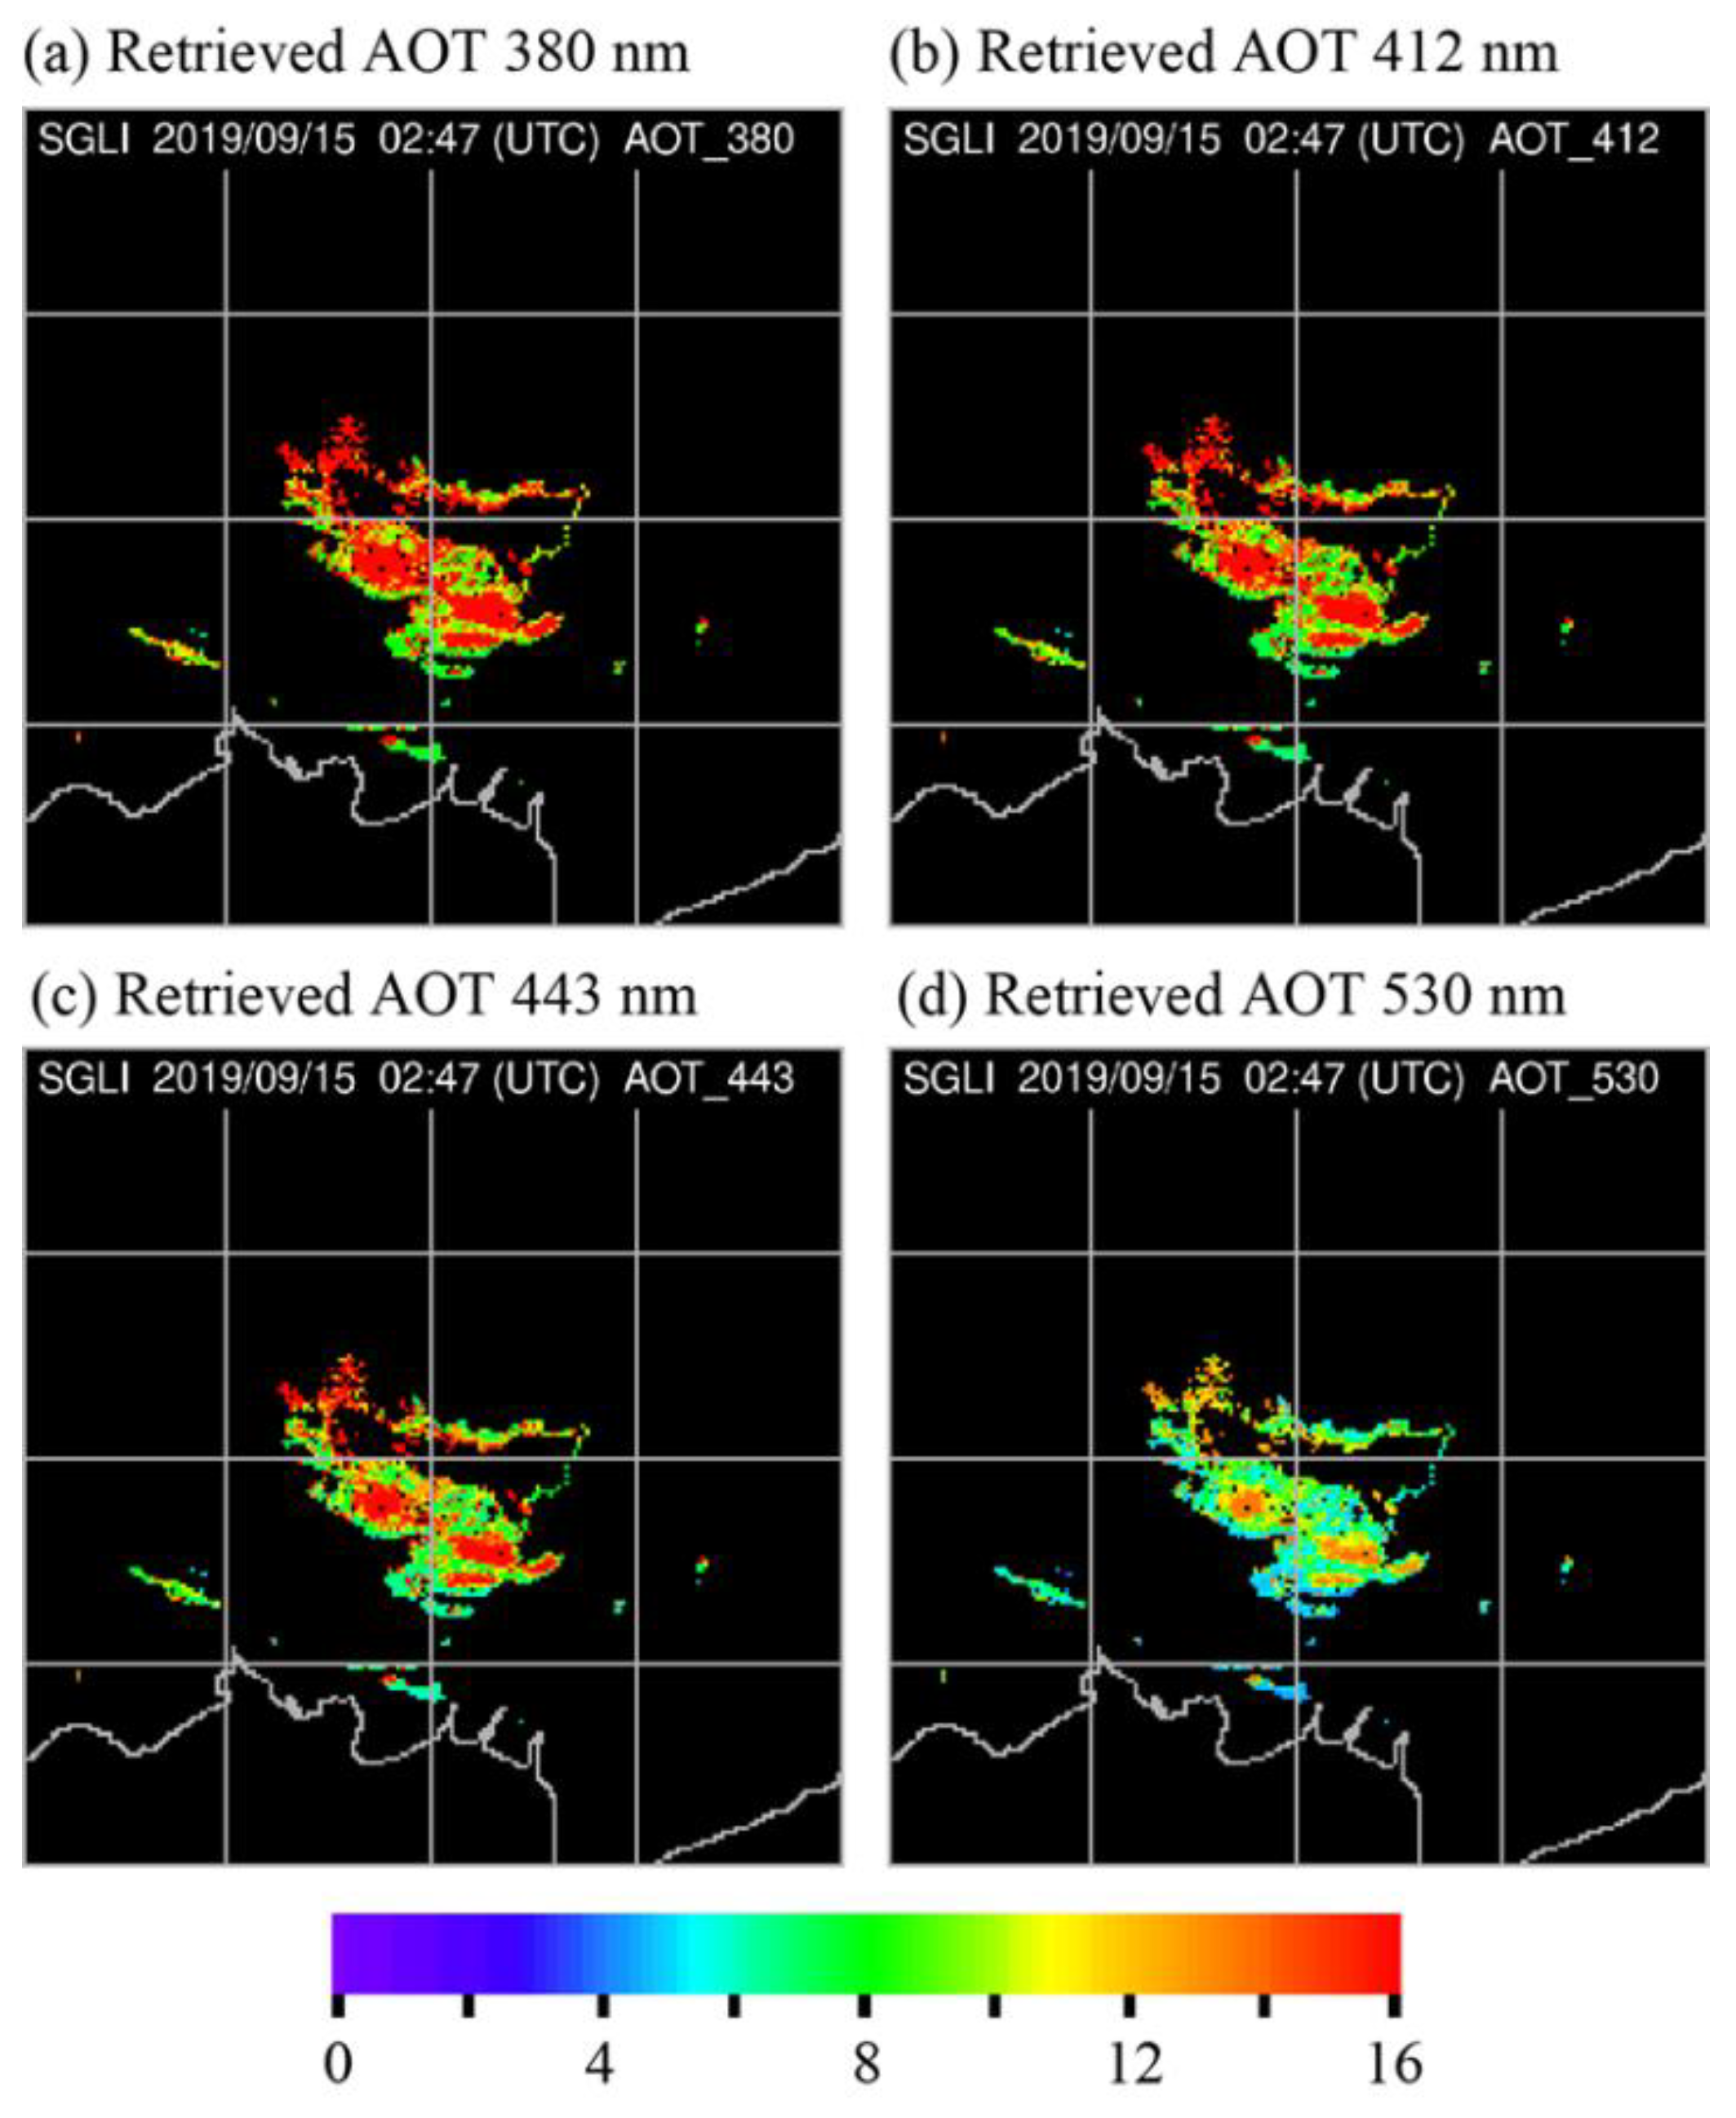
- The SBBA parameters of f (size distribution) and g (refractive index) are obtained using the radiation MSOS with SGLI radiance data at 380 nm, 412 nm, and 443 nm channels. The aerosol parameters f and g (g1 and g2) are obtained.
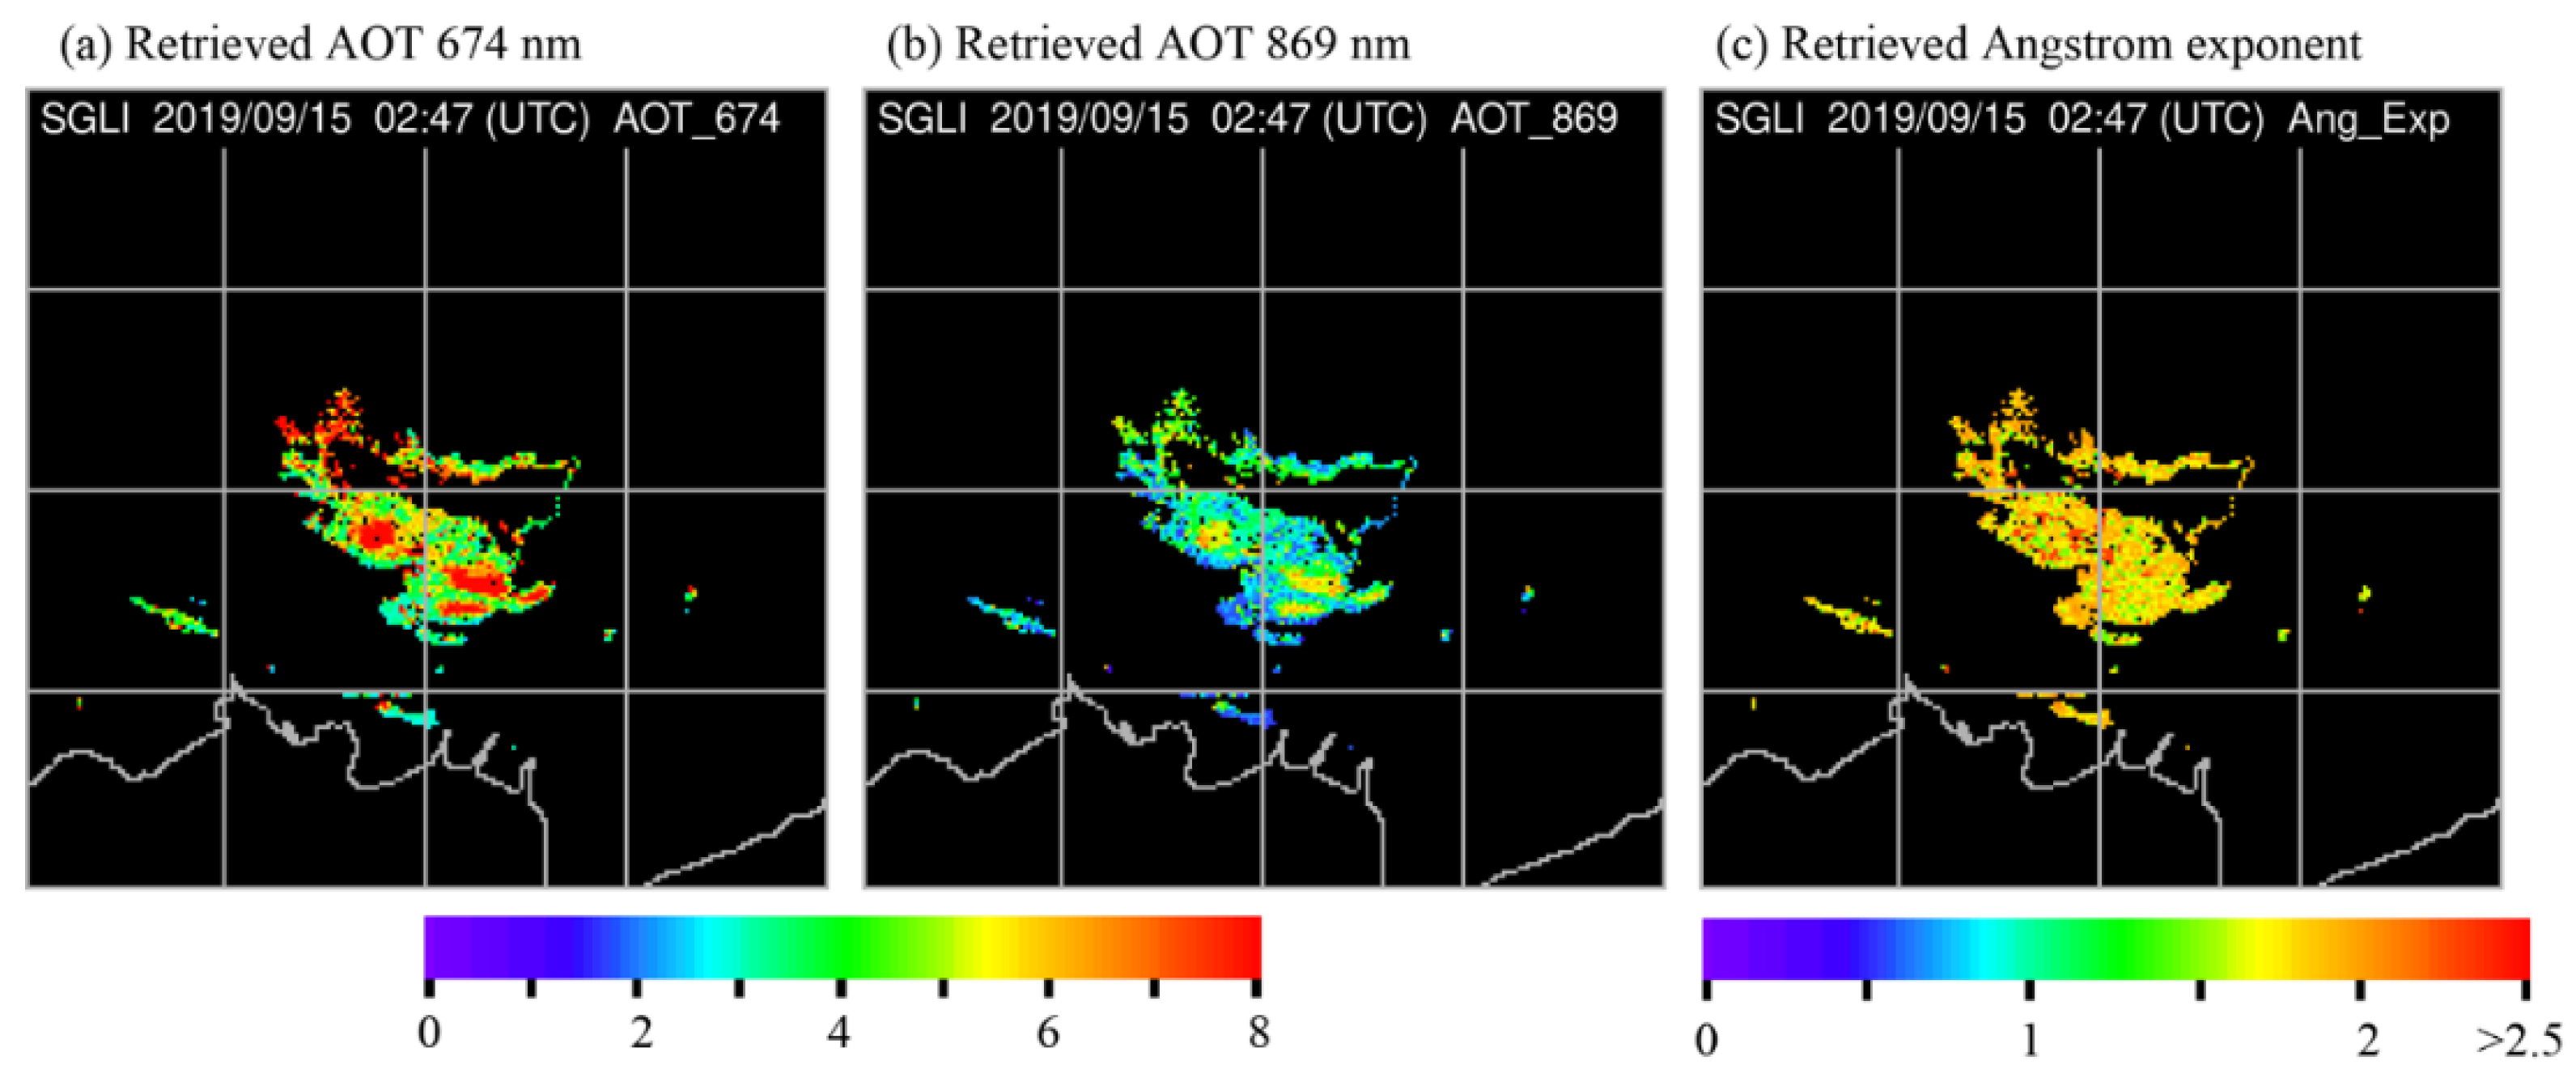
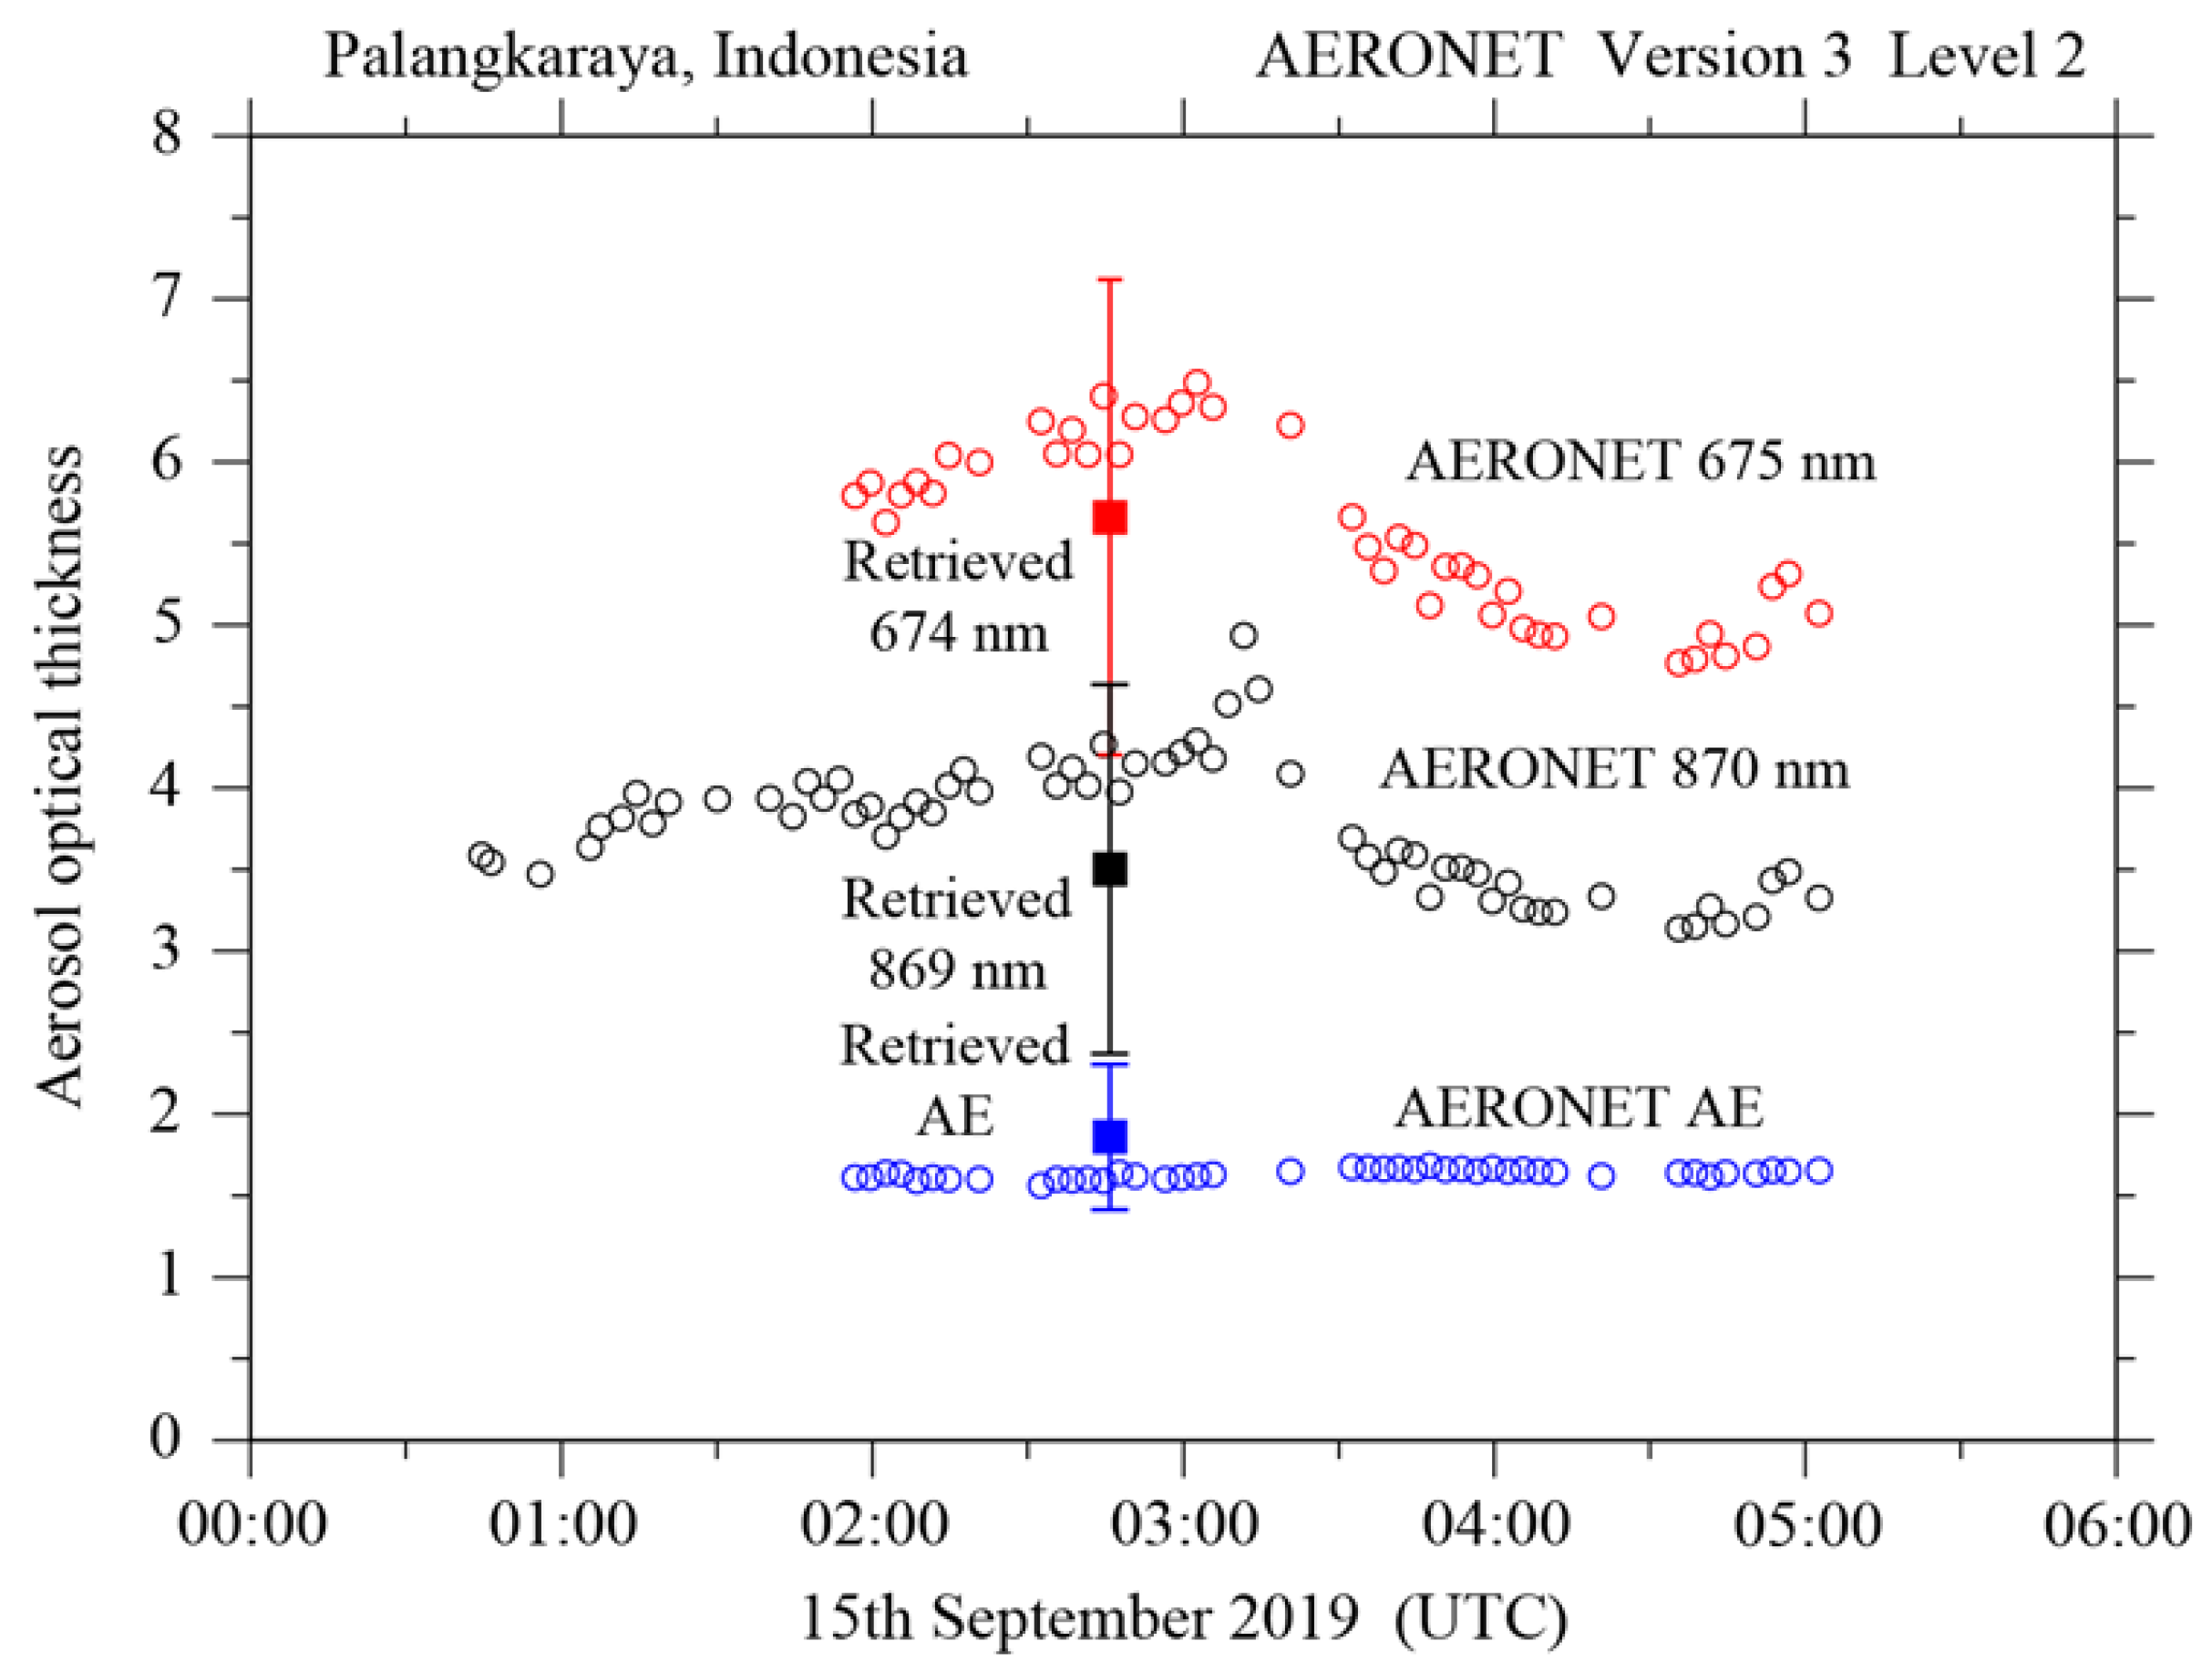
- The VMAD is applied to obtain the parameter g3 in the near-infrared wavelength, and the values of AOT (674 nm) and AOT (869 nm) are determined using the polarization data at bands PL1 (674 nm) and PL2 (869 nm) of the SGLI and the known value of f, and the AOT (443 nm) value is calculated using f and g2. Then, the AE value is calculated in terms of AOT (443 nm) and AOT (869 nm).
- The SSA and AOT at an arbitrary wavelength are calculated utilizing the values retrieved in the previous steps.
Author Contributions
Funding
Acknowledgments
Conflicts of Interest
References
- Chen, Y.; Bond, T. Light absorption by organic carbon from wood combustion. Atmos. Chem. Phys. 2010, 10, 1773–1778. [Google Scholar] [CrossRef]
- Mukai, S.; Yasumoto, M.; Nakata, M. Estimation of Biomass Burning Influence on Air Pollution around Beijing from an Aerosol Retrieval Model. Sci. World J. 2014, 2014. [Google Scholar] [CrossRef]
- Pyne, S.J. Between Two Fires: A Fire History of Contemporary America; University of Arizona Press: Tucson, AZ, USA, 2015. [Google Scholar]
- Kalashnikova, O.V.; Garay, M.J.; Bates, K.H.; Kenseth, C.M.; Kong, W.; Cappa, C.D.; Lyapustin, A.; Jonsson, H.H.; Seidel, F.C.; Xu, F.; et al. Photopolarimetric Sensitivity to Black Carbon Content of Wildfire Smoke: Results from the 2016 ImPACT-PM Field Campaign. J. Geophys. Res. 2018, 123, 5376–5396. [Google Scholar] [CrossRef]
- Dickman, K. The Hidden Toll of Wildfire. Sci. Am. 2020, 322, 38–45. [Google Scholar] [CrossRef]
- Sokolik, I.; Toon, O. Direct radiative forcing by anthropogenic airborne aerosols. Nature 1996, 381, 681–683. [Google Scholar] [CrossRef]
- Liao, H.; Seinfeld, J. Effect of clouds on direct aerosol radiative forcing of climate. J. Geophys. Res. 1998, 103, 3781–3788. [Google Scholar] [CrossRef]
- Quaas, J.; Boucher, O.; Bellouin, N.; Kinne, S. Satellite-based estimate of direct and indirect aerosol climate forcing. J. Geophys. Res. 2008, 113. [Google Scholar] [CrossRef]
- Jacobson, M. Strong radiative heating due to the mixing state of black carbon in atmospheric aerosols. Nature 2001, 409, 696–697. [Google Scholar] [CrossRef] [PubMed]
- IPCC. Climate Change 2013: The Physical Science Basis. Contribution of Working Group I to the Fifth Assessment Report of the Intergovernmental Panel on Climate Change; Cambridge University Press: Cambridge, UK, 2013; p. 1585.
- Stohl, A.; Berg, T.; Burkhart, J.F.; Fjaraa, A.M.; Forster, C.; Herber, A.; Hov, O.; Lunder, C.; McMillan, W.W.; Oltmans, S.; et al. Arctic Smoke—Record high air pollution levels in the European Arctic due to agricultural fires in Eastern Europe. Atmos. Chem. Phys. 2007, 7, 511–534. [Google Scholar] [CrossRef]
- Ten Hoeve, J.E.; Remer, L.A.; Jacobson, M.Z. Microphysical and radiative effects of aerosols on warm clouds during the Amazon biomass burning season as observed by MODIS impacts of water vapor and land cover. Atmos. Chem. Phys. 2011, 11, 3021–3036. [Google Scholar] [CrossRef]
- Kinne, S.; Lohmann, U.; Feichter, J.; Schulz, M.; Timmreck, C.; Ghan, S.; Easter, R.; Chin, M.; Ginoux, P.; Takemura, T.; et al. Monthly averages of aerosol properties: A global comparison among models, satellite data and AERONET ground data. J. Geophys. Res. 2003, 108, 4634. [Google Scholar] [CrossRef]
- Sokolik, I.; Winker, D.; Bergametti, G.; Gillette, D.; Carmichael, G.; Kaufmann, Y.; Gomes, L.; Shuetz, L.; Penner, J. Introduction to special section: Outstanding problems in quantifying the radiative impacts of mineral dust. J. Geophys. Res. 2001, 106, 18015–18027. [Google Scholar] [CrossRef]
- Levy, R.; Remer, L.; Tanre, D.; Kaufman, Y.; Ichoku, C.; Holben, B.; Livingston, J.; Russell, P.; Maring, H. Evaluation of the Moderate-Resolution Imaging Spectroradiometer (MODIS) retrievals of dust aerosol over the ocean during PRIDE. J. Geophys. Res. 2003, 108. [Google Scholar] [CrossRef]
- Zhang, J.; Christopher, S. Longwave radiative forcing of Saharan dust aerosols estimated from MODIS, MISR, and CERES observations on Terra. Geophys. Res. Lett. 2003, 30, 2188. [Google Scholar] [CrossRef]
- Li, F.; Vogelmann, A.; Ramanathan, V. Saharan Dust Aerosol Radiative Forcing Measured from Space. J. Clim. 2004, 17, 2558–2571. [Google Scholar] [CrossRef]
- Littmann, T. Dust storm frequency in Asia: Climatic control and variability. Int. J. Climatol. 1991, 11, 393–412. [Google Scholar] [CrossRef]
- Lee, K.; Kim, Y. Satellite remote sensing of Asian aerosols: A case study of clean, polluted, and dust storms. Atmos. Meas. Tech. 2010, 3, 1771–1784. [Google Scholar] [CrossRef]
- Eck, T.; Holben, B.; Reid, J.; Dubovik, O.; Smirnov, A.; O’Neill, N.; Slutsker, I.; Kinne, S. Wavelength dependence of the optical depth of biomass burning, urban and desert dust aerosols. J. Geophys. Res. 1999, 104, 31333–31350. [Google Scholar] [CrossRef]
- Mukai, S.; Sano, I.; Nakata, M. Algorithms for the classification and characterization of aerosols: Utility verification of near-UV satellite observations. J. Appl. Remote Sens. 2019, 13, 014527. [Google Scholar] [CrossRef]
- Mukai, S.; Sano, I.; Nakata, M. Effective characterization of aerosols in severe events using multi-channel measurements including polarization with GCOM-C/SGLI. In Proceedings of the SPIE 11531, Remote Sensing of Clouds and Atmosphere XXV, Edinburgh, UK, 21–25 September 2020; p. 115310Q. [Google Scholar] [CrossRef]
- Mukai, S.; Yokomae, T.; Nakata, M.; Kohkanovsky, A. Multiple scattering in a dense aerosol atmosphere. Atmos. Meas. Tech. Discuss. 2012, 5, 881–907. [Google Scholar]
- Mukai, S.; Sano, I.; Takashima, T. Investigation of atmospheric aerosols based on polarization measurements and scattering simulations. Opt. Rev. 1996, 3, 487–491. [Google Scholar] [CrossRef]
- Mukai, S.; Nakata, M.; Fujito, T.; Sano, I. Efficient Detection of Aerosols Above Clouds Utilizing GCOM-C/SGL Data. Int. J. Environ. Monit. Anal. 2020, 8, 170–180. [Google Scholar] [CrossRef]
- O’Neill, N.; Dubovik, O.; Eck, T. Modified Angstrom exponent for the characterization of submicrometer aerosols. Appl. Opt. 2001, 40, 2368–2375. [Google Scholar] [CrossRef]
- Omar, A.; Won, J.; Winker, D.; Yoon, S.; Dubovik, O.; McCormick, P. Development of global aerosol models using cluster analysis of aerosol robotic network (AERONET) measurements. J. Geophys. Res. 2005, 110, 10–14. [Google Scholar] [CrossRef]
- Torres, O.; Bhartia, P.; Herman, J.; Ahmad, Z.; Gleason, J. Derivation of aerosol properties from satellite measurements of backscattered ultraviolet radiation: Theoretical basis. J. Geophys. Res. 1998, 103, 17099–17110. [Google Scholar] [CrossRef]
- de Graaf, M.; Stammes, P.; Torres, O.; Koelemeijer, R.B.A. Absorbing Aerosol Index: Sensitivity analysis, application to GOME and comparison with TOMS. J. Geophys. Res. 2005, 102. [Google Scholar] [CrossRef]
- Ciren, P.; Kondragunta, S. Dust aerosol index (DAI) algorithm for MODIS. J. Geophys. Res. 2014, 119, 4770–4792. [Google Scholar] [CrossRef]
- Bohren, C.; Wickramasinghe, N. On the Computation of Optical Properties of Heterogeneous Grains. Astrophys. Space Sci. 1977, 50, 461–472. [Google Scholar] [CrossRef]
- Bond, T.; Bergstrom, R. Light Absorption by Carbonaceous Particles: An Investigative Review. Aerosol Sci. Technol. 2007, 40, 27–67. [Google Scholar] [CrossRef]
- Sayer, A.; Hsu, N.; Eck, T.; Smirnov, A.; Holben, B. AERONET-based models of smoke-dominated aerosol near source regions and transported over ocean, and implications for satellite retrievals of aerosol optical depth. Atmos. Chem. Phys. 2014, 14, 11493–11523. [Google Scholar] [CrossRef]
- Uesugi, A.; Irvine, W. Multiple scattering in a plane-parallel atmosphere I. Successive scattering in a semi-infinite medium. Astrophys. J. 1970, 159, 127–135. [Google Scholar] [CrossRef]
- Chandrasekhar, S. Radiative Transfer; Dover Publications, Inc.: New York, NY, USA, 1960; Chapter V. [Google Scholar]
- Nadal, F.; Bréon, F.M. Parameterization of surface polarized reflectance derived from POLDER space-borne measurements. IEEE Trans. Geosci. Remote Sens. 1999, 37, 1709–1718. [Google Scholar] [CrossRef]
- Nakata, M.; Sano, I.; Mukai, S.; Holben, B. Spatiotemporal variations in atmospheric aerosols in East Asia: Identifying local pollutants and transported Asian aerosols in Osaka, Japan using DRAGON. Atmos. Chem. Phys. Discuss. 2016. [Google Scholar] [CrossRef]
- Yulianti, N.; Hayasaka, H. Recent active fire under El Niño conditions in Kalimantan, Indonesia. Am. J. Plants Sci. 2013, 4, 685–696. [Google Scholar] [CrossRef]
- Eck, T.; Holben, B.; Reid, J.; O’Niel, N.; Schafer, J.; Dubovik, O.; Smirnov, A.; Yamasoe, M.; Artaxo, P. High aerosol optical depth biomass burning events: A comparison of optical properties for different source regions. Geophys. Res. Lett. 2003, 30. [Google Scholar] [CrossRef]
- Chen, W.; Kahn, R.; Nelson, D.; Yau, K.; Seinfeld, J. Sensitivity of multineedle imaging to the optical and microphysical properties of biomass burning aerosols. J. Geophys. Res. 2008, 113, D10203. [Google Scholar] [CrossRef]
- Chakrabarty, R.; Moosmuller, H.; Chen, L.; Lewis, K.; Arnott, W.; Mazzoleni, C.; Dubey, M.; Wold, C.; Hao, W.; Kreidenweiss, S. Brown carbon in tar balls from moldering biomass combustion. Atmos. Chem. Phys. 2010, 10, 6363–6370. [Google Scholar] [CrossRef]
- Shi, S.; Cheng, T.; Gu, X.; Guo, H.; Wu, Y.; Wang, Y. Biomass burning aerosol characteristics for different vegetation types in different aging periods. Environ. Int. 2019, 126, 504–511. [Google Scholar] [CrossRef]
- Noyes, K.; Kahn, R.; Sedlacek, A.; Kleinman, L.; Limbacher, J.; Li, Z. Wildfire Smoke Particle Properties and Extrusion, from Space-Based Multi-Angle Imaging. Remote Sens. 2020, 12, 769. [Google Scholar] [CrossRef]
- Vay, S.; Woo, J.; Anderson, B.; Thornhill, K.; Blake, D.; Westberg, D.; Kiley, C.; Avery, M.; Sachse, G.; Streets, D.; et al. Influence of regional-scale anthropogenic emissions on CO2 distributions over the western North Pacific. J. Geophys. Res. 2003, 108, 8801. [Google Scholar] [CrossRef]
- Sano, I.; Mukai, S.; Nakata, M.; Holben, B. Regional and local variations in atmospheric aerosols using ground-based sun photometry during Distributed Regional Aerosol Gridded Observation Networks (DRAGON) in 2012. Atmos. Chem. Phys. 2016, 16, 14795–14803. [Google Scholar] [CrossRef]
- Holben, B.; Kim, J.; Sano, I.; Mukai, S.; Eck, T.; Giles, D.; Schafer, J.; Sinyuk, A.; Slutsker, I.; Smirnov, A.; et al. An overview of mesoscale aerosol processes, comparison, and validation studies from DRAGON networks. Atmos. Chem. Phys. 2018, 18, 655–671. [Google Scholar] [CrossRef]
- Noyes, J.; Kahn, R.; Limbacher, J.; Li, Z.; Fenn, M.; Giles, D.; Hair, J.; Katich, J.; Moore, R.; Robinson, C.; et al. Wildfire Smoke Particle Properties and Evolution, From Space-Based Multi-Angle Imaging II: The Williams Flats Fire during the FIREX-AQ campaign. Remote Sens. 2020, 12, 3823. [Google Scholar] [CrossRef]
- Nishizawa, S.; Yashiro, H.; Sato, Y.; Miyamoto, Y.; Tomita, H. Influence of grid aspect ratio on planetary boundary layer turbulence in large-eddy simulations. Geosci. Model Dev. 2015, 8, 3393–3419. [Google Scholar] [CrossRef]
- Kajino, M.; Deushi, M.; Sekiyama, T.; Oshima, N.; Yumimoto, K.; Tanaka, T.Y.; Ching, J.; Hashimoto, A.; Yamamoto, T.; Ikegami, M.; et al. NHM-Chem, Japan meteorological agency’s regional meteorology—Chemistry model: Model evaluations toward the consistent predictions of the chemical, physical, and optical properties of aerosols. J. Meteorol. Soc. Jpn. 2019, 97, 337–374. [Google Scholar] [CrossRef]


| Aerosol Properties | Wavelength (nm) | |||||
|---|---|---|---|---|---|---|
| 380 | 412 | 443 | 530 | 674 | 869 | |
| composition: g | ← g1 → | ← g2 → | ← g3 → | |||
| size: f | the same value of f | |||||
Publisher’s Note: MDPI stays neutral with regard to jurisdictional claims in published maps and institutional affiliations. |
© 2021 by the authors. Licensee MDPI, Basel, Switzerland. This article is an open access article distributed under the terms and conditions of the Creative Commons Attribution (CC BY) license (http://creativecommons.org/licenses/by/4.0/).
Share and Cite
Mukai, S.; Sano, I.; Nakata, M. Improved Algorithms for Remote Sensing-Based Aerosol Retrieval during Extreme Biomass Burning Events. Atmosphere 2021, 12, 403. https://doi.org/10.3390/atmos12030403
Mukai S, Sano I, Nakata M. Improved Algorithms for Remote Sensing-Based Aerosol Retrieval during Extreme Biomass Burning Events. Atmosphere. 2021; 12(3):403. https://doi.org/10.3390/atmos12030403
Chicago/Turabian StyleMukai, Sonoyo, Itaru Sano, and Makiko Nakata. 2021. "Improved Algorithms for Remote Sensing-Based Aerosol Retrieval during Extreme Biomass Burning Events" Atmosphere 12, no. 3: 403. https://doi.org/10.3390/atmos12030403
APA StyleMukai, S., Sano, I., & Nakata, M. (2021). Improved Algorithms for Remote Sensing-Based Aerosol Retrieval during Extreme Biomass Burning Events. Atmosphere, 12(3), 403. https://doi.org/10.3390/atmos12030403