Abstract
To investigate the impact of burning postharvest crop residues in home stoves, PM2.5 samples (particulate matter with a diameter of <2.5 μm) were collected every 3 h at a rural site in Daejeon, Korea during the postharvest season in 2014. A high concentration of levoglucosan was observed with a peak value of 3.8 µg/m3 during the sampling period. The average mannosan/levoglucosan ratio (0.18) at the rural site during a severe BB episode (levoglucosan > 1 μg/m3) was similar to burnings of pepper stems (0.19) and bean stems (0.18) whereas the average OC/levoglucosan ratio (9.9) was similar to burning of pepper stems (10.0), implying that the severe BB episode was mainly attributed to burning of pepper stems. A very strong correlation was observed between levoglucosan and organic carbon (OC) (R2 = 0.81) during the entire sampling period, suggesting that the emission of organic aerosols at the rural site was strongly associated with the burning of crop residues in home stoves. The average mannosan/levoglucosan ratio (0.17 ± 0.06) in the rural area was similar to that in a nearby urban area in Daejeon (0.16 ± 0.04). It was concluded that crop residue burning in a home stove for space heating is one of the important sources of carbonaceous aerosols not only in a rural area but also in the urban area of Daejeon, Korea during the postharvest season.
1. Introduction
Aerosols emitted from biomass burning (BB), which includes wildfires, prescribed burning, agricultural waste burning, and domestic biofuel combustion, can impair visibility and affect radiative forcing and climate [1,2]. Organic aerosols emitted from BB can increase the total light absorption, leading to positive radiative forcing and increasing the average temperature of the atmosphere [3,4]. The contribution of light absorption by brown carbon to the total light absorption by aerosols can reach 20–50% over regions dominated by BB and biofuel combustion [3]. Therefore, the emission of organic aerosols from various types of BB must be characterized to better understand the impact of BB aerosols on visibility impairment, radiative forcing, and climate change on local and regional scales.
Biomass burning emits large amounts of gaseous and particulate pollutants into the atmosphere [5]. Therefore, it plays an important role in the composition of the atmospheric aerosols [6,7,8,9,10]. Estimates based on observational data and Community Multiscale Air Quality (CMAQ) model simulations indicate that open BB contributed 37% of PM2.5 (particulate matter with a diameter of < 2.5 μm), 70% of organic carbon (OC), and 61% of elemental carbon (EC) in the Yangtze River Delta, China, during a heavy haze episode from 28 May to 6 June 2011 [8]. The Weather Research and Forecasting model coupled with Chemistry (WRF–Chem) showed that about 21% of PM10 (particulate matter with a diameter of < 10 μm) in Singapore during July–October is due to BB and peat burning, but that this contribution increases during high burning periods [6]. Burning postharvest crop residues in open spaces or as biofuel in home stoves is an important source of BB in East Asia [11,12]. Despite the potentially large contribution of BB emissions to air pollution in Asian cities [6,8], they are often overlooked in air quality management practices, mainly because there is a lack of reliable information on their sources and magnitudes.
Burning postharvest crop residues in open spaces or as biofuel in home stoves was a serious air–quality issue until the early 20th century on the Korean Peninsula [13,14]. Thus, the Korean Government passed a series of laws and regulations to ban burning in open spaces. However, crop residue burning in home stoves for space heating still occurs frequently in rural areas on the Korean Peninsula during cold weather and emits large amounts of gaseous and particulate pollutants into the atmosphere. The traditional Korean home stove is an underfloor heating device. Unfortunately, information on the nature and extent of the burning of crop residues in home stoves on the Korean Peninsula is still limited [15].
The regional transport of air pollutants plays an important role in downwind areas during haze episodes, conferring distinct regional characteristics on the air pollution over northeast Asia [16,17,18,19]. Chemical transport models are widely used to estimate local and regional contributions to air pollution at the provincial and country levels. Although model simulations are useful tools, simulated results entail uncertainties associated with the emission inventories, chemical reaction pathways, and meteorological parameters [20,21]. Since it is very difficult to predict BB, there is still great uncertainty about the emission inventories related to BB. To better understand haze episodes during cold weather on the Korean Peninsula, it is necessary to characterize and quantify the contributions of local or regional BB to haze particles.
In this study, we quantified the BB tracers in aerosols collected at a rural site in Daejeon, Korea, during the postharvest season and from burnings of three crop residues (pepper stem, bean stem, and rice straw). The chemical properties of the aerosol particles were characterized during a severe BB episode. Potential sources of the aerosol particles were estimated using principal component analysis (PCA). We also evaluated the impact of burning postharvest crop residues on the atmosphere in the rural area and a nearby urban area in Daejeon, Korea.
2. Experimental Method
2.1. Ambient Aerosol Sampling and Sample Preparation
Daejeon is a metropolitan city in the Republic of Korea with a population of ~1.5 million and is located in the middle of the Korean Peninsula. The sampling site is located at ~8 km northwest of the urban center of Daejeon and is adjacent to farming areas to the north and west, as shown in Figure 1. Since farming areas, such as those growing pepper or rice, were located near the sampling site, the sampling site may have been affected by emissions from the burning of postharvest crop residues from both outdoors and indoors during the late fall–winter period.
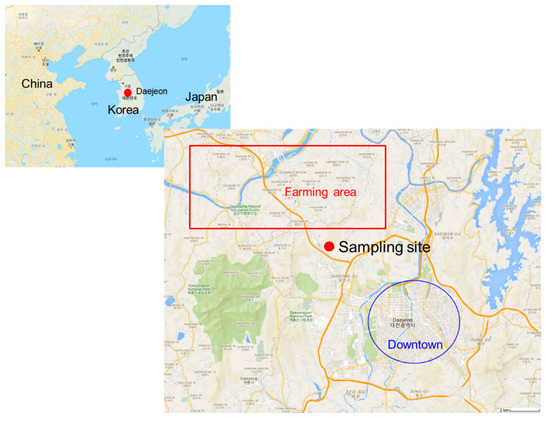
Figure 1.
Map of the sampling site (36.402° N, 127.314° E) in Daejeon (DJ), Republic of Korea (@Google Maps).
PM2.5 was sampled every 3 h at a rural site (Oesam) in Daejeon, Korea, from 22 to 30 November 2014. The PM2.5 samples were collected on prebaked quartz–fiber filters (47 mm diameter; Pall–Life Sciences, Troy, MI, USA), with an aerosol sampler (model PMS–103, APM Korea, Seoul, Korea) at a flow rate of 16.7 L min−1. Before and after sampling, the quartz filters were wrapped in aluminum foil and stored in a freezer at −20 °C. A total of 65 filter samples were collected, and additional field blank filters were also prepared before and after the sampling period.
To measure the monosaccharides and water-soluble ions on the filters, a quarter of each filter sample was extracted with 10 mL of ultrapure water (18.2 MΩ·cm at 25 °C) under ultrasonication (for 30 min) and then passed through a disk filter (0.45 mm; Millex–GV, Millipore, Billerica, MA, USA). The water extracts were stored in a refrigerator at 4 °C before analysis. Monosaccharides and water-soluble ions were analyzed from the water extracts within a week after extraction.
2.2. Analysis of Monosaccharides and Water-Soluble Inorganic Ions
Monosaccharides, such as levoglucosan and mannosan, were analyzed with an improved high-performance anion-exchange chromatography (HPAEC) method with pulsed amperometric detection (PAD) [22,23]. The HPAEC–PAD system uses an ion chromatograph consisting of an electrochemical detector and a gold electrode unit, together with an AS40 autosampler (Dionex ICS–5000, Thermo Fisher Scientific, Waltham, MA, USA). The monosaccharides were separated with a CarboPak MA1 analytical column (4 × 250 mm), with sodium hydroxide solution as the eluent. If overlap was observed between peak areas of neighboring components or tailing of the certain peak was observed, valley to valley integration was performed not only in the real sample but also in calibration standard. Levoglucosan, arabitol, mannitol, trehalose, mannose, and glucose were purchased from Sigma Aldrich (Merck group, Darmstadt, Germany) whereas mannosan and galactosan were purchased from Santa Cruz Biotechnology Inc. (Dallas, TX, USA).
The water-soluble inorganic ions were analyzed with ion chromatography (Dionex ICS–5000, Thermo Fisher Scientific, Waltham, MA, USA). The anions chloride (Cl−), nitrate (NO3−), and sulfate (SO42−) were separated with an IonPAC AS15 column with an eluent of 20 mM potassium hydroxide (KOH), at a flow rate of 0.5 mL min−1. The cations sodium (Na+), ammonium (NH4+), potassium (K+), calcium (Ca2+), and magnesium (Mg2+) were separated with an IonPac CS–12A column (4 × 250 mm) with an eluent of 38 mM methanesulfonic acid, at a flow rate of 1.0 mL min−1. The analytical procedures for the monosaccharides and water-soluble inorganic ions have been discussed in detail by Jung et al. [23].
2.3. Organic Carbon/Elemental Carbon (OC/EC) Analysis
The OC and EC concentrations were analyzed with a thermal optical OC/EC analyzer (Model RT3140, Sunset Laboratory, Troy, MI, USA). A 1.5 cm2 punched segment of quartz filter was placed in a quartz boat inside the thermal desorption chamber of the analyzer. The OC and EC concentrations were analyzed based on the National Institute for Occupational Safety and Health (NIOSH) 5040 temperature profile with thermal–optical transmittance for pyrolysis correction [24,25]. External calibration was performed with known amounts of sucrose. The concentrations of organic matter (OM) were reconstructed from the measured OC concentrations by multiplying them with the OM/OC ratio of 1.8 [26].
2.4. Laboratory Combustion of Crop Residue Samples
Postharvest BB at the rural sampling site in Daejeon, Korea, was mainly attributed to the burning of pepper stems, rice straw, and bean stems during the cold seasons starting from mid–November (personal communication with residents during sampling period). Pine trees are one of the most important forests in Korea and used occasionally as a fuel source in rural areas in Korea for space heating during the cold season [27]. Therefore, three types of crop residue samples and pine trees were collected near the sampling site. The aerosols emitted from the burning of the three crop residues and pine trees were collected on quartz–fiber filters (47 mm diameter; Pall–Life Sciences, New York, NY, USA) at a flow rate of 16.7 L min−1 for 30 s. The PM2.5 sampler consisted of a Teflon–coated aluminum cyclone (URG–2000–30EH, URG, Washington, DC, USA) with a cut size of 2.5 μm and a 47 mm Teflon filter pack (URG–2000–30F, URG, Washington, DC, USA). Each biomass sample was burned in a cylindrically shaped stove (diameter 520 cm, height 850 cm). Aerosols emitted from the chimney (~1 m height) of the stove was introduced to a 1/2” diameter stainless steel tube and then passed through the PM2.5 cyclone. Finally, PM2.5 samples were collected on a quartz fiber filter with a flow rate of 16.7 L min−1. A laboratory burning experiment was conducted under flaming combustion conditions. A total of 4 filter samples was collected from the laboratory combustion experiment.
The collected samples were analyzed for OC/EC and monosaccharides. Figure 2 shows the chromatograms for the three BB samples analyzed with the HPAEC–PAD system. The highest peaks for bean stems, rice straw, and pepper stems corresponded to levoglucosan. Peaks corresponding to mannosan and galactosan were also clearly visible in the chromatograms. Additional peaks for arabitol, mannitol, and glucose were also observed for all three biomass types.
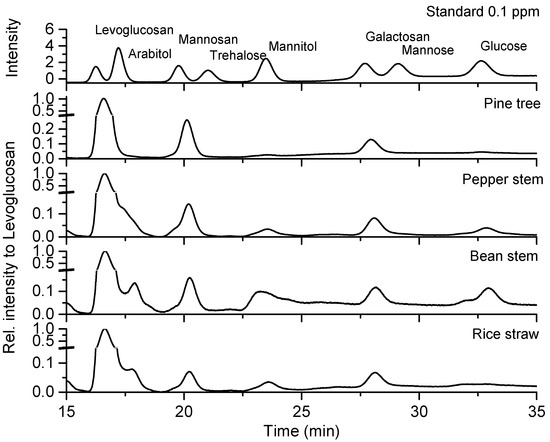
Figure 2.
Chromatograms of monosaccharides emitted when three crop residues (pine tree, pepper stem, bean stem, and rice straw) were burned. That of mono–sugar standard of 0.1 ppm is also shown in this figure.
2.5. Principal Component Analysis (PCA)
Principal component analysis (PCA) was performed to estimate potential sources of aerosol particles at the rural site during the entire sampling period. PCA applies projection dimension reduction methods, converting several concentration sets into significant sets of columns (principal components, PC) without damaging the original data. PCA with VARIMAX rotation was performed by using the software SPSS (IBM, 13). Principal components with an eigenvalue greater than 1.0 were selected to identify aerosol sources.
3. Result and Discussion
3.1. Chemical Characteristics of Fine Particulate Matter (PM2.5) during the Severe BB Episode
Figure 3 shows temporal variations of major PM2.5 chemical components and biomass burning tracers. In this study, a severe BB episode was defined as a levoglucosan concentration > 1 μg m−3, representing the top 1/3 of levoglucosan values. Table 1 summarizes the average chemical components of PM2.5 during the severe BB episode and a no–event period (levoglucosan < 1 μg m−3). The PM2.5 concentration was reconstructed from the sum of all the inorganic ions and carbonaceous aerosols. Jung et al. [28] reported that reconstructed PM2.5 from the sum of all inorganic ions and carbonaceous aerosols captured more than 85% of the measured PM2.5 at the urban site in Daejeon, Korea. The PM2.5 concentration (61.2 ± 22.0 µg m−3) during the severe BB episodes was more than 2–fold higher than that during the no–event period (26.0 ± 11.6 µg m−3). During the severe BB episode, OC (19.1 ± 9.7 µg m−3) was the dominant component, followed by NO3− (7.9 ± 3.5 µg m−3), NH4+ (7.4 ± 2.9 µg m−3), and SO42− (4.9 ± 1.5 µg m−3). This result suggests that the increase in PM2.5 concentration at the rural site during the postharvest season was mainly attributable to the emission of carbonaceous aerosols (OC and EC) from BB.
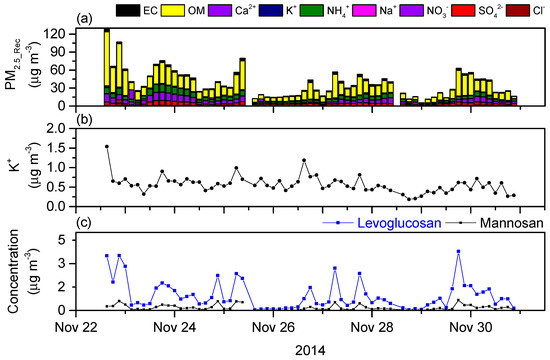
Figure 3.
Temporal variations of (a) major chemical components, (b) K+, and (c) levoglucosan and mannosan during the entire sampling period.

Table 1.
Summary of the chemical components of PM2.5 (particulate matter with a diameter of <2.5 μm) and the biomass burning tracers during a severe biomass burning (BB) event, no event, and the entire period at a rural site in Daejeon, Korea during the postharvest season in 2014.
The levoglucosan and mannosan concentrations during the severe BB episode were ~5–fold higher than during the no–event period as shown in Table 1. Contrary to levoglucosan and mannosan, only a slight increase in K+ was observed during the BB episode (0.68 ± 0.23 µg m−3) compared with the no–event period (0.5 ± 0.18 µg m−3). The OC and Cl− concentrations increased dramatically during the severe BB episode, with an episode/non–episode ratio of > 3. Laboratory combustion experiments showed the enhanced OC and Cl− emission from biomass burning [29]. These results suggest that large amounts of OC and Cl− were emitted from local BB at the rural site in Daejeon. Moderate increases in SO42− and NO3− were observed, with episode/non–episode ratios of ~1−2. However, no increase in Na+ or Ca2+ was observed, with an episode/non–episode ratio of ~1.
3.2. Tracking Potential Sources of Aerosol Particles
From the PCA of the aerosol samples, four PCs were identified in this study as shown in Table 2. PC1 was associated with BB from high loadings of levoglucosan, mannosan, galactosan, and OC. Moderate loadings of EC and Cl− were also obtained in PC1, implying that both species might be originated from BB. PC2 was associated with secondary inorganic aerosols from high loadings of SO42−, NO3−, and NH4+.
Table 2.
Summary of principal component analysis for aerosol particles at the rural site in Daejeon, Korea. Factor loadings lower than 0.4 are not given whereas factor loadings higher 0.7 are marked in bold.
PC3 was associated with sea salt with high loadings of Na+ and K+. Na+ is a well–known sea salt tracer. K+ is emitted not only from BB but also from the ocean [30]. From the PCA, it was postulated that K+ at the rural site during the entire sampling period might be partly associated with emission from the ocean. PC4 was associated with dust with a high loading of Ca2+. Based on average concentrations of PM2.5 components in Table 1 and PCA results in Table 2, BB was estimated as the dominant source from the highest average OC, followed by secondary inorganic formation with minor contributions from sea salt and dust emissions.
3.3. Relationship between BB Tracers and Carbonaceous Aerosols
The regression analyses for four BB tracers (levoglucosan, mannosan, galactosan, and K+) in aerosol samples collected at the rural site in Daejeon are shown in Figure 4. Levoglucosan correlated well with mannosan and galactosan, with coefficients of determination (R2) of 0.83 and 0.91, respectively, as shown in Figure 4a. The regression slopes in Figure 4 were determined from linear regression analyses. After an outlier was excluded (marked red circle in Figure 4a), the correlation between levoglucosan and mannosan increased (R2 = 0.91). The lowest (0.07) and highest (0.26) slopes between levoglucosan and mannosan were obtained from the lowest and highest mass ratios of mannosan to levoglucosan when levoglucosan is higher than 1 μg m−3. Since the mannosan/levoglucosan ratio is affected by the biomass type [31], the wide variation in the mannosan/levoglucosan ratio in Figure 4a implies that the BB episodes were attributable to the burning of a mixture of various types of biomass.
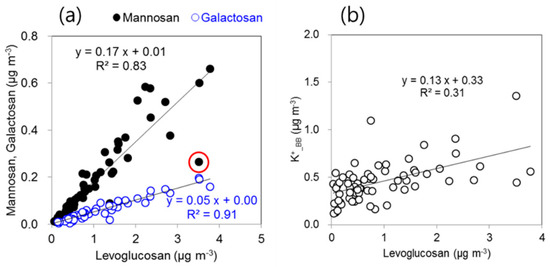
Figure 4.
Scatter plots of (a) levoglucosan versus mannosan or galactosan; and (b) levoglucosan versus K+_BB at the rural site in Daejeon.
The K+ concentrations from BB (K+_BB) were estimated by subtracting the sea salt and soil contributions to K+. The correction method used was according to Pio et al. [32] and uses Na+ as a tracer for sea salt, Ca2+ as a tracer for soil, and an assumed mass ratio of 10 for K+/Ca2+ in wood smoke:
where [K+/Ca2+]soil is 0.12, as proposed by Pio et al. [32]; [K+/Na+]seawater is the potassium/sodium mass ratio in seawater (0.036); and nssCa2+ represents non–sea–salt Ca2+.
K+_BB = (K+ − [K+/Na+]seawater × Na+ − [K+/Ca2+]soil × nssCa2+)/(1 − 0.1 × [K+/Ca2+]soil)
The correlation between K+_BB and levoglucosan was poor (R2 = 0.31), as shown in Figure 4b. The K+_BB concentration reached ~0.2–0.6 μg m−3 when the levoglucosan concentration decreased to zero. Although K+_BB was corrected for seawater and soil, a positive offset was still observed. This result indicated that it was difficult to fully account for the contribution of K+ from soil because its emission strength relative to Ca2+ differed depending on the soil type and origin and it had a high uncertainty [33]. Therefore, K+ was unsuitable for use as a BB tracer at this rural site in Daejeon, Korea.
Emission rates of K+ and levoglucosan varied dramatically depending on burning conditions such as smoldering and flaming. K+ was typically emitted at a higher mass fraction in flaming combustion compared to smoldering [34]. From laboratory combustion experiments of biomass samples under smoldering and flaming conditions, it was reported that flaming combustion enhanced EC, K+, and Cl− emissions whereas smoldering combustion enhanced levoglucosan and water-soluble OC emissions [29]. Thus, smoldering combustion tended to have a higher levoglucosan/K+ emission ratio compared to flaming combustion [35,36]. Crop residue burning in general home stoves was a mixture of smoldering and flaming combustions, causing a relatively poor correlation between K+ and levoglucosan. A recent study reported that a weak correlation between K+ and levoglucosan at Fairbanks, Alaska might be attributed to preferential removal of potassium in the chimney deposits of woodstoves [37].
Figure 5 shows scatter plots for levoglucosan and carbonaceous particles. A strong correlation was observed between levoglucosan and OC (R2 = 0.81). The OC concentration reached almost zero when the levoglucosan concentration was zero, as shown in Figure 5. These results implied that the OC at the rural site predominantly originated from BB. Although a good correlation was observed between OC and levoglucosan, the regression slopes were highly variable when the levoglucosan concentration was > 1 μg m−3. Since the OC/levoglucosan ratio was affected by the biomass type [31], the wide variation in the slope between OC and levoglucosan in Figure 5 implied that the BB episode was attributable to the burning of a mixture of various types of biomass.
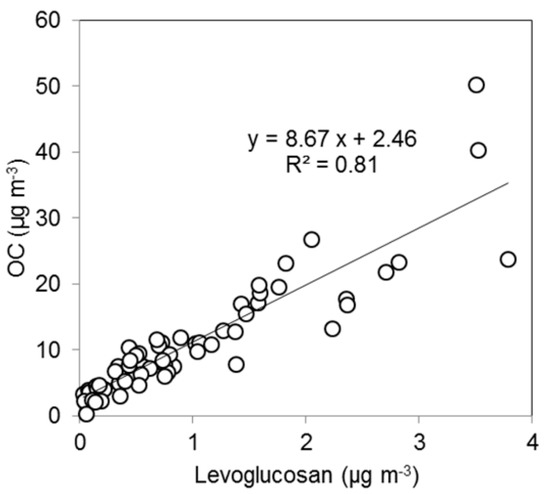
Figure 5.
Scatter plots of levoglucosan versus organic carbon (OC) at the rural site in Daejeon.
3.4. Tracking Sources of BB in the Rural and Urban Atmosphere
Although the open burning of biomass is prohibited in Korea, crop residues are still burned in home stoves for space heating during cold weather. The OC, levoglucosan, and mannosan emitted from the burning of three crop residues (pepper stems, rice straw, and bean stems) and pine trees were quantified and the ratios between them are shown in Figure 6. A relatively high mannosan/levoglucosan ratio was observed for pine trees (0.30), followed by pepper stems (0.19) and bean stems (0.18) whereas a relatively low mannosan/levoglucosan ratio was observed for rice straw (0.089), as shown in Figure 6a. Figure 6b shows the OC/levoglucosan ratios in the aerosol samples collected after the three crop residues and pine trees were burned. The highest OC/levoglucosan ratio was observed for bean stems (16.2), followed by pepper stems (12.6) and pine tree (12.6) whereas a relatively low OC/levoglucosan ratio was observed for rice straw (6.4). These results suggest that the mass ratios among the BB tracers and OC can be used to track the type of biomass that was burnt.
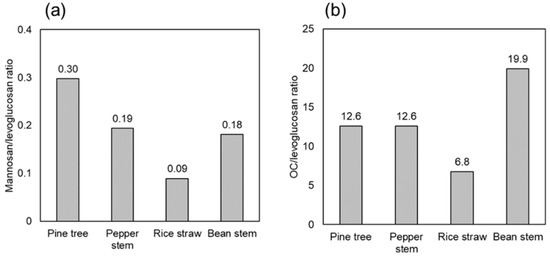
Figure 6.
(a) Mannosan/levoglucosan ratios, and (b) OC/levoglucosan ratios for aerosols emitted when pepper stems, rice straw, bean stems, and pine tree were burnt under flaming conditions.
Figure 7 shows scatter plots of levoglucosan versus mannosan and OC at the rural site in Daejeon during the entire sampling period. The regression slopes between levoglucosan, mannosan, and OC from the three crop residues and pine trees are also shown in Figure 7. The regression slopes of the aerosol particles at the rural site in Daejeon are within those of pine trees and rice straw as shown in Figure 7a. The regression slopes for levoglucosan versus mannosan from pepper stems and bean stems were similar to those of the aerosol particles. The average mannosan/levoglucosan ratio (0.18) at the rural site during the severe BB episode was similar to those when pepper stems (0.19) and bean stems (0.18) were burnt.
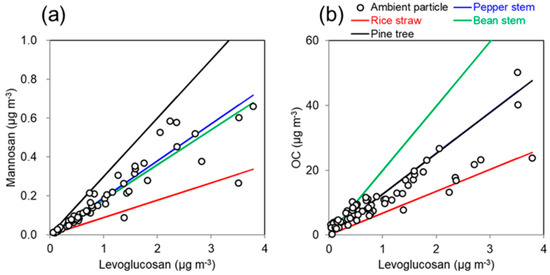
Figure 7.
Scatter plots of (a) levoglucosan versus mannosan, and (b) levoglucosan versus OC, at the rural site in Daejeon. The aerosols emitted when pepper stems, rice straw, bean stems, and pine trees were burned are shown as blue, red, and green solid lines, respectively.
As shown in Figure 7b, the regression slopes for levoglucosan versus OC for pepper stems and pine tree were similar to that for aerosol particles at the rural site in Daejeon, whereas those for bean stems and rice straw were higher and lower, respectively, than that for aerosol particles at the rural site. The average OC/levoglucosan ratio (9.9) at the rural site during the severe BB episode was similar to that for pepper stems (12.6) and pine trees (12.6). However, it was higher than that for rice straw (6.8) and lower than that for bean stems (19.9). These results imply that the severe BB episode at the rural site in Daejeon was closely associated with burning pepper stems and partly with burning bean stems, rice straw, and pine trees. The wide variation in the slope between mannosan and levoglucosan ratio in Figure 4 and that between OC and levoglucosan in Figure 5 were attributed to the burning of a mixture of postharvest crop residues.
Jung et al. [23] quantified the contribution of BB to carbonaceous aerosols using biomass burning tracers at an urban site in Daejeon, Korea, during fall–winter of 2012. They found that ~45% of OC was emitted from biomass burning. To investigate the impact of emissions from burning crop residues on the rural and the urban atmosphere of Daejeon, we compared the mass ratios between the BB tracers and OC (Figure 8). The average mass ratio of mannosan/levoglucosan (0.12 ± 0.01) in the urban sites in Chengdu and Beijing, China during winter is also shown in Figure 8a [38,39]. The average mannosan/levoglucosan ratio (0.17 ± 0.06) in the rural area in Daejeon was similar to that in the urban area in Daejeon, Korea (0.16 ± 0.04) but higher than that in the urban area (0.12 ± 0.01) in China (Figure 8a), implying that the aerosols from BB in the urban area in Daejeon during the cold season might be closely related to the emissions from the burning crop residues in the nearby rural area. Additionally, the regional influence of BB aerosols would be also important under the Asian continental outflows during the cold season [40].
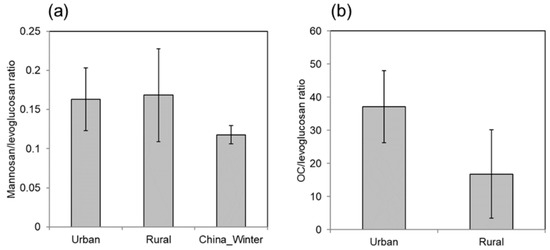
Figure 8.
(a) Average mass ratios of mannosan/levoglucosan and (b) OC/levoglucosan at the urban and rural sites in Daejeon as well as urban sites in China. Data from the urban site in Daejeon were obtained from Jung et al. [23]. Data from the urban site in China were obtained from Cheng et al. [38] and Tao et al. [39].
In contrast to the mannosan/levoglucosan ratio, the average OC/levoglucosan ratio (16.8 ± 13.4) in the rural area in Daejeon was lower than that at the urban area (37.1 ± 10.9) by Jung et al. [23], as shown in Figure 8b. This can be explained by the additional emissions from fossil fuel combustion in the urban area and the secondary formation of OC in the urban atmosphere.
4. Conclusions
Principal component analysis (PCA) revealed that, during the entire sampling period, BB was found as the dominant source of aerosols at the rural site in Daejeon, Korea, followed by secondary inorganic aerosols with minor contributions from sea salt and dust emissions. Elevated concentrations of levoglucosan correlated well with OC, implying that the increased concentration of the PM2.5 at the rural site in the postharvest season was mainly due to the emission of OC from the burning crop residues. Typically, K+ has been used as a tracer for BB in the atmosphere. However, the correlation between K+ and levoglucosan was poor at the rural site in Daejeon, implying that K+ at the sampling site might be originated not only from crop residue burning but also from seawater and soil. Therefore, K+ is unsuitable for use as a BB tracer at this site.
From the mannosan/levoglucosan and OC/levoglucosan ratios, it was estimated that the severe BB episode in the rural area in Daejeon, Korea was strongly associated with the burning of pepper stems and partly with the burning of bean stems, rice straw, and pine tree. We also suggest that the BB aerosols in the urban area in Daejeon, Korea were closely associated with the burning of crop residues in the nearby rural area. Therefore, we postulate that the increase in OC concentrations in rural and urban areas of Daejeon during the postharvest season might be more closely related to local BB emission rather than the long-range atmospheric transport from the Asian continent.
Author Contributions
Conceptualization, J.S.J.; writing—original draft, J.S.J. and J.H.K.; Writing—review and editing, J.S.J. and J.H.K. All authors have read and agreed to the published version of the manuscript.
Funding
This work was funded by a grant (20011049) from the Korea Research Institute of Standards and Science (KRISS) under the Basic R&D Project.
Institutional Review Board Statement
Not applicable.
Informed Consent Statement
Not applicable.
Data Availability Statement
The data used in this study are available from the corresponding author upon request (jsjung@kriss.re.kr).
Acknowledgments
This work was funded by a grant (20011049) from the Korea Research Institute of Standards and Science (KRISS) under the Basic R&D Project. The authors gratefully acknowledge the NOAA Air Resources Laboratory for the provision of the HYSPLIT transport and dispersion model and access to the READY website (http://www.arl.noaa.gov/ready.html) used in this study.
Conflicts of Interest
The authors declare no conflict of interest.
References
- Singh, N.; Banerjee, T.; Raju, M.P.; Deboudt, K.; Hamer, M.S.; Singh, R.S.; Mall, R.K. Aerosol chemistry, transport, and climatic implications during extreme biomass burning emissions over the Indo-Gangetic Plain. Atmos. Chem. Phys. 2018, 18, 14197–14215. [Google Scholar] [CrossRef]
- Malavelle, F.F.; Haywood, J.M.; Mercado, L.M.; Folberth, G.A.; Bellouin, N.; Sitch, S.; Artaxo, P. Studying the impact of biomass burning aerosol radiative and climate effects on the Amazon rainforest productivity with an Earth system model. Atmos. Chem. Phys. 2019, 19, 1301–1326. [Google Scholar] [CrossRef]
- Feng, Y.; Ramanathan, V.; Kotamarthi, V.R. Brown carbon: A significant atmospheric absorber of solar radiation? Atmos. Chem. Phys. 2013, 13, 8607–8621. [Google Scholar] [CrossRef]
- Qin, Y.M.; Tan, H.B.; Li, Y.J.; Li, Z.J.; Schurman, M.I.; Liu, L.; Wu, C.; Chan, C.K. Chemical characteristics of brown carbon in atmospheric particles at a suburban site near Guangzhou, China. Atmos. Chem. Phys. 2018, 18, 16409–16418. [Google Scholar] [CrossRef]
- Andreae, M.O.; Merlet, P. Emission of trace gases and aerosols from biomass burning. Glob. Biogeochem. Cy. 2001, 15, 955–966. [Google Scholar]
- Aouizerats, B.; Werf, G.R.; Balasubramanian, R.; Betha, R. Importance of transboundary transport of biomass burning emissions to regional air quality in Southeast Asia during a high fire event. Atmos. Chem. Phys. 2015, 15, 363–373. [Google Scholar] [CrossRef]
- Chen, J.; Li, C.; Ristovski, Z.; Milic, A.; Gu, Y.; Islam, M.S.; Wang, S.; Hao, J.; Zhang, H.; He, C.; et al. A review of biomass burning: Emissions and impacts on air quality, health and climate in China. Sci. Total Environ. 2017, 579, 1000–1034. [Google Scholar] [CrossRef]
- Cheng, Z.; Wang, S.; Fu, X.; Watson, J.G.; Jiang, J.; Fu, Q.; Chen, C.; Xu, B.; Yu, J.; Chow, J.C.; et al. Impact of biomass burning on haze pollution in the Yangtze River delta, China: A case study in summer 2011. Atmos. Chem. Phys. 2014, 14, 4573–4585. [Google Scholar] [CrossRef]
- Yan, X.Y.; Ohara, T.; Akimoto, H. Bottom-up estimate of biomass burning in mainland China. Atmos. Environ. 2006, 40, 5262–5273. [Google Scholar] [CrossRef]
- Zong, Z.; Wang, X.; Tian, C.; Chen, Y.; Qu, L.; Ji, L.; Zhi, G.; Li, J.; Zhang, G. Source apportionment of PM2.5 at a regional background site in North China using PMF linked with radiocarbon analysis: Insight into the contribution of biomass burning. Atmos. Chem. Phys. 2016, 16, 11249–11265. [Google Scholar] [CrossRef]
- Wu, J.; Kong, S.; Wu, F.; Cheng, Y.; Zheng, S.; Yan, Q.; Zheng, H.; Yang, G.; Zheng, M.; Liu, D.; et al. Estimating the open biomass burning emissions in central and eastern China from 2003 to 2015 based on satellite observation. Atmos. Chem. Phys. 2018, 18, 11623–11646. [Google Scholar] [CrossRef]
- Zhou, Y.; Xing, X.; Lang, J.; Chen, D.; Cheng, S.; Wei, L.; Wei, X.; Liu, C. A comprehensive biomass burning emission inventory with high spatial and temporal resolution in China. Atmos. Chem. Phys. 2017, 17, 2839–2864. [Google Scholar] [CrossRef]
- Jung, J.; Kim, Y.J. Tracking sources of severe haze episodes and their physicochemical and hygroscopic properties under Asian continental outflow: Long-range transport pollution, postharvest biomass burning, and Asian dust. J. Geophys. Res. 2011, 116, D02206. [Google Scholar] [CrossRef]
- Ryu, S.Y.; Kim, J.E.; He, Z.; Kim, Y.J.; Kang, G.U. Chemical composition of post-HARVEST Biomass burning aerosols in Gwangju, Korea. J. Air Waste Manag. Assoc. 2004, 54, 1124–1137. [Google Scholar] [CrossRef] [PubMed]
- Park, S.; Yu, G.H.; Bae, M.S. Effects of combustion condition and biomass type on the light absorption of fine organic aerosols from fresh biomass burning emissions over Korea. Environ. Pollut. 2020, 265, 114841. [Google Scholar] [CrossRef] [PubMed]
- Chen, D.; Liu, X.; Lang, J.; Zhou, Y.; Wei, L.; Wang, X.; Guo, X. Estimating the contribution of regional transport to PM2.5 air pollution in a rural area on the North China Plain. Sci. Total Environ. 2017, 583, 280–291. [Google Scholar] [CrossRef]
- Kim, H.C.; Kim, E.; Bae, C.; Cho, J.H.; Kim, B.-U.; Kim, S. Regional contributions to particulate matter concentration in the Seoul metropolitan area, South Korea: Seasonal variation and sensitivity to meteorology and emissions inventory. Atmos. Chem. Phys. 2017, 17, 10315–10332. [Google Scholar]
- Kim, B.-U.; Bae, C.; Kim, H.C.; Kim, E.; Kim, S. Spatially and chemically resolved source apportionment analysis: Case study of high particulate matter event. Atmos. Environ. 2017, 162, 55–70. [Google Scholar] [CrossRef]
- Wang, Y.; Bao, S.; Wang, S.; Hu, Y.; Shi, X.; Wang, J.; Zhao, B.; Jiang, J.; Zheng, M.; Wu, M.; et al. Local and regional contributions to fine particulate matter in Beijing during heavy haze episodes. Sci. Total Environ. 2017, 580, 283–296. [Google Scholar] [CrossRef]
- Lin, M.; Holloway, T.; Carmichael, G.R.; Fiore, A.M. Quantifying pollution inflow and outflow over East Asia in spring with regional and global models. Atmos. Chem. Phys. 2010, 10, 4221–4239. [Google Scholar]
- Xing, J.; Mathur, R.; Hogrefe, C.; Gan, C.M.; Wong, D.C.; Wei, C.; Gilliam, R.; Pouliot, G. Observations and modeling of air quality trends over 1990–2010 across the Northern Hemisphere: China, the United States and Europe. Atmos. Chem. Phys. 2015, 15, 2723–2747. [Google Scholar] [CrossRef]
- Engling, G.; Carrico, C.M.; Kreidenweis, S.M.; Collett Jr, J.L.; Day, D.E.; Malm, W.C.; Lincoln, L.; Hao, W.M.; Iinuma, Y.; Herrmann, H. Determination of levoglucosan in biomass combustion aerosol by high-performance anion-exchange chromatography with pulsed amperometric detection. Atmos. Environ. 2006, 40, S299–S311. [Google Scholar] [CrossRef]
- Jung, J.; Lee, S.; Kim, H.; Kim, D.; Lee, H.; Oh, S. Quantitative determination of the biomass-burning contribution to atmospheric carbonaceous aerosols in Daejeon, Korea, during the rice-harvest period. Atmos. Environ. 2014, 89, 642–650. [Google Scholar] [CrossRef]
- Birch, M.E.; Cary, R.A. Elemental carbon-based method for monitoring occupational exposure to particulate diesel exhaust. Aerosol Sci. Tech. 1996, 25, 221–241. [Google Scholar] [CrossRef]
- Kim, D.; Jung, J.; Lee, H.; Choi, S.-H.; Lee, S. Characterization of sampling artifacts in the measurement of carbonaceous particles using high- and low-volume samplers in Daejeon, Korea. Atmos. Environ. 2016, 139, 157–166. [Google Scholar]
- Jung, J.; Lyu, Y.; Lee, M.; Hwang, T.; Lee, S.; Oh, S. Impact of Siberian forest fires on the atmosphere over the Korean Peninsula during summer 2014. Atmos. Chem. Phys. 2016, 16, 6757–6770. [Google Scholar] [CrossRef]
- Choi, W.I.; Nam, Y.; Lee, C.Y.; Choi, B.K.; Shin, Y.J.; Lim, J.H.; Koh, S.H.; Park, Y.S. Changes in major insect pests of pine forests in Korea over the last 50 years. Forests 2019, 10, 692. [Google Scholar] [CrossRef]
- Jung, J.; Ghim, Y.S.; Lyu, Y.S.; Lim, Y.J.; Park, J.; Sung, M.Y. Quantification of regional contributions to fine particles at downwind areas under Asian continental outflows during winter 2014. Atmos. Environ. 2019, 210, 231–240. [Google Scholar] [CrossRef]
- Fushimi, A.; Saitoh, K.; Hayashi, K.; Ono, K.; Fujitani, Y.; Villalobos, A.M.; Shelton, B.R.; Takami, A.; Tanabe, K.; Schauer, J.J. Chemical characterization and oxidation potential of particles emitted from open burning of cereal straws and rice husk under flaming and smoldering conditions. Atmos. Environ. 2017, 163, 118–127. [Google Scholar]
- Pio, C.A.; Legrand, M.; Alves, C.A.; Oliveira, T.; Afonso, J.; Caseiro, A.; Puxbaum, H.; Sanchez-Ochoa, A.; Gelencsér, A. Chemical composition of atmospheric aerosols during the 2003 summer intense forest fire period. Atmos. Environ. 2008, 42, 7530–7543. [Google Scholar] [CrossRef]
- Sullivan, A.P.; Holden, A.S.; Patterson, L.A.; McMeeking, G.R.; Kreidenweis, S.M.; Malm, W.C.; Hao, W.M.; Wold, C.E.; Collett, J.L., Jr. A method for smoke marker measurements and its potential application for determining the contribution of biomass burning from wildfires and prescribed fires to ambient PM2.5 organic carbon. J. Geophys. Res. 2008, 113, D22302. [Google Scholar] [CrossRef]
- Pio, C.A.; Legrand, M.; Oliveira, T.; Afonso, J.; Santos, C.; Caseiro, A.; Fialho, P.; Barata, F.; Puxbaum, H.; Sanchez-Ochoa, A.; et al. Climatology of aerosol composition (organic versus inorganic) at nonurban sites on a west-east transect across Europe. J. Geophys. Res. 2007, 112, D23S02. [Google Scholar] [CrossRef]
- Harrison, R.M.; Beddows, D.C.S.; Hu, L.; Yin, J. Comparison of methods for evaluation of wood smoke and estimation of UK ambient concentrations. Atmos. Chem. Phys. 2012, 12, 8271–8283. [Google Scholar] [CrossRef]
- Lee, T.; Sullivan, A.P.; Mack, L.; Jimenez, J.L.; Kreidenweis, S.M.; Onasch, T.B.; Worsnop, D.R.; Malm, W.; Wold, C.E.; Hao, W.M.; et al. Chemical smoke marker emissions during flaming and smoldering phases of laboratory open burning of wildland fuels. Aerosol Sci. Tech. 2010, 44, 1–6. [Google Scholar] [CrossRef]
- Schkolnik, G.; Falkovich, A.H.; Rudich, Y.; Maenhaut, W.; Artaxo, P. New analytical method for the determination of levoglucosan, polyhydroxy compounds, and 2-methylerythritol and its application to smoke and rainwater samples. Environ. Sci. Technol. 2005, 39, 2744–2752. [Google Scholar] [CrossRef] [PubMed]
- Gao, S.; Hegg, D.A.; Hobbs, P.V.; Kirchstetter, T.W.; Magi, B.I.; Sadilek, M. Water-soluble organic components in aerosols associated with savanna fires in southern Africa: Identification, evolution, and distribution. J. Geophys. Res. 2003, 108, 8491. [Google Scholar] [CrossRef]
- Kawamura, K.; Kunwar, B.; Deshmukh, D.; Vodicka, P. Preferential Removal of Potassium in the Chimney Deposits of Woodstove: Reconsideration of Biomass Burning Tracers (nss-K and Levoglucosan). AGU Conference 2019, A21C-03. Available online: https://agu.confex.com/agu/fm19/meetingapp.cgi/Paper/623599 (accessed on 30 December 2020).
- Cheng, Y.; Engling, G.; He, K.B.; Duan, F.K.; Ma, Y.L.; Du, Z.Y.; Liu, J.M.; Zheng, M.; Weber, R.J. Biomass burning contribution to Beijing aerosol. Atmos. Chem. Phys. 2013, 13, 7765–7781. [Google Scholar]
- Tao, J.; Gao, J.; Zhang, L.; Zhang, R.; Che, H.; Zhang, Z.; Lin, Z.; Jing, J.; Cao, J.; Hsu, S.C. PM2.5 pollution in a megacity of southwest China: Source apportionment and implication. Atmos. Chem. Phys. 2014, 14, 8679–8699. [Google Scholar] [CrossRef]
- Zhu, C.; Kawamura, K.; Kunwar, B. Effect of biomass burning over the western North Pacific Rim: Wintertime maxima of anhydrosugars in ambient aerosols from Okinawa. Atmos. Chem. Phys. 2015, 15, 1959–1973. [Google Scholar] [CrossRef]
Publisher’s Note: MDPI stays neutral with regard to jurisdictional claims in published maps and institutional affiliations. |
© 2021 by the authors. Licensee MDPI, Basel, Switzerland. This article is an open access article distributed under the terms and conditions of the Creative Commons Attribution (CC BY) license (http://creativecommons.org/licenses/by/4.0/).