Abstract
Moist tropical (MT) air masses routinely host convective precipitation, including weakly forced thunderstorms (WFTs). These short-lived, isolated events present recurring forecasting challenges due to their spatially small footprints and seemingly erratic behavior in quiescent warm-season environments worldwide. In particular, their activity is difficult to accurately characterize via probability of precipitation (POP), a common forecast product for the general public. This study builds an empirical climatological POP distribution for MT days over the continental United States using Stage IV precipitation estimates. Stage IV estimates within MT air masses between May–September (i.e., the boreal warm season) 2002–2019 are masked into precipitation (≥0.25 mm) and nonprecipitation (<0.25 mm) areas and standardized by the number of MT days. POPs are higher when MT air masses are present. For the Southeast U.S., POP generally increases ~15% compared to the overall warm-season value. At 1800 UTC (1–2 PM LT) daily, POPs are confined to coastal areas and east-facing ridges, and advance inland by 2100 UTC (4–5 PM LT). Climatologically, ~50% of the warm-season precipitation in the Southern U.S. occurred in MT environments. This study emphasizes the need for better forecasting tools and climatological analyses of weakly forced environments.
1. Introduction
Despite advances in high-resolution, convection-allowing numerical weather prediction systems, operational meteorologists still struggle to reliably forecast afternoon precipitation in moist tropical air masses. Characterized by warm, humid surface conditions, rising air parcels in these settings are more likely to cool according to the moist adiabatic lapse rate at a lower altitude, yielding greater static instability. As the jet stream retreats poleward during the midlatitude warm season, synoptic dynamical forcing for convection becomes less frequent and thunderstorm activity predominantly develops due to diurnal heating and associated parcel buoyancy [1]. In these weakly forced settings, convective cells are typically conceptualized as small, short-lived, and isolated [2], earning them the designation weakly forced thunderstorms (WFT) [1]. Individual WFT updrafts generally last 30–60 min with each convective cell completing a three-stage life cycle (cumulus, mature, and dissipating) as first documented by the famed Thunderstorm Project in 1949 [2]. Operational forecasters in the United States openly acknowledge the challenges of forecasting WFT-related phenomena [3] with forecast verification metrics confirming this attitude via depressed success statistics [4,5].
At its root, forecasting precipitation associated with WFTs is difficult because the mesoscale features that prompt WFT formation are poorly resolved by both the current observation network and the modeling systems that assimilate them. Often termed “disorganized” convection, this title references the lack of systematic secondary convection initiation, such as on the downshear flank in multicell clusters when sufficient low-level shear is present [6]. However, contrary to the historically dominant paradigm that convection occurs as isolated cells in weakly sheared environments [2], WFTs routinely prompt secondary convection and/or grow upscale on weakly sheared days [7], complicating the precipitation forecast in quiescent warm-season regimes.
Both broadcast and operational meteorologists alike routinely communicate precipitation forecasts via the “probability of precipitation” (POP) product. Though the definition of POP varies depending on the source or application [8], POP is defined by the United States National Weather Service (NWS) as the likelihood of at least 0.25 mm (0.01 in) of precipitation at any location [9] and is considered to be the best way to communicate precipitation probability to the public [10]. Meteorologists constructing POP forecasts are usually expressing their confidence about both the occurrence of precipitation as well as their uncertainty regarding its spatial distribution. However, in weakly forced environments, not only is the timing of convection initiation difficult to predict, but the propagation, translation, and formation of secondary convective cells can all serve to “bust” the POP forecast.
Though moist tropical air masses can host multiple forms of convective precipitation (e.g., mesoscale convective systems, tropical cyclones, etc.), in the summertime Southeast U.S. moist tropical conditional are often associated with stagnant, unstable regimes [11,12,13,14,15] that favor WFT activity. Recent climate modeling projects the weak-shear settings to expand spatially and seasonally affecting larger areas for a greater fraction of the year, even with modest warming [16]. Meanwhile, historical analyses have already documented an increase in the frequency of warm, moist air masses in the eastern U.S. [17]. Thus, it is important to improve POP forecasting ability in moist tropical settings, particularly as they relate to weakly forced environments. Additionally, by improving the POP prediction, operational forecasters can indirectly help the public plan for life-threatening precipitation-related hazards, such as lightning, which are not currently criteria for severe weather warning issuance. Between 1998–2006, over 84% of U.S. lightning fatalities were related to WFTs [18].
Though undergraduate meteorology curricula regularly emphasize the value of climatology when forecasting a particular event [19], no such tool is available for POP forecasting in moist tropical regimes. Fortunately, because landscape features regularly favoring convection initiation [7,20] are static, POP forecasts in WFT environments can be improved by analyzing long-term observations of precipitation coverage and frequency. For instance, radar reflectivity analyses indicate that precipitation systematically occurs at preferred locations and times [21]. Consequently, this study combines a historical air-mass type dataset with high-resolution, hourly radar-based multisensor precipitation estimates (MPE) to build an empirical precipitation frequency distribution for moist tropical days over the continental United States. The results are then focused over the Southeast U.S. where moist tropical conditions during the warm season are often associated with WFT-favorable environments [11,12,13,14,15]. The purpose of the project is to provide operational forecasters with a new suite of climatological tools to aid POP forecasting in moist tropical air masses.
2. Methods
Daily air mass types are retrieved from the publicly accessible Spatial Synoptic Classification (SSC) database [22] for 93 cities in the continental U.S. (Figure 1) between 2002–2019. The SSC system characterizes the air mass type present at a specific location using the diurnal variation of air temperature, dewpoint, cloud cover, and mean sea level pressure [22]. Days are then assigned to one of seven air masses: dry polar, dry moderate, dry tropical, moist polar, moist moderate, moist tropical (MT), and transitional. Because days with air mass changes are captured by the “transitional” category, frontal passages, and the more organized shear regime and convective modes that would typically accompany them, are filtered into that designation. Meanwhile, the MT category represents warm and very humid convective environmental conditions that lack acute and organized kinematic profiles. The SSC formally describes convective precipitation as being “quite common in this weather type, especially in summer.” For the Southeast U.S. specifically, the poleward retreat of the strongest shear environments during the warm season (defined hereafter as May–September) means MT air masses are typically stagnant, weak-flow regimes conducive to WFTs. As such, numerous studies have leveraged MT days from the SSC dataset to examine the effect of landscape patterns on WFT development in the Southeast U.S. [11,12,13,14,23]. Supplementary Figure S1 and Supplementary Table S1 confirm this generalization for Atlanta, Georgia, centrally located within the Southeast U.S. Radiosonde observations at this location show that MT air masses between May and September demonstrate the most favorable combination of weak shear and static instability. (Dry tropical air masses possess a similar combination by they constitute only 3.8% of warm season days and rarely witness precipitation; Supplementary Table S1)
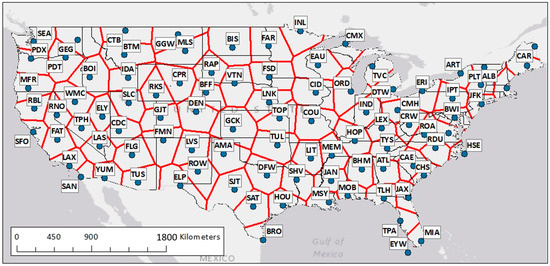
Figure 1.
Spatial Synoptic Classification (SSC) sites that were incorporated in the analysis. The black polygons indicate the jurisdiction for each SSC site to determine the presence of a moist tropical (MT) air mass across the continental United States (CONUS).
Though the use of MT air masses to filter WFT-conducive environments in the Southeast U.S. is well supported by previous research, the MT category may also capture environments that, while not encountering a front, may nonetheless be characterized by appreciable dynamical forcing and/or wind shear. For instance, the region surrounding a tropical cyclone would likely possess MT characteristics. However, precipitation coverage would be much higher during a tropical cyclone landfall than would typically be experienced on an archetypal WFT day. Similarly, mesoscale convective systems (MCS) could also form within MT air masses, even though they are not short-lived isolated convection. The consequences of these scenarios are discussed in Section 4.2. Nonetheless, the success of previous studies to isolate disorganized precipitation days using the MT air mass [11,12,13,14,23] sets a clear precedent for this approach.
While a myriad of observation systems are available for hydrometeorological studies [24], we employ hourly MPE from the NCEP Stage IV dataset [25] to characterize the occurrence and magnitude of precipitation on MT days. Stage IV precipitation analysis is a gauge-calibrated radar-based precipitation product available hourly over the continental U.S. from 2002–Present at 4-km resolution. Stage IV gridded precipitation fields between 2002–2019 were filtered to only include precipitation occurring on MT days in each of the polygons shown in Figure 1. Though the number of MT days for each SSC site/polygon vary, Stage IV precipitation is only analyzed across a polygon when its associated SSC site experienced a MT day. While not all areas within a polygon may have experienced the same air mass conditions as the central site, it is common practice to characterize convective environments over an adjacent region are using the nearest radiosonde launch site [26,27,28,29], a network even coarser than the SSC arrangement in Figure 1. Given the limited distribution of surface stations with SSC classifications, this study adopts the same well-established technique. Figure 2 shows the percentage of MT days recorded every warm season for each polygon in the domain, a distribution that is consistent with the observed lengths of the isolated convection season across CONUS [30].
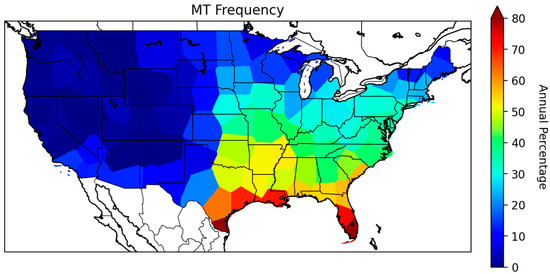
Figure 2.
Mean percentage of MT days during the May–September (153 days) study period recorded at each SSC site/polygon shown in Figure 1 between 2002–2019.
For each warm-season day during the 18 year study period, the 24 h Stage IV accumulated precipitation estimates are masked into precipitation (≥0.25 mm) and nonprecipitation (<0.25 mm) areas with precipitation areas set equal to 1 and nonprecipitation areas set equal to 0. The 0.25-mm threshold corresponds to the U.S. National Weather Service POP definition described in Section 1. Next, the binary precipitation arrays for each polygon are summed along the time dimension for only those days that the associated SSC site registered an MT air mass. The 18 year sum, itself a 2dimensional array, is then divided by the number of MT days contributing to the Stage IV precipitation areas (same for all cells in a polygon), yielding a 2dimensional empirical precipitation frequency for MT environments. This precipitation frequency product will be referenced as “POP” in Section 3 and Section 4, though it may not be entirely analogous to the POP value issued by a forecaster for the reasons mentioned in Section 1.
This procedure is repeated with three variations. (1) Instead of summing the binary precipitation–no precipitation occurrence, the actual MPE is summed. Upon dividing by the number of MT days in the polygon, the mean 24 h MT precipitation is determined. (2) The MPE is summed as in (1). However, instead of dividing by the number of MT days (which is the same for all cells in that polygon), the total precipitation is divided by the summed 18 year binary precipitation–no precipitation array. This yields a mean precipitation array conditional upon the occurrence of precipitation (i.e., if a storm occurs on an MT day, how much rain does it produce on average). Stated differently, (2) repeats (1) but excludes no-precipitation MT days at each grid cell. The result of (2) is hereafter termed “conditional” mean precipitation. (3) The initial (i.e., precipitation frequency) calculation is repeated but for four 1 h intervals (1500, 1800, 2100, and 0000 UTC) rather than the 24 h interval. This final step of the analysis produces four POP fields within the peak diurnal range on MT days.
3. Results
As Figure 2 indicates, Western U.S. sites experienced very few MT days, consistent with their drier climates. In fact, two SSC sites (Farmington, New Mexico, and Butte, Montana) did not record a single MT day during the entire 18 year study period. In contrast, >50% of May–September days experience MT air masses over much of the Southeast U.S. with some areas exceeding 75%. Though the patterns of MT frequency vary coherently and logically across the continental U.S. (CONUS), some sharp changes in MT frequency between adjacent SSC regions (e.g., AMA vs. DFW; CID vs. EAU; etc.; Figure 1) produce linear discontinuities when performing the POP and mean precipitation calculations.
3.1. POP in Moist Tropical Air Masses
Figure 3a indicates the 18 year POP over the continental U.S. for MT environments. The small frequency of MT air masses in the Western and Northern U.S. leads to juxtapositions of high and low POPs, even within the same SSC polygon. Along the U.S. west coast, POPs are near zero with the exception of the MFR polygon that presumably experienced a widespread precipitation on one of its few MT days. POPs across the Northern Plains of the U.S. are higher than the Southern Plains even though the frequency of MT days is much lower near the Canadian border. POPs are also large among the mountainous interior regions of the Northeastern U.S. for the roughly 10% of summer days with MT air masses in this area.
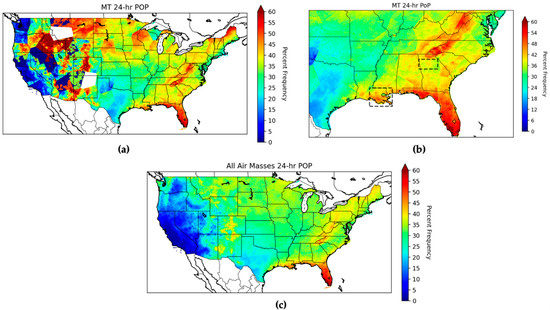
Figure 3.
Probability of precipitation (POP) on MT days between 2002–2019 for the (a) entire CONUS and (b) southeastern U.S. The black dashed boxes correspond to the areas shown in the inset maps in Figure 4. POP for all May–September days (i.e., all air masses) is shown in (c).
Because POPs over much of the CONUS experience nonphysically driven visual patterns due to low MT frequencies, Figure 3b is focused on the regions of Figure 2 where MT days comprise a large fraction of the warm-season air masses and are subsequently less influenced by small denominators in the POP calculation. With the exception of some areas of the Southern Plains, POPs are generally at least 30% for most of the eastern U.S. In fact, large areas of the Gulf Coast, Florida peninsula, and Appalachian Mountains exceed a 50% likelihood of rainfall on MT days.
The propensity for convection to form in warm, moist air masses can also be appreciated by comparing the MT POPs to the overall warm-season POP. Over the Southeast U.S., POPs deviate markedly from the holistic warm-season value. Figure 3c shows the climatological POP for the CONUS (all air masses). Compared to Figure 3a,b (MT-only), the MT POPs are roughly 15% higher in the interior Southeastern U.S. MT POPs are similarly enhanced in the Northern Plains and Northeastern U.S. Although POPs are also higher in MT air masses over the Western U.S., the few MT days contributing to the enhanced precipitation introduce considerable uncertainty to the increase. In contrast, POPs over the Southern Plains are largely unchanged in MT environments.
Beyond highlighting large-scale terrain features, Figure 3b also illustrates that POP can vary on relatively small scales in areas that should presumably experience a consistent POP. For instance, the northernmost dashed box in Figure 3b is centered on Atlanta, Georgia, USA, and encompasses an area which would likely receive an areally consistent POP. However, as Figure 4a shows, the climatological POP varies by approximately 8% across this seemingly homogenous terrain.
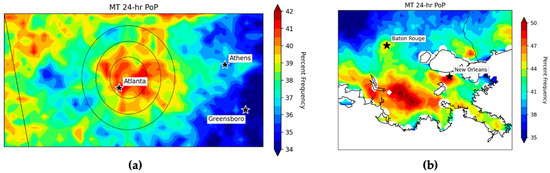
Figure 4.
MT POP for the dashed polygon regions in Figure 3b centered on (a) Atlanta, Georgia, USA, and (b) southeast Louisiana, USA. The three concentric black rings in (a) correspond to 20-, 35-, and 50-km radii from the city centroid versus the black star which signifies the location of the central business district. Note the differing color scales in each pane.
The concentric rings in Figure 4a provide a better representation of the urban footprint of Atlanta versus the downtown area (black star) which is asymmetrically located within the urban sprawl. Higher POPs exist over the Atlanta metro area than the surrounding landscape. However, even within the metro area, POPs 35–50-km west of the city centroid are ~5% lower than POPs at the equivalent distance on the eastern side of the metroplex. Meanwhile, POPs in Greensboro, Georgia, roughly 100 km west of Atlanta, are nearly 7% lower.
Similarly, POP over southeast Louisiana, USA, is shown in Figure 4b, which corresponds to the southernmost dashed box in Figure 3b. Clear subregional POP variability appears. For instance, POP on the south shore of Lake Pontchartrain (just north of New Orleans; Figure 4b) is nearly 8% higher than POP on the north shore, a mere 50 km away. Additionally, local POP maxima (>50%) are evident ~85 km west and 50 km northeast of New Orleans. In all of these areas, the orientation of the coastlines favor colliding sea and/or lake breezes that prompt convection more often. While forecast POP in a moist, weakly sheared air mass would likely reflect higher likelihoods near the coast, the 4-km resolution Stage IV product reveals much finer nuances to POP distribution in otherwise homogenous settings.
In addition to the daily POP in moist tropical air masses, the hourly resolution of the Stage IV MPE allows POP distributions to be computed on subdaily timescales. Figure 5 shows hourly POP over the Southeast U.S. at 1500, 1800, 2100, and 0000 UTC (Figure 5a–d), which correspond to 10:00 AM, 1:00 PM, 4:00 PM, and 7:00 PM local time for most of the domain. At 1500 UTC, the only appreciable POP is 10% along the Louisiana and Florida Gulf Coasts. By 1800 UTC, POP is highest near the coastlines and prominent orographic features like the Appalachian Mountains. Diurnal POP peaks at 2100 UTC as the land surface warms, sea breezes advance further inland, parcel buoyancy increases during diurnal heating, and consequently POP increases among interior regions of the Southeast. By 0000 UTC, POP begins to decline as diurnal heating wanes. In fact, some sea-breeze dominant coastal areas in Louisiana and Florida experience greater POP at 1500 UTC than 0000 UTC.
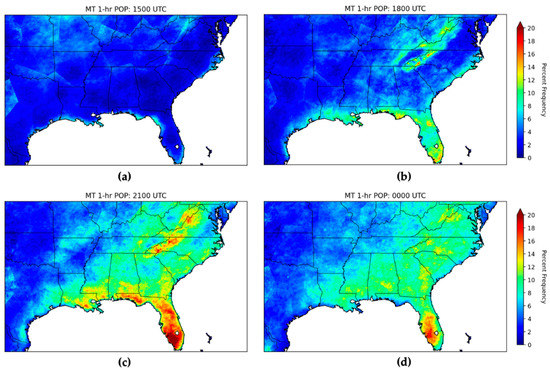
Figure 5.
MT POP for the 1 h rainfall at (a) 1500, (b) 1800, (c) 2100, and (d) 0000 UTC.
3.2. Mean MT Precipitation
In addition to the likelihood of precipitation, the mean 24 h accumulation of MT-related rainfall can also be computed from the same dataset. Figure 6 shows that MT days are associated with relatively light rainfall totals. Mean accumulation is <10 mm CONUS-wide (Figure 6a), with the greatest mean totals (5–7 mm) found in the Upper Midwest across Minnesota and Wisconsin. In regions that experience the greatest frequency of MT days (Figure 2), the 24 h average total is roughly 3–5 mm. Figure 6b shows the Southeast U.S. in greater detail. Widespread accumulations of 4 mm span most areas east of the Mississippi River with mean totals decreasing nearer 2 mm west of the Mississippi. Meanwhile, isolated areas along the Gulf Coast and south Florida exceed 6 mm. If the mean is conditioned upon the occurrence of precipitation (i.e., dry days removed at each grid cell), then a different pattern emerges. Conditional totals are roughly double the overall mean for all areas east of the Rocky Mountains (Figure 6c), and parts of the southern Great Plains witness conditional means that approach 15 mm, roughly 3× the unconditional mean (Figure 6d).
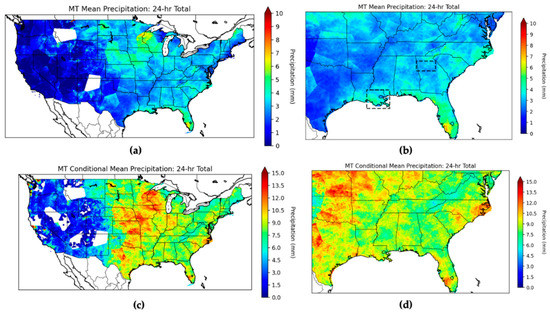
Figure 6.
The 24 h mean (a,b) and conditional mean (c,d) precipitation total on MT days between 2002–2019 for the entire CONUS (a,c) and southeastern U.S. (b,d). The black dashed boxes correspond to area shown in the inset maps in Figure 4.
Figure 7 repeats the POP insets for Atlanta and Louisiana except for mean 24 h precipitation. Though the accumulated rainfall (Figure 7) mirrors the POP maps in Figure 4 for each region, they are not completely analogous. For instance, the ~7% reduction in POP between Atlanta and Greensboro, Georgia, described in Section 3.1 is not as dramatic when viewed through the lens of mean daily precipitation. In contrast, the two POP maxima in southeast Louisiana (Figure 4b), one over New Orleans and another to its west, do not manifest equally in the mean rainfall distribution. While the maximum along the south Louisiana coastline possesses 24 h totals near 5.25 mm, the equivalent POP maximum near New Orleans shows 24 h totals that are a full millimeter smaller. Removing dry MT days at each gridpoint increases the conditional mean 2–3× against the unconditional average (Figure 7c,d). The conditional mean east of Atlanta (Figure 7c), is ~10 mm compared to the overall MT mean of ~3.5 mm. This indicates that while POP is lower east of the city, the MT rainfall produced in this area, when it occurs, is typically greater than over Atlanta itself. The conditional mean for New Orleans also increases over the city by roughly two-fold (Figure 7d), but it no longer stands out as a local maxima either.
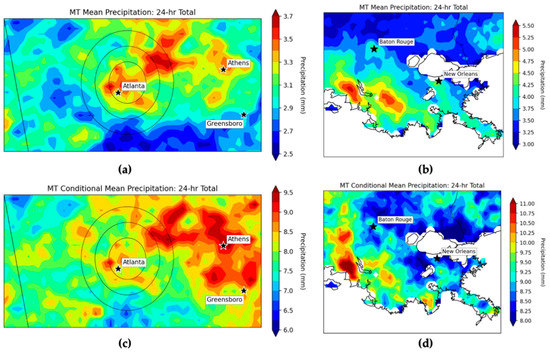
Figure 7.
The 24 h mean (a,b) and conditional mean (c,d) precipitation total on MT days between 2002–2019 for the dashed polygon regions in Figure 6b centered on (a) Atlanta, Georgia, USA, and (b) southeast Louisiana, USA. The three concentric black rings in (a,c) correspond to 20-, 35-, and 50-km radii from the city centroid versus the black star which signifies the location of the central business district. Note the differing color scales.
Lastly, the total accumulated precipitation on MT days can be compared to the entire five-month precipitation total to determine how important MT rainfall forming is to the warm season water budget. Figure 8a shows that MT air masses are responsible for virtually none of the warm season rainfall in the Western U.S., although some areas along the U.S.–Mexico border experience a ~30% contribution. In the Great Plains, MT days produce 25–50% of summer precipitation with the smaller contributions located nearer to the Canadian border where MT air masses are less frequent (Figure 2). The MT precipitation fraction is smaller near the Great Lakes and Mid-Atlantic with fractions near 30%. Figure 8b highlights the Southeast U.S. in greater detail. Here, the MT rainfall fraction is fairly consistent across the entire region—near 50%. More southerly locations, such as Louisiana, Florida, and south Texas witness >60% of summertime precipitation arising from moist tropical air masses, with the latter two areas exceeding 75%.
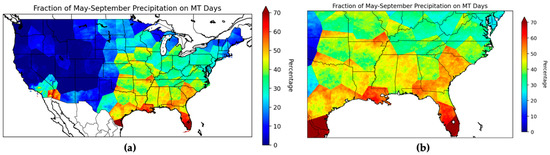
Figure 8.
Percentage of average May–September Stage IV precipitation that occurs on MT days for the (a) CONUS and (b) Southeast U.S. Note the differing color scales.
4. Discussion
Abundant research has established that thunderstorm morphology, and consequently precipitation coverage and POP, is a function of the kinematic and thermodynamic characteristics of the host atmosphere e.g., [31]. However, no previous work has endeavored to standardize the air mass characteristics across a large area, and thus, minimize confounding synoptic climatological influences on a large scale. Thus, the results shown in Section 3 are uniquely equipped to examine CONUS-wide POP trends within a constant air mass, not as a function of the air mass.
4.1. POP Distribution
The POP distributions in Figure 3 and Figure 4 showcase the advantage of viewing POP as (1) an inherently spatial variable and (2) as a conditional variable related to the air mass type. Because deterministic model output from the Global Forecast System (GFS) and North American Mesoscale (NAM) model cannot by itself produce a POP, this forecast product is informed by the Model Output Statistics (MOS) product. MOS effectively downscales the model field variables to historical weather conditions at thousands of individual sites across the CONUS. Though MOS may also be spatialized to produce a two-dimensional gridded MOS surface between MOS sites using geoclimatic variables (e.g., elevation) [32], the statistical interpolation could easily miss the air mass-dependent climatological variability shown in Figure 3 and Figure 4, especially if a MOS station is not located within one of the local maxima/minima.
Though MOS implicitly captures the thunderstorm morphological effects by using model forecast environmental variables to generate the POP, there is no explicit consideration of the air mass type. Even though studies have shown that forecast and model error can vary as a function of synoptic pattern and near-storm environment [33,34,35], air mass type is not fully leveraged as an a priori condition that can be used to refine POP products in the warm season. Table 1 provides an anecdotal illustration of the different forecasting approaches, the 0000 UTC GFS MOS forecast POP for New Orleans, Louisiana, (KMSY) during July 2016 was 39.0%. For the 28 days with MT air masses, the GFS predicted a mean 12 h (1200–000 UTC) POP of 36.1%. According to surface observations from KMSY, the actual July 2016 POP was 51.6%. Whereas the GFS MOS was ~15% too low for the month, the MT-based POP at KMSY is 46.6%, much closer to observed value. Though the 12 h POP generated by the GFS differs from the 24 h POPs calculated in this study, the 1200–0000 UTC forecast period captures the majority of peak diurnal heating. While convective activity wanes rapidly after 0000 UTC [36], some of the discrepancy might be attributed to post-0000 UTC precipitation. This July 2016 case study likely suggests that including a simple characterization of air mass type in the MOS downscaling procedure could improve the POP accuracy.

Table 1.
Global Forecast System (GFS) Model Output Statistics (MOS) POP forecasts for July 2016. Each POP was calculated at 0000 UTC of the day listed for the 1200–0000 UTC period later that same day. All days were classified as MT air masses, except for three, which were all moist moderate (MM).
In addition to its accurate performance in July 2016 example above, the MT-based POP distribution further demonstrates its utility by capably replicating known physical mechanisms of WFT development in the Southeast U.S. For instance, enhanced (Figure 3a,b), as well as earlier (Figure 5a), POPs over the Appalachian Mountains are consistent with preferential heating over sloped surfaces. This POP analysis confirms many previous studies that have documented the role of complex terrain in promoting WFTs [7,20,37,38,39]. When dynamical forcing is weak, east-facing topographic slopes encounter incoming solar radiation at a more orthogonal angle of incidence beginning earlier in the day. Enhanced heating along the Appalachian Mountains promotes parcel buoyancy and increases the likelihood of precipitation in MT environments.
Further, Figure 4 indicates increased POPs over the Atlanta urban area, aligning with a number of previous studies that conclude Atlanta, and other large Southern U.S. cities, are associated with enhanced thunderstorm activity [14,40,41,42,43,44,45,46,47]. In addition to Atlanta, Figure 4b also displays higher POP associated with New Orleans, Louisiana, and a smaller, yet still elevated, local POP maxima near Baton Rouge, Louisiana. However, the POP analysis, shown in Section 3, contextualizes the urban rainfall effect (URE) in a manner not previously attempted in URE research. The simple POP procedure extended over a climatologically meaningful time scale clearly illustrates not only the increase in rainfall magnitude in MT air masses, but the increase in precipitation likelihood as well. In fact, the enhancement in POP (Figure 4) was more clearly evident than the increase in associated rainfall accumulations (Figure 7). A similar framework may be adopted by future studies to measure the URE in other urbanized areas.
4.2. Limitations
One of this study’s novel aspects is its implementation of SSC sites nationwide to understand how POP varies in different locations with similar air masses. However, the polygon assignment procedure explained in Section 2 leads to undesirable visual pattern near polygon boundaries as mentioned at the beginning of Section 3. In addition to causing a visual nuisance, this approach also may unintentionally include (exclude) non-MT (MT) precipitation events at a gridpoint near the periphery of a polygon. While the interpretation of local (i.e., near the SSC site) and broad-scale (i.e., nationwide) MT POP patterns is less impacted, the boundaries do pose problems on intermediate scales. For instance, MT POP in the HOP and RIC polygons (Figure 3) varies sharply from their neighboring polygons. Consequently, it is unclear whether a genuine physical mechanism decreases MT POP in these areas, or if this is simply a methodological artifact that can be refined in future analyses.
An additional source of error in the study arises from the Stage IV MPE. Figure 4b and Figure 7b display seemingly incongruous results, whereby local POP maxima have no associated precipitation maxima. For instance, there is a clear POP maximum northeast of New Orleans exactly coincident with the Weather Surveillance Radar-1988D (WSR-88D) installation in Slidell, Louisiana. However, the mean 24 h MT precipitation for the same area (Figure 7b) does not indicate a rainfall maximum in this high-POP location. Presumably, if thunderstorm cells genuinely formed more frequently near the Slidell WSR-88D, then more precipitation would be measured in this spot as well. This could suggest that despite the rigorous algorithms designed to remove ground clutter [48,49], some nonmeteorological echoes evade the filtering algorithms with shallow echoes from ground clutter contributing trace rainfall estimates when processed into Stage IV MPE. Though these trace amounts are paltry contributions to annual and even daily means (Figure 4b and Figure 7b), they are large enough to be credited as a precipitation area (i.e., >0.25 mm) during the masking procedure detailed in Section 2. Thus, any ground clutter that slips through the Stage IV quality control algorithm disproportionately influences the POP distribution. Alternatively, the concave coastline near the maximum could legitimately lead to colliding sea breezes and higher POP at the radar’s location; however, because the radar can only scan low altitudes in its immediate vicinity, radar-based precipitation estimates don’t capture the fell depth of the precipitation core, leading to lower-than-expected totals. Lastly, because there is less beam averaging near the radar site and the radar beam scans nearer to the surface, the echoes may genuinely reflect shallow, transient meteorological features; however, these lightly precipitating cells are detected with greater efficiency near the radar, whereas only deeper, more mature cells are detected at greater distances from the radar.
This finding holds important implications for urban hydrometeorological studies that often employ radar datasets to characterize the URE. Because (1) WSR-88Ds are frequently located near cities and (2) cities have tall buildings, towers, bridges, etc., radar-based rainfall and thunderstorm analyses may be predisposed to detect more echoes near the city than the surrounding landscape. Ultimately, this systematic detection of echoes nearer to the radar, whether genuine or not, may skew precipitation and thunderstorm climatologies to preferentially indicate a greater frequency near urban areas. Future URE work relying on radar-based products would benefit from carefully scrutinizing radar echoes near the radar site.
5. Summary and Conclusions
Moist tropical air masses are often conducive to convection, particularly during the warm season. When MT air masses are displaced from midtropospheric dynamical forcing, as is often the case for the summertime Southeast U.S., WFTs are the prevailing convective mode due to the unstable, weakly sheared convective environment. Without strong dynamical forcing, secondary influences on convection initiation (landscape characteristics, outflow boundaries, etc.), which often occur beneath the resolution of the observing and modeling systems, become the dominant forcing mechanisms. Despite the well-acknowledged operational forecasting challenge posed by WFT environments, few forecasting tools exist for these settings. The purpose of this study was to develop a CONUS-wide climatological precipitation frequency distribution to provide operational forecasters with a baseline for issuing POP in MT air masses. For the Southeast U.S., this tool holds additional value for the WFT environments that often occur in MT air masses.
POPs are generally higher when MT air masses are present over an area during the warm season. For the Southeast U.S., POP generally increases ~15% compared to the overall warm season value (Figure 3). At 1800 UTC daily, POPs are confined to coastal areas and east-facing ridges; however, by 0000 UTC elevated POPs advance inland and coastal areas experience a reduction in POP after the passage of the seas breeze (Figure 5). The POP analysis also highlights the URE for at least two urban centers (Atlanta and New Orleans) in the Southeast U.S.
This study emphasizes the need for better forecasting tools and climatological analyses of weakly forced environments. Climatologically, ~50% of the warm season (May–September) precipitation in the Southern U.S. occurred in moist tropical environments, yet very little research focuses specifically on these WFT-favorable convective environments. Operationally, POPs were observed to vary on scales smaller than the grid spacing of most global weather models (Figure 4b). An anecdotal case study for July 2016 (Table 1) illustrates how the air-mass-specific POP was nearer to the observed POP than same-day GFS MOS forecasts for New Orleans, Louisiana. Consequently, this study suggests that future research may attempt to incorporate a simple air-mass characterization into MOS downscaling to improve the WFT-associated POP. Future work should also endeavor to improve upon the SSC polygon methodology employed here to create a smoother, more regionally coherent POP distribution.
Supplementary Materials
The following are available online at https://www.mdpi.com/2073-4433/12/2/255/s1, Figure S1: Comparison of convective forecasting parameters between SSC types, Table S1: Comparison of SSC type frequency and convective environmental parameters for Atlanta, GA, USA.
Author Contributions
Conceptualization, P.M. and B.S.; methodology, P.M.; software, C.R. and R.D.; formal analysis, C.R. and R.D.; resources, P.M.; data curation, C.R.; writing—original draft preparation, C.R. and P.M.; writing—review and editing, K.G., B.S., and C.B.; funding acquisition, P.M., K.G., B.S., and C.B. All authors have read and agreed to the published version of the manuscript.
Funding
This research was funded by the University Corporation for Atmospheric Research (UCAR) under the COMET Partners Program.
Data Availability Statement
Publicly available datasets were analyzed in this study. This data can be found here: https://data.eol.ucar.edu/dataset/21.093 (accessed on 13 May 2020).
Acknowledgments
The authors acknowledge William Gallus for editing this Special Issue.
Conflicts of Interest
The authors declare no conflict of interest.
References
- Miller, P.W.; Mote, T.L. Standardizing the definition of a “pulse” thunderstorm. Bull. Am. Meteorol. Soc. 2017, 98, 905–913. [Google Scholar] [CrossRef]
- Byers, H.R.; Braham, R.R. The Thunderstorm: Report of the Thunderstorm Project; US Government Printing Office: Washington, DC, USA, 1949; p. 287. [Google Scholar]
- Cerniglia, C.S.; Snyder, W.R. Development of Warning Criteria for Severe Pulse Thunderstorms in the Northeastern United States Using the WSR-88D; National Weather Service: Albany, NY, USA, 2002; p. 14. [Google Scholar]
- Bruick, Z.S.; Karstens, C. An investigation of local and national NWS warning outbreaks for severe convective events. J. Oper. Meteorol. 2017, 5, 14–25. [Google Scholar] [CrossRef]
- Guillot, E.M.; Smith, T.M.; Lakshmanan, V.; Elmore, K.L.; Burgess, D.W.; Stumpf, G.J. Tornado and severe thunderstorm warning forecast skill and its relationship to storm type. In Proceedings of the International Conference on Interactive Information and Processing Systems for Meteorology and Hydrology, New Orleans, LA, USA, 20–24 January 2008. [Google Scholar]
- Rotunno, R.; Klemp, J.B.; Weisman, M.L. A Theory for Strong, Long-Lived Squall Lines. J. Atmos. Sci. 1988, 45, 463–485. [Google Scholar] [CrossRef]
- Miller, P.W.; Mote, T.L. A climatology of weakly forced and pulse thunderstorms in the Southeast United States. J. Appl. Meteorol. Climatol. 2017, 56, 3017–3033. [Google Scholar] [CrossRef]
- Joslyn, S.; Nadav-Greenberg, L.; Nichols, R.M. Probability of Precipitation: Assessment and Enhancement of End-User Understanding. Bull. Am. Meteorol. Soc. 2009, 90, 185–194. [Google Scholar] [CrossRef]
- NWS. National Weather Service Glossary. Available online: http://w1.weather.gov/glossary/ (accessed on 21 January 2021).
- Stewart, A.E.; Williams, C.A.; Phan, M.D.; Horst, A.L.; Knox, E.D.; Knox, J.A. Through the eyes of the experts: Meteorologists’ perceptions of the probability of precipitation. Weather Forecast. 2016, 31, 5–17. [Google Scholar] [CrossRef]
- Ashley, W.S.; Bentley, M.L.; Stallins, J.A. Urban-induced thunderstorm modification in the Southeast United States. Clim. Chang. 2012, 113, 481–498. [Google Scholar] [CrossRef]
- Bentley, M.L.; Ashley, W.S.; Stallins, J.A. Climatological radar delineation of urban convection for Atlanta, Georgia. Int. J. Climatol. 2010, 30, 1589–1594. [Google Scholar] [CrossRef]
- Bentley, M.L.; Stallins, J.A.; Ashley, W.S. Synoptic environments favourable for urban convection in Atlanta, Georgia. Int. J. Climatol. 2012, 32, 1287–1294. [Google Scholar] [CrossRef]
- Dixon, P.G.; Mote, T.L. Patterns and Causes of Atlanta’s Urban Heat Island Initiated Precipitation. J. Appl. Meteorol. 2003, 42, 1273–1284. [Google Scholar] [CrossRef]
- Haberlie, A.M. Convective Initiation Climatology for the Atlanta, Georgia Region. Master’s Thesis, Northern Illinois University, DeKalb, IL, USA, 2014. [Google Scholar]
- Diffenbaugh, N.S.; Scherer, M.; Trapp, R.J. Robust increases in severe thunderstorm environments in response to greenhouse forcing. Proc. Natl. Acad. Sci. USA 2013, 110, 16361–16366. [Google Scholar] [CrossRef]
- Senkbeil, J.C.; Saunders, M.E.; Taylor, B. Changes in summer weather type frequency in Eastern North America. Ann. Am. Assoc. Geogr. 2017, 1–17. [Google Scholar] [CrossRef]
- Ashley, W.S.; Gilson, C.W. A reassessment of U.S. lightning mortality. Bull. Am. Meteorol. Soc. 2009, 90, 1501–1518. [Google Scholar] [CrossRef]
- Lackmann, G. Midlatitude Synoptic Meteorology, 1st ed.; American Meteorological Society: Boston, MA, USA, 2011; p. 345. [Google Scholar]
- Miller, P.W.; Ellis, A.; Keighton, S. Spatial distribution of lightning associated with low-shear thunderstorm environments in the central Appalachians region. Phys. Geogr. 2015, 36, 127–141. [Google Scholar] [CrossRef]
- Fabry, F.; Meunier, V.; Puigdomènech Treserras, B.; Cournoyer, A.; Nelson, B. On the climatological use of radar data mosaics: Possibilities and challenges. Bull. Am. Meteorol. Soc. 2017, 98, 2135–2148. [Google Scholar] [CrossRef]
- Sheridan, S.C. The redevelopment of a weather-type classification scheme for North America. Int. J. Climatol. 2002, 22, 51–68. [Google Scholar] [CrossRef]
- Hondula, D.M.; Vanos, J.K.; Gosling, S.N. The SSC: A decade of climate–health research and future directions. Int. J. Biometeorol. 2014, 58, 109–120. [Google Scholar] [CrossRef]
- Gultepe, I.; Fernando, H.J.S.; Pardyjak, E.R.; Hoch, S.W.; Silver, Z.; Creegan, E.; Leo, L.S.; Pu, Z.; De Wekker, S.F.J.; Hang, C. An Overview of the MATERHORN Fog Project: Observations and Predictability. Pure Appl. Geophys. 2016, 173, 2983–3010. [Google Scholar] [CrossRef]
- Lin, Y. GCIP/EOP Surface: Precipitation NCEP/EMC 4KM Gridded Data (GRIB) Stage IV Data, Version 1.0. Available online: https://data.eol.ucar.edu/dataset/21.093 (accessed on 15 July 2020).
- Parker, M.D.; Johnson, R.H. Organizational Modes of Midlatitude Mesoscale Convective Systems. Mon. Weather Rev. 2000, 128, 3413–3436. [Google Scholar] [CrossRef]
- Miller, P.W.; Ellis, A.; Keighton, S. A preliminary assessment of using spatiotemporal lightning patterns for a binary classification of thunderstorm mode. Weather Forecast. 2015, 30, 38–56. [Google Scholar] [CrossRef]
- Miller, P.W.; Mote, T.L.; Ramseyer, C.A. An empirical study of the relationship between seasonal precipitation and thermodynamic environment in Puerto Rico. Weather Forecast. 2019, 34, 277–288. [Google Scholar] [CrossRef]
- Houze, R.A.; Smull, B.F.; Dodge, P. Mesoscale Organization of Springtime Rainstorms in Oklahoma. Mon. Weather Rev. 1990, 118, 613–654. [Google Scholar] [CrossRef]
- Rickenbach, T.M.; Ferreira, R.N.; Wells, H. Springtime Onset of Isolated Convection Precipitation across the Southeastern United States: Framework and Regional Evolution. Mon. Weather Rev. 2020, 148, 891–906. [Google Scholar] [CrossRef]
- Markowski, P.; Richardson, Y. Mesoscale Meteorology in Midlatitudes, 1st ed.; Wiley-Blackwell: Hoboken, NJ, USA, 2010; p. 407. [Google Scholar]
- Dallavalle, J.P.; Glahn, B. Totward a Gridded MOS System. In Proceedings of the 21st Conference on Weather Analysis and Forecasting, Silver Spring, MD, USA, 28 July–5 August 2005. [Google Scholar]
- Ferranti, L.; Klinker, E.; Hollingsworth, A.; Hoskins, B.J. Diagnosis of systematic forecast errors dependent on flow pattern. Q. J. R. Meteorol. Soc. 2002, 128, 1623–1640. [Google Scholar] [CrossRef]
- Bhatia, K.T.; Nolan, D.S. Relating the Skill of Tropical Cyclone Intensity Forecasts to the Synoptic Environment. Weather Forecast. 2013, 28, 961–980. [Google Scholar] [CrossRef]
- Zawadzki, I.; Morneau, J.; Laprise, R. Predictability of Precipitation Patterns: An Operational Approach. J. Appl. Meteorol. Climatol. 1994, 33, 1562–1571. [Google Scholar] [CrossRef]
- Rickenbach, T.M.; Nieto-Ferreira, R.; Zarzar, C.; Nelson, B. A seasonal and diurnal climatology of precipitation organization in the southeastern United States. Q. J. R. Meteorol. Soc. 2015, 141, 1938–1956. [Google Scholar] [CrossRef]
- Schaaf, C.L.B.; Banta, R.M.; Wurman, J. Thuderstorm-producing terrain features. Bull. Am. Meteorol. Soc. 1988, 69, 272–277. [Google Scholar] [CrossRef][Green Version]
- Kirshbaum, D.J.; Wang, C.-C. Boundary Layer Updrafts Driven by Airflow over Heated Terrain. J. Atmos. Sci. 2013, 71, 1425–1442. [Google Scholar] [CrossRef]
- Kuo, J.-T.; Orville, H.D. A radar climatology of summertime convective clouds in the Black Hills. J. Appl. Meteorol. 1973, 12, 359–368. [Google Scholar] [CrossRef]
- Haberlie, A.M.; Ashley, W.S.; Pingel, T.J. The effect of urbanisation on the climatology of thunderstorm initiation. Q. J. R. Meteorol. Soc. 2015, 141, 663–675. [Google Scholar] [CrossRef]
- McLeod, J.; Shepherd, M.; Konrad, C.E. Spatio-temporal rainfall patterns around Atlanta, Georgia and possible relationships to urban land cover. Urban Clim. 2017, 21, 27–42. [Google Scholar] [CrossRef]
- Shem, W.; Shepherd, M. On the impact of urbanization on summertime thunderstorms in Atlanta: Two numerical model case studies. Atmos. Res. 2009, 92, 172–189. [Google Scholar] [CrossRef]
- Niyogi, D.; Pyle, P.; Lei, M.; Arya, S.P.; Kishtawal, C.M.; Shepherd, M.; Chen, F.; Wolfe, B. Urban modification of thunderstorms: An observational storm climatology and model sase study for the Indianapolis urban region. J. Appl. Meteorol. Climatol. 2010, 50, 1129–1144. [Google Scholar] [CrossRef]
- Shepherd, J.M.; Pierce, H.; Negri, A.J. Rainfall Modification by Major Urban Areas: Observations from Spaceborne Rain Radar on the TRMM Satellite. J. Appl. Meteorol. 2002, 41, 689–701. [Google Scholar] [CrossRef]
- Huff, F.A.; Changnon, S.A. Precipitation Modification by Major Urban Areas. Bull. Am. Meteorol. Soc. 1973, 54, 1220–1233. [Google Scholar] [CrossRef]
- Debbage, N.; Shepherd, J.M. Urban Influences on the Spatiotemporal Characteristics of Runoff and Precipitation during the 2009 Atlanta Flood. J. Hydrometeorol. 2019, 20, 3–21. [Google Scholar] [CrossRef]
- Mote, T.L.; Lacke, M.C.; Shepherd, J.M. Radar signatures of the urban effect on precipitation distribution: A case study for Atlanta, Georgia. Geophys. Res. Lett. 2007, 34. [Google Scholar] [CrossRef]
- Hubbert, J.C.; Dixon, M.; Ellis, S.M.; Meymaris, G. Weather Radar Ground Clutter. Part I: Identification, Modeling, and Simulation. J. Atmos. Ocean. Technol. 2009, 26, 1165–1180. [Google Scholar] [CrossRef]
- Hubbert, J.C.; Dixon, M.; Ellis, S.M. Weather Radar Ground Clutter. Part II: Real-Time Identification and Filtering. J. Atmos. Ocean. Technol. 2009, 26, 1181–1197. [Google Scholar] [CrossRef]
Publisher’s Note: MDPI stays neutral with regard to jurisdictional claims in published maps and institutional affiliations. |
© 2021 by the authors. Licensee MDPI, Basel, Switzerland. This article is an open access article distributed under the terms and conditions of the Creative Commons Attribution (CC BY) license (http://creativecommons.org/licenses/by/4.0/).