Abstract
Dust emission from the Gobi desert is one of the major sources of global atmospheric aerosols. However, the main factors affecting dust emission from Gobi remain poorly understood. In this paper, field wind tunnel experiments were performed atop the Mogao Grottoes to determine the variation characteristics of the vertical dust flux (F) of particulate matter less than 10 μm (PM10) for Gobi surfaces with different dust content and wind speeds under external sand supply. The results demonstrate that F obeyed a power function with increasing friction velocity (), and increased exponentially with the increasing surface dust content (C). The index of n-value in the formula F∝ is taken in the range of 2.02–2.63 under the surface of 27.3–47.3% dust content (<100 µm), and the dust emission rate was significantly enhanced when the surface dust content exceeded approximately 37%. This study indicates that wind force is the primary dynamic condition affecting Gobi dust emission, and that surface dust content is a significant factor in determining the quantity of dust emission. Furthermore, the contribution of wind force to PM10 emission is greater than the surface dust content, and the higher the height, the greater the weight of friction velocity.
1. Introduction
Gobi is a desert landscape covered with gravel and mainly distributed in arid regions of Northwest China and Southern Mongolia. In addition, it covers an area of 72 × 104 km2 in China, which is comparable with the area of desert [,]. This type of surface is also known as gibber plains or stony mantles in Australia, and as desert pavements in the USA []. Gobi is mostly distributed in strong wind areas with high intensity of sand transport. Therefore, it is an important potential source of global dust emission [,].
The effect of wind force and surface dust content on dust flux is one of the critical unresolved issues in aeolian sand physics []. Numerous previous studies on the process of dust emission have been conducted, particularly for agricultural fields and deserts [,,], whereas less attention has been paid to the process of dust emission for Gobi surfaces. Recently, the role of wind force and the characteristics of surface fine particles in dust emission from Gobi have become a focal point in aeolian research, and the overall knowledge base regarding dust emission from the Gobi has been strengthened [,]. Hidy and Brock [] identified that dust emission caused by wind force could account for 21% of all the total atmospheric aerosols, and that this percentage was increasing over the years. Wang et al. [] revealed through wind tunnel experiments that Gobi dust emission was mainly dominated by the abundance of particulate matter <50 µm (PM50), and that the total sand transport quantity over Gobi at a high wind speed of 22 m·s−1 was close to 700 g·m−2, of which 26 g·m−2 was PM50. Zhang et al. [] revealed that PM10 and PM63 emissions were highest in the loose textured gravel layer with emission rates of 1.1 × 10⁻³ kg·m−1·day−1 and 10.2 × 10⁻³ kg·m−1·day−1, respectively, and that PM10 dust emission rates on the non-crusted Gobi surface were approximately three times greater than those for the crusted one. Gillette et al. [,] concluded that dust emission depended mainly on wind velocity, soil texture, and particulate matter <100 µm content, and that dust particles smaller than 20 µm at the surface were highly susceptible to long-range transport and were the prime cause of reduced visibility in dust storms. However, some researchers pointed out that dust emission tended to decrease with an increase of surface clay content [,], primarily since inter-particle cohesive forces increase the dust content due to soil moisture, and the surface tends to form crusts to restrain dust emission []. Soil moisture can affect the adhesion between soil particles and consequently the threshold friction velocity of soil particles. The moisture in the surface material produces adhesive forces between the particles as well as capillary forces through capillary action, which increase the adhesion forces between the particles, requiring a greater wind speed for levitating the particles [].
Fine-grained material carried by wind activity on the Gobi surface is not only an essential source of dust emission, but also a principal surface bombardment medium []. The Gobi in Northwest China usually has deep clay and silt-sand layers developed under the Gobi gravel deposit. In addition, the source of fine material is mainly efflorescence and aeolian erosion of rocks adjacent to the mountains and Gobi surface material. Of this fine-grained material, 20–50% is less than 63 µm, which is the primary source of aerosol particles []. However, the substratum clay content of the Gobi surface has high spatial variability, which can account for 5–99% of the total surface soil content for different Gobi regions [,]. This is one of the main factors contributing to the differences in dust emission mechanisms. Moreover, previous studies on vertical fluxes of Gobi with different dust contents are limited. Therefore, this paper focuses on the variation characteristics of dust emission under different dust content conditions (particle size < 100 µm), and the main purpose is to further perfect the dust emission mechanism of Gobi under different surface properties.
In addition, dust emission is usually determined by multiple variables. However, previous studies mostly focused on the dynamic process of dust emission from a single factor, such as the relationship between the PM10 concentration and friction velocity or between soil grain size distribution and dust emission rate [,,]. Therefore, the joint influence of wind force and dust content on dust emission and which factor plays the dominant role in this process remain poorly understood.
This paper investigates the dust emission characteristics of Gobi surfaces with various dust contents under different friction velocities under a constant sand supply. Then, the contribution of wind force and surface dust content to dust release is evaluated using the multiple regression analysis. The ultimate purpose of this study is to provide a theoretical basis for dust hazards control in the Mogao Grottoes.
2. Materials and Methods
2.1. Study Area
The Mogao Grottoes, located approximately 25 km southeast of Dunhuang City, were built on the south-north-oriented steep cliff, which is approximately 1680 m long with a relative height of 10–45 m on the west bank of the Daquan River []. They border Sanwei Mountain to the east and Mingsha Mountain to the west, which is a huge and complex megadune located atop the grottoes, and is the main sand source threatening the grottoes. The landforms on the top surface of the Mogao Grottoes consist of four types, namely: Sandy Gobi, gravel Gobi, flat sand sheets, and megadunes. The research area was situated on the flat sandy Gobi surface atop the grottoes (Figure 1).
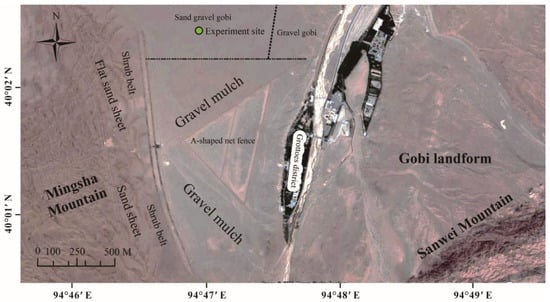
Figure 1.
Location map and different aeolian landforms on top of the Mogao Grottoes (from Google Earth).
The annual average temperature in the Mogao Grottoes is 10.6 °C, while the highest temperature can reach 43 °C, and it has a large variability in daily temperature range. In the study area, the average annual precipitation is only 23.23 mm, but the average annual evaporation is over 4000 mm. In addition, the maximum values are concentrated in the summer months of June to August []. The research area has multiple wind directions: The most frequent are south, northwest, and northeast, with an annual average wind speed of 4.3 m·s−1. The gravel coverage of sandy Gobi is in the range of 30~50% and the contents of coarse sand, medium sand, fine sand, and extremely fine sand are 10.5, 4.7, 24.6, and 34.4%, respectively, of which the content of dust less than 100 μm is more than 20% []. Dust storms in the Mogao Grottoes are common (Figure 2). Despite the fact that the Mogao Grottoes are the world’s largest preserved Buddhist art site and a masterpiece of human grottoes culture, the Mogao Grottoes suffer from serious dust hazards, which constitute a major environmental problem. The dust fall particle size is mainly concentrated in the range of 5–50 μm, and the monthly average dust fall mass is 30.45 t·km−2·month−1 []. Dust particles that fall on the mural layer not only degrade its artistic quality, but also make the murals fade. In addition, the serious accumulation will induce the pigment layer and white powder layer of the murals to peel off on a large scale.
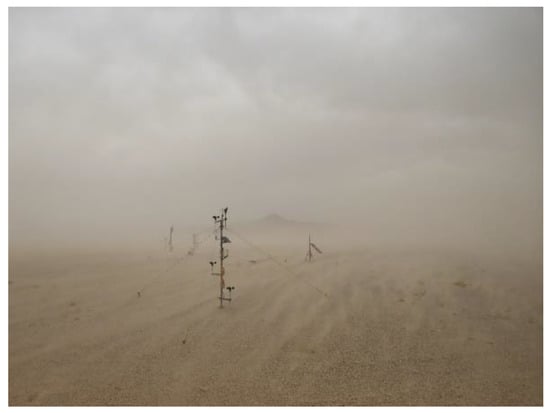
Figure 2.
A dust storm occurred atop the Mogao Grottoes on 28 May 2020.
2.2. Experimental Methods
Wind tunnel experiments were performed on the sandy Gobi atop the Mogao Grottoes (Figure 3a). The wind tunnel has a total length of 11.4 m, the length of the working section was 6 m, and the cross-section area was 0.6 × 0.6 m (inner wall size) [,]. The wind speed of the wind tunnel could be continuously adjusted between 0 and 16 m·s−1. The depth of the boundary layer in the wind tunnel was approximately 20 cm.
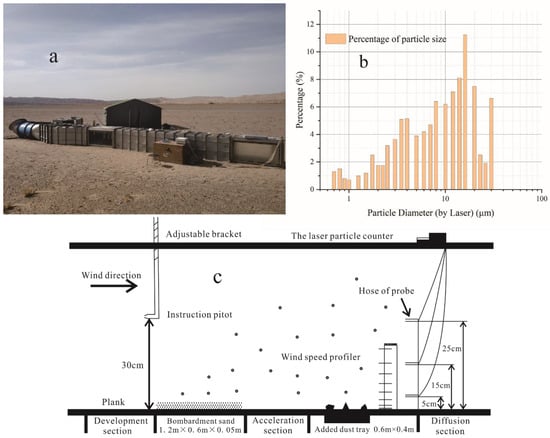
Figure 3.
Field wind tunnel (a), particle size distribution of the clay soil (b), and the experimental layout (c).
The experiments were conducted on a five-plywood board under sand supply. Three dust aerosol probe hoses with heights of 5, 15, and 25 cm were connected to an American Handheld 3016 laser particle counter, which was installed at the end of the working section and was used to measure the PM10 concentrations. The particle monitoring size range of the counter was 0.3–25 µm, and it was an inhaler type with a flow rate of 2.83 L·min−1. The measurement time interval was set at 10 s. A wind speed profiler composed of nine pitot tubes of different heights (0.5, 0.9, 1.5, 2.2, 4.3, 8.3, 12.3, 16.3, and 20.2 cm) was used to measure the wind profile, and each pitot tube was calibrated using a standard one before use. A pitot tube was installed in front of the experiment bed and at 30 cm above the bed to measure the centerline inlet wind speed. The dune sand for sand supply was cleaned with water and dried before use as a source of bombarding sand to minimize the external dust influence. The sand bed was 1.2 m long and 0.05 m thick. The tested Gobi was placed in a tray with dimensions 0.6 × 0.4 × 0.04 m, which was placed at the end of the working section. The original Gobi dust content of 27.3% was obtained by sieving the original Gobi soil through a 155-mesh sieve (for particle size <100 µm). The other Gobi quadrats with different dust contents were obtained by adding the powder of clay-crusted soils with mass proportions of 5, 10, 15, and 20% to the original Gobi sample, with the corresponding dust contents as 32.3, 37.3, 42.3, and 47.3%, respectively. The added dust soil was less than 40 µm, with a median particle size of 9.12 µm, and particles smaller than 10 µm accounted for approximately 52.5% (Figure 3b). The gravel coverage and hardness for all of the tested Gobi surfaces with different dust contents were consistent with the original sandy Gobi atop the Mogao Grottoes. Experimental wind velocities were 8, 10, 12, and 15 m·s−1. The length of each experiment was 3 min. The experimental layout is presented in Figure 3c.
2.3. Data Processing
In a neutral stratified atmosphere, the wind profile above the uniform surfaces obeys the ‘‘law of wall’’ represented by Equation []:
where is the wind speed at height z; is the friction velocity (m·s−1); is the von Karman constant (0.4); and is the aerodynamic roughness length.
The vertical dust flux emitted by the Gobi surface was calculated by the following Equation [,]:
where F is the vertical dust flux (µg·m−2·s−1); , are the heights of the two monitoring points (m); is the friction velocity; is the average height of the measurement points (m); and are the dust concentrations at heights , (µg·m−3), respectively; and is the von Karman constant (0.4). The measured PM10 dust concentrations at heights of 5 and 15 cm were used to calculate the vertical dust flux.
3. Results
3.1. Relationship between and for Gobi with Different Dust Contents
The results show that F increased with the increasing for Gobi surfaces with different dust contents following a power function:
where and are regression coefficients, and their values and the coefficient of determination R2 are shown in Table 1. The value of the coefficient in Equation (3) increased from 4599.97 to 14,372.43 as the dust content increased from 27.3% to 47.3%. Meanwhile, the values of increased from 2.21 for the original Gobi surface to 2.63 for Gobi with a dust content of 47.3%, indicating that the higher the surface dust content, the greater the rate of dust emission.

Table 1.
Regression coefficients in Equation (3).
As shown in Figure 4, F increased at different rates for the same increase in under different dust content conditions. When was less than 0.68 m·s−1, F increased slowly with an increase in , whereas when was greater than 0.68 m·s−1, the increase rate of F with increased rapidly. For instance, as the Gobi dust content was 47.3%, F increased from 2121.45 to 4267.29 µg·m−2·s−1/(m·s−1) when increased from 0.37 to 0.68 m·s−1, while it increased from 9262.99 to 17,157.31 µg·m−2·s−1/(m·s−1) as increased from 0.83 to 1.07 m·s−1. With increases in wind speed, the energy of saltation particles and the impact energy on the surface both increased, causing the amount of dust released per unit time to increase. It was previously shown that sand bombardment at high wind velocities can degrade the surface crust and increase the availability of dust under the gravel surface [,,]. Therefore, the saltation sand particles can continuously update the surface in order for the vertical dust flux to remain high. As a result, wind force and the bombardment of saltation particles are important dynamic conditions that determine dust emission. In addition, saltation bombardment is more capable of triggering dust emission under higher wind speed conditions.
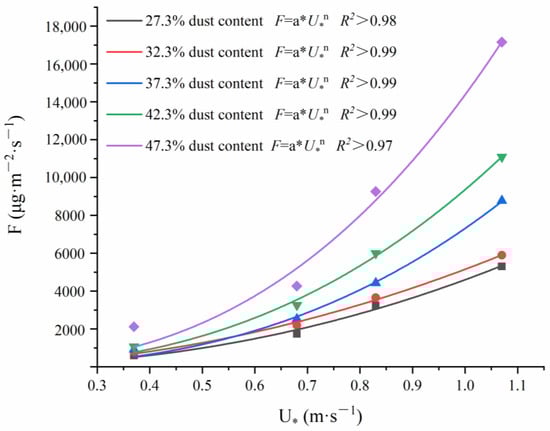
Figure 4.
Variation of F with under different Gobi dust content conditions.
3.2. Relationship between F and Gobi Dust Content (C)
The results indicate that F increased exponentially with the surface dust content (C) and satisfied the following equation:
where C is the dust content of the Gobi surface; and are the regression coefficients, whose values and R2 are shown in Table 2.
Table 2.
Regression coefficients in Equation (4).
Figure 5a reveals that under 10 m·s−1, F increased slowly as C increased from 27.3 to 37.3%, and when the surface dust content increased from 37.3 to 47.3%, F increased by 3.55 and 7.2 times, respectively. Additionally, F increased by one order of magnitude when C increased from 27.3 to 47.3%. The rate of increase in F becomes larger with the increasing wind speed at 27.3–37.3% dust content. For instance, under 12 and 15 m·s−1 conditions, when the surface dust content increased from 27.3 to 37.3%, F increased by 1.36 and 1.65 times, respectively (Figure 5b,c). At the identical wind speed, the growth rate of F from 37.3 to 47.3% was significantly greater than what was seen from 27.3 to 37.3%. Therefore, the surface dust content is also one of the main factors that determines the dust emission intensity, and the vertical dust flux increases rapidly when the surface dust content exceeds 37.3%. This is consistent with the results of Chepil et al. [], who demonstrated that dust emission rates caused by wind erosion were significantly enhanced when the surface clay content exceeded 30%.
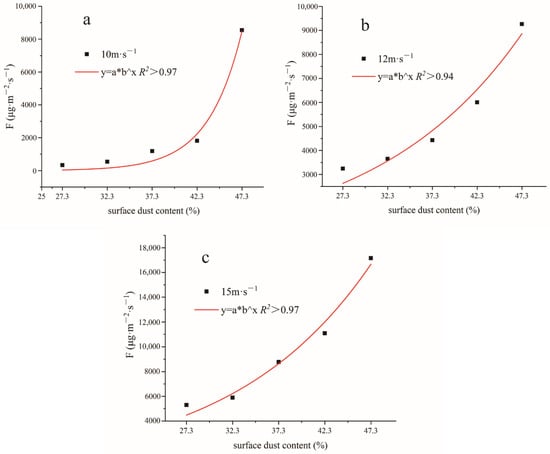
Figure 5.
Variation of F with dust contents under different experimental wind velocities. (a) U = 10 m·s−1, (b) U = 12 m·s−1, (c) U = 15 m·s−1.
The previous finding is mainly related to the threshold of the stationary and adsorption capacities of sand particles and aggregates for dust. Studies have shown that sand grains and aggregates in the soil can effectively adsorb dust smaller than 80 µm, and that the inter-particle cohesion plays a major role [,]. However, with gradual increases in dust content, the adsorption capacity of soil for dust gradually reaches saturation, resulting in the remaining dust existing mainly in fugitive form on the surface. Therefore, the dust emission rate increases with an increase in the dust content. It has been pointed out that the threshold wind velocity of sand particles mainly depends on the median particle size of the soil []. Therefore, the median particle size of the surface gradually decreases with an increase of dust content, which gradually decreases the threshold wind velocity of dust, resulting in a significant increase in dust emission rates when the dust content of the surface reaches about 37%.
4. Discussion
Frictional velocity () is one of the most important parameters in aeolian research [,]. Compared with wind velocity, determines the magnitude of the wind shear force on the surface, reflecting the resistance of the surface to the wind. Most of the research on dust emission flux selects friction velocity as the characteristic quantity [,]. Therefore, friction velocity is more consistent with the description of the intrinsic mechanism of dust emission. This study demonstrates that the vertical dust flux (F) obeys a power function with increasing , and that C increases from 27.3 to 47.3% with an exponent n that takes values in the range of 2.02–2.63. However, the value of exponent in the F∝ equation is non-uniform in the literature. Gillette and Passi [] suggested a value of 4 for , while Shao et al. [] suggested a value of 3 for dust emission from sandy surfaces. Shen et al. [] concluded that F was positively related to 2 on the Gobi surface. In comparison, we found that the n-value under the original Gobi surface conditions (C = 27.3%) is closest to the value found in the study of Shen et al. (2003). However, with increases in C, the n-value gradually tends to be closer to the sandy surface revealed by Shao (1993). This is primarily related to the properties of the surface. Although the clay content of the Gobi is greater than the sand surface [], the overlying gravel can absorb part of the wind momentum and protect the surface from erosion, reducing the shear stress of the wind on the ground []. Therefore, the n-value of the Gobi under the original conditions is less than the sand surface. As a result, as the dust content of the surface increases and the relative humidity of the soil remains unchanged, the dust emission rate increases accordingly, resulting in the n-value of the Gobi approaching the sand surface. This experiment complements the variation characteristics of the exponent n of Gobi under different dust content conditions.
In addition, related studies suggest that dust emission flux is a power function, a linear or logarithmic relationship with the intensity of wind-sand flow [,,]. Therefore, for different surface properties, especially the diversity of soil dust contents and the abundance of saltation sand particles, the values of the exponent have a large dispersion, which leads to a variation of F with .
Wind force is the primary dynamic factor influencing Gobi dust emission. In addition, surface dust content (C) is a significant factor in determining the quantity of dust emission. Under higher friction velocity (>0.68 m·s−1), the effectiveness of wind force on dust emission is more noticeable. F increased slowly with an increase in when was less than 0.68 m·s−1, while as is greater than 0.68 m·s−1, the increase rate of F rose rapidly. The higher the wind speed, the higher the kinetic energy of saltating sand impinging on the surface. Under constant sand supply, saltating sand bombardment is the most important dynamic mechanism for dust emission. In contrast, at lower friction velocities, the influence of the Gobi surface dust content on dust emission is more obvious. For instance, under of 0.37 m·s−1, the concentration of PM10 at 15 cm for Gobi with a dust content of 47.3% was 2.37 times than the Gobi with a dust content of 32.3%. However, as increased to 1.07 m·s−1, the concentration of PM10 at 15 cm for Gobi with a dust content of 47.3% decreased to 2.09 times the Gobi surface with a dust content of 32.3%. Therefore, at low wind speeds, the contribution of surface dust abundance to dust emission may be greater than the wind speed.
In order to determine the weight of the contribution of wind force and dust content on the dust emission process, multiple regression analysis was performed. The procedure for the multiple regression analysis is provided in the Supplementary Materials. and C were treated as independent variables and the PM10 concentrations of 15 and 25 cm were the dependent variables. The following regression equation was obtained:
The coefficients before each variable in Equations (5) and (6) represent the weight accounted for by this factor. It is noteworthy that the friction velocity is more weighted to the PM10 concentration than the surface dust content. The weight of increased from 0.71 to 0.83, while the weight of C decreased from 0.58 to 0.37 as elevation enhanced from 15 to 25 cm. Therefore, with an increase of elevation, the weighting factor accounted for by friction velocity gradually increases, and the contribution of surface dust content tends to decrease. This is the reason the Gobi PM10 concentration follows a power function relationship with frictional velocity very well. However, the difference between the weighting coefficients of and C at 15 cm is small (0.123), indicating that the effect of and C on the PM10 concentration is comparable. This is the reason that the closer to the surface, the greater the viscosity of surface airflow due to the influence of surface roughness. It has been confirmed that a low turbulence layer exists 1 cm from the boundary layer [,]. Therefore, the air pressure difference generated by the turbulence near the surface is weak for dust particle uplift. At the same time, the bombardment of saltating sand particles can reduce the surface hardness and cause crust degradation, which in turn increases the availability of dust under the gravel and makes the weight of C relatively larger. On the contrary, as the height increases, the influence of gravels on the airflow is gradually weakened, and the increase in wind speed and turbulence in the upper levels enhances the ground-air momentum exchange [,]. As a result, the weight of the influence of on the dust concentration increases, comparatively, as the elevation increases.
To further verify the credibility of the regression equation, we compared the theoretical value (based on Equation (5)) of with the measured value. The values of R2 were all larger than 0.97, indicating that the regression equation has a high confidence (Figure 6). This analysis method can predict the Gobi dust concentration at different heights based on the surface dust content and frictional wind velocity, providing ideas for future research into the dominant mechanism of dust emission and dust source identification in the Gobi region.
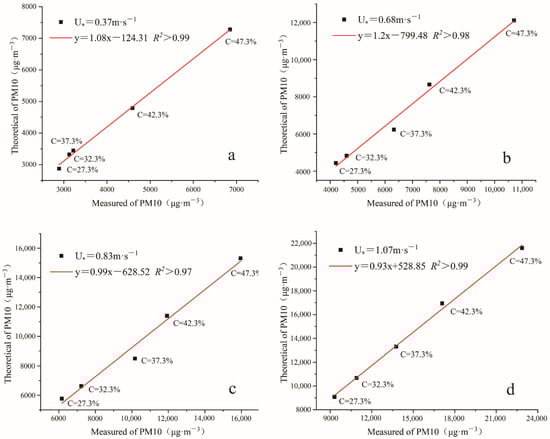
Figure 6.
Correlation of measured and theoretical values of PM10 concentration under different wind velocities and surface dust contents. (a) = 0.37 m·s−1, (b) = 0.68 m·s−1, (c) = 0.83 m·s−1, (d) = 1.07 m·s−1.
Although many studies have been performed on Gobi dust emission, it remains unclear exactly which factors cause the variations in dust emission patterns and the frequent occurrence of dust storms over the Gobi. In recent years, studies have shown that environmental variables such as vertical airflow provide an essential function to the Gobi dust emission mechanism. A numerical simulation demonstrated that, when the ground air temperature difference increases by 40 K, the vertical wind speed can increase 5-fold and can reach 1.5 m·s−1. At the same time, the vertical airflow causes the saltation height to increase by 55% and the saltation trajectory to increase by 74%, making the sand transport rate increase by 3- to 4-fold, which ultimately leads to an increase in the dust emission efficiency [,]. Therefore, revealing the dynamic environmental mechanisms of Gobi dust emission through quantitative analysis, and constructing a dust emission model with dynamic environmental properties represent important future research directions.
5. Conclusions
Wind tunnel experiments on the dust emission characteristics of Gobi surfaces with various dust contents under sand saltation bombardment were performed atop the Mogao Grottoes, and the following conclusions were drawn:
- (1)
- Wind force is the primary dynamic mechanism responsible for dust emission. The vertical dust flux F increases as a power function with the increasing under C of 27.3–47.3%. In addition, the power exponents range from 2.21 to 2.63, which increase with the surface dust content increase, resulting in the comparable n-value of the Gobi with the sand surface.
- (2)
- The surface dust content is an important factor in determining dust emission intensity. Under the same wind speed conditions, F increases exponentially with increases in surface dust content, and the vertical dust flux is significantly enhanced when the surface dust content reaches approximately 37%.
- (3)
- In near-surface conditions, friction velocity is more heavily weighed to the PM10 concentration than the surface dust content, according to the multiple regression analysis. In addition, with the increasing elevation, the weight coefficient of the friction velocity gradually increases.
Supplementary Materials
The following are available online at https://www.mdpi.com/article/10.3390/atmos12111498/s1, Figure S1: Normal probability distribution of standardized residuals of PM10 concentration at 15 cm height.
Author Contributions
Conceptualization, W.Z. and L.T.; methodology, L.L.; software, L.L.; validation, W.Z.; formal analysis, S.C.; investigation, W.Z. and L.T.; resources, W.Z.; data curation, L.L.; writing—original draft preparation, L.L.; writing—review and editing, W.Z. and L.T.; visualization, L.L.; supervision, W.Z., L.T., and S.C.; project administration, W.Z.; funding acquisition, W.Z. All authors have read and agreed to the published version of the manuscript.
Funding
This research was funded by the National Natural Science Foundation of China, grant number 41871018.
Institutional Review Board Statement
Not applicable.
Informed Consent Statement
Not applicable.
Data Availability Statement
Data of the concentrations of PM10 and wind velocity are available from the corresponding author on request.
Acknowledgments
We thank Guobin Zhang, Fei Qiu, Hongtao Zhan, Shuanghu Lin, and Rui Li for their help with the field wind tunnel experiments. The authors would also like to acknowledge the editors and anonymous reviewers, who contributed immensely in improving the quality of this publication.
Conflicts of Interest
The authors declare no conflict of interest.
References
- Zhang, W.; Tan, L.; Zhang, G.; Qiu, F.; Zhan, H. Aeolian processes over gravel beds: Field wind tunnel simulation and its application atop the Mogao Grottoes, China. Aeolian Res. 2014, 15, 335–344. [Google Scholar] [CrossRef]
- Zhang, Z.C.; Pan, K.J.; Liang, A.M.; Dong, Z.B.; Li, X.C. Progress on Process and Mechanism of Sand and Dust Emission on Gobi. Adv. Earth Sci. 2019, 34, 891–900. (In Chinese) [Google Scholar] [CrossRef]
- Wang, X.; Xia, D.; Wang, T.; Xue, X.; Li, J. Dust sources in arid and semiarid China and southern Mongolia: Impacts of geomorphological setting and surface materials. Geomorphology 2008, 97, 583–600. [Google Scholar] [CrossRef]
- Zhang, Z.; Dong, Z.; Li, J.; Qian, G.; Jiang, C. Implications of surface properties for dust emission from gravel deserts (gobis) in the Hexi Corridor. Geoderma 2016, 268, 69–77. [Google Scholar] [CrossRef]
- Kok, J.F.; Parteli, E.J.R.; Michaels, T.I.; Karam, D.B. The physics of wind-blown sand and dust. Rep. Prog. Phys. 2012, 75, 106901. [Google Scholar] [CrossRef] [PubMed] [Green Version]
- Bullard, J.E.; McTainsh, G.H.; Pudmenzky, C. Aeolian abrasion and modes of fine particle production from natural red dune sands: An experimental study. Sedimentology 2004, 51, 1103–1125. [Google Scholar] [CrossRef]
- Funk, R.; Reuter, H.I.; Hoffmann, C.; Engel, W.; Öttl, D. Effect of moisture on fine dust emission from tillage operations on agricultural soils. Earth Surf. Process. Landf. 2008, 33, 1851–1863. [Google Scholar] [CrossRef]
- Lin, X.; Niu, J.; Yu, X.; Berndtsson, R.; Wu, S.; Xie, S. Maize residue effects on PM2.5, PM10, and dust emission from agricultural land. Soil Tillage Res. 2021, 205, 104738. [Google Scholar] [CrossRef]
- Wang, R.-D.; Li, Q.; Zhang, C.-L.; Wang, Z.-T.; Guo, Z.-L.; Chang, C.-P.; Li, J.-F. Comparison of dust emission ability of sand desert, gravel desert (Gobi), and farmland in northern China. Catena 2021, 201, 105215. [Google Scholar] [CrossRef]
- Wang, X.; Zhang, C. Field observations of sand flux and dust emission above a gobi desert surface. J. Soils Sediments 2021, 21, 1815–1825. [Google Scholar] [CrossRef]
- Hidy, G.; Brock, J. An assessment of the global sources of tropospheric aerosols. Proc. Second. Int. Clean Air Congr. 1971, 71, 1088–1097. [Google Scholar]
- Wang, X.; Lang, L.; Hua, T.; Wang, H.; Zhang, C.; Wang, Z. Characteristics of the Gobi desert and their significance for dust emissions in the Ala Shan Plateau (Central Asia): An experimental study. J. Arid. Environ. 2012, 81, 35–46. [Google Scholar] [CrossRef]
- Zhang, Z.; Dong, Z.; Qian, G.; Wu, G.; Cui, X. An Investigation into the Processes and Quantity of Dust Emissions over Gravel and Sand Deserts in North-Western China. Bound.-Layer Meteorol. 2017, 163, 523–535. [Google Scholar] [CrossRef]
- Gillette, D.A. On the production of soil wind erosion aerosols having the potential for long range transport. J. Rech. Atmos. 1974, 8, 735–744. [Google Scholar]
- McTainsh, G.; Lynch, A.; Burgess, R. Wind erosion in eastern Australia. Soil Res. 1990, 28, 323–339. [Google Scholar] [CrossRef]
- Shao, Y.; Raupach, M.R.; Findlater, P.A. Effect of saltation bombardment on the entrainment of dust by wind. J. Geophys. Res. Space Phys. 1993, 98, 12719–12726. [Google Scholar] [CrossRef] [Green Version]
- Gillette, D. A wind tunnel simulation of the erosion of soil: Effect of soil texture, sandblasting, wind speed, and soil consolidation on dust production. Atmos. Environ. 1978, 12, 1735–1743. [Google Scholar] [CrossRef]
- Huang, N.; Gu, Y.D. Review of the mechanism of dust emission and deposition. Adv. Earth Sci. 2009, 24, 1175–1184. (In Chinese) [Google Scholar] [CrossRef]
- Afshar-Mohajer, N.; Torkian, A. Diffuse Emissions of Particles from Iron Ore Piles by Wind Erosion. Environ. Eng. Sci. 2011, 28, 333–339. [Google Scholar] [CrossRef]
- Wang, X.; Dong, Z.; Yan, P.; Yang, Z.; Hu, Z. Surface sample collection and dust source analysis in northwestern China. Catena 2005, 59, 35–53. [Google Scholar] [CrossRef]
- Rubinstein, A.; Ben-Hur, M.; Katra, I. Dust Emission Thresholds in Loess Soil Under Different Saltation Fluxes. Appl. Sci. 2020, 10, 5949. [Google Scholar] [CrossRef]
- Shen, Y.; Zhang, C.; Wang, R.; Wang, X.; Cen, S.; Li, Q. Spatial heterogeneity of surface sediment grain size and aeolian activity in the gobi desert region of northwest China. Catena 2020, 188, 104469. [Google Scholar] [CrossRef]
- Tan, L.H. Aeolian Sand/Dust Flux over Near-Surface Gobi: A Case Study Atop the Mogao Grottoes. Ph.D. Thesis, University of Chinese Academy of Sciences, Beijing, China, 2015. (In Chinese). [Google Scholar]
- Zhang, N.; Kang, Y.Q. Investigation and study of background values of natural atmospheric dustfall in Gansu Province. Gansu Environ. Study Monit. 1999, 12, 69–73. (In Chinese) [Google Scholar]
- Tan, L.; Zhang, W.; Qu, J.; Zhang, K.; An, Z.; Wang, X. Aeolian sand transport over gobi with different gravel coverages under limited sand supply: A mobile wind tunnel investigation. Aeolian Res. 2013, 11, 67–74. [Google Scholar] [CrossRef]
- Karman, T.V. Mechanische Ahnlichkeit und Turbulenz. Math.-Phys. Kl. 1930, 1930, 58–76. [Google Scholar]
- Zhang, J.; Teng, Z.; Huang, N.; Guo, L.; Shao, Y. Surface renewal as a significant mechanism for dust emission. Atmos. Chem. Phys. Discuss. 2016, 16, 15517–15528. [Google Scholar] [CrossRef] [Green Version]
- Rajot, J.L.; Alfaro, S.; Gomes, L.; Gaudichet, A. Soil crusting on sandy soils and its influence on wind erosion. Catena 2003, 53, 1–16. [Google Scholar] [CrossRef]
- Rice, M.A.; McEwan, I.K. Crust strength: A wind tunnel study of the effect of impact by saltating particles on cohesive soil surfaces. Earth Surf. Process. Landf. 2001, 26, 721–733. [Google Scholar] [CrossRef]
- Klose, M.; Gill, T.E.; Etyemezian, V.; Nikolich, G.; Zadeh, Z.G.; Webb, N.; Van Pelt, R.S. Dust emission from crusted surfaces: Insights from field measurements and modelling. Aeolian Res. 2019, 40, 1–14. [Google Scholar] [CrossRef]
- Chepil, W.; Woodruff, N. The Physics of Wind Erosion and its Control. Adv. Agron. 1963, 15, 211–302. [Google Scholar] [CrossRef]
- Bagnold, R.A. The Physics of Blown Sand and Desert Dunes; Springer: Dordrecht, The Netherlands, 1942. [Google Scholar]
- Dong, Z.B.; Qian, G.Q. A review on effect of soil moisture on wind erosion threshold velocity. Acta Pedol. Sin. 2007, 5, 934–942. (In Chinese) [Google Scholar] [CrossRef]
- Zhang, C.L.; Song, C.Q.; Wang, Z.T.; Zou, X.Y.; Wang, X.S. Review and prospect of the study on soil wind erosion process. Adv. Earth Sci. 2018, 33, 27–41. [Google Scholar] [CrossRef]
- Wang, R.D.; Li, Q.; Chang, C.P.; Guo, Z.L.; Li, J.F.; Zhang, C.L.; Zou, X.Y.; Wu, Y.S. Review of field measurement technologies in soil wind erosion. J. Desert. Res. 2019, 39, 16–32. [Google Scholar] [CrossRef]
- Shao, Y. Physics and Modelling of Wind Erosion; Springer Science & Business Media: Dordrecht, The Netherlands, 2009; pp. 145–192. [Google Scholar]
- Gillette, D.A.; Passi, R. Modeling dust emission caused by wind erosion. J. Geophys. Res. Space Phys. 1988, 93, 14233–14242. [Google Scholar] [CrossRef] [Green Version]
- Shen, Z.B.; Shen, Y.B.; Du, M.Y.; Wang, W.-F. Observational result of dust emission rate over sand surface of Gobi desert during dust storm. Plateau Meteor. 2003, 22, 545–550. (In Chinese) [Google Scholar]
- Tan, L.H.; Zhang, W.M.; Qu, J.J.; Yin, D.Y.; An, Z.S.; Bian, K. Quantitative simulation of erosion rates of Gobi, with different gravel coverages. J. Desert. Res. 2016, 36, 581–588. (In Chinese) [Google Scholar] [CrossRef]
- Stetler, L.; Saxton, K.E. Wind Erosion and PM10 Emissions from Agricultural Fields on the Columbia Plateau. Earth Surf. Process. Landf. 1996, 21, 673–685. [Google Scholar] [CrossRef]
- Songbo, C.; Chunlai, Z.; Dai, Z.H.; Xinyu, L.; Qing, L.; Yuhu, H. Characteristics of PM10 emission from farmland during a wind erosion event. J. Desert. Res. 2020, 40, 147–152. (In Chinese) [Google Scholar]
- Maurer, T.; Herrmann, L.; Stahr, K. Wind erosion characteristics of Sahelian surface types. Earth Surf. Process. Landf. 2010, 35, 1386–1401. [Google Scholar] [CrossRef]
- Webb, N.P.; Galloza, M.S.; Zobeck, T.M.; Herrick, J.E. Threshold wind velocity dynamics as a driver of aeolian sediment mass flux. Aeolian Res. 2016, 20, 45–58. [Google Scholar] [CrossRef]
- In, H.-J.; Park, S.-U. Estimation of Dust Emission Amount for a Dust Storm Event Occurred in April 1998 in China. Water Air Soil Pollut. 2003, 148, 201–221. [Google Scholar] [CrossRef]
- Mei, F.M.; Rajot, J.L.; Alfaro, S.C. Observation of dust release fluxes from Mauwusu sands and Field validation of the DEM model. Chin. Sci. Bull. 2006, 51, 1326–1332. [Google Scholar]
- Zheng, X.J.; Yue, G.W. Effect of earth surface temperature on saltation trajectories of sand particles. J. Appl. Mech. 2005, 22, 207–211. (In Chinese) [Google Scholar] [CrossRef]
- Lin, H.X.; Yue, G.W. Influence of the thermal diffusion of the sand-bed on the evolutive process of the wind-blown sand flux. Clim. Environ. Res. 2010, 15, 191–198. (In Chinese) [Google Scholar] [CrossRef]
Publisher’s Note: MDPI stays neutral with regard to jurisdictional claims in published maps and institutional affiliations. |
© 2021 by the authors. Licensee MDPI, Basel, Switzerland. This article is an open access article distributed under the terms and conditions of the Creative Commons Attribution (CC BY) license (https://creativecommons.org/licenses/by/4.0/).