Abstract
Recent changes in cyclone tracks crossing Southeast Europe are investigated for the last few decades (1980–1999 compared with 2000–2019) using a developed objective method. The response in number, severity, and persistence of the tracks are analyzed based on the source of origin (the Mediterranean Sea sub-domains) and the target area (Romania-centered domain). In winter, extreme cyclones became more frequent in the south and were also more persistent in the northeast of Romania. In summer, these became more intense and frequent, mainly over the south and southeast of Romania, where they also showed a significant increase in persistence. The regional extreme changes are related to polar jet displacements and further enhanced by the coupling of the sub-tropical jet in the Euro-Atlantic area, such as southwestwards shift in winter jets and a split-type configuration that shifts northeastwards and southeastwards in the summer. These provide a mechanism for regional variability of extreme cyclones through two paths, respectively, by shifting the origins of the tracks and by shifting the interaction between the anomaly jet streaks and the climatological storm tracks. Large-scale drivers of these changes are analyzed in relation to the main modes of atmospheric variability. The tracks number over the target domain is mainly driven during the cold season through a combined action of AO and Polar–European modes, and in summer by the AMO and East-Asian modes. These links and the circulation mode’s recent variability are consistent with changes found in the jet and storm tracks.
1. Introduction
The Mediterranean is a climate region of major interest in the context of climate change, recently referred to as a climate change and biodiversity hotspot, mainly due to its faster warming (0.3–0.4 °C per decade compared to about 0.2 °C in the global ocean) and to multiple hazards increasing its vulnerability [1,2]. Moreover, the region has major teleconnections routes for Europe [3,4,5], being one of the main sources of latent heat [6] and eddy energy enhancement for the mid-latitudes, influencing the weather and climate in Europe [7,8]. Storm track identification often uses subjective/semi-objective [9,10,11] and objective track-computation algorithms, based on various definitions of cyclone centers and tracking criteria [12,13,14,15]. Using these techniques, a significant amount of work has been devoted to storm-track classification [16,17,18] and analysis. For Europe, classifications focused on their origin in the Mediterranean or focused on the propagation direction and regions that were crossed over. Mediterranean cyclone tracks over 1961–2002 were classified [19] into four types (“Genoa”, “Adriatic”, “twin”, and “others”) depending on the region of origin, while some authors [20] targeted cyclones arriving in Central Europe, finding that most of the Central European winter cyclones emerged either in the northeastern or the northern Atlantic region. Significant changes in storm-track characteristics have been reported and periodically updated in the last few decades for Mediterranean cyclones and their associated impacts. Using an ensemble of tracking models, no robust yearly trend over 1997–2008 for cyclones over the Mediterranean was found [21]; however regional trends (positive in late summer and negative in late spring) were found. Southeastern Mediterranean originating tracks showed a decreasing trend during winter over 1962–2001 over the Southeastern Aegean Sea, with an enhancement when tracks followed southern trajectories [22]. Meanwhile, fewer updates were made regarding changes in cyclone tracks reaching Eastern Europe, in spite of recent trends in observed temperature and in extreme precipitation reported for Southeast (SE) Europe in the last few decades [23,24,25].
Mechanisms of Mediterranean variability under the recent climate have been extensively analyzed. A number of research publications found large-scale teleconnections related to Mediterranean temperature and precipitation [26,27,28,29]. It has been found [30] that the North Atlantic Oscillation (NAO), the East Atlantic (EA), the East Atlantic-West Russian pattern (EAWR), and the Scandinavian Pattern are the main teleconnections modes affecting the Mediterranean region. The link between these modes and the polar jet, as well as between storm tracks and the Euro-Atlantic jets, has also been reported in various studies [31,32]. It has been shown that the first jet-storm track covariance mode explains about 50% of the yearly variability, and that the relative position of the cross-jet circulations (Atlantic jet and African jet) strongly influences the climatological precipitation distribution over the Mediterranean Sea, leading to increased precipitation in its western part in autumn and an increase in the Eastern Mediterranean in winter [33].
Focusing on extremes, the NAO, the AO, and the SCAND were shown to be main teleconnections modes of variability linked to the Western Mediterranean and the East Atlantic Western Russian (EAWR) mode to the Eastern (Western) Mediterranean extreme precipitation in its positive (negative) phase [34]. Analyzing the mechanisms and scales leading to climate extreme variability is important, as it allows to define its precursors [35,36], and is useful in extended operational forecasts. Sub-synoptic contribution has been emphasized as being important in winter, while frequency changes in thermal lows dominate Mediterranean cyclones’ variability in spring and summer [37]. Recently, the seasonal predictability of the Mediterranean has been studied, identifying weather regimes and their precursors through teleconnections with sea surface temperature (SST) anomalies, showing that current predictions systems are able to represent these links with increased accuracy during extreme SST years (ENSO) [38]. On the other hand, recently, the impact on AMOC strength due to Mediterranean Sea changes in stratification, through increased precipitation and runoff discharges has been studied as a long-term mechanism of coupled variability [39].
Changes in these teleconnections due to external forcings under actual transient and future climate may have significant impacts at the regional scale [40,41,42]. Up to 2008, however, it had been suggested that the summer NAO pattern was the main driver of the teleconnection between the opposite summer temperatures in Southeastern Europe (Northeastern Mediterranean) and in Northwestern Europe, and that this had been stable over the last two centuries [43]. Less analyses have been reported on the actual links with storm tracks, mainly those leading to extreme cyclones over Southeastern Europe. In the longer term, future scenarios indicate [44] large uncertainties in Mediterranean storm-track-projected characteristics with significant regional differences and variability [45,46].
This work focuses on the analysis of regional changes in storm tracks during the last few decades and on the mechanisms driving these changes. Understanding their mechanisms could be helpful in the analysis of projected regional changes in climate scenarios and in terms of the expected impact on the main parameters, such as precipitations and wind, which are strongly related to regional storm tracks. Years with extreme precipitations (most recent summers), mainly in Southern/Southeastern Europe, as well as during winter, for Southern Europe, have already been registered. For example, in Romania, the increase in extreme cyclones in the south–southeast in summer caused a larger number of severe precipitation and floods episodes (especially in 2005, 2008, 2010, 2014, and 2016). During winter, the increased persistence of extreme cyclones from the northeast generated severe blizzards (in 2012, 2013, 2014, 2015, 2017, and 2020), and some of them were very early (Oct 2015) or very late (Apr 2017, [47]); thus, in the last few decades, the number of warning messages has been increasing (e.g., 40 in 2007 compared with 146 in 2020). The driving mechanisms of these climate anomalies will be related to the regional changes in mid-latitude storm tracks in this study.
Here, we use a tracking model [48] developed based on the mean sea level pressure, which was calibrated and validated (Figure S1) for the main track clusters crossing Romania [10]. The aim is to analyze most recent changes in storm tracks over Southeast Europe, with a focus on extreme cyclone events and their regional variability mechanisms. The methods and data used are discussed in Section 2 and Section 3, and show the results from applying the tracking algorithm for two 20-year time slices: 1980–1999 (P1) and 2000–2019 (P2). An analysis of recent changes in storm track variability over Eastern Europe is presented in Section 3.1. Sub-regional changes in extreme cyclone events for the particular target domain of Romania are analyzed in Section 3.2. We further propose and discuss a potential mechanism of the recent regional changes in extreme storm tracks in relation with changes in the atmospheric teleconnection modes of atmospheric circulation in Section 3.3 and Section 3.4. The impact of these changes is discussed in Section 4. We summarize the main outcome of this work in Section 5.
2. Data and Methods
We used a track computation algorithm that we developed and tested previously in our analysis of the sea level height variability linked to cyclone tracks in the Euro–Atlantic sector [48]. Recently, the algorithm was verified in operational applications for monthly and seasonal prediction of cyclone tracks, where we used the algorithm based on the forecasted MSLP from the ECMWF-SYS5 extended prediction ensemble (8 members in operations) [49,50]. In the present study, the algorithm used the mean sea level pressure (MSLP) from ERA-Interim reanalysis [51] with a 6-h time step and a resolution of 0.75°. For the extra tropics, the MSLP or the geostrophic vorticity fields were most often used for these types of studies [52,53]. In addition, for this study the algorithm was verified for the nine main clusters that were found to be representative for the climatology over the target domain [10], by simulating the central cluster event and analyzing the origin, development, and larger-scale context for each (presented in Figure S1).
The steps were: (i) identify the cyclone center’s local minima in the MSLP field (lower than 1012 hPa) for all time steps and the whole domain and (ii) identify the trajectory by connecting the closest cyclonic centers at successive time steps. The closest cyclonic center was selected into a neighboring area with a radius of 720 km while the search area for the joining centers over successive time steps was a function of latitude and mean wind speed; if more neighbors were found, the deepest branch was followed. Changes in track directions were restricted by disallowing acute angles less than 85° between two time steps (i.e., retro-gradation could not occur within 6 h). The model conditions and thresholds were calibrated for the target area and the atmospheric model resolution and were verified over a set of main clusters of trajectories over the domain (Figure S1).
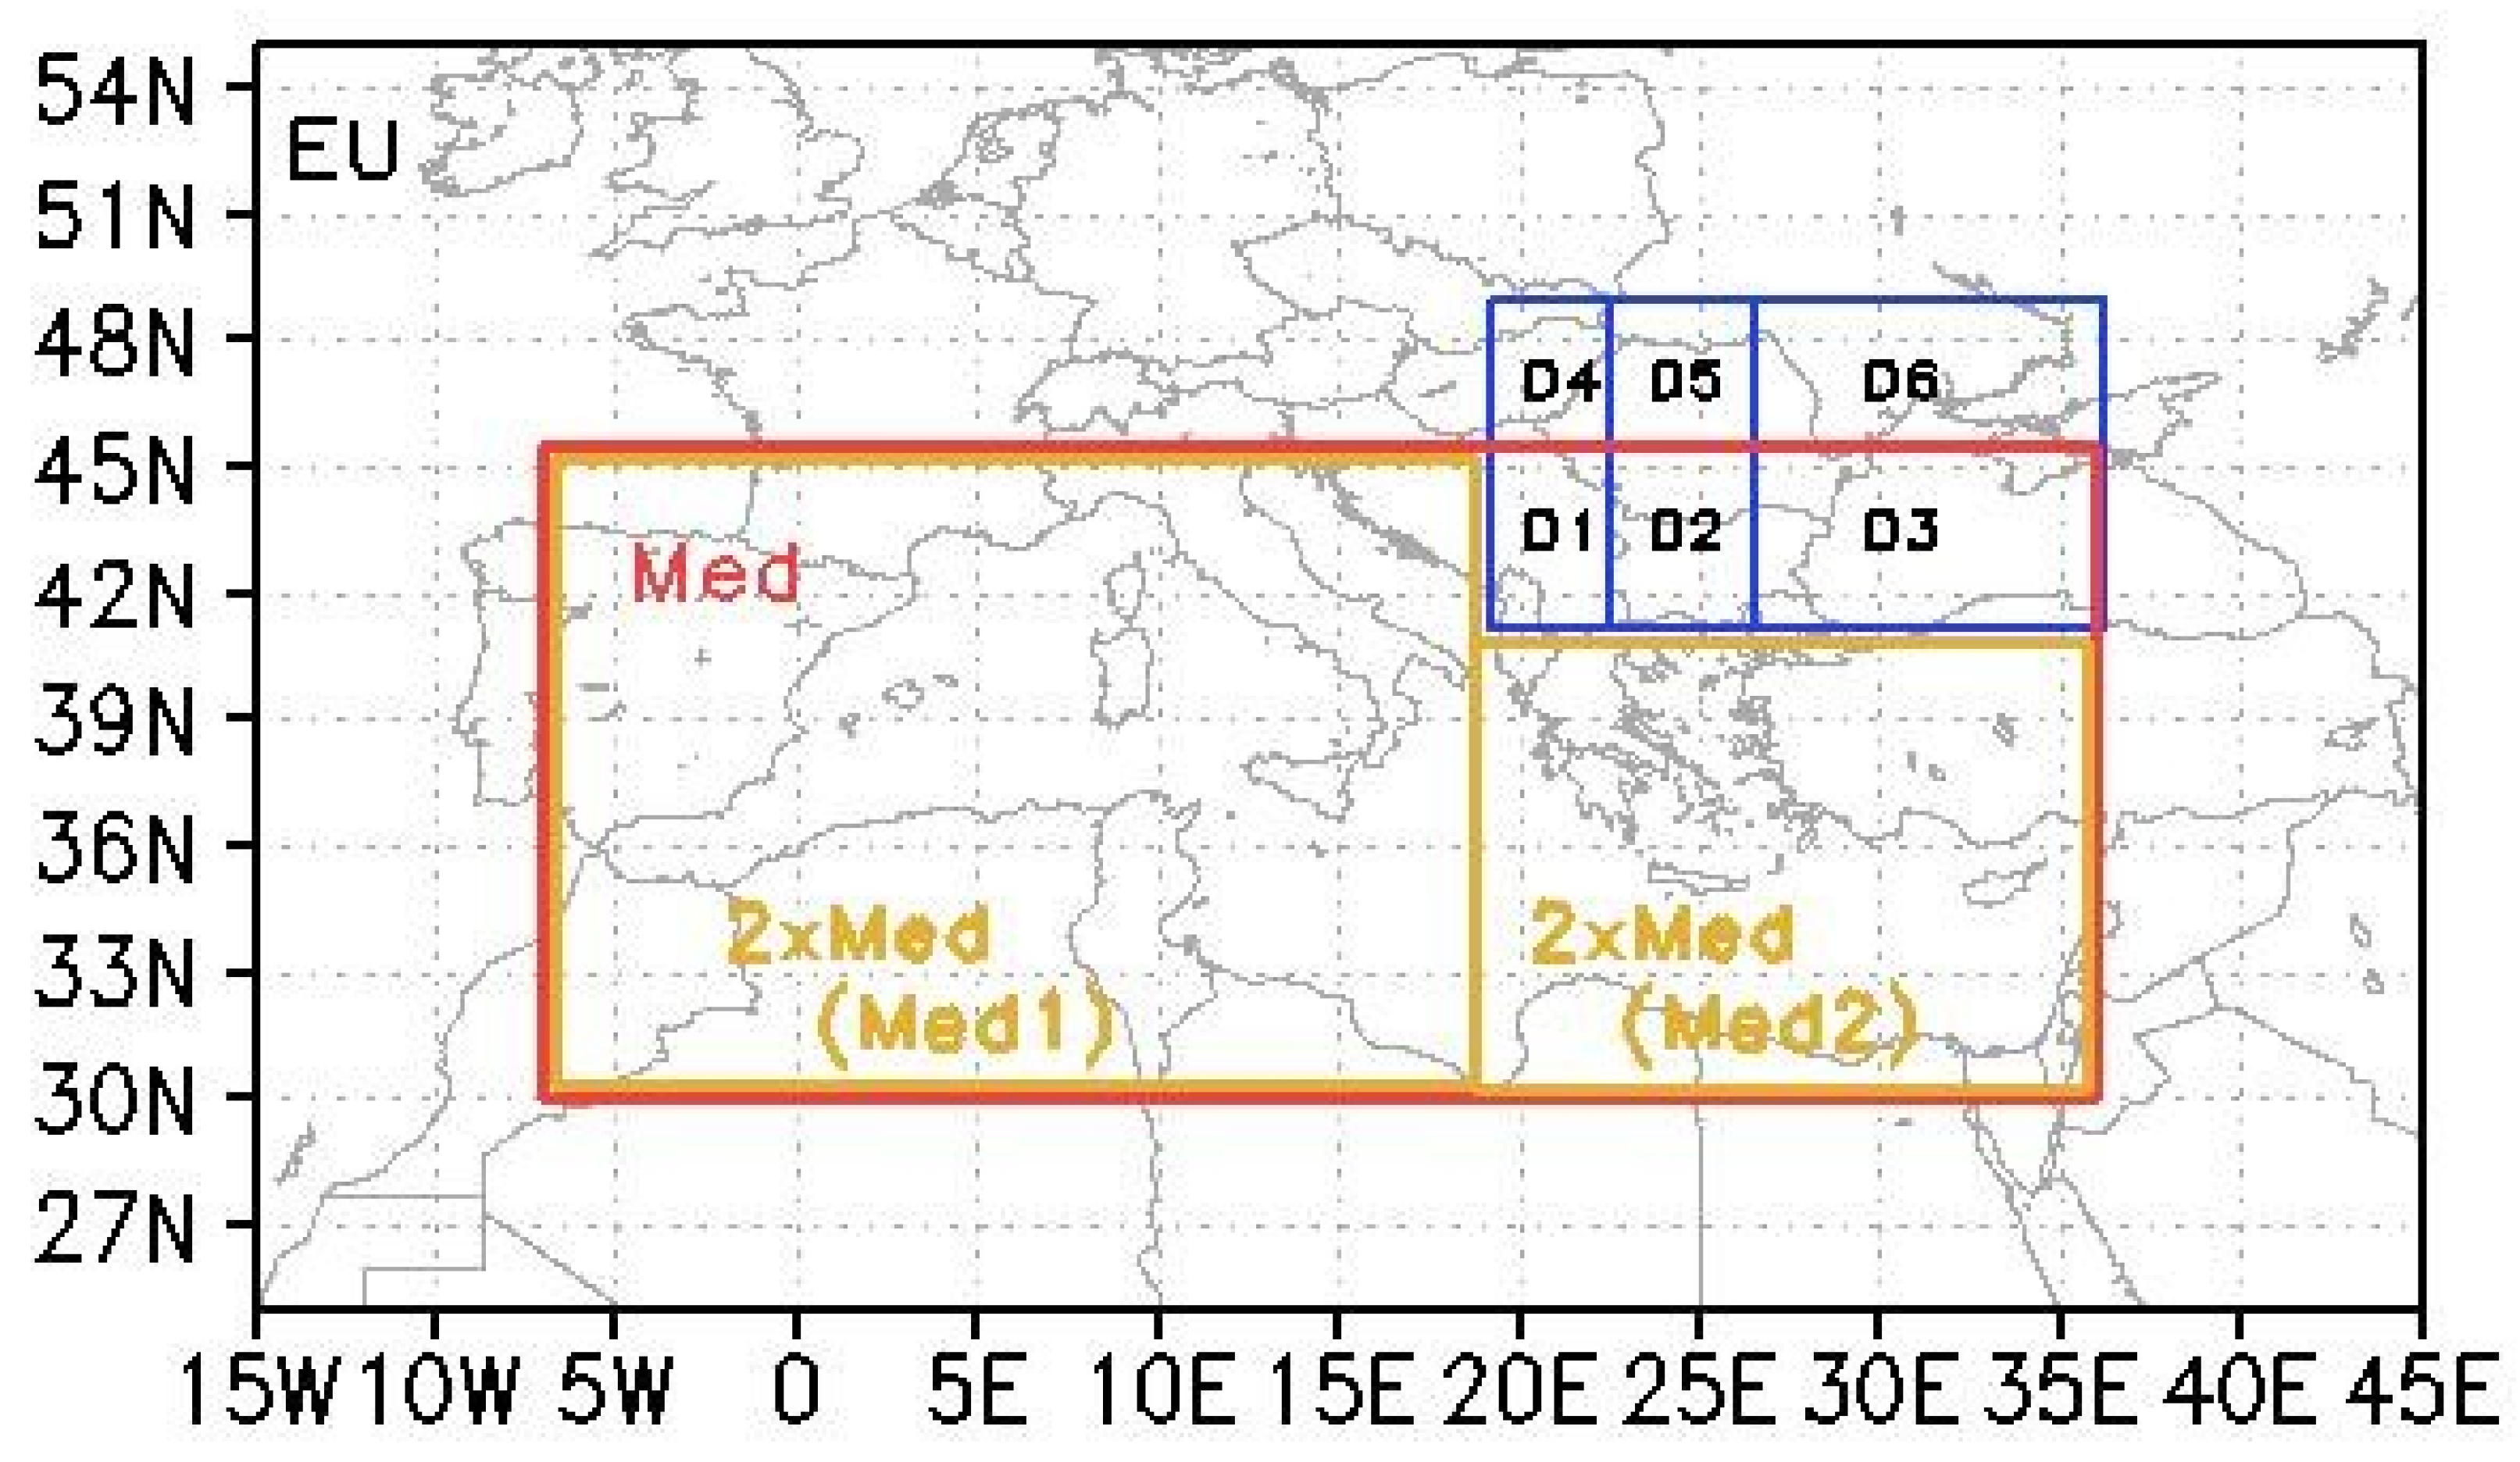
We calculated the trajectories for the Northern Hemisphere based on ERA-Interim reanalyses over: (i) 20 years from 1 January 1980 to 31 December 1999 (period P1); (ii) 20 years from 1 January 2000 to 31 December 2019 (period P2). These were computed following domain-definition criteria. We used two types of domains-definition: domains of storm track origins and target domains crossed over by tracks. Tracks statistics were computed separately for each domain of origin and target domain in order to estimate the sub-regional changes and the sensitivity to their origins. The domains of the storm track origins considered were: an extended Mediterranean Sea-centered domain ((15° W–45° E) × (25° N–55° N)), named “EU”, which included the northern tracks from the Atlantic and the southern tracks from the Mediterranean region, a Mediterranean domain (named “Med”) that covered the sea and extended over land, and two “Med” sub-domains (“2xMed”) named “Med1” and “Med2”. These are shown in Figure 1 and are described in Table 1. The target domain was a Romania-centered one (named D0) and was divided into six sub-domains (Di, i = 1,6), also shown in Figure 1 and described in Table 2. Similar to the IMILAST project [13] we filtered out cyclones with life-times less than 30 h when analyzing changes in climatological features.
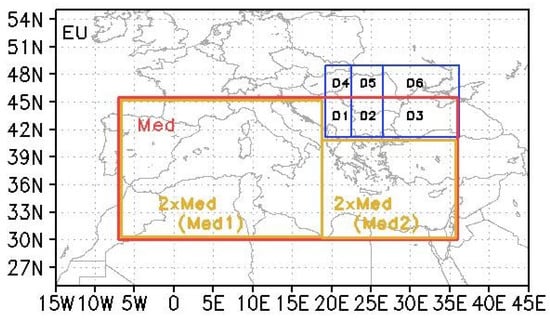
Figure 1.
The domains of track origins (“EU” (black line, whole domain), “Med” (red) and “2xMed: Med1 U Med2” (orange)) and of tracks target areas (Di (i = 1–6), (blue)).

Table 1.
Domain of tracks’ origins.

Table 2.
Tracks’ target regions.
For analysis of the results, we used Northern Hemisphere data from ERA-Interim over 1980–2019 for the surface temperature (TS), precipitation (P) and MSLP. We focused on changes in mid-latitude storm tracks without considering cyclone types [54] and their changes, e.g., extratropical transitions, or medicanes [55], which would require also considering other parameters, such as sea surface temperature and gradient anomalies, as well as humidity advection [56].
3. Results
3.1. Recent Changes in Frequency
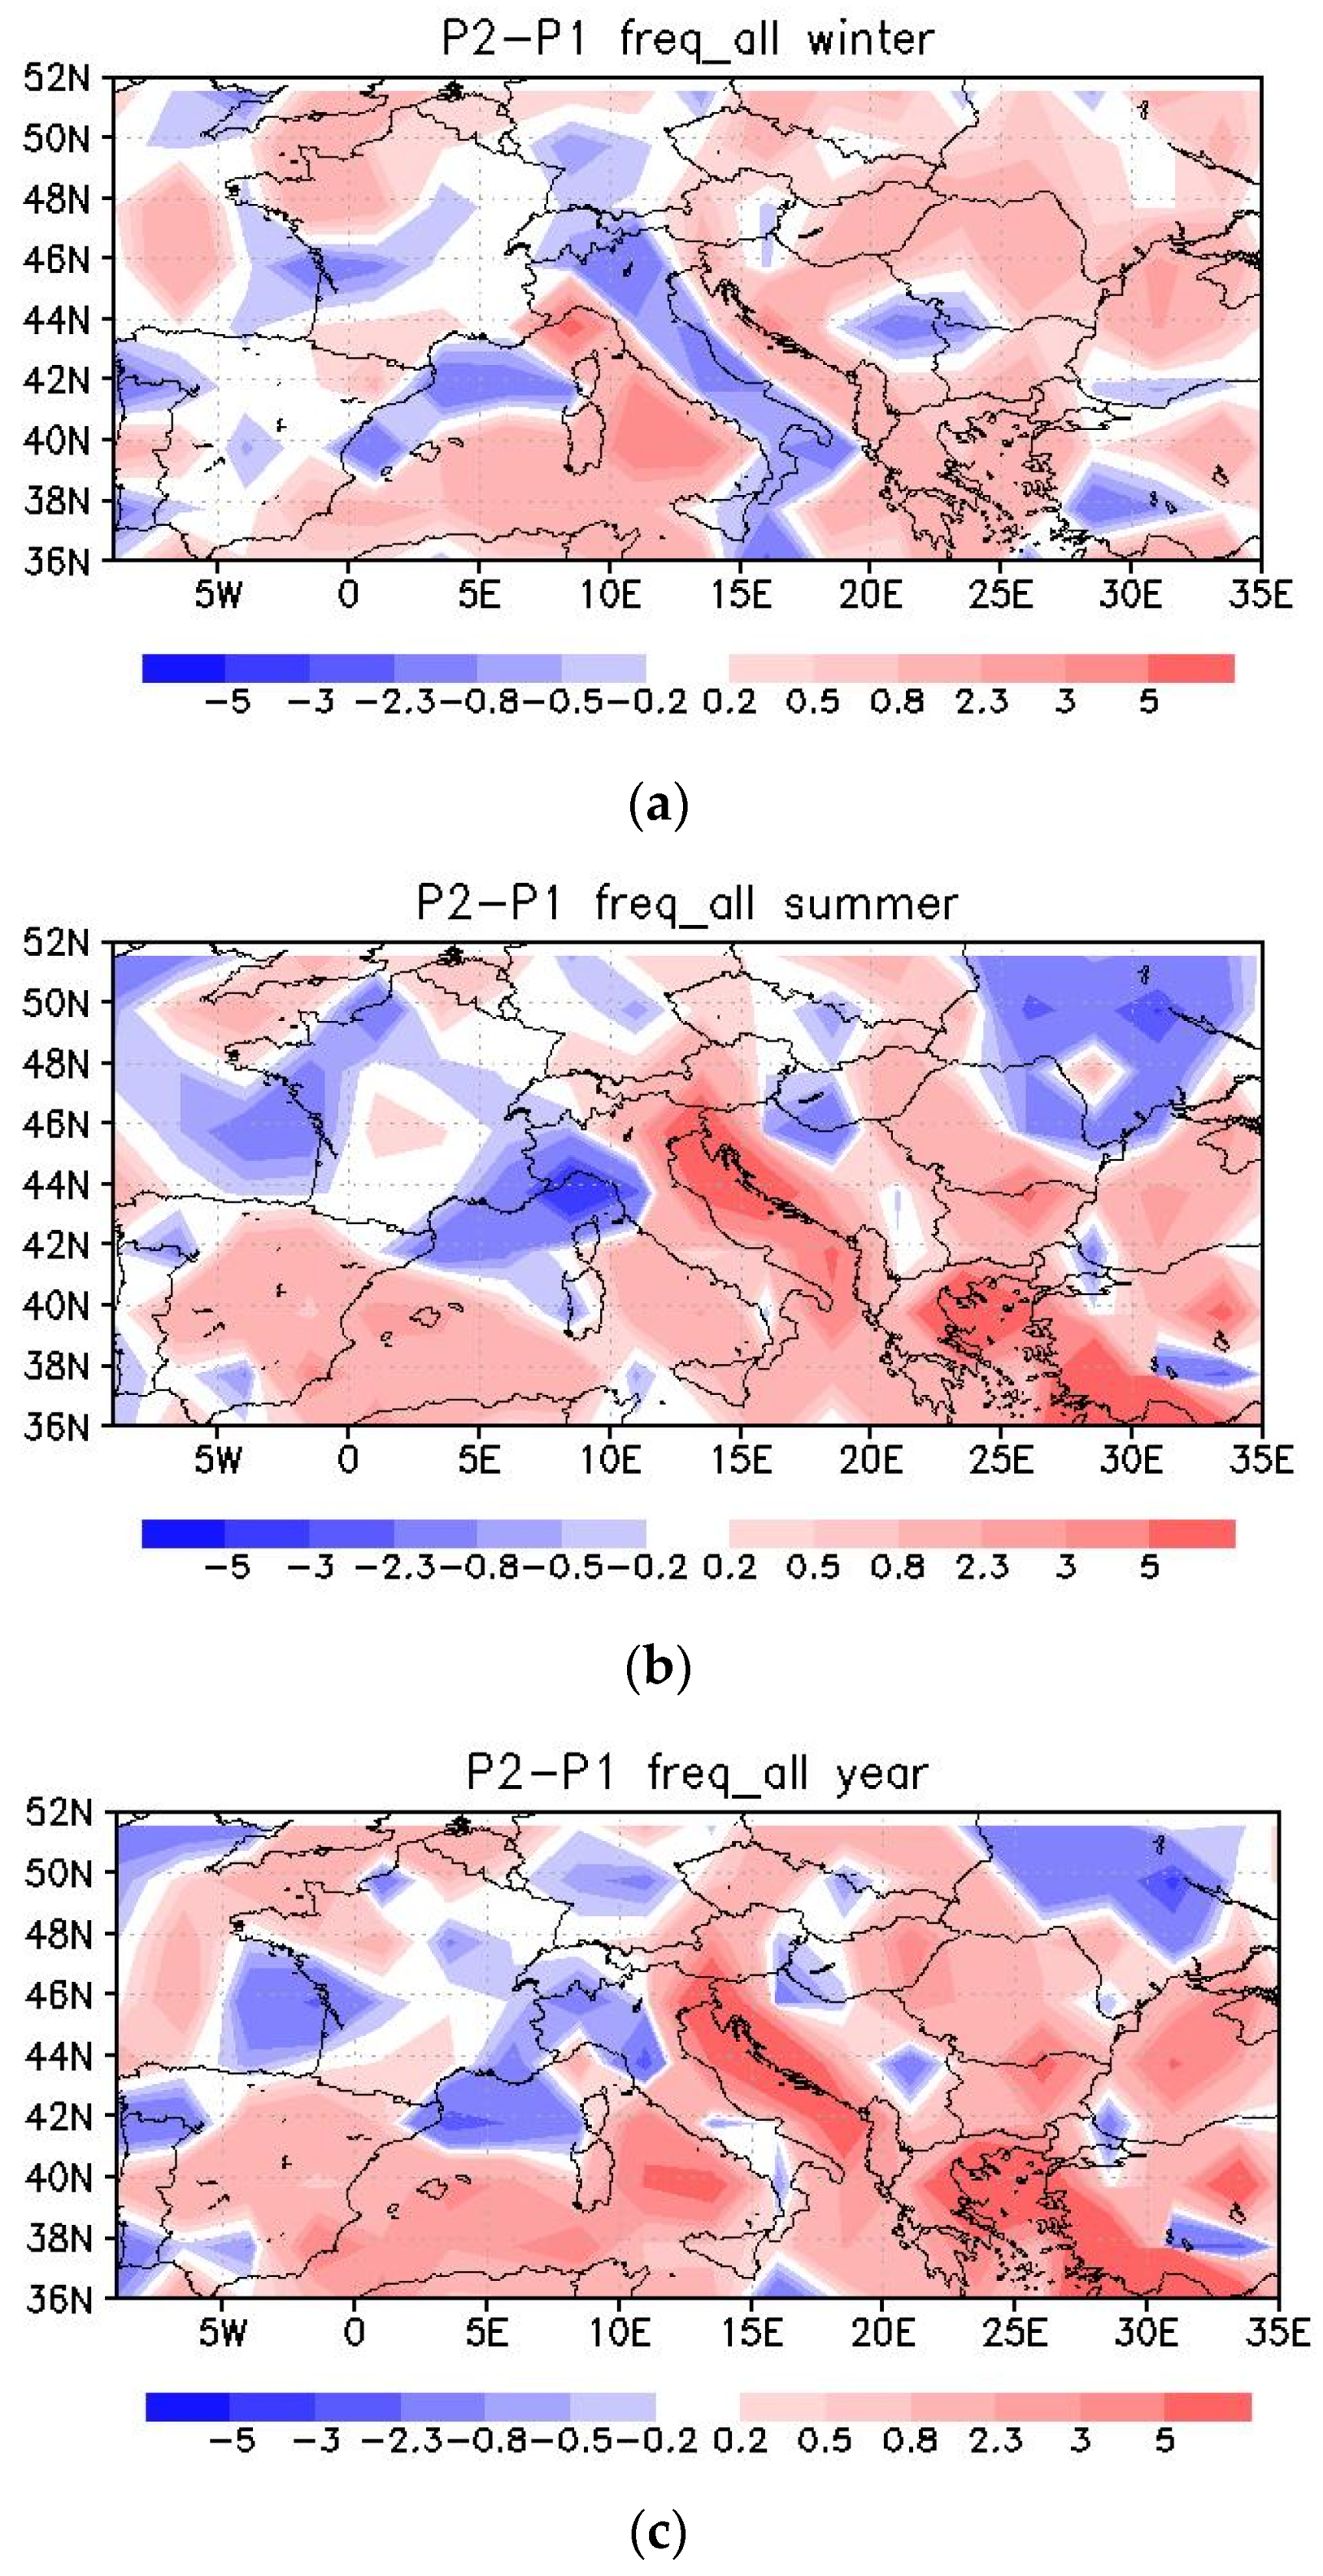
Figure 2 shows the change in the total number of cyclones of all origins (“EU”), as seasonal and annual differences (P2–P1). We note that the annual mean increased over Western and Eastern Europe in the two most recent decades and there was a decrease over Central Europe (as also reported by Trigo [57]) and north of the Black Sea, which will be discussed later. The main increase was located over the Adriatic and Aegean Seas (Figure 2b) in summer (opposite to winter for the same regions, Figure 2a [21]) and was associated in previous studies with a low thermal mechanism due to their lower intensities [58]. In winter, the pattern of cyclone number anomalies (P2–P1) shifted westward in Southern Europe–Northern Mediterranean, with an increase over the Tyrrhenian Sea and a decrease over Eastern Italy.
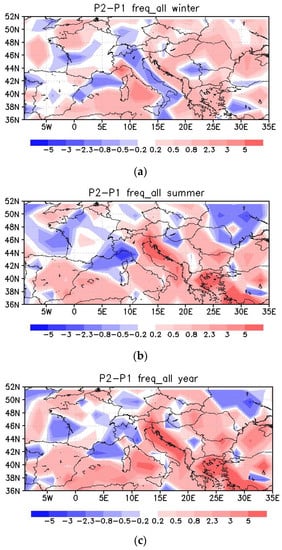
Figure 2.
Change in the total number of cyclone tracks over Europe (origins in “EU”), as mean difference (P2–P1); the mean is determined over model grid-points (0.75°) in 2.5° E × 2° N boxes and summed over time for: winter (a), summer (b), and year (c).
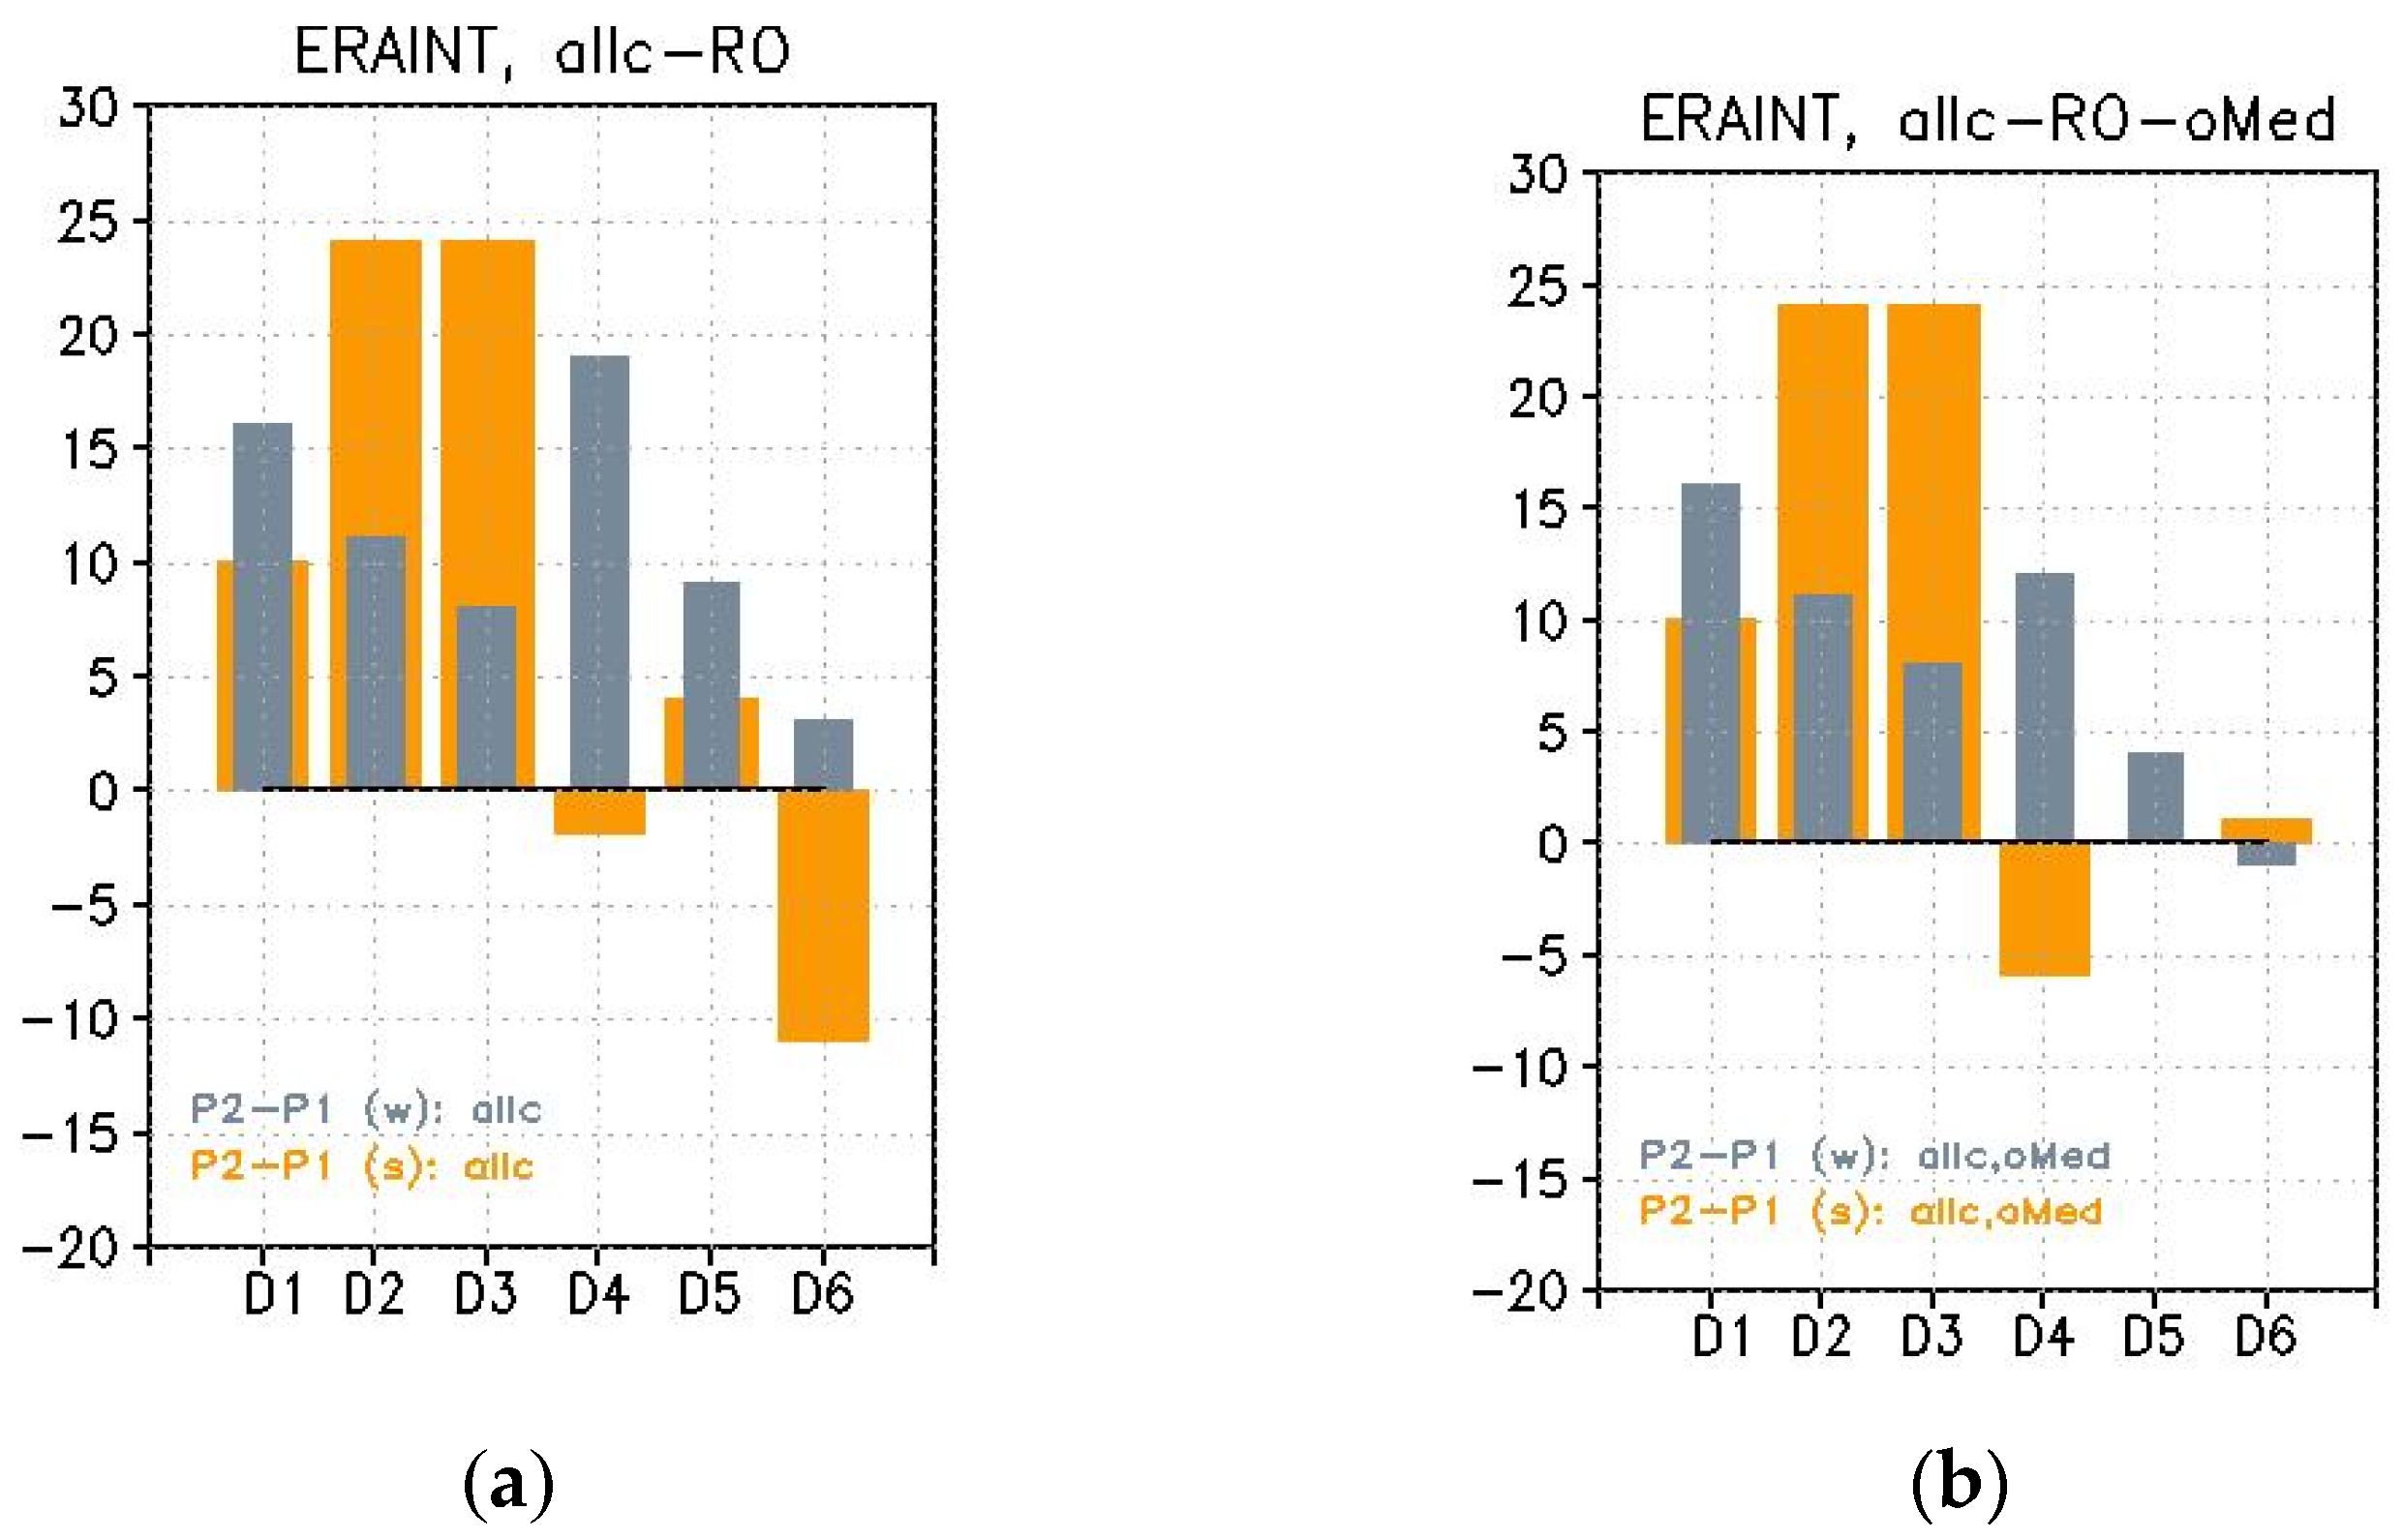
Regarding the target domain centered over Romania, tracks became more frequent in the south and southwest (and less frequent in the northeast) in summer and they increased, mainly in the north and northeast in winter (with some decreases in the southwest). Further, for the target domain, we considered analyzing the changes at the “entering gate” in D0—useful information for prediction purposes. For this, we counted those tracks that first hit Di, and their changes in P2 relative to P1, to eliminate systematic errors of detection. We also considered relative differences ((P2–P1)/P1) in this study and noticed that qualitative results did not change. This analysis was done considering “Med” origins and comparing them against “EU” origins (Figure 3). This stratification allowed cross-comparing the track change sensitivities to both the origins and direction, following an operational purpose.
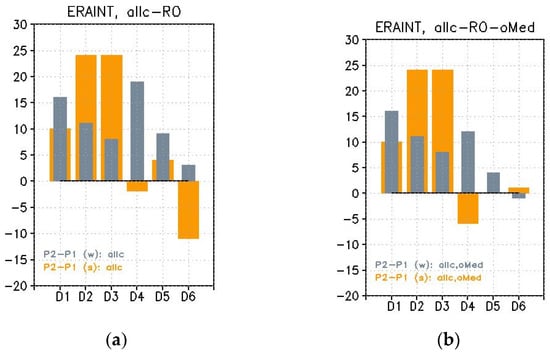
Figure 3.
(a) Change in the total number of cyclone tracks “entering” the Di sub-domains (i.e., reaching first the sub-domain, Di i = 1,6) as a difference (P2–P1) for summer (orange) and winter (grey); (b) the same for only cyclones with origins over the Mediterranean Sea (“Med” domain origins).
We note (Figure 3) that changes in cyclone number first reached the southernmost sub-domains of D0 (D1, D2, and D3, respectively, Serbia, Bulgaria, the southern half of Romania, and the East and Center of the Black Sea) were fairly dominantly coming from the Mediterranean influence basin (“Med”); only the northern sub-domains also had tracks originating outside the Mediterranean. This emphasizes the importance and relevance of studying Med-cyclones for Southeastern European/Romanian areas in particular. The results agreed with Figure 2, showing a decrease in the northeast (D6, Eastern Romania) during summer, attributable to the North-Atlantic track branch (found being “EU” type) and in Northern Romania (D4). These, together with the increase over D3 that was attributable entirely to “Med” type and with no re-emergence northwards, indicate a summer blocking of tracks at the southern D0 latitudes. As we will discuss in Section 4, this relates to an anomalous area of the driest top soil in Europe in the TS trend field in the last two decades, linked to the lack of humidity advection, north of the Black Sea.
In winter, we see an overall increased number for all “entering gates”, including D1 (Serbia and Southwestern Romania), in spite of the decrease in Figure 2, a fact explainable by an enhanced SW-NE flow, as will be further shown for winter.
The summary result here is an overall increase in cyclogenetic events over D0 in P2 compared to P1, the mechanisms of which will be discussed in Section 3.3.
3.2. Changes in Extremes Cyclones over SE Europe/Romania
We defined three disjointed classes of extreme cyclones over Romania, based on the central pressure over Di. The thresholds for severity classes “S” (severe), “ES” (severe–extreme), and “EE” (extreme) are defined in Table 3 for the two seasons, AMJJAS and ONDJFM. We focused on “S” and “E” classes (where “E” included “EE” and “ES”) mentioning that “EE” events are more frequent in P2 in both seasons.

Table 3.
Classes of cyclone severity.
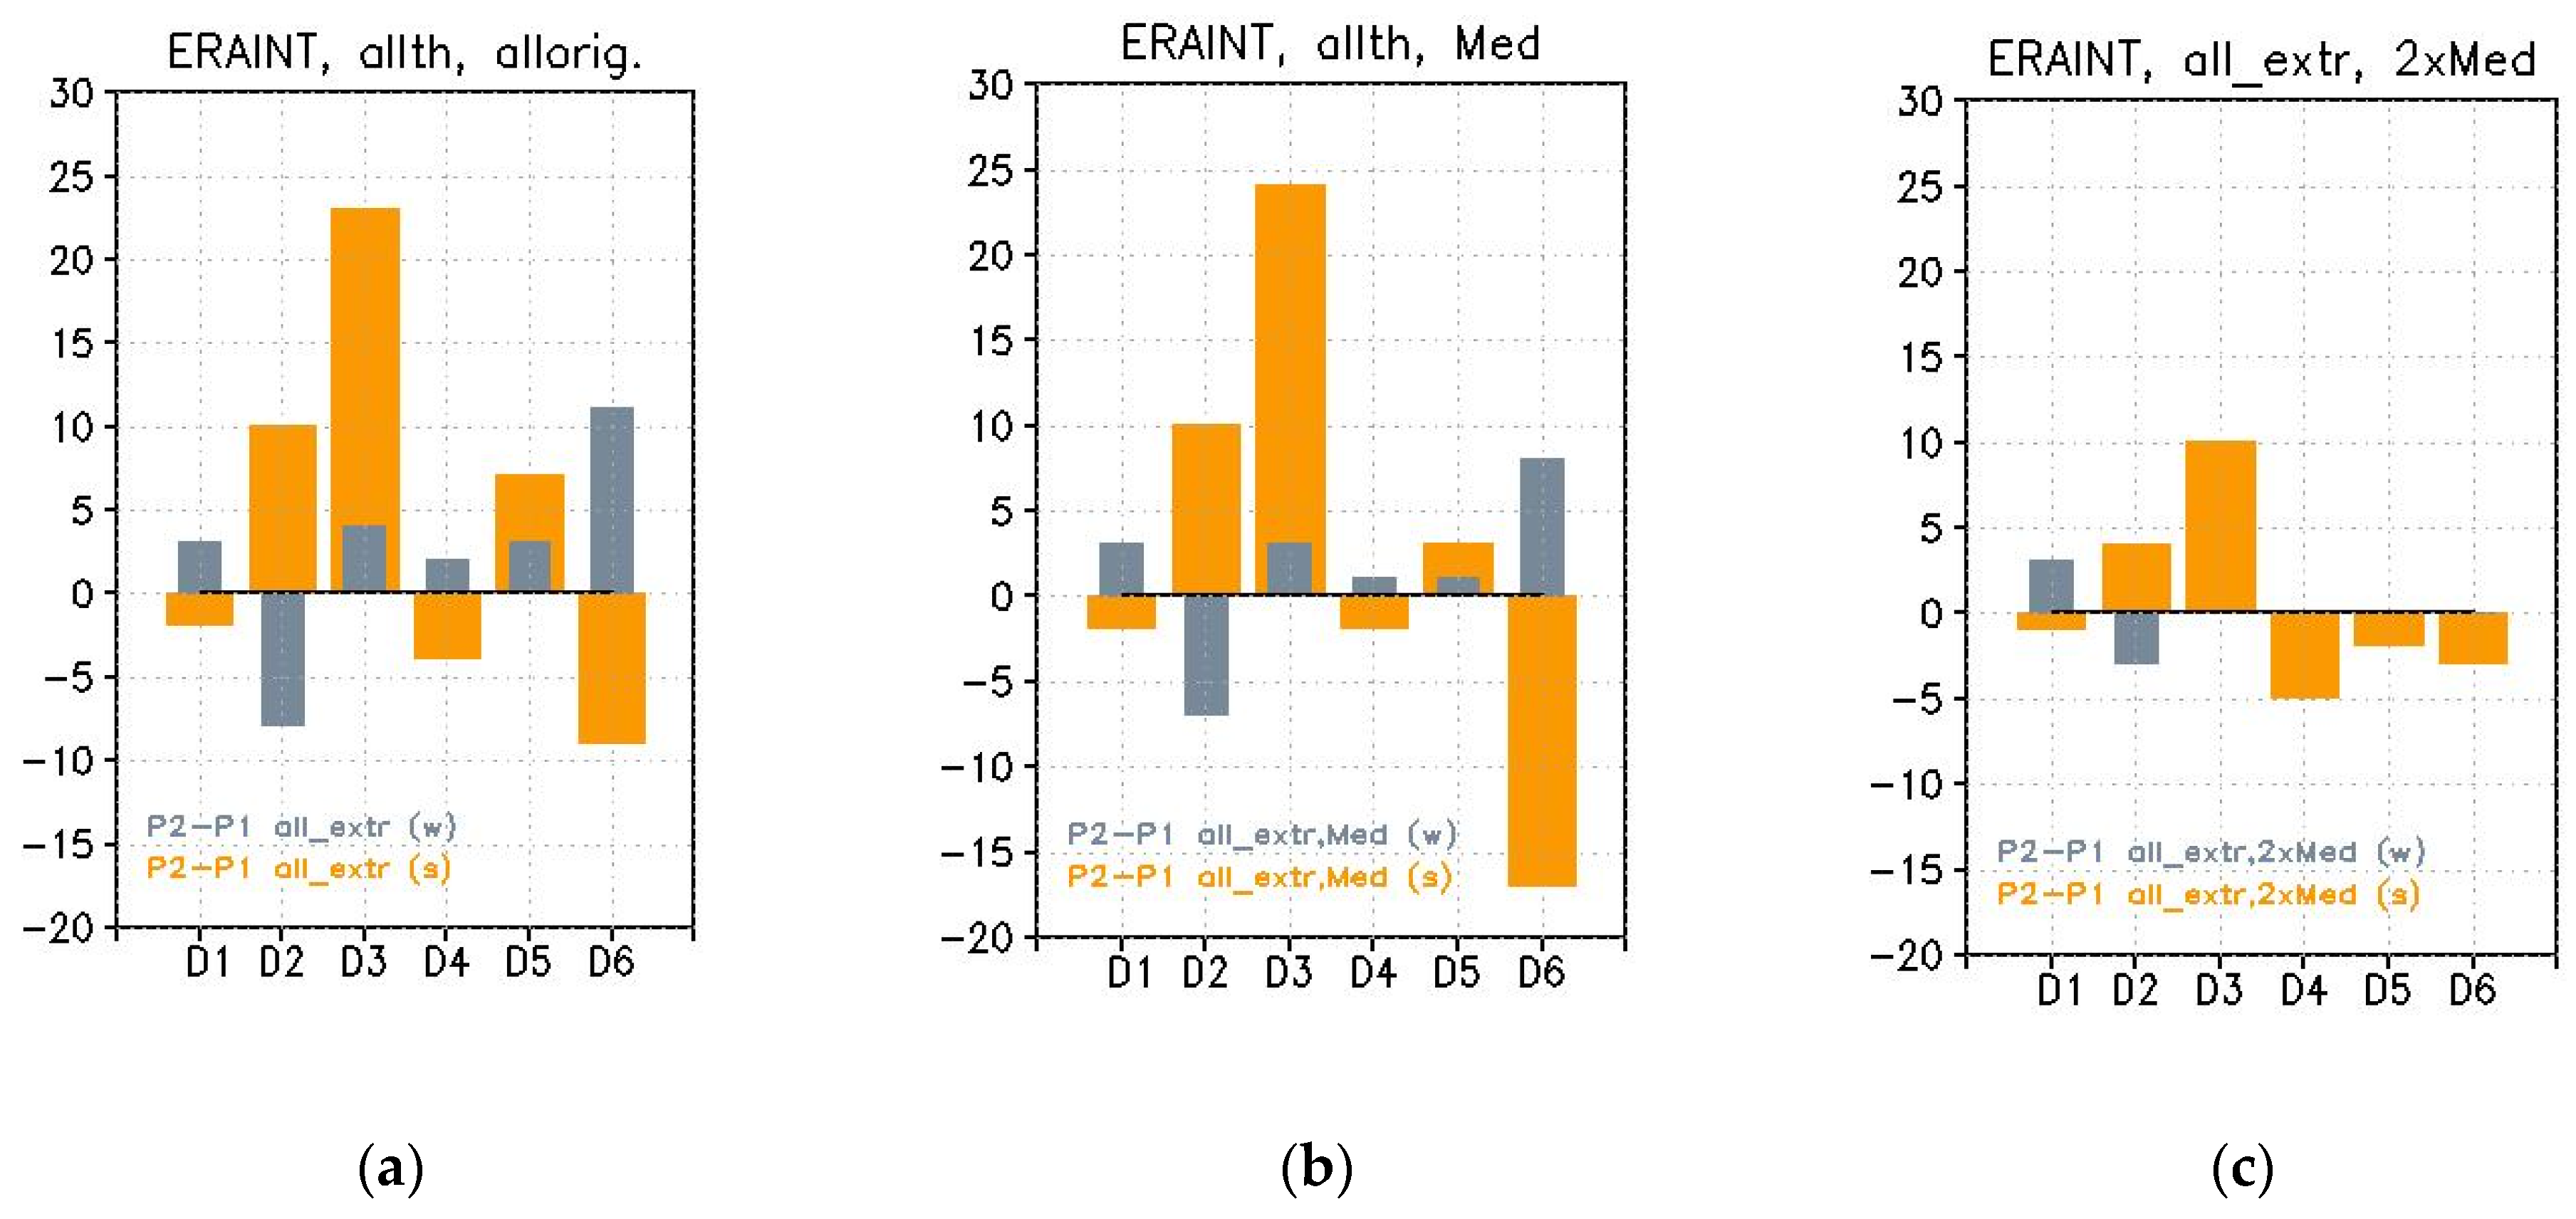
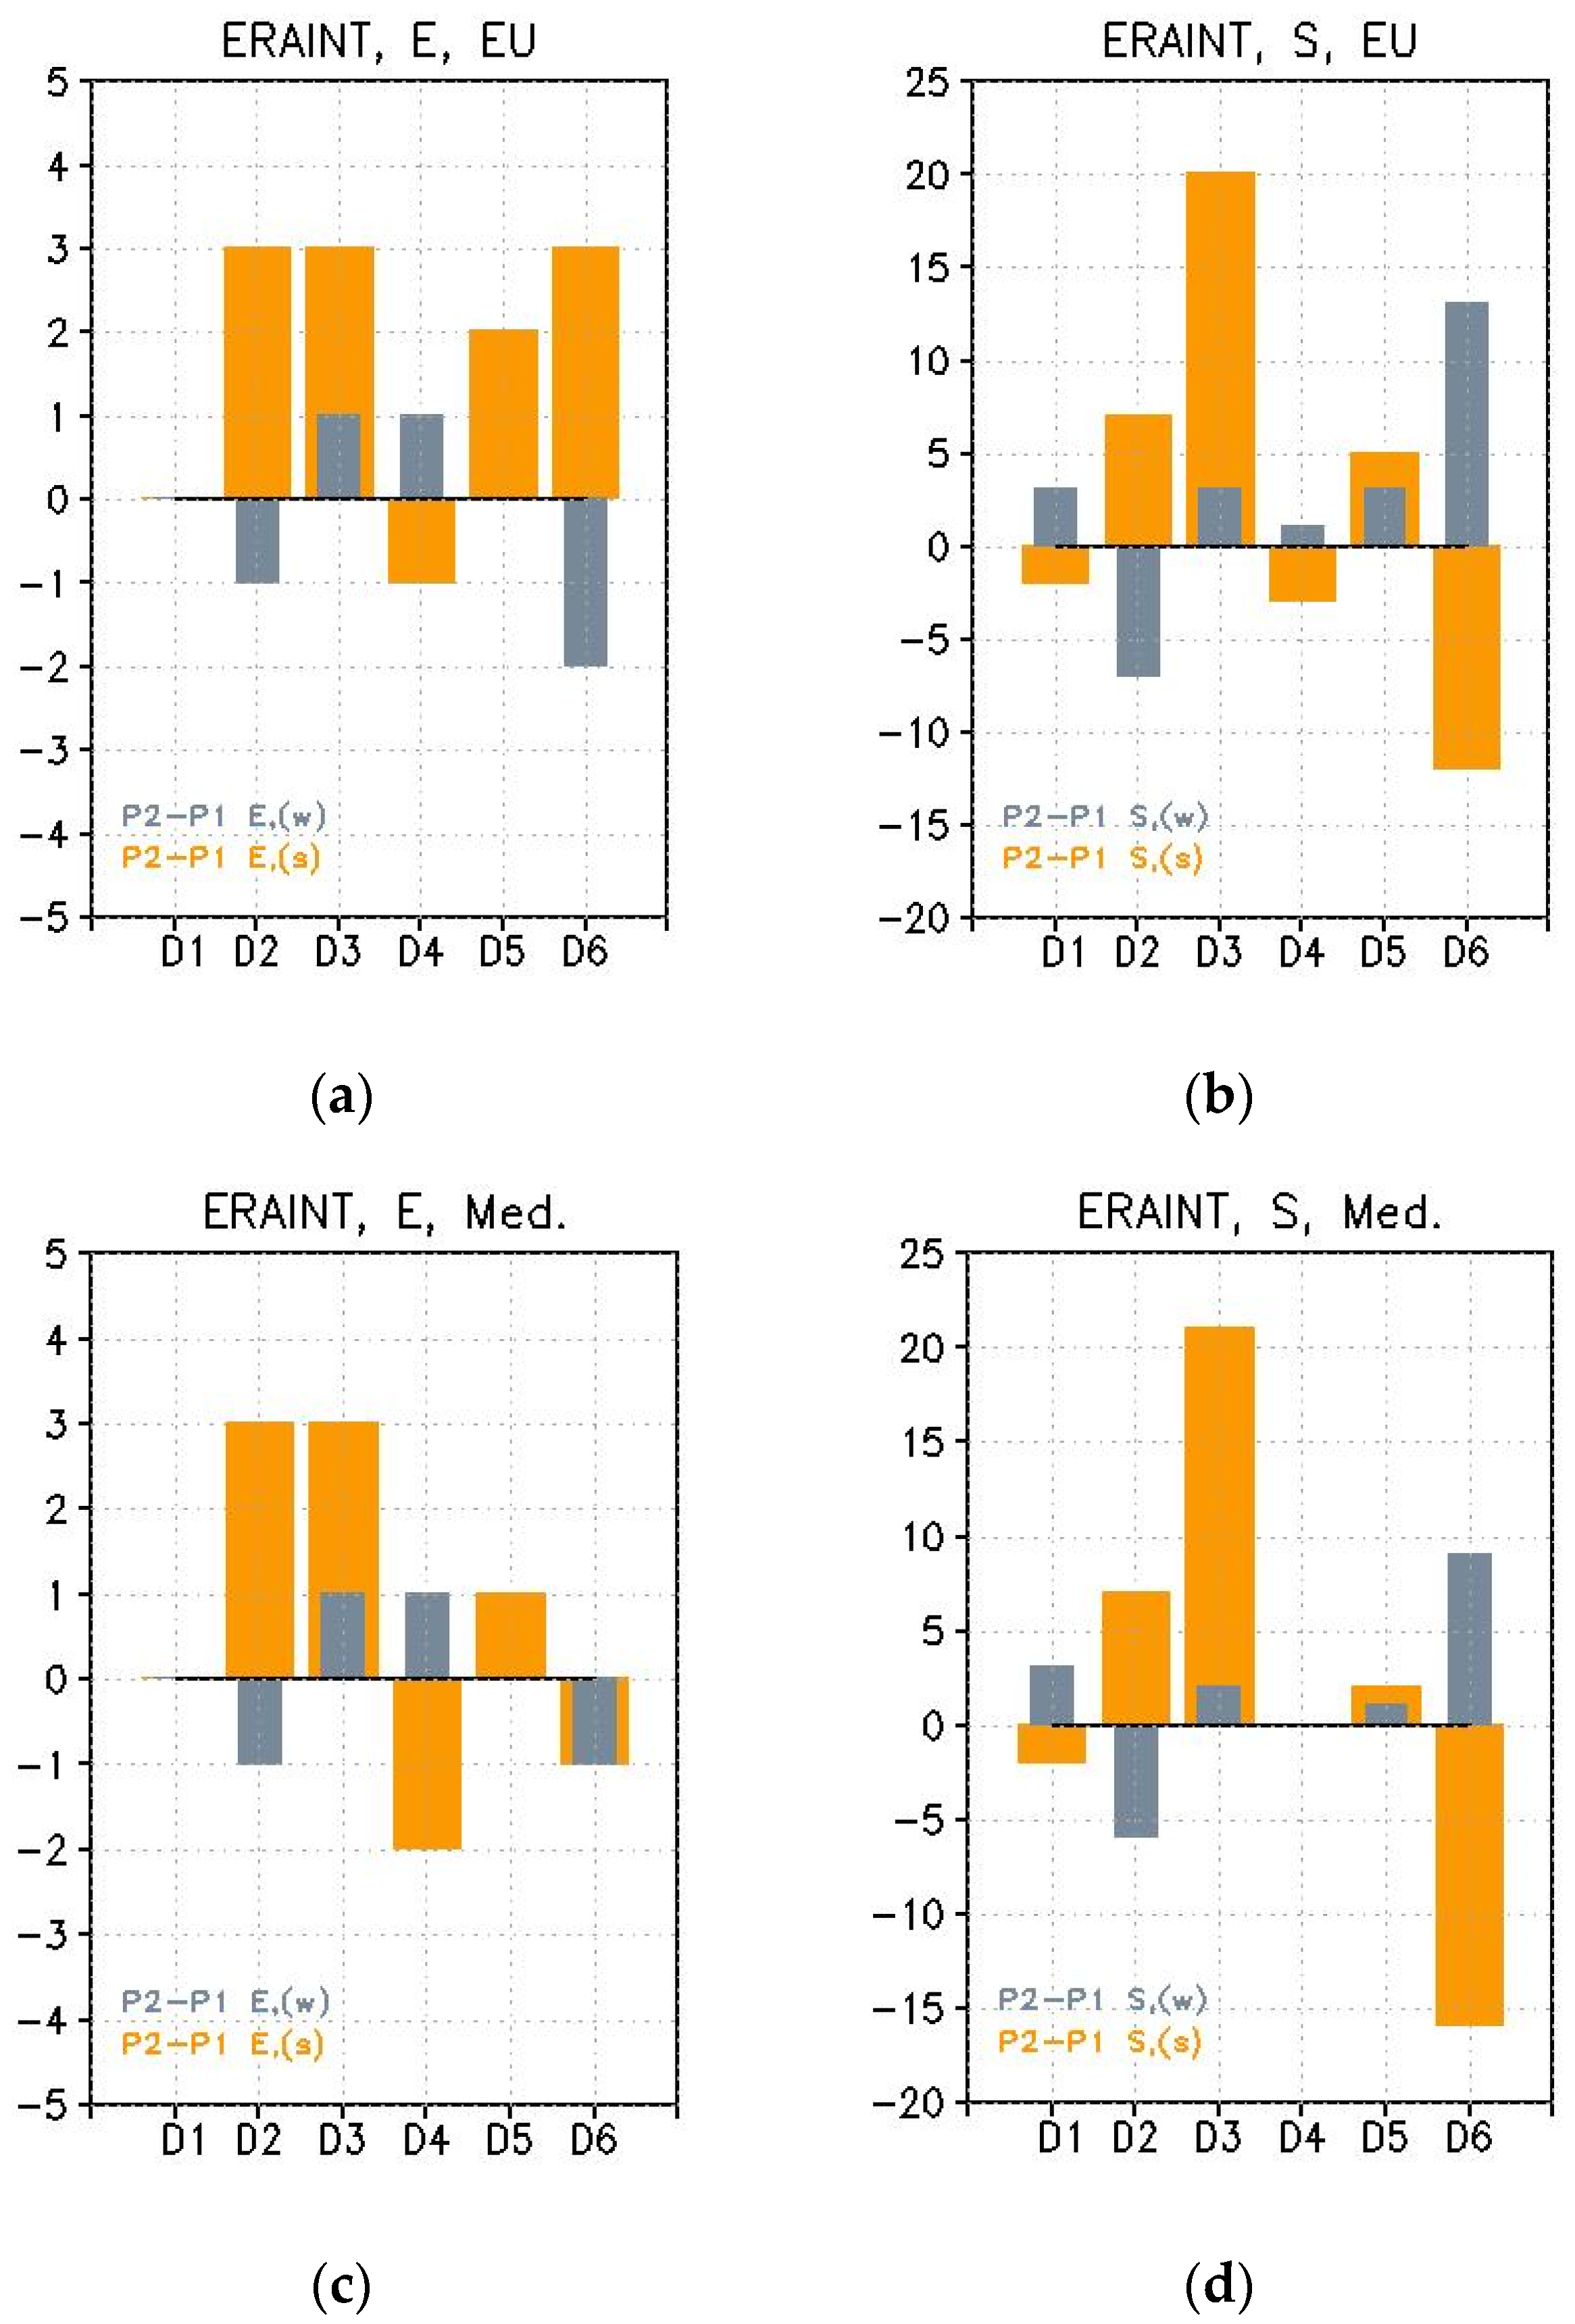
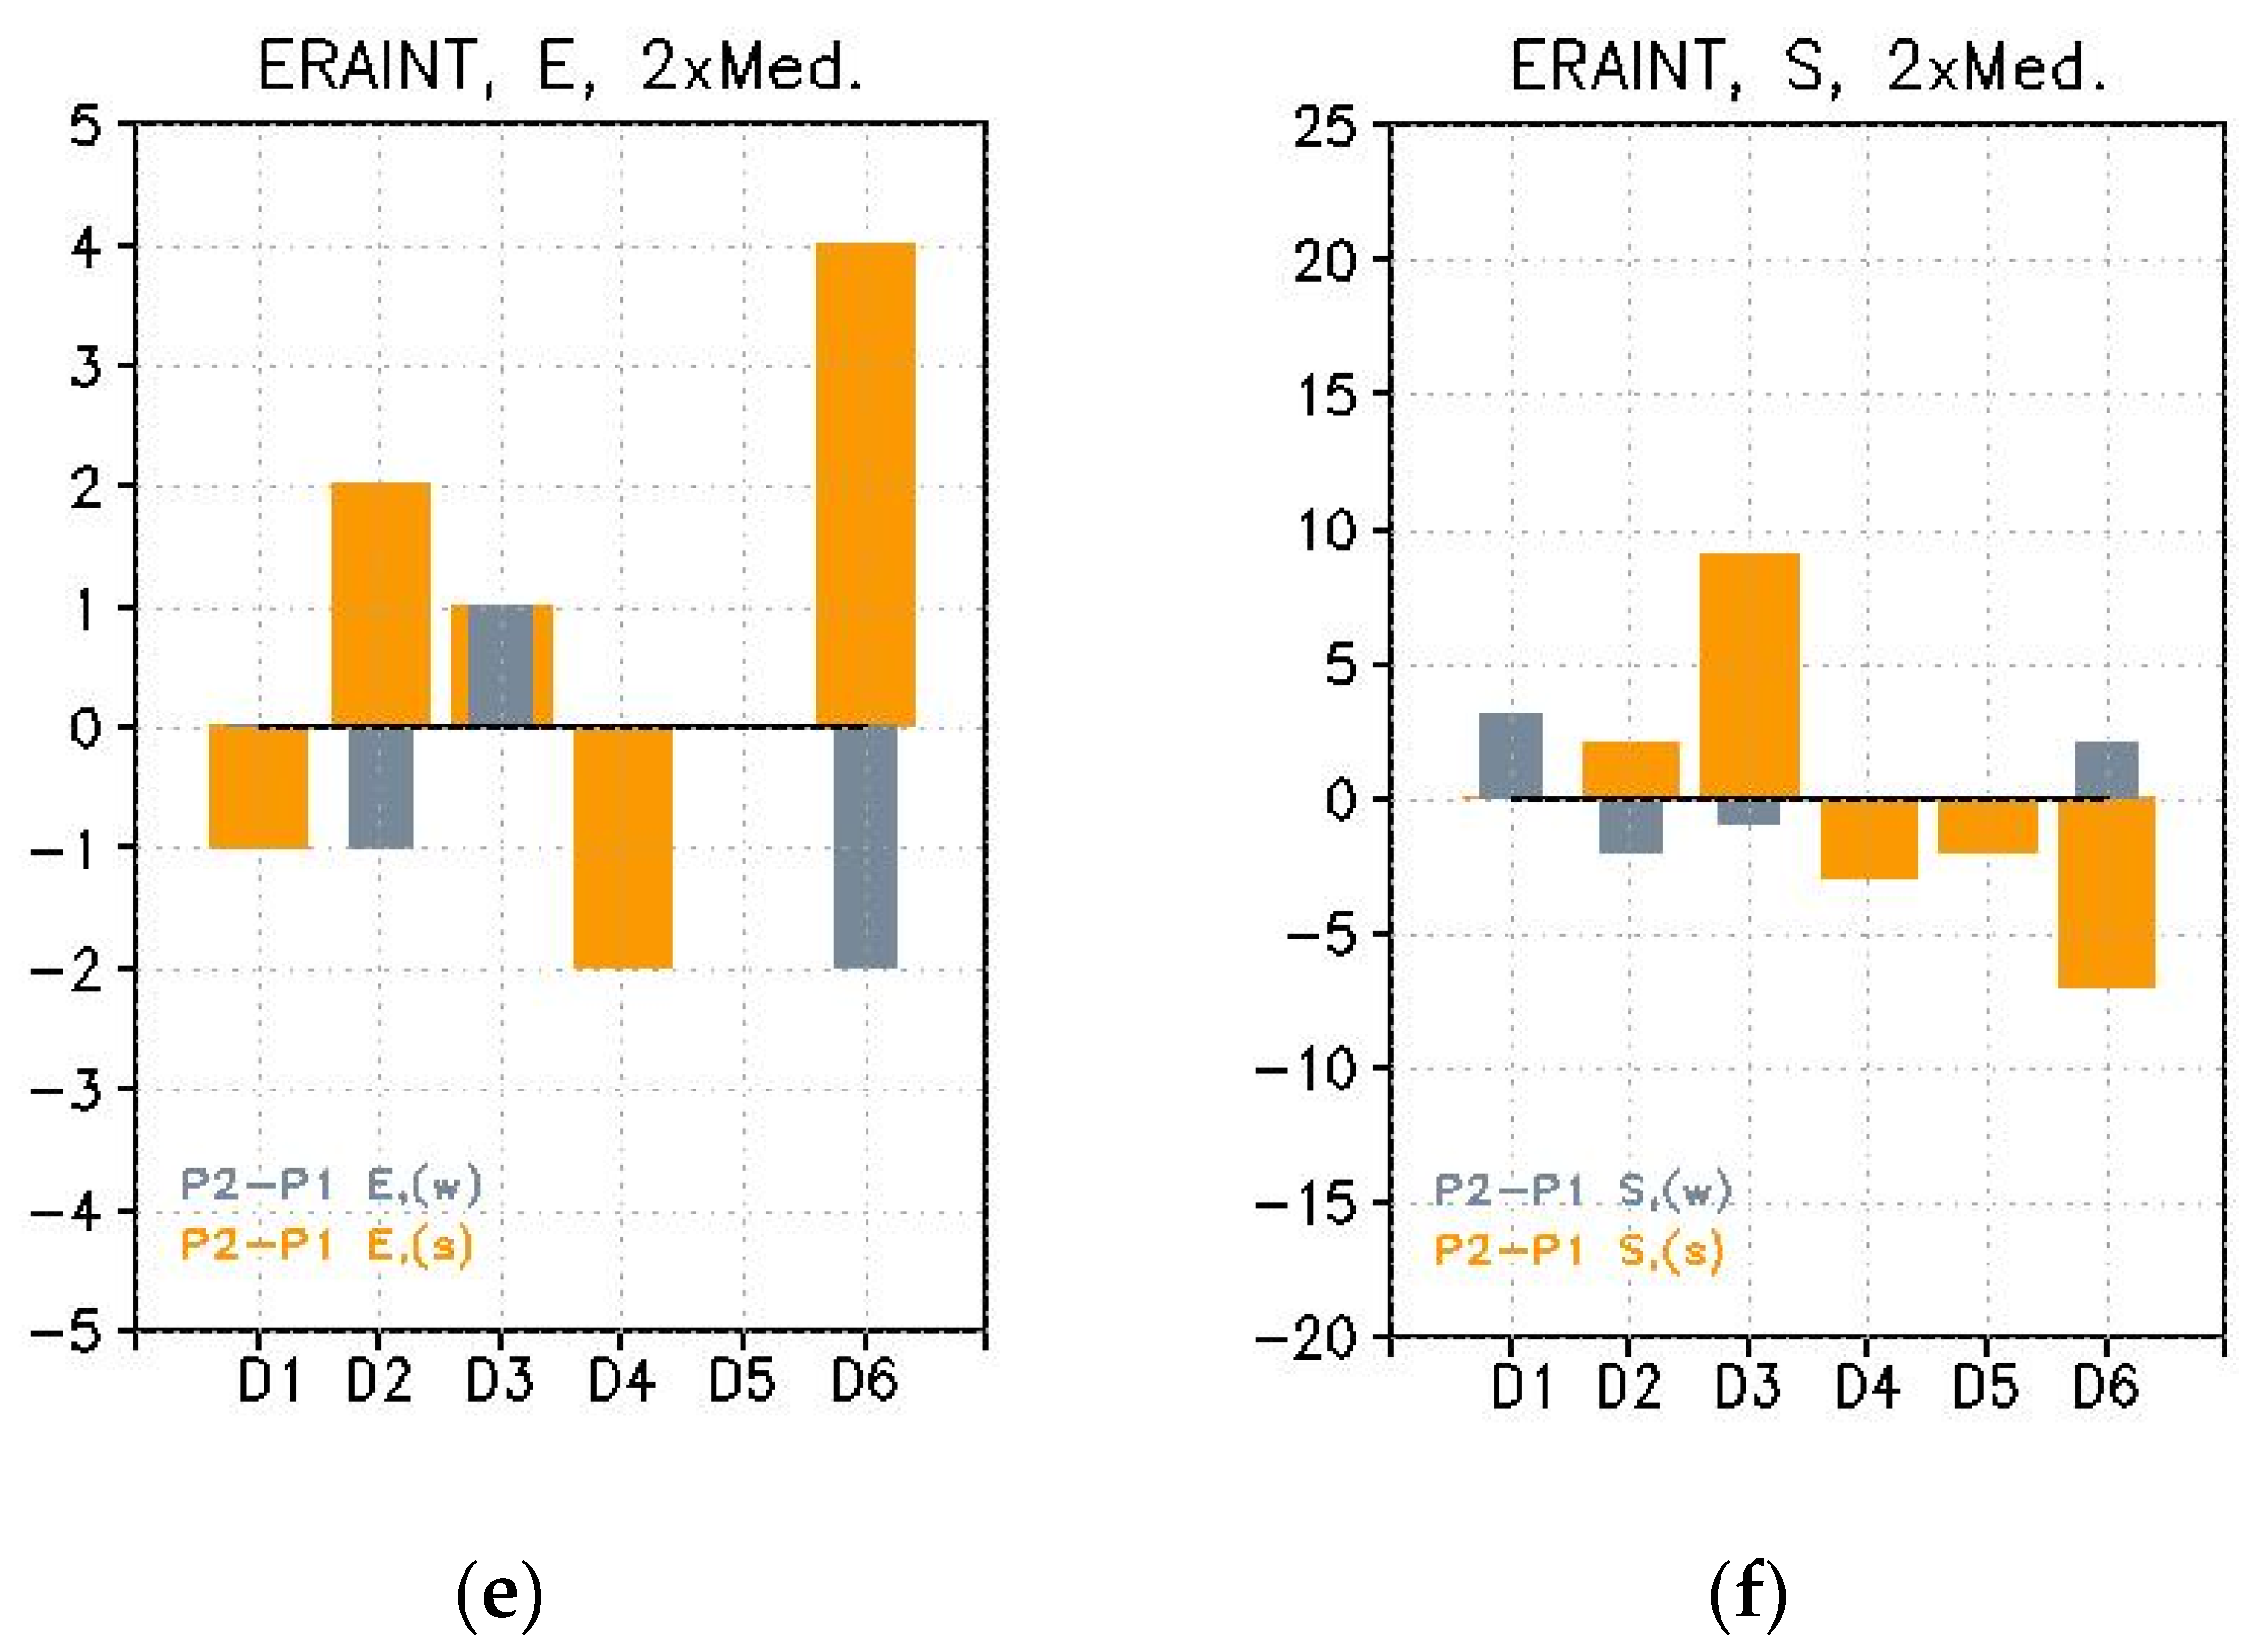
Figure 4 compares the sensitivity of the extreme tracks to the origin and to the target crossed-over domains (cyclone is counted at Di, regardless the “entering gate”). We considered deepening classes “S” and “E” and classes of track origins: Europe (“EU”), “Med”, and “2xMed” (Figure 1). Note that “Med” compared to “2xMed” accounted for re-activated (northern) land tracks that were still under Mediterranean Sea influence.
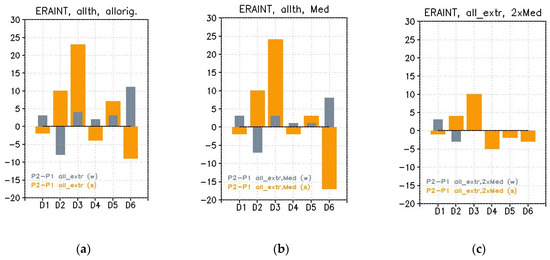
Figure 4.
Changes in the number of extreme cyclone tracks (sum over all extreme classes in Table 3) for the three types of origins: “EU” origins (a), “Med” origins (b), and “2xMed origins (c); difference in P2–P1 for winter (gray) and summer (yellow).
The cross-comparison (Figure 4) showed again that the southern D0 (D1, D2, D3) extremes were entirely “Med”-driven, while, in the northern part, there was a contribution from both the North Atlantic and Mediterranean climatological storm track branches [59,60,61]. In addition, most of the extremes’ changes (Figure 4) were related to the domain of coupled land–sea influence (“Med”\“2xMed”) of the two main climatological northern and southern (Europe extension) North Atlantic storm track branches [62].
The dominant changes in extreme cyclones were in summer, where the main increase found for D3 and decrease for D6 again reflect an increased blocking in summer, south of the D6 latitudes (i.e., increased track-split north–south about D6 latitudes and high-pressure anomaly in P2 compared to P1, north of D6). Extreme decreases in D6 summer appeared to be mainly attributable to “Med” origins decreases, as opposed to the total track change, discussed in Figure 3, since the “EU”–” Med” contribution is opposite, which is in agreement with anomalous summer blocking. In winter, extremes are more frequent in D6 from both sources (“EU” and “Med”) and the same along a SV–NE line over D0 in Figure 4 (later associated with a southeastward shift of the jet over Central Europe).
3.2.1. Changes in the Intensity of Extreme Cyclones
It is interesting to further split the changes in cyclone extremes noted in Figure 4, based on degrees of severity. We note, for example, that the main summer decrease in D6 happened in the “S” class (Figure 5b), while opposite to this, there was an increase in the number of most severe events (“E”, Figure 5a). This shift from the “S” class to “E” was equivalent to an intensification in their severity. Changes in extreme classes (“S” and “E”) were sourced from “Med” (Figure 5c,d vs. Figure 5a,b) in the south of D0 (D1, D2, and D3). In the north (D4, D5, and D6) both “Med” and “EU” contributed to these changes. However, we should point out that the “2xMed” source (Figure 5e,f) was clearly the one responsible for generating the stronger extreme (“E”, Figure 5e) variabilities in D6, namely the increase in summer and decrease in winter. Moreover both seasonal changes were opposite to the total change (all-classes) in extreme tracks in Figure 4.
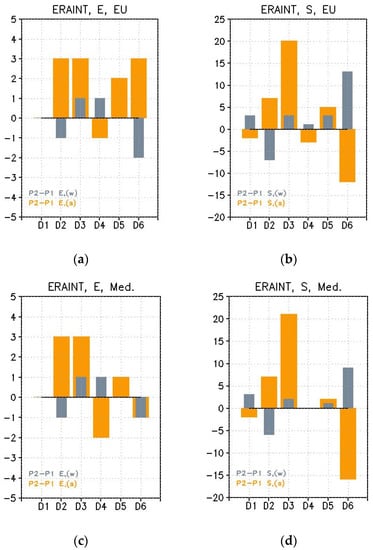
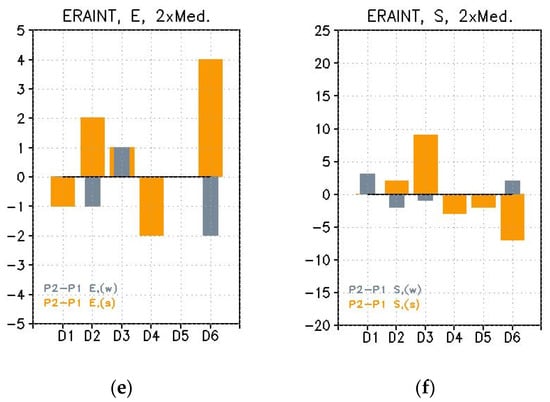
Figure 5.
Changes in the number of extreme cyclone tracks over DI (i = 1,6) per class and origin. Origins are in “EU” (a,b), “Med” (c,d), and “2xMed” (e,f) domains; extreme cyclone classes are “E” (a,c,e) and “S” (b,d,f). Bars show cyclone number differences (P2–P1) for summer (orange) and winter (blue).
3.2.2. Changes in the Persistence of Extreme Cyclones
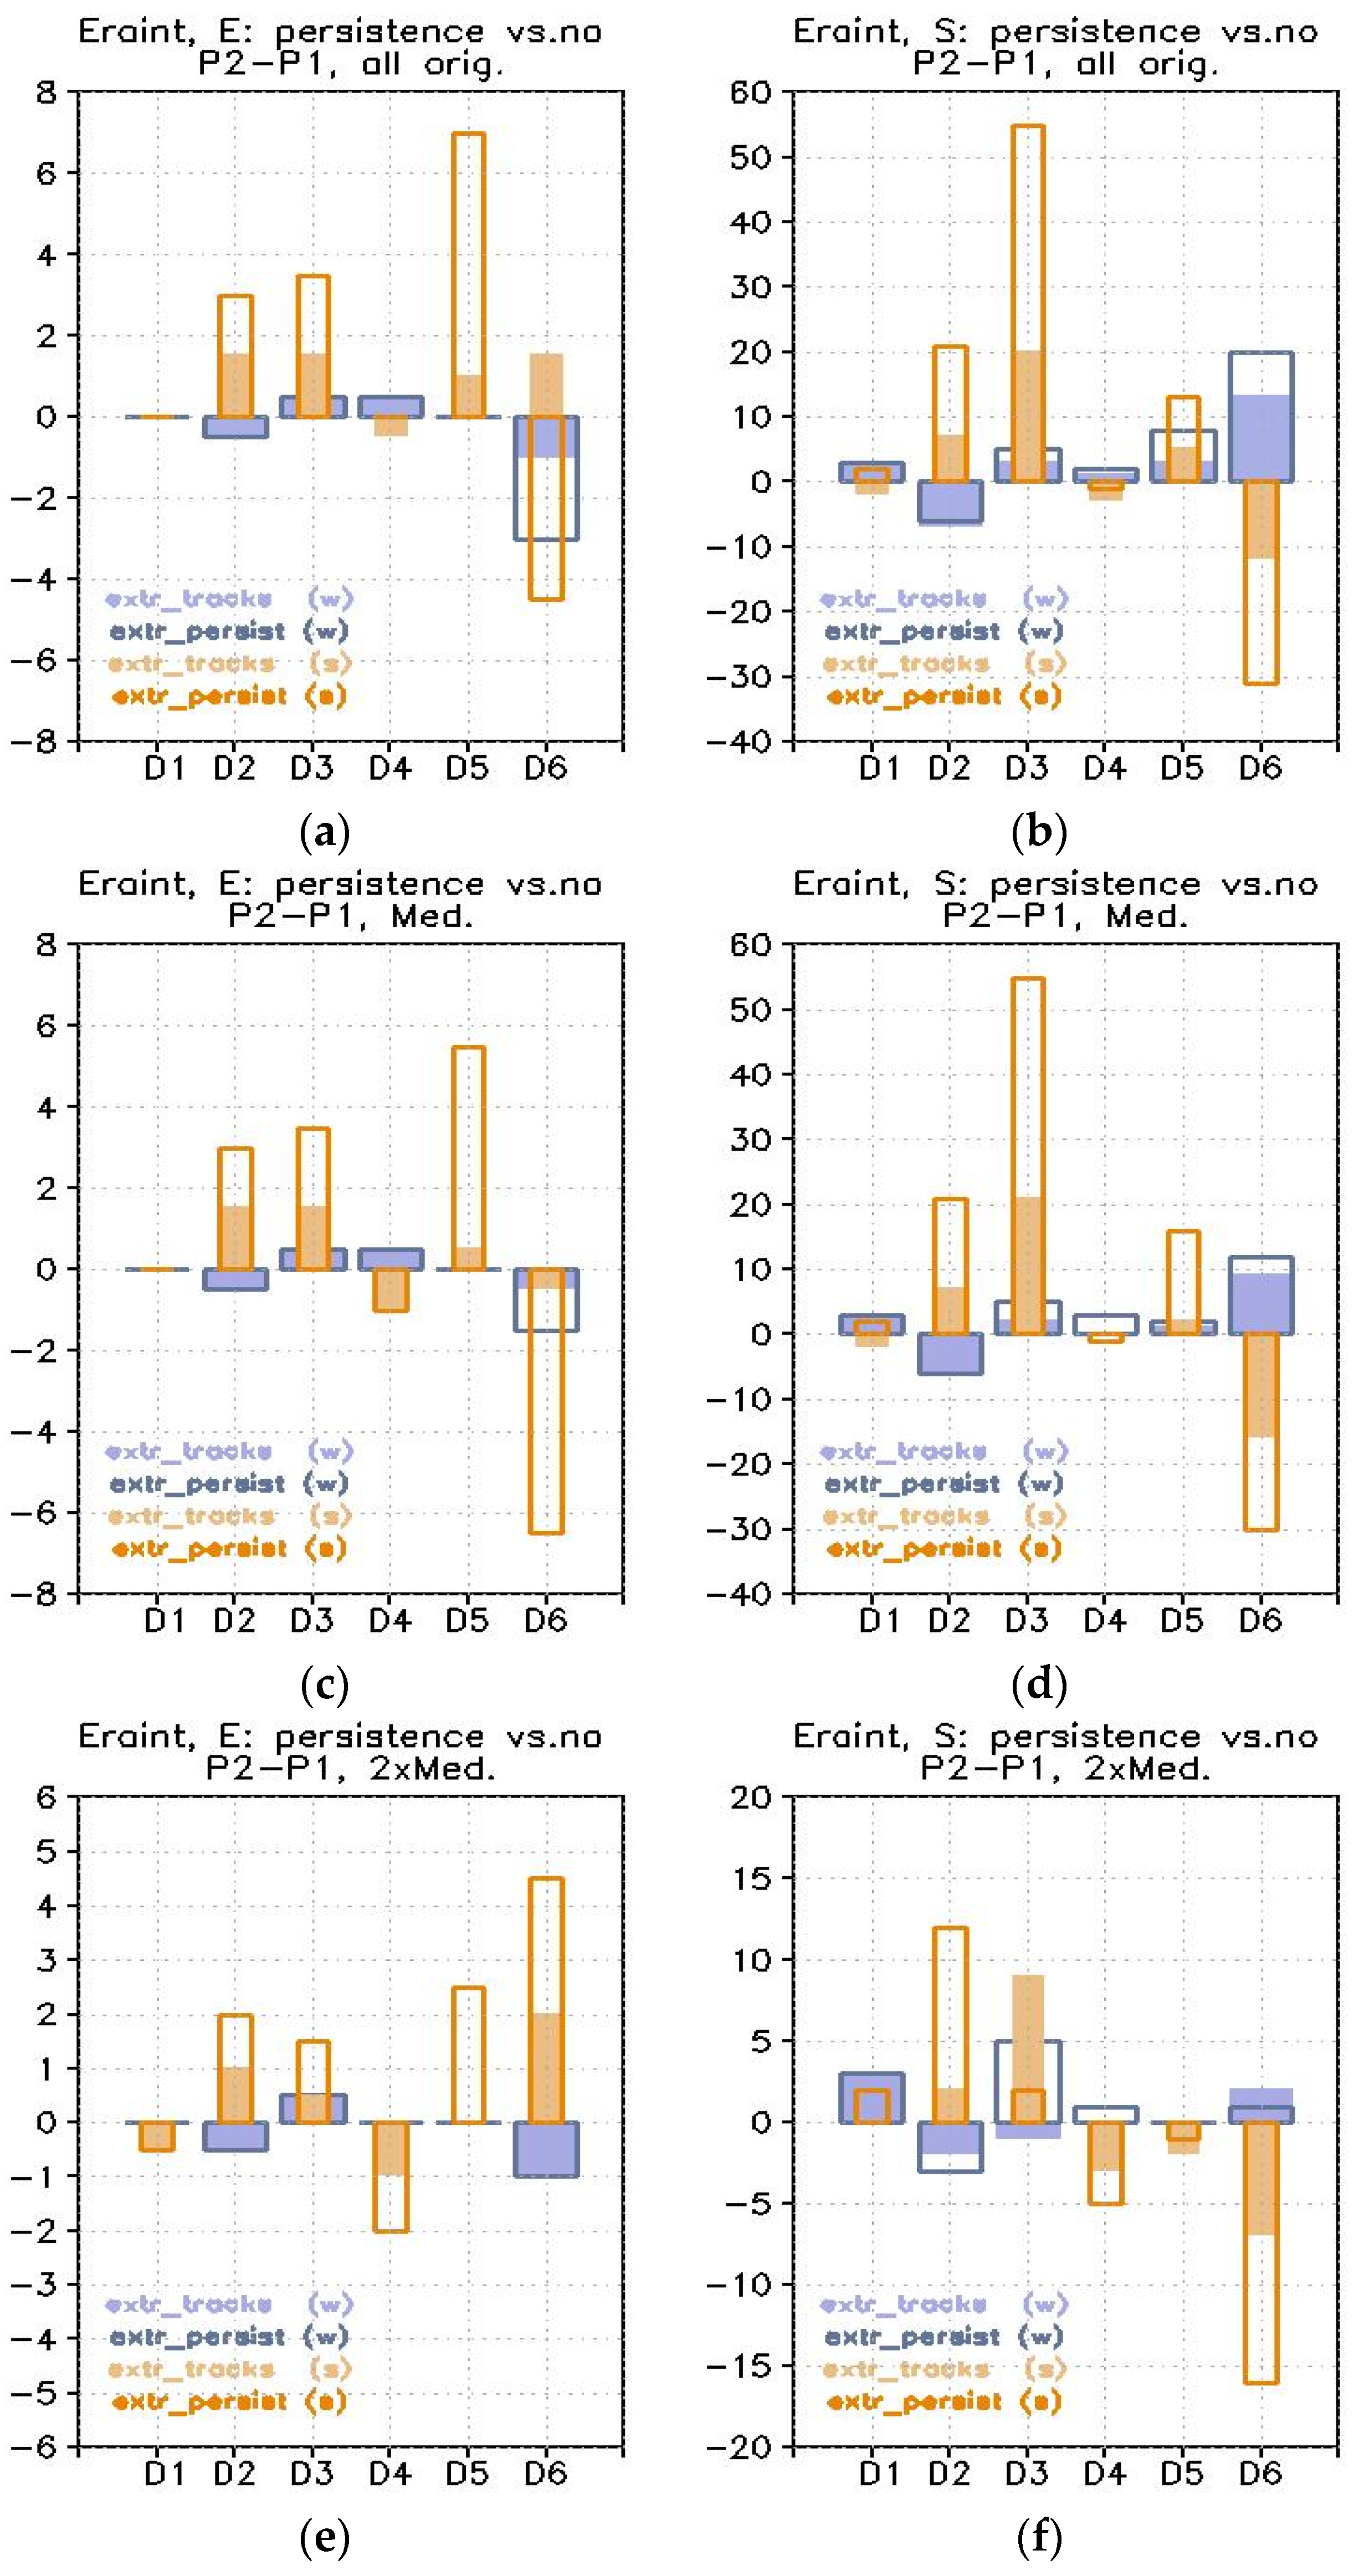
We define here the persistence of an extreme event as its time-residence in the same sub-domain of Di while still remaining an extreme event (cf. Table 3). For each season, for each origin domain and each class of severity, we compared two metrics: the number of all extreme cyclones (TC, “total cyclones”) that occurred over the Di sub-domain (with extreme central value in Di), the number of which is shown by the contour-line in Figure 6, against the number of distinct tracks leading to an extreme deepening when crossing Di (DC, i.e., if two cyclones are extreme over Di and belong to a same trajectory, we counted them once), and the number is shown by the shaded areas in Figure 6. If we define
as the differences in TC (respectively DC) in P2 relative to P1, then the cases where δT > δD indicate (Figure 6) an increased persistence of extreme cyclones in P2 relative to P1; cases where δT < δD indicate a decreased persistence, while δD > 0 indicates an overall increase in the extreme cyclone track numbers crossing Di.
δT = TC(P2) − TC(P1)
δD = DC(P2) − DC(P1)
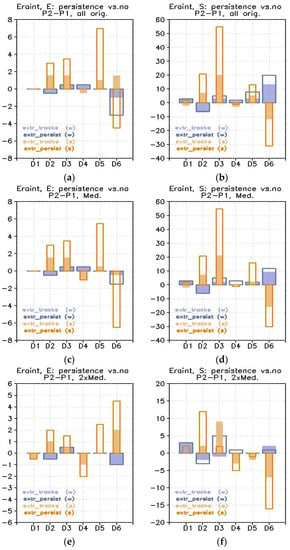
Figure 6.
Changes in the persistence of extreme cyclones per class and origin. Origins are in “EU” (a,b), “Med” (c,d) and “2xMed” (e,f) domains; extreme cyclone classes are “E” (a,c,e) and “S” (b,d,f). Shaded bars show: the P2–P1 differences between the number of distinct extreme cyclones tracks in Di (i = 1,6) and the contour lines show: the P2–P1 differences between the number of extreme events in Di (allowing for the same cyclone in a track to further deepen or remain extreme in the same Di for following time steps (6 h)); colors show differences in P2–P1 for summer (orange) and winter (blue).
Figure 6 shows changes in the persistence of extreme tracks over D0, changes that are layered by origin source and severity class (“E” and “S”) for each target sub-domain of Di (i = 1,6). The comparison of δT and δD in Figure 6 highlights the main changes. In summer the main change occurred persistently, which increased considerably (regional Di factors δT/δD > 2) for all extremes, and almost overall in D0 (Figure 6a,b). An exception is when the northeastern D0 (D6), where “EU” and “Med” northern-tracks reaching D6 may be faster (Figure 6c,d), though the opposite is when the “2xMed” tracks showed a significant increased persistence in D6 and an increased intensity, switching from “S” to “E” (Figure 6e,f). The main increase in summer persistence was seen in SE (D3) where, although the more frequent events are “S” type, the persistence caused the events to have an influence for a longer period of time (regional D3 factor δT/δD = 2.6) and to be more severe in the area in P2 than in P1. Regarding “E” extremes, these became far more persistent in the north (D5). The meridional axis of areas with increased persistence (D5, D2, and D3) was usually associated with summer blocking circulation at SE Europe longitudes.
In winter, persistence remained almost unchanged. The main changes were in the eastern part of D0. We noted a “speed-up” of “E” extremes originating from “EU” (D6, Figure 6a), coherent with an intensified jet and a decreased persistence. A slightly increased persistence of “S” type in E and NE (D3, D6) was found, potentially related to more anomalous southward shift episodes of the jet (increase found in “EU” and “Med” cases only, Figure 6b,d).
We briefly summarize here the extremes’ frequency/intensity/persistence analyses.
In winter, the main recent changes in the potential threats from cyclones are emphasized from “S”-type cyclones, which are more persistent and more frequent in P2 compared to P1 (regarding intensity, decays are noticed for D6, switching to “S” class from “E” (Figure 5); meanwhile the ”E”-type became less persistent (e.g., D6)).
In summer, changes in potential threats by cyclones in P2 compared to P1 were dominant in the “E” extreme class over the south (D2, D3) and central-north (D5) where both frequency and persistence increased. For the northeast (D6), special attention was paid to the particular “E” tracks originating from “2xMed” that reached D6 and persisted longer, in spite of the overall extreme decreases there. Regarding “S” class in summer, the southeast (D3) appeared most vulnerable where the persistence and frequency of the class showed significant growth. This is due to a summer blocking, apparent in the pressure trends (and pressure difference, P2–P1, Section 3.3) that prevented tracks from crossing northwards and thus increasing their number and persistence in the south–southeastern areas (D2, D3) and decreasing in the northeast (D6, Figure 6a,b).
3.3. Mechanism of Extreme Tracks Changes
The summary of our findings points to an increased summer persistence and extremeness for the south and southeast of the target domain (D2, D3) and a decreased extremeness for the northeast of the target domain (D6). In winter, changes were of a smaller amplitude, with the main signal regarding extreme numbers increasing for the northeast (D6) and decreasing in the south (D2). We further investigated possible causes for this response.
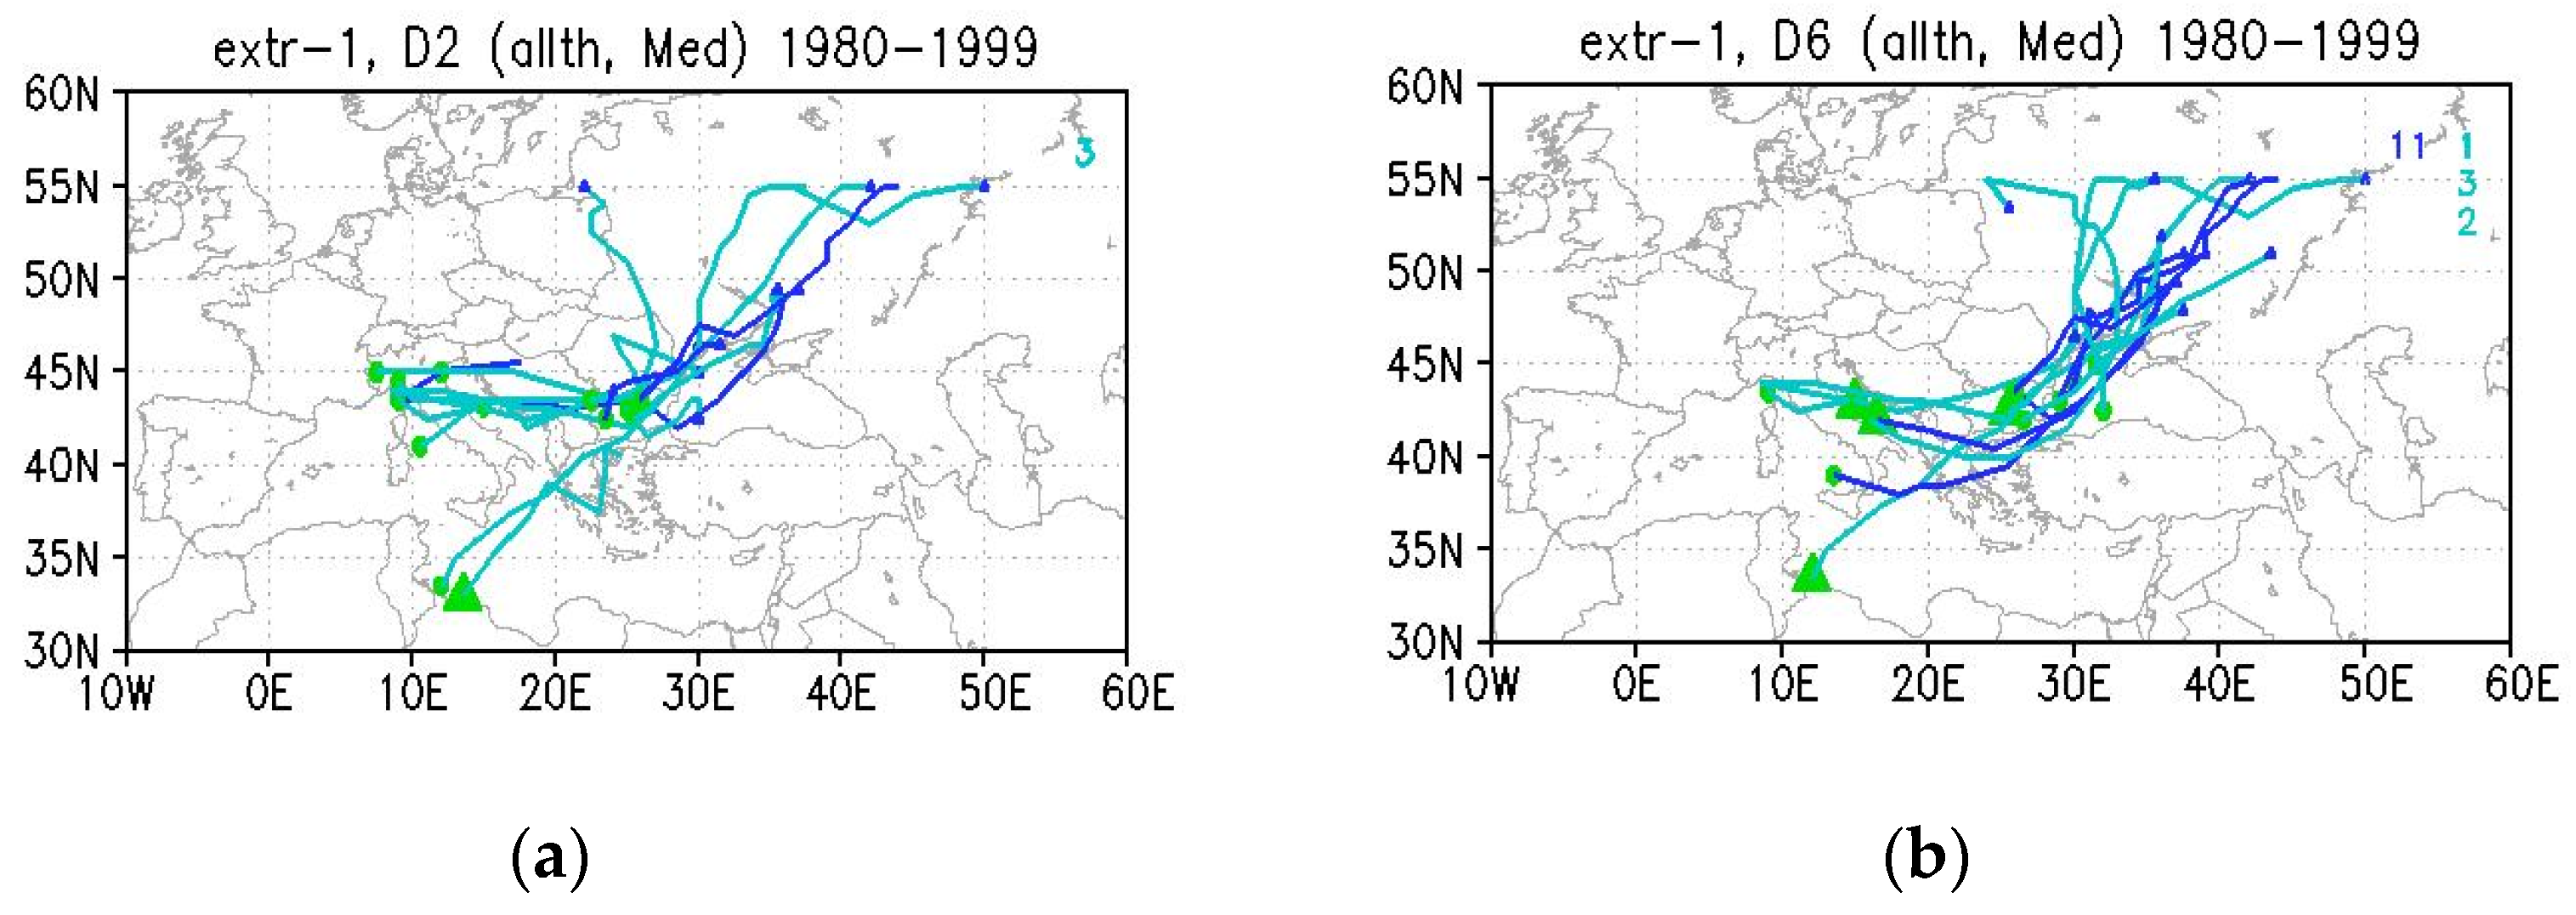
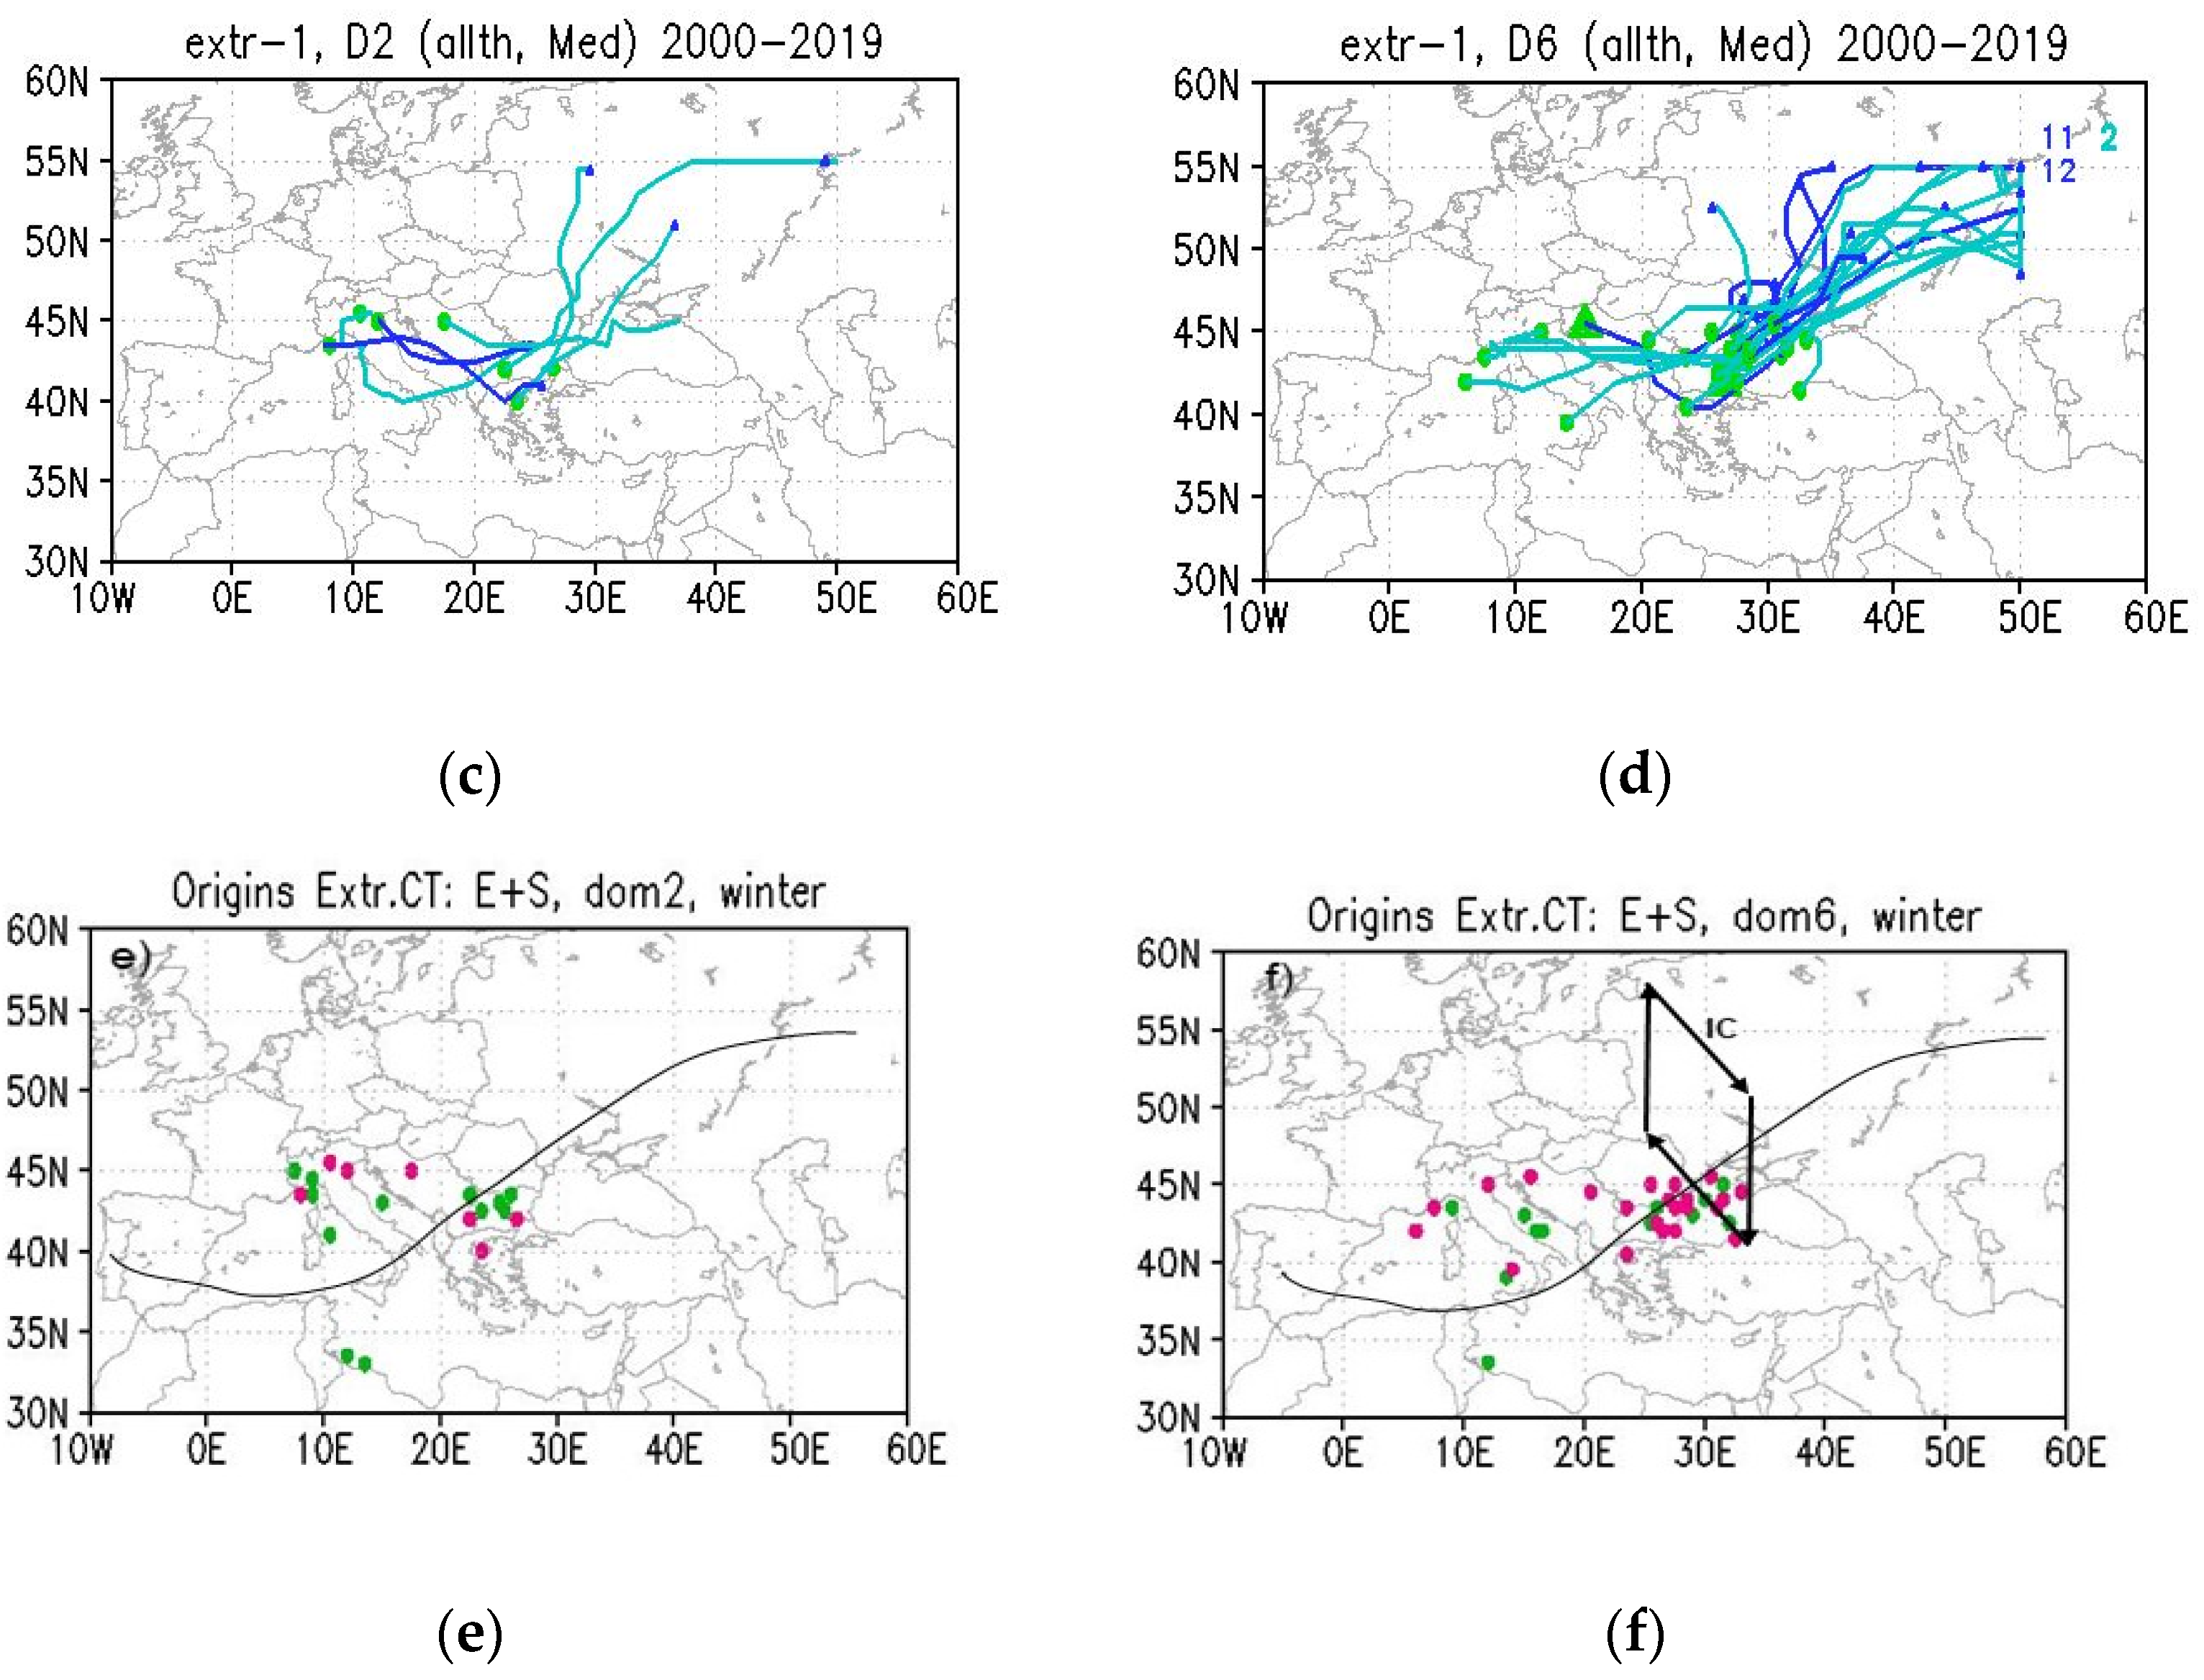
We compared the distribution of extreme storm tracks in P2 against P1 for winter and summer. Analysis of these tracks emphasized two main aspects: the first was related to changes in origins. For winter (Figure 7), we noted that tracks leading to extremes over D6 (and which were more frequent in P2) have farther West–Southwest origins in P2 than in P1 (Figure 7b,d). This is was a characteristic of the stronger extremes for DJF months (when a jet is well developed) along P0 (P1 + P2), as seen in Figure 7, and was in agreement with previous studies showing that extremely severe Mediterranean winter cyclones are characterized by a longer lifetime [63]. Opposite to this, tracks leading to winter extremes over the southern region of D2 (which became less frequent in P2) presented less shift in the origins and less zonality (kinetic energy) of mean tracks (Figure 7a,c). We note that Figure 7b,d also indicates that “E” extremes in D6 became more frequent earlier, switching from JFM months in P1 to late autumn (ND months) in P2 (which is also the period reported for having the heaviest rain for the Eastern and Western Mediterranean Sea [64], respectively; hence, a westward shift of origins would be coherent with more extreme tracks in autumn).
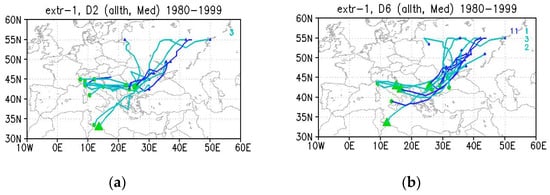
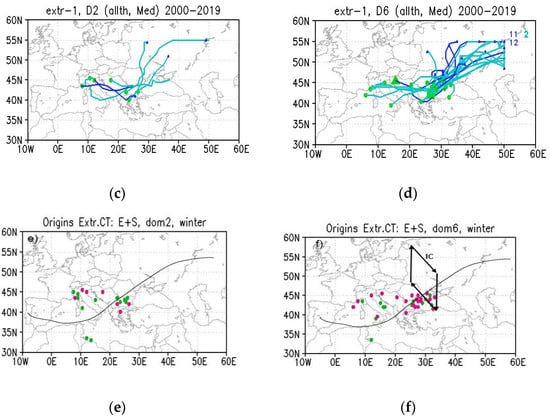
Figure 7.
Tracks of extreme cyclones for P1 (a,c) and P2 (b,d) over domains: D2 (a,c) and D6 (b,d), in winter (blue lines), “Med” origins (green dot for origin). (a–d) Dark blue represents October, November, December autumn-originating tracks (OND); light blue represents winter (January, February and March) tracks; the month when “E” extremes reached Di is shown in the upper-right corner; in addition, “E” extremes show a full triangle mark for the origin (the “S” extremes have a full circle); (e,f) origins of the extreme tracks in P1 (dark green) and P2 (plum) for winter, for D2 (e) and D6 (f); black line schematizes the location of anomalous displacement of polar jet from zonality in P2 relative to P1 in months ONDJFM. The indirect circulation (IC) in the jet streak exit area is schematized in Figure 7f.
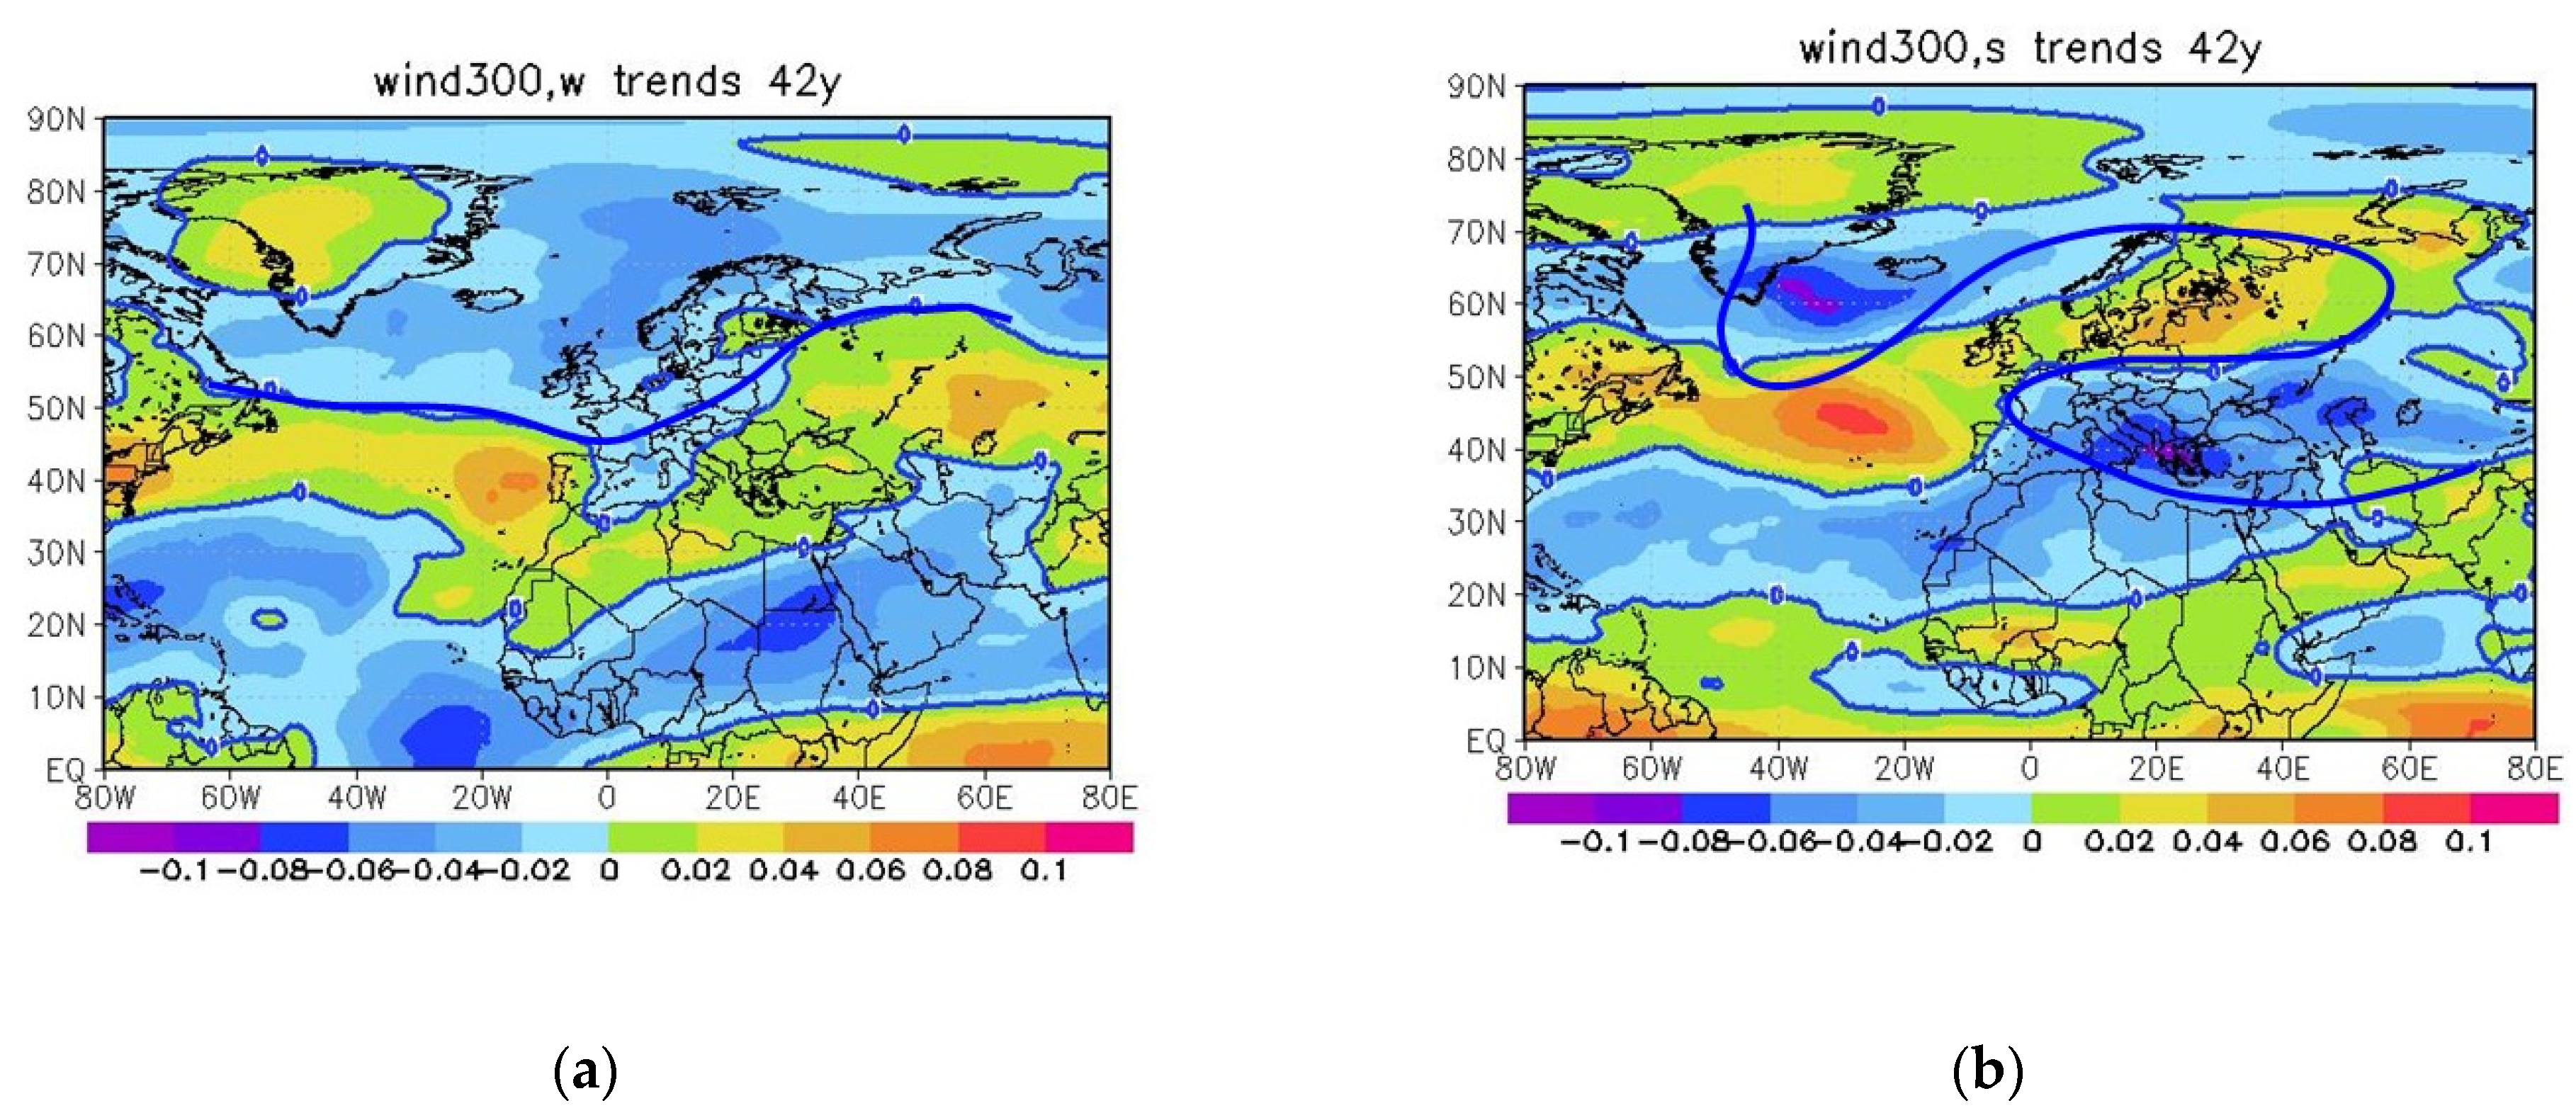
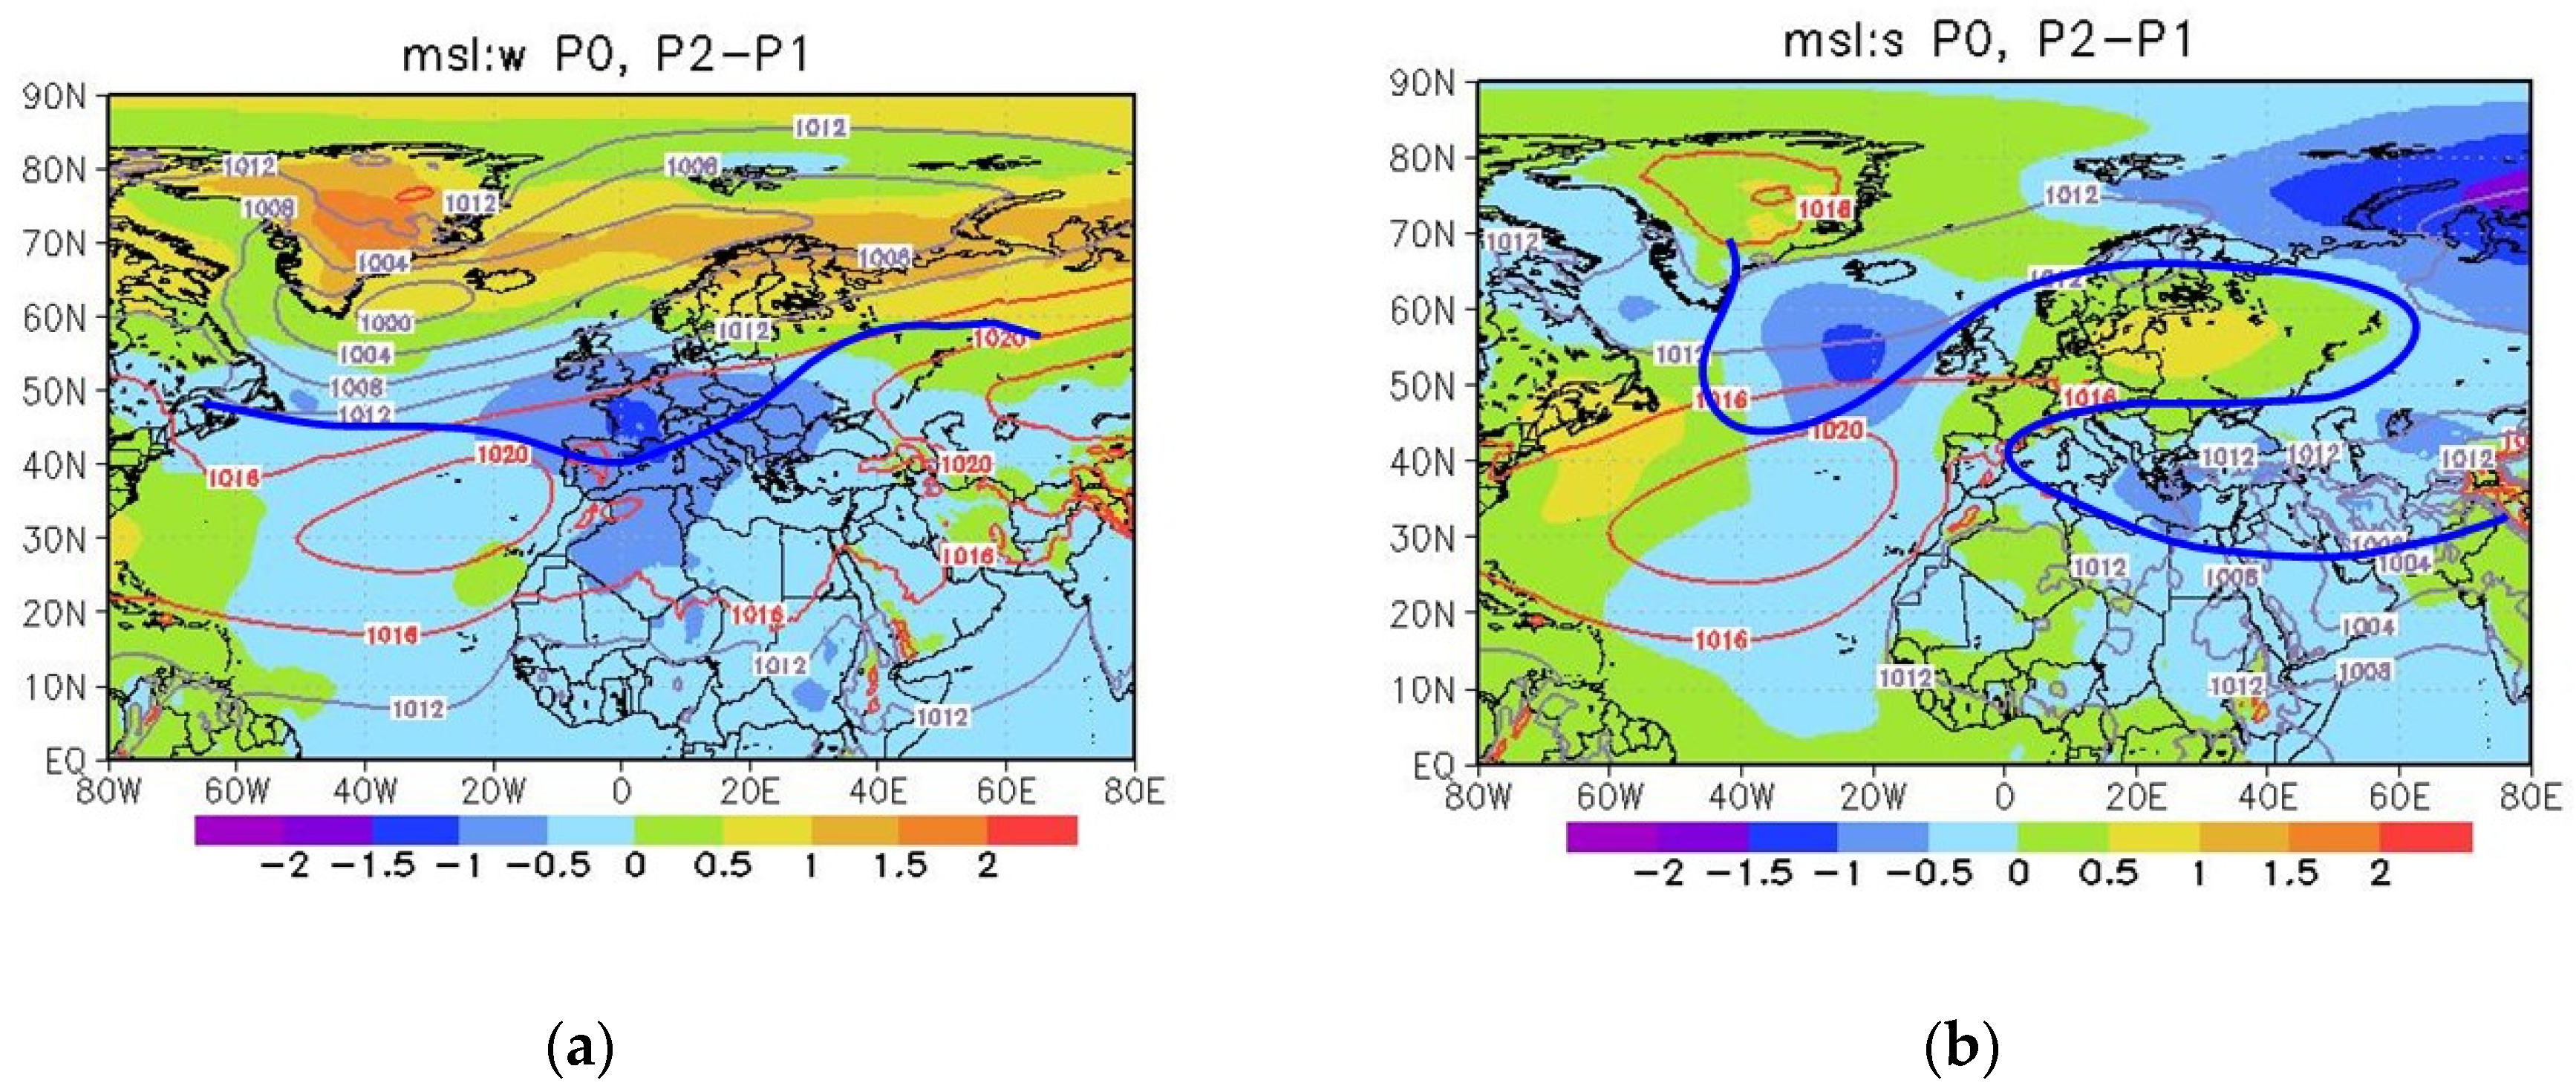
The second aspect relates to changes in the upper level polar jet. Figure 7e,f schematizes the relation between the position of the upper level wind anomaly at 300 hPa (Figure 8a) as a proxy for jet displacements and tracks in P2 compared to P1. We note that for winter there was a broad and deep anomaly in P2 relative to P1 over the Eastern North Atlantic and Western–Central Europe that descended as a geostrophic thalweg anomaly to low latitudes at about 35°N (Figure 8a) and to the lower troposphere with a signature in the surface (Figure 9a). Related to extreme tracks, this anomaly positioned most of the D2 extremes’ origins far westwards of its upwards branch, while the D6 extremes’ origins were close to the anomaly jet’s upwards branch, just along the surface signature of the indirect ageostrophic circulation (left exit), which allowed enhancement of the surface lows and favorable conditions for extreme deepening over D6.
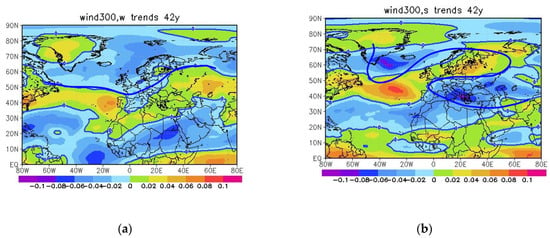
Figure 8.
Wind magnitude at 300 hPa difference (P2–P1) (shade) for winter (a) and summer (b). The blue thick line is the smoothed zero line conceptualizing mean displacement from zonality in P2 relative to P1.
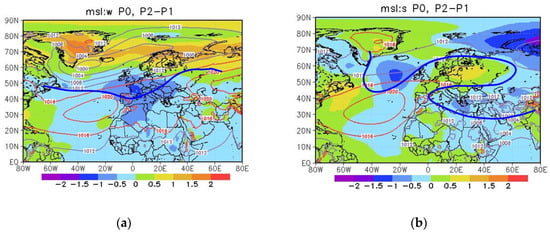
Figure 9.
Mean sea level pressure difference (P2–P1) (shade) for winter (a) and summer (b). Isolines show the 40-year mean MSLP; the blue thick line is the zero line of the 300 hPa wind anomaly (P2–P1) from Figure 8.
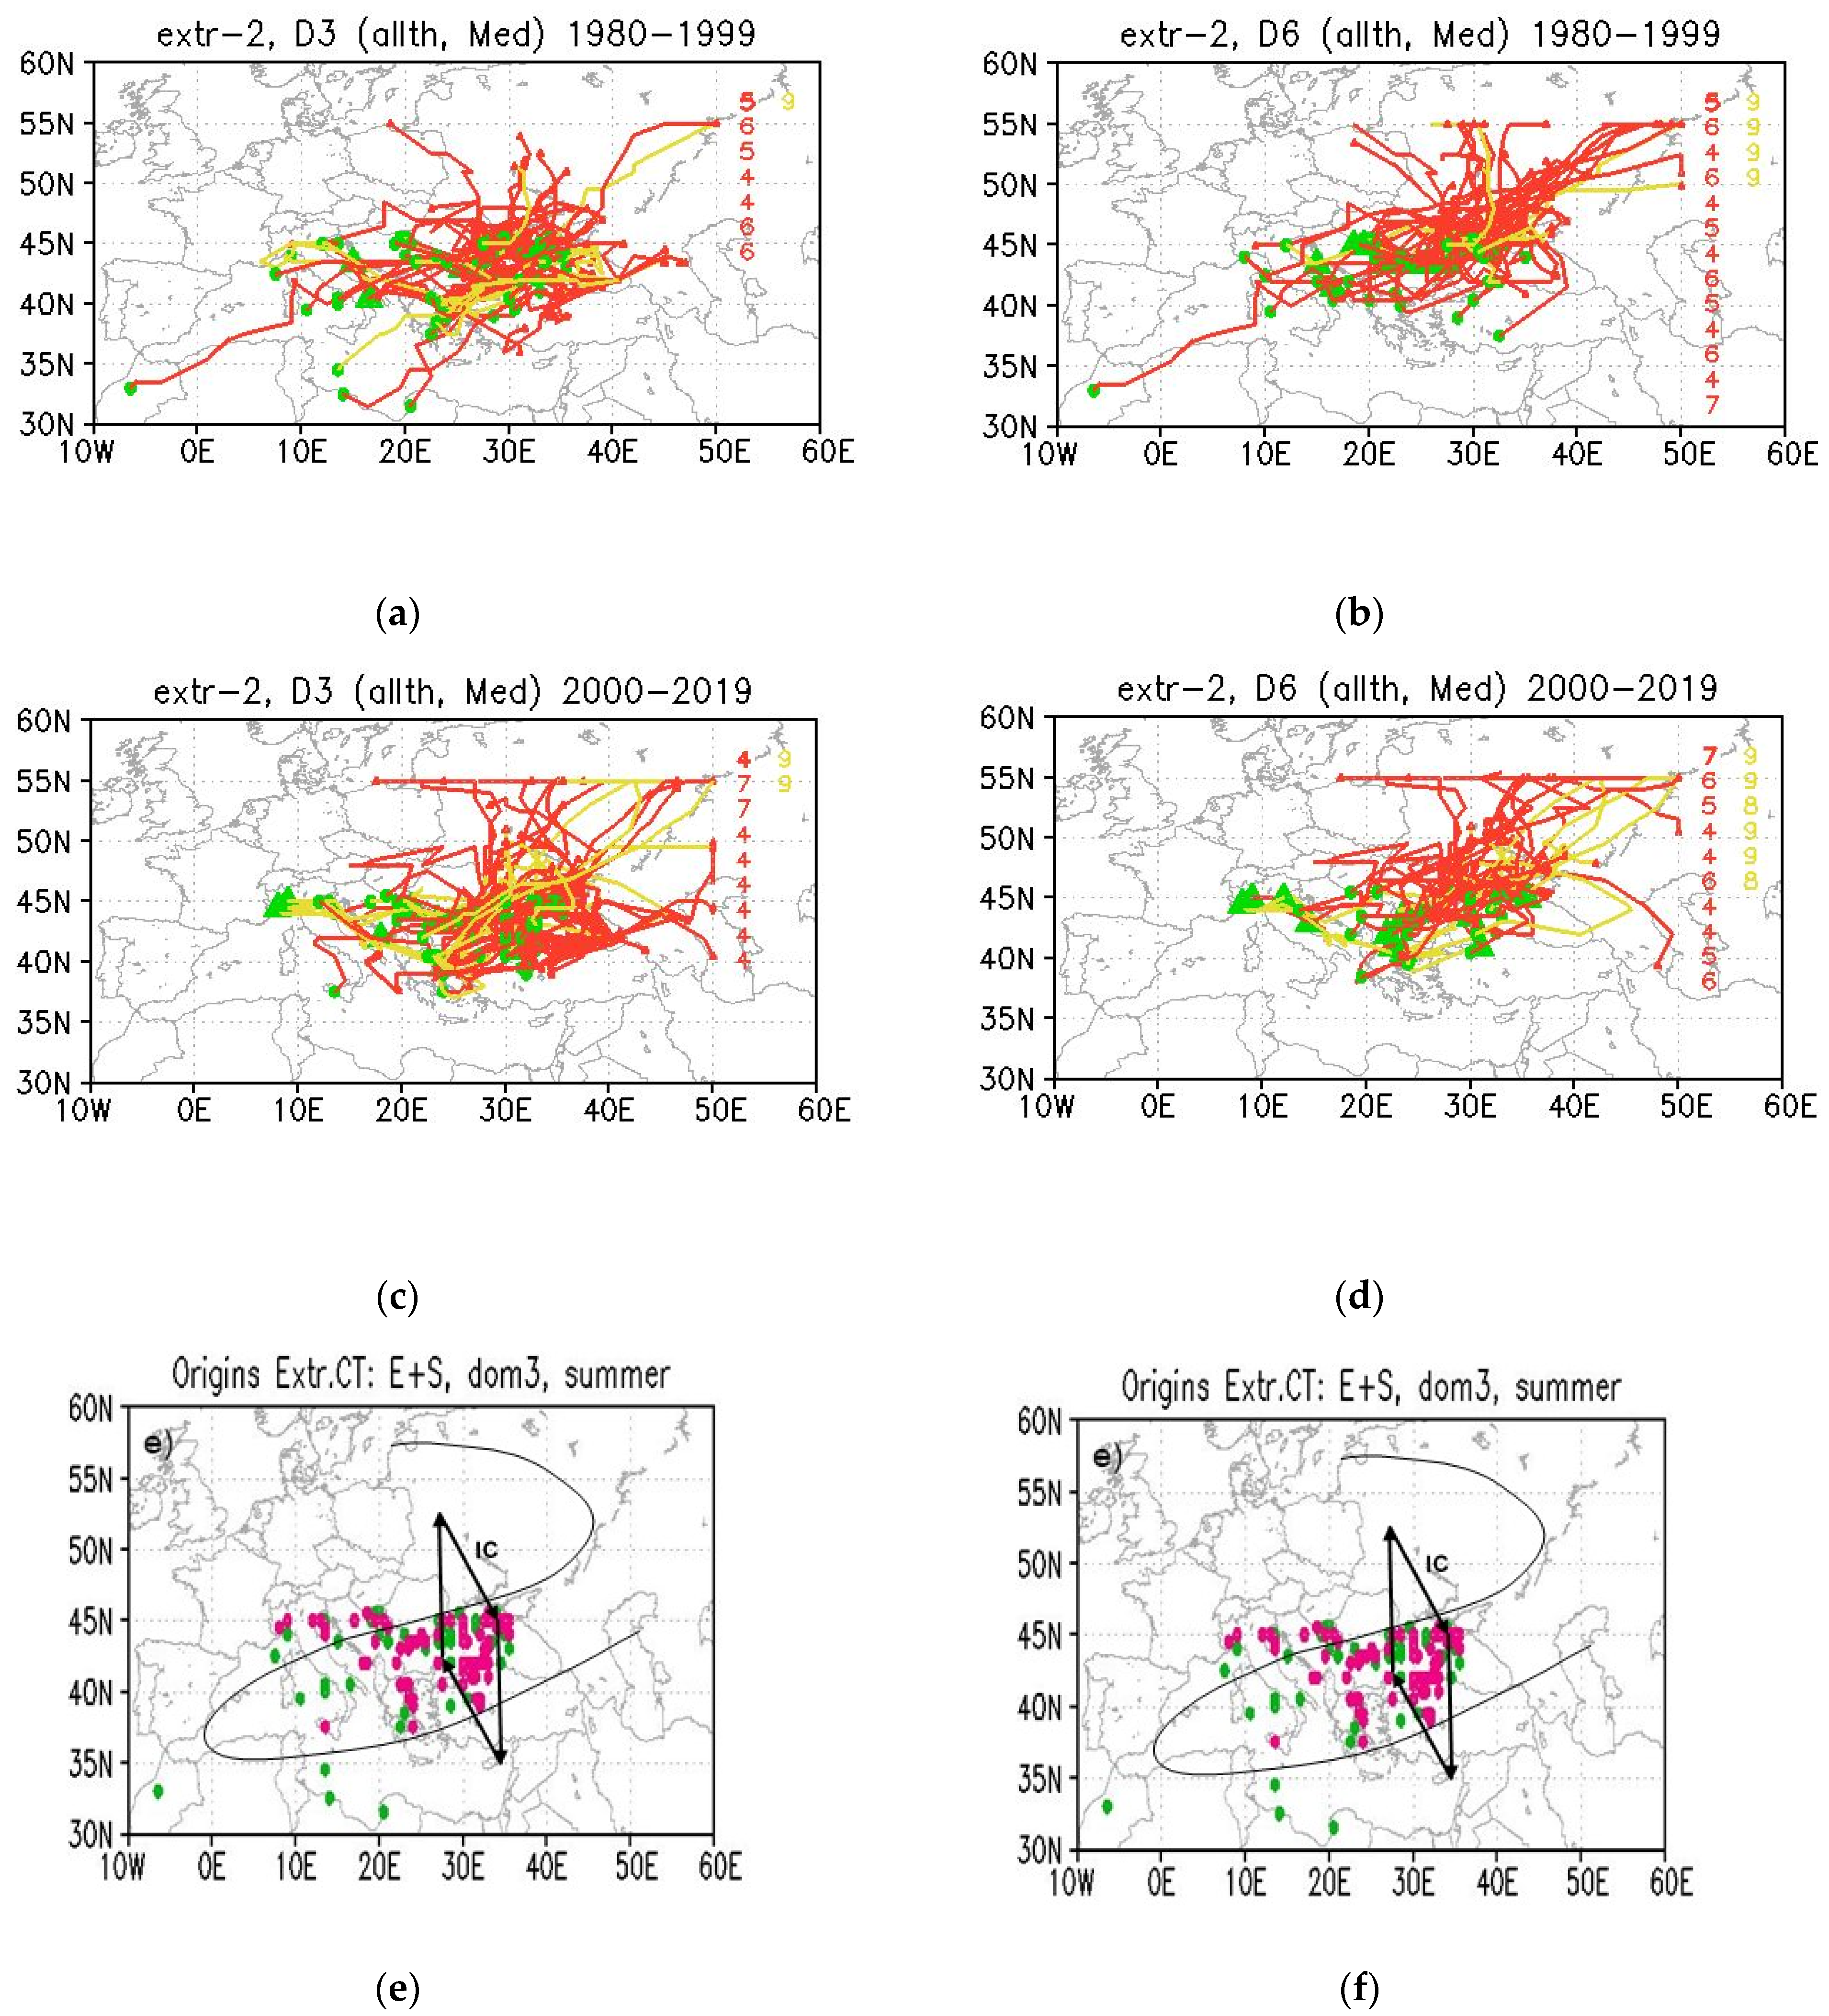
Looking now at the extreme summer tracks in Figure 10, for D3 and D6, where the most important changes in extremes are seen (Figure 5c,d), we note, as with winter, a polar jet anomaly in the troposphere, but this time, of a blocking-type that was centered on South Finland (in Figure 8b, which is a northeastward tilt of the summer mode found in previous studies [43]). The same patterns of Figure 8 were identified in the field of trends over P0. Further, regarding winter, we analyzed its interaction with extreme track paths at lower levels. In P2, the origins of the extreme tracks over D3 had southernmost origins and fit the upward branch of the jet anomaly, mostly on the streak exit side of the ageostrophic circulation (illustrated in Figure 10e), which provided a mechanism for the enhancement of extremes. Opposite to this, tracks leading to extremes over D6 mostly had origins at higher latitudes and were aligned along the downward branch of the jet anomaly (i.e., outside the area of positive vorticity advection, Figure 10f) that provides a mechanism for damping the extremes in D6. Moreover, origins appeared to be shifting in P2 in the southeast in interaction with the blocking for D3, which favored an enhanced supply of latent heat (deeper cyclones following southern origin tracks [22]). We also note the same tendency of time-shifting “E” extremes towards autumn ASO months in P2 compared to P1 (Figure 10c,d), similar to winter.
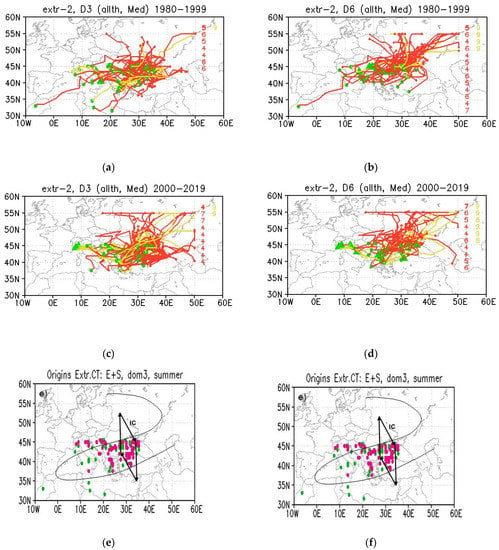
Figure 10.
As in Figure 7 for the summer domains: D3 (a,c,e) and D6 (b,d,f): (a–d) dark red is for late spring-originating tracks (AMJ) and yellow for late summer (JAS); (e,f) black line schematizes the location of anomalous displacement of polar jet from zonality in P2 relative to P1 in summer AMJJAS. The indirect circulation (IC) in the jet streak exit area is schematized in Figure 10e.
The mechanism emphasized here for the regional changes in extremes relies, in both seasons, on enhanced coupling between climatological extreme surface tracks and the upper-level mean anomaly of potential vorticity advection. This, together with enhanced moisture (here through southward origin shifts) were also shown to be statistically linked to extreme precipitation over the Mediterranean region [34,65]. To summarize, the key element of the regional extreme variabilities appeared to be linked to the jet anomalies in the Euro–Atlantic sector. These anomalies, emphasized in the last few decades (P2–P1, Figure 8), seen also in the P0 trends, are further discussed in Section 4 for both winter and summer.
We further analyzed the potential links between large-scale drivers and the seasonal storm track variabilities.
3.4. Links between Inter-Annual and Seasonal Storm-Tracks and Teleconnection Modes Variability in Latest Decades
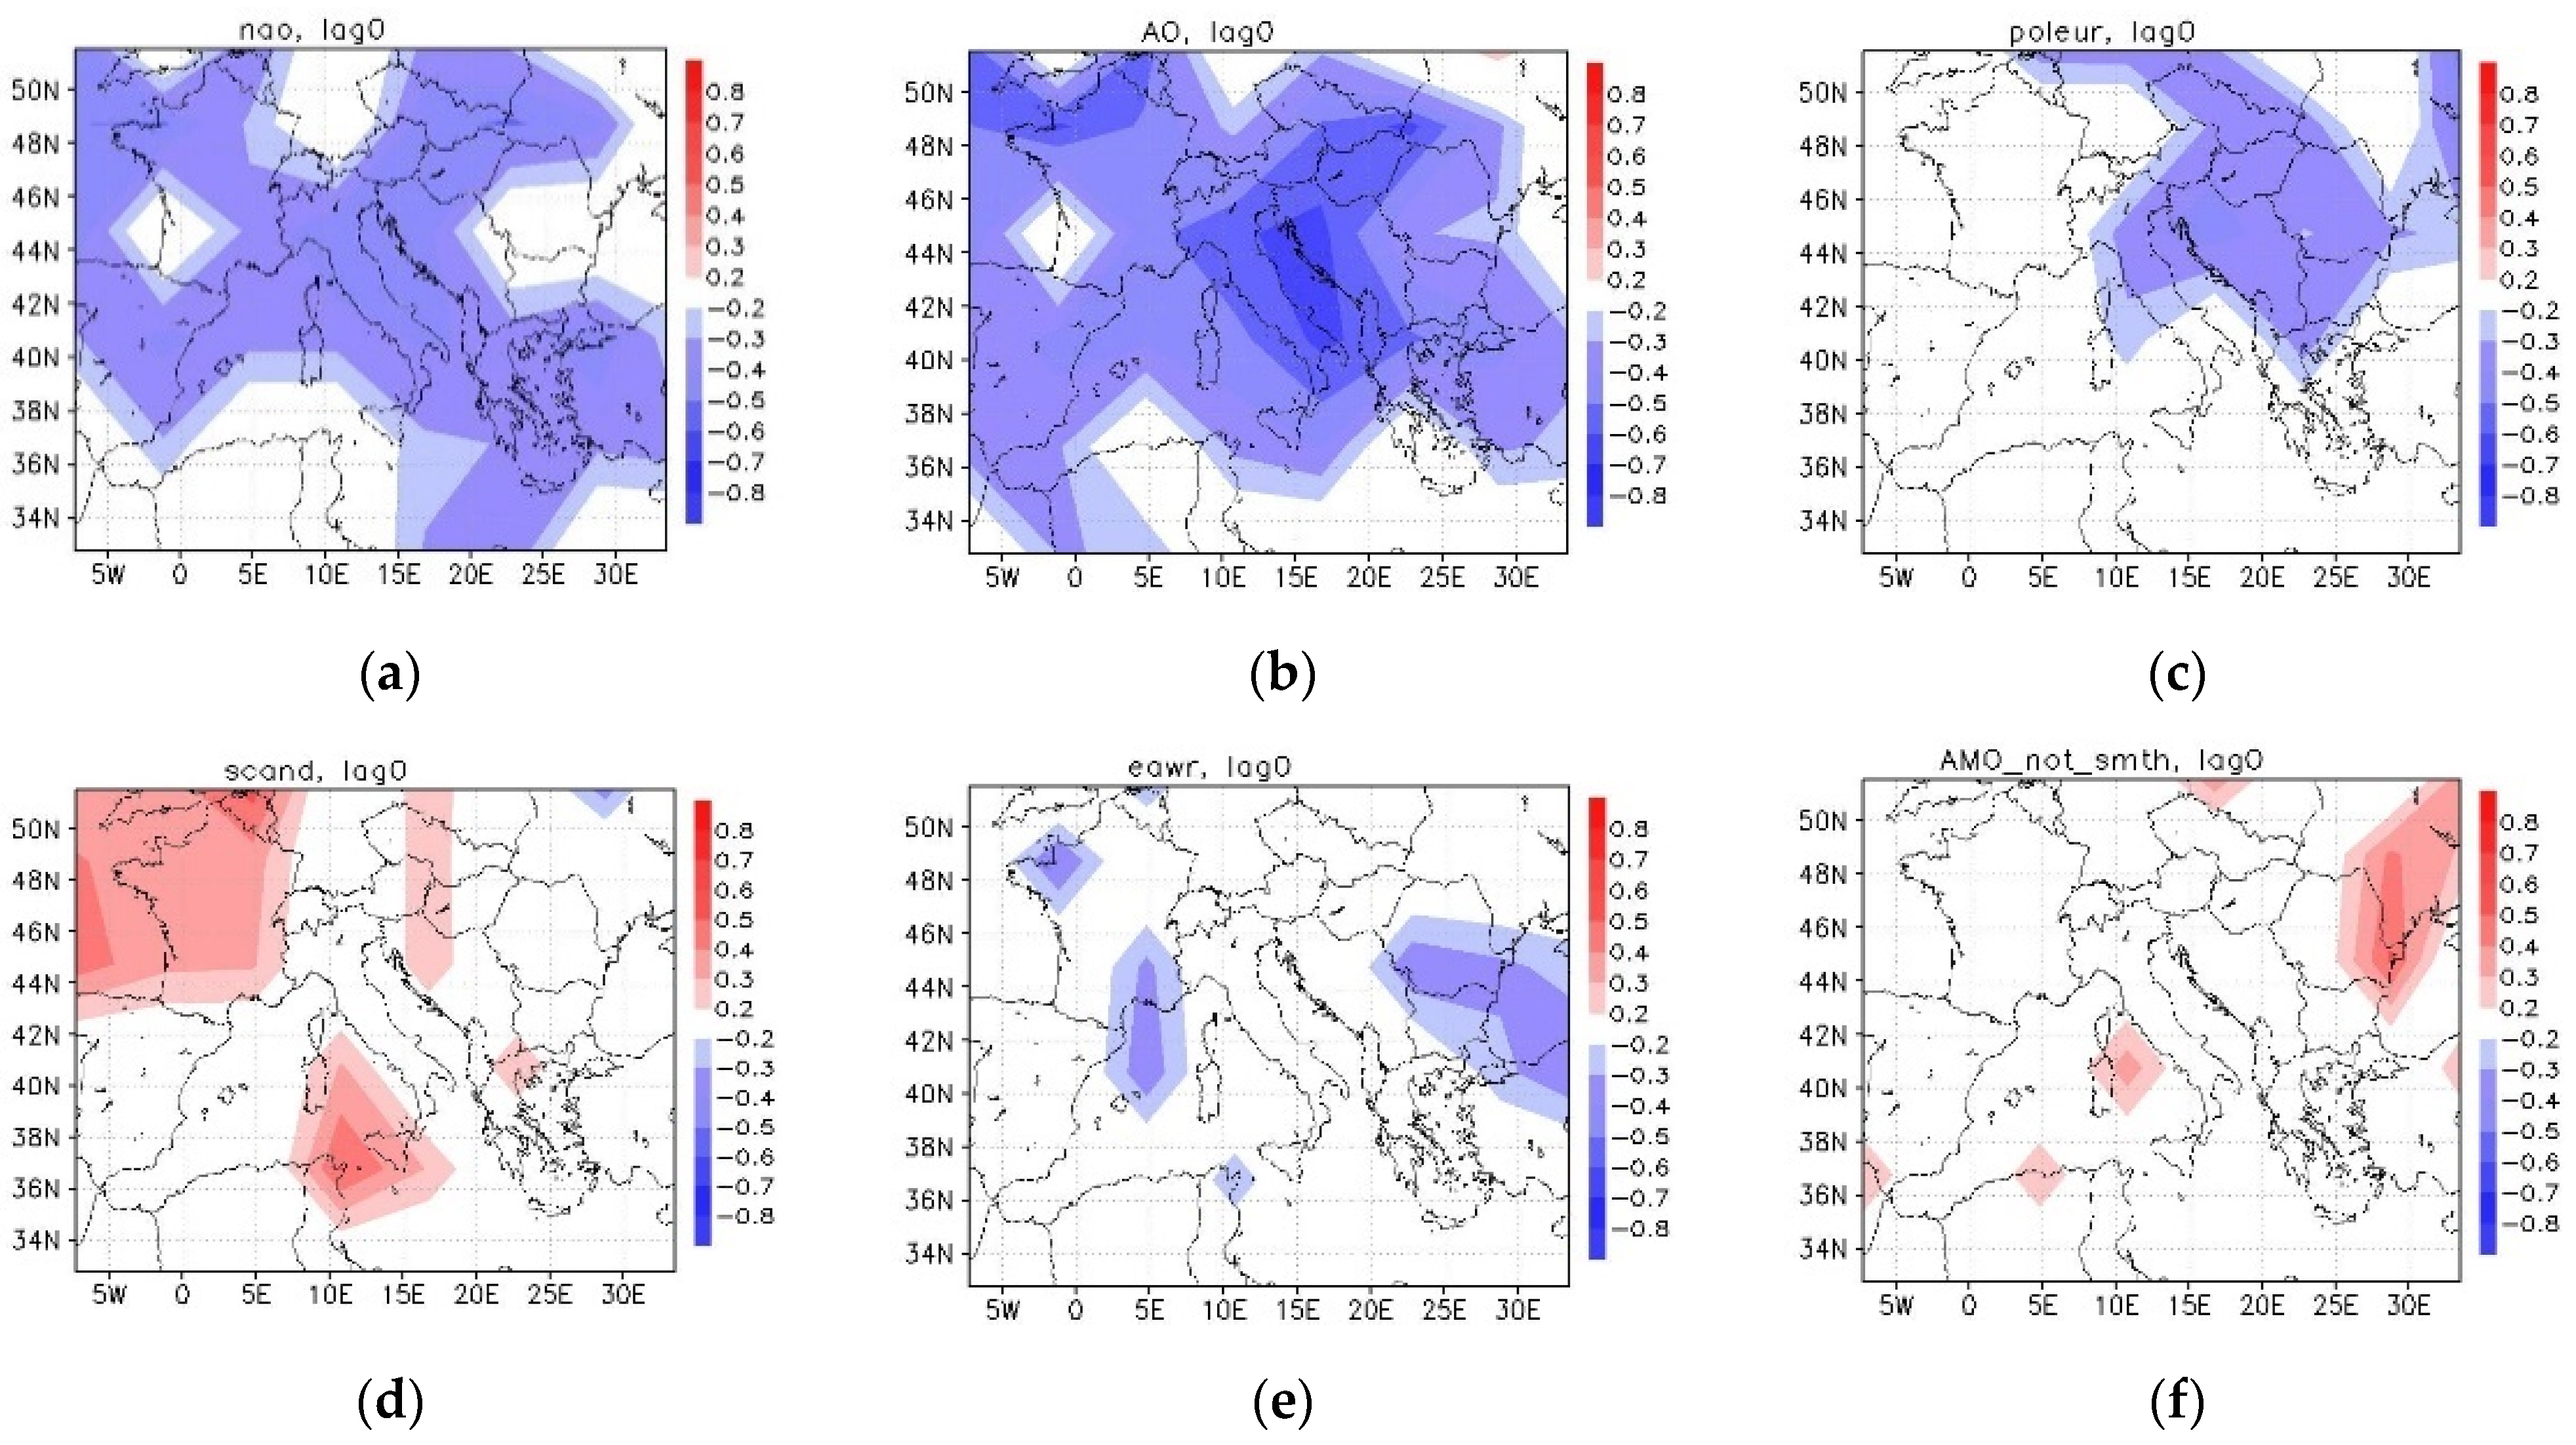
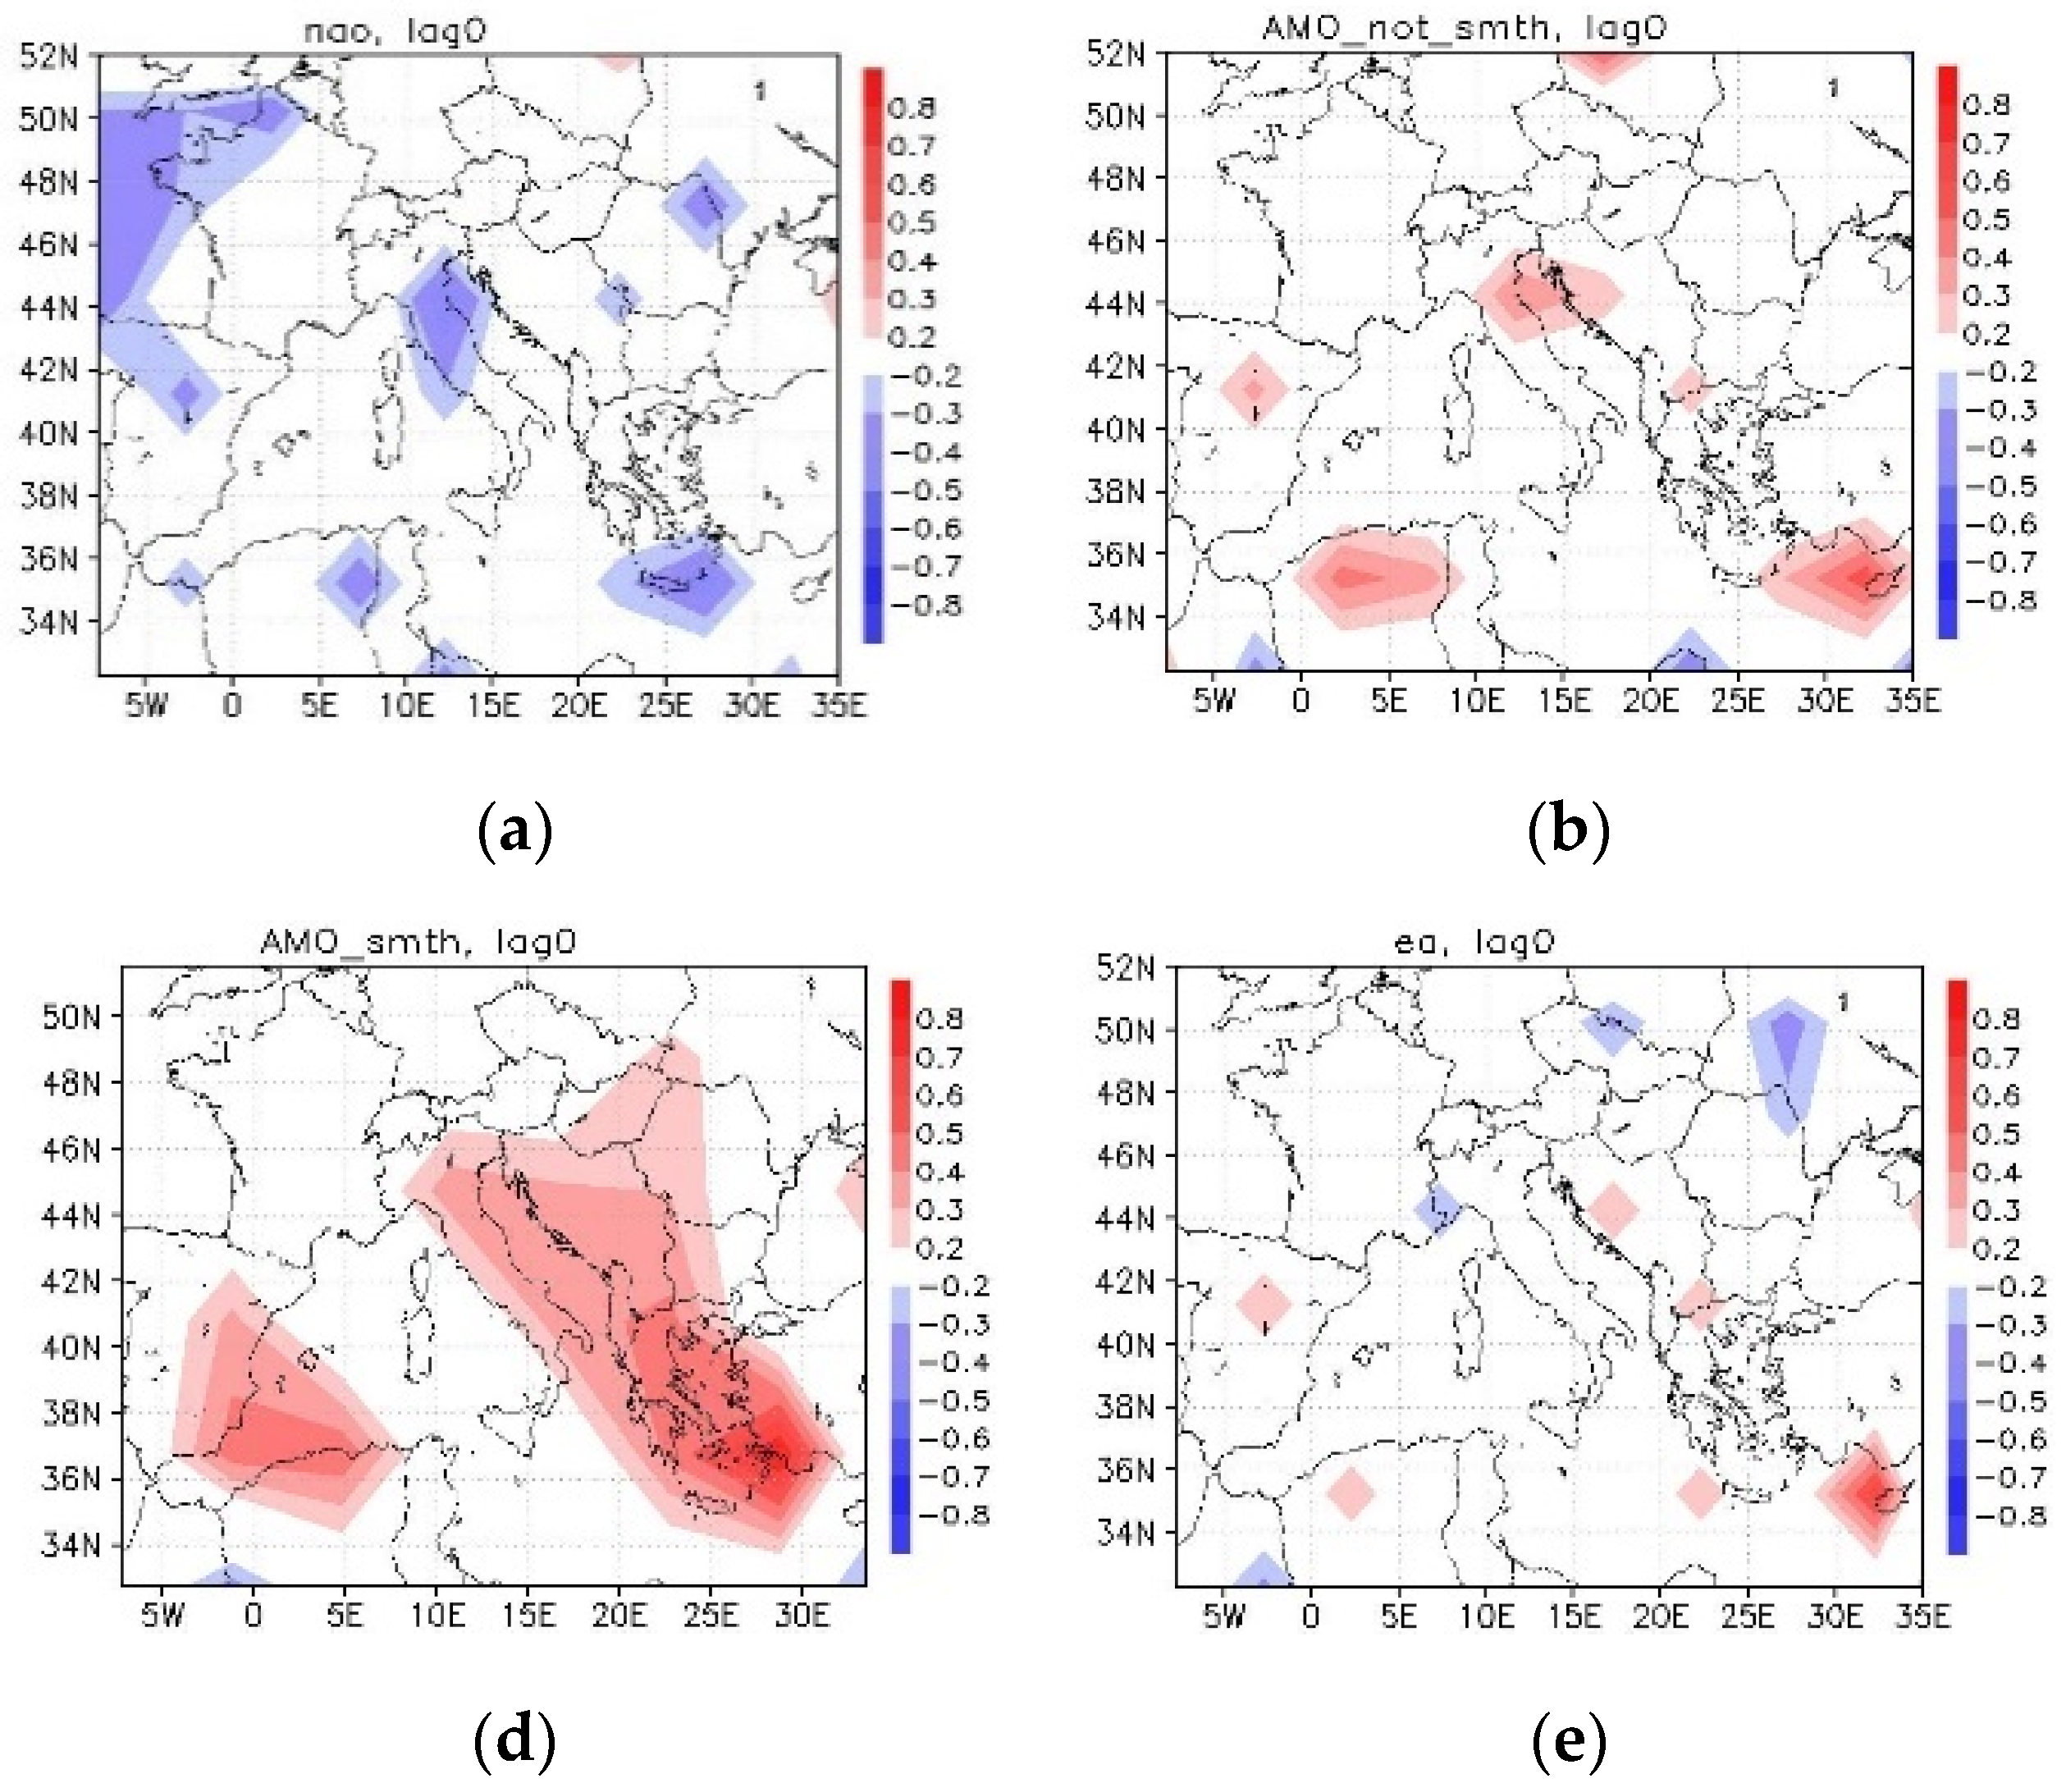
For the six-month seasons (winter in Figure 11 and summer in Figure 12), we performed a one- and zero-year lag correlation analysis between storm-track numbers and the main modes of pressure variability (Table S1) over the full P0 time interval. The main areas of significant correlations were generally obtained at zero lag, but we identified regions where the modes were leading storm tracks one season ahead; in addition, for some modes, maximum correlations regionally indicated storm-tracks leading the modes of variability up to the following year (shown in Table S1).
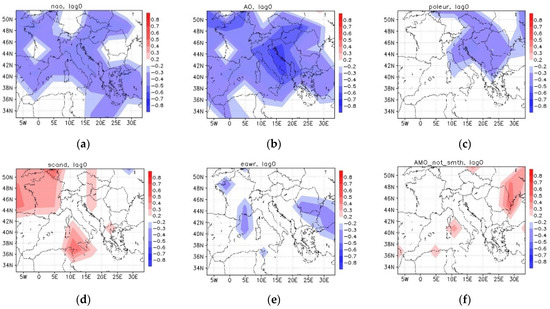
Figure 11.
Correlations: zero lag between the atmospheric modes and the mean number of tracks in boxes of 6 × 4 degrees lon x lat, for months ONDJFM. The modes are: NAO (a), AO (b), PE (c), SCAND (d), EAWR (e), AMOs (f). Time interval is P0.
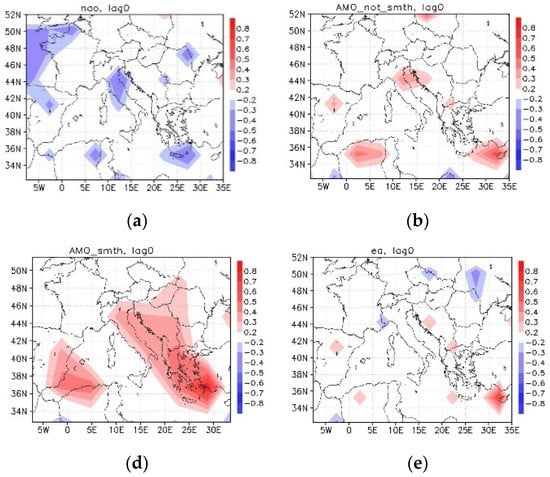
Figure 12.
As in Figure 11, for summer (AMJJAS). The modes are: NAO (a), AMO (b), AMOs (c) and EA (d).
The results showed that, during winter (Figure 11) in Central Europe, the storm track numbers decreased in relation (zero lag) to the combined action of +AO and +NAO (both had small positive winter trends in P0 and P2), as shown in S3 (note that the same modes also related to a significant decrease in storm numbers over the Adriatic Sea—Figure 2a). This also increased over P0 with the +SCAND mode over Western Europe (SCAND has a positive winter trend in P0), (Table S3) and also increased over Central–Eastern Europe with the -PE mode (PE had a decreasing trend in P0 and P2 (Table S3)). These modes in their positive phases (apart from SCAND being negative) favored the winter conditions of a strong polar vortex. Hence, the quasi-meridional anomaly thalweg in P2–P1 over Western Europe (and the tracks that shifted eastwards over Europe, Figure 2a) appeared as a feature derived from the combined action of the opposing trends of these contributions where the negative PE trend dominated over P0, (Figure S2). This dominant driver over P0 (Table S3) was consistent with a winter polar jet shift southwards, discussed in Section 3.3. The +SCAND mode also favored European tracks that formed over Southwestern Europe, by blocking the air-mass over Scandinavia and splitting the jet southwards; its trend change to negative in P2 was related to the decreasing track numbers in SW Europe (Figure 2a).
Regionally, the Central–Eastern European tracks showed the highest correlations, with more tracks under -PE and -AO in this area (the -NAO impact is limited south of the East-Mediterranean/Aegean Sea). Then, in Southern and Southeastern Europe (Figure 12) the increased number of tracks were related to -EAWR (EAWR had a negative trend in P0 and P2, (Table S3)) and to +AMO’s northern teleconnection branch (AMO had a positive trend in P0 and P2, (Table S3)). These trends were in agreement with the winter tracks over Europe in Figure 2a, and with previous studies pointing to -EAWR as being mainly related to the southern origins of storm tracks over Eastern Europe [66].
During the warm season, areas of significant correlation were isolated more regionally (Figure 12). The main changes in storm tracks showed an increase along the paths: Eastern–North–Atlantic–Southern UK to the Adriatic Sea–Southeastern Mediterranean and the path of the Southeastern Mediterranean–Aegean Sea (Figure 2b). These appear linked to phases of -NAO (NAO had a slight negative trend in summer for P0 and P2, (Table S3)), and to AMO (in its southern teleconnection branch and with a higher co-variability on decadal time scales), as well as to the EA mode (positive trend in P0 and P2 (Table S3)). These phases allowed stronger westerly and northwesterly latent heat advection over Europe and favored summer blocking-type mid-tropospheric structures [67] over NW Europe, discussed in Section 3.3. Meanwhile, the EA mode appeared to be related to track decreases over the Eastern Atlantic–Northern Portugal–Northwestern Mediterranean (French Coast to the Genoan Gulf, Figure 2b), and also Northeastern Europe, since this mode controlled the northwards/southwards shift of about 45° N of the zonal area of precipitation over Europe in its respectively positive/negative phase [67]. A main increase in summer should be noted over the Southern Anatolian Mountains—which was the main cyclogenesis area for the Eastern Mediterranean. This increase was related to a few contributing factors (Figure 8b): the southern Scandinavian blocking trend allowing the broad low-pressure trend anomaly over the Northern Arabian Peninsula and an eastward shift of the Azores anticyclone (Figure 8b) favoring track merging with the low-pressure system over the Arabian Peninsula, shown to be preconditions for Eastern Mediterranean cyclones [68]. As previously shown, no single mode is enough to explain the variability of cyclone counts, although agreement on modes NAO, EA, SCAND, EAWR, and PE, identified as main factors for Europe, has been reported [69]. Leading correlations of storm tracks here were mainly sourced (not shown) over the seas: the Atlantic and the Western Mediterranean Sea, interactions were further reflected in the slow variability.
We note that trended and untrended correlations indicated quite similar links and the main areas of significance along the year (Figure S3). These similarities point to contributions from the external forcings that regionally prserve the remote links signal between the modes of variability and the storm-tracks along P0. However, mainly in the Southeastern Mediterranean, the trends succeeded in locally changing the sign of the correlation, which is in agreement with studies showing that Mediterranean climate is changing faster [1].
4. Discussions
Some further issues in the regional variability of extreme cyclones in the last few decades for Southeast Europe could be related to the role of the jet identified here. Why did these jet anomalies occur in the last few decades? Why do summer extremes have a stronger increase in D0 (southern) while winter extremes show minor changes? Why do extreme tracks appear to shift towards autumn?
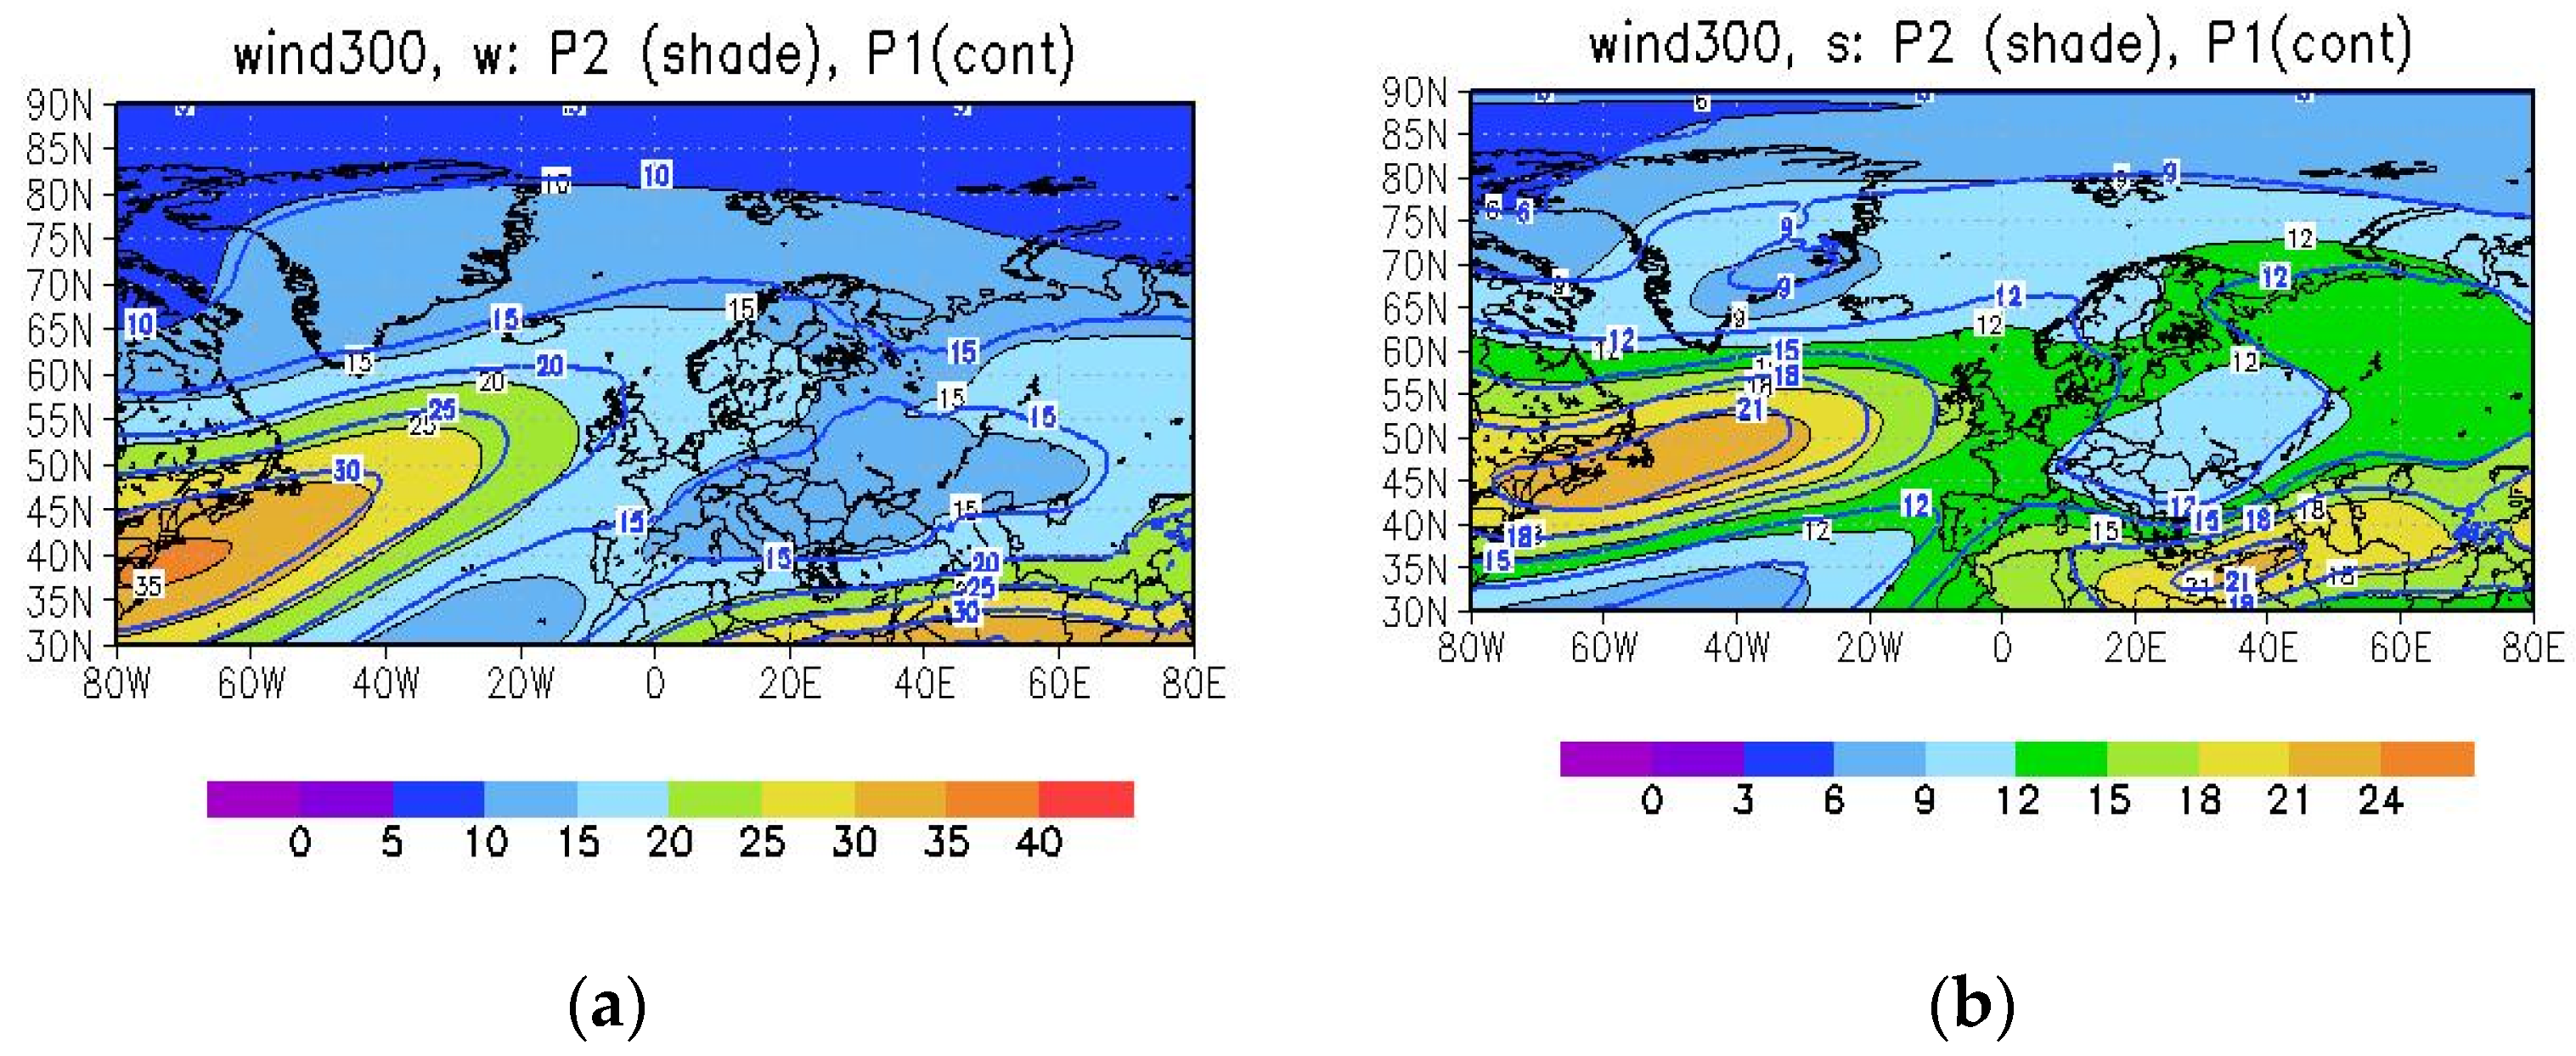
A comparison of the polar jets in P2 and P1 (Figure 13) points to two aspects. The first is the polar jet seasonal anomaly. Winter polar jets shift southwards and westwards in P2 relative to P1 (and in P0 trends), as seen in the negative/positive dipole extending from North Finland south to Portugal (Figure 8a). A similar shift in the jets, and of the North-Atlantic storm tracks, was found for winter projections [70]. In summer, there is a northwards and eastwards split, traceable to the anomaly jet dipole (positive/negative) at higher/lower latitudes that extends over Europe (Figure 8b). In both seasons these displacements modulate the coupling with the sub-tropical jet in the Euro–Atlantic area: the two jets depart in winter and approach each other in summer over the coupling area (Eastern Atlantic, Figure 13).
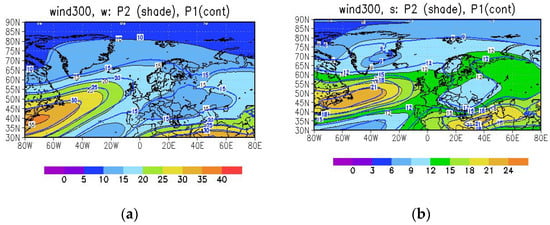
Figure 13.
Wind magnitude at 300 hPa averaged for P2 (shade) and P1 (contour), for winter (a) and summer (b).
The jets’ departure favors a decrease in the upper level convergence (and lower level divergence) in winter, in the coupling area of the indirect (polar jet streak, right exit)/direct (sub-tropical jet, left entrance) ageostrophic circulations (or the coupled area of negative vorticity advection), leading the thalweg anomaly in the mid troposphere and the jet even farther southwards (and centered over Western–Central Europe (10° E, Figure 8a)). We noticed earlier that this further guides storm track shifts (P2–P1) eastwards (following the upwards branch). Such a southwards shift in winter of the North Atlantic eddy-driven jet has also been mentioned [71] for 1979–2007 as contributing to an increased separation from the sub-tropical jet in winter, while yearly mean in these shifts tend to cancel [72].
In summer, their stronger coupling leads to enhanced descendance and a higher pressure anomaly in the mid-troposphere that leads to a further enhanced north-eastward displacement of the polar jet and a quasi-steady Rossby wave formation with summer blocking over Central–Eastern Europe (centered South Finland) in P2 relative to P1 (and in P0 trends). This gives conditions for enhanced and persistent [73,74] extremes over South-Eastern Europe (in the area of positive vorticity advection), with severe deepening of the surface lows (as seen in P2—summer over South-Southeastern Europe, Figure 2).
The upper-level forcings by ageostrophic circulation have also been shown to be important in strongly intensifying Northern Hemisphere cyclones in previous studies [75]. Interestingly, this enhancement appears to be favored (Figure 7 and Figure 10) towards autumn in the last few decades, when jets tended to become stronger while their anomaly couplings, discussed here (Figure 13), persists (Figure S2).
The key role of the particular Euro–Atlantic area on regional extreme track changes can be summarized as latitudinal shifts of the jets under a transient climate in this particular region, that can lead to stronger/weaker jet coupling, resulting in tropospheric pressure anomalies that further modulate jet displacements. These have an impact on the regional interactions of jet–storm tracks and the location of extreme deepening. This link should be further analyzed for climate projections and multi-year (decadal) predictions of regional extreme variability.
Impact of Storm-Tracks Variability at Regional Scale
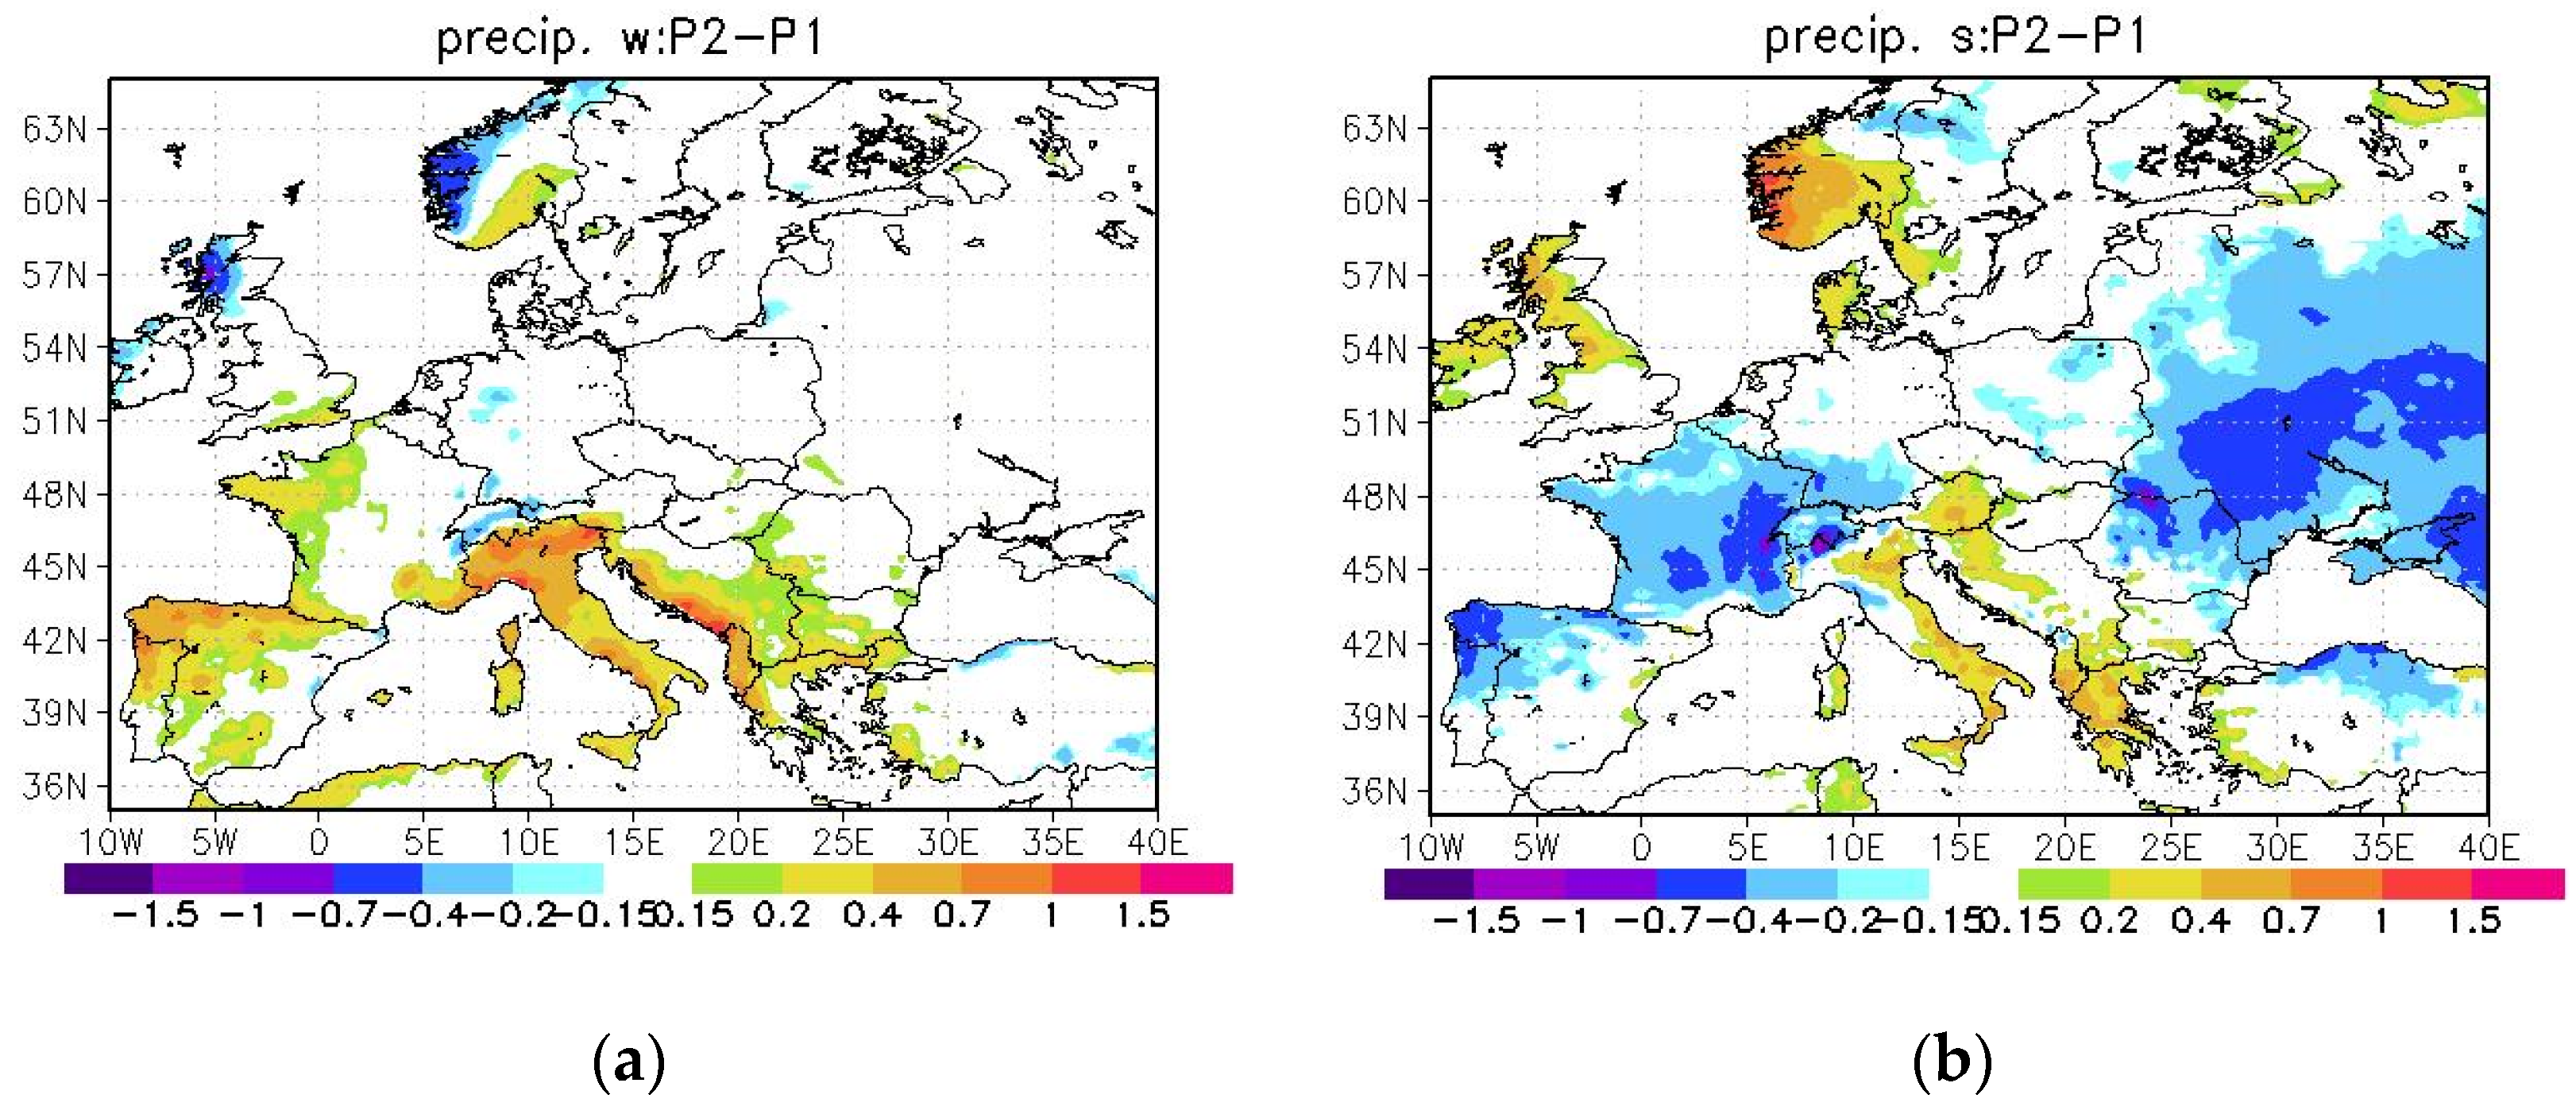
Storm tracks and extremes’ mechanisms in relation to jet shifts under warmer climates are important aspects in support of extended predictions. These links indicate potential changes in key areas that are prone to persistent summer blocking or winter circulation strengths, and thus reconfigure areas of enhanced storm track characteristics and the associated impact in precipitations and temperature in Europe. This is illustrated for P2–P1 in Figure 14 for precipitations and in Figure 15 for surface temperatures.
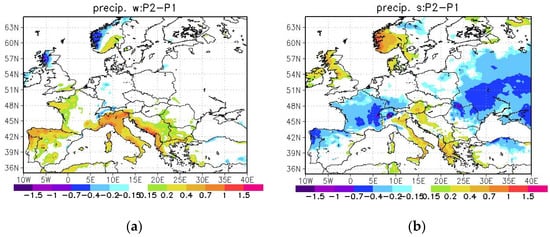
Figure 14.
Total precipitation difference (P2–P1) (shade) for winter (a) and summer (b).
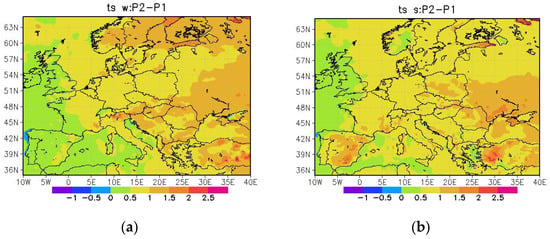
Figure 15.
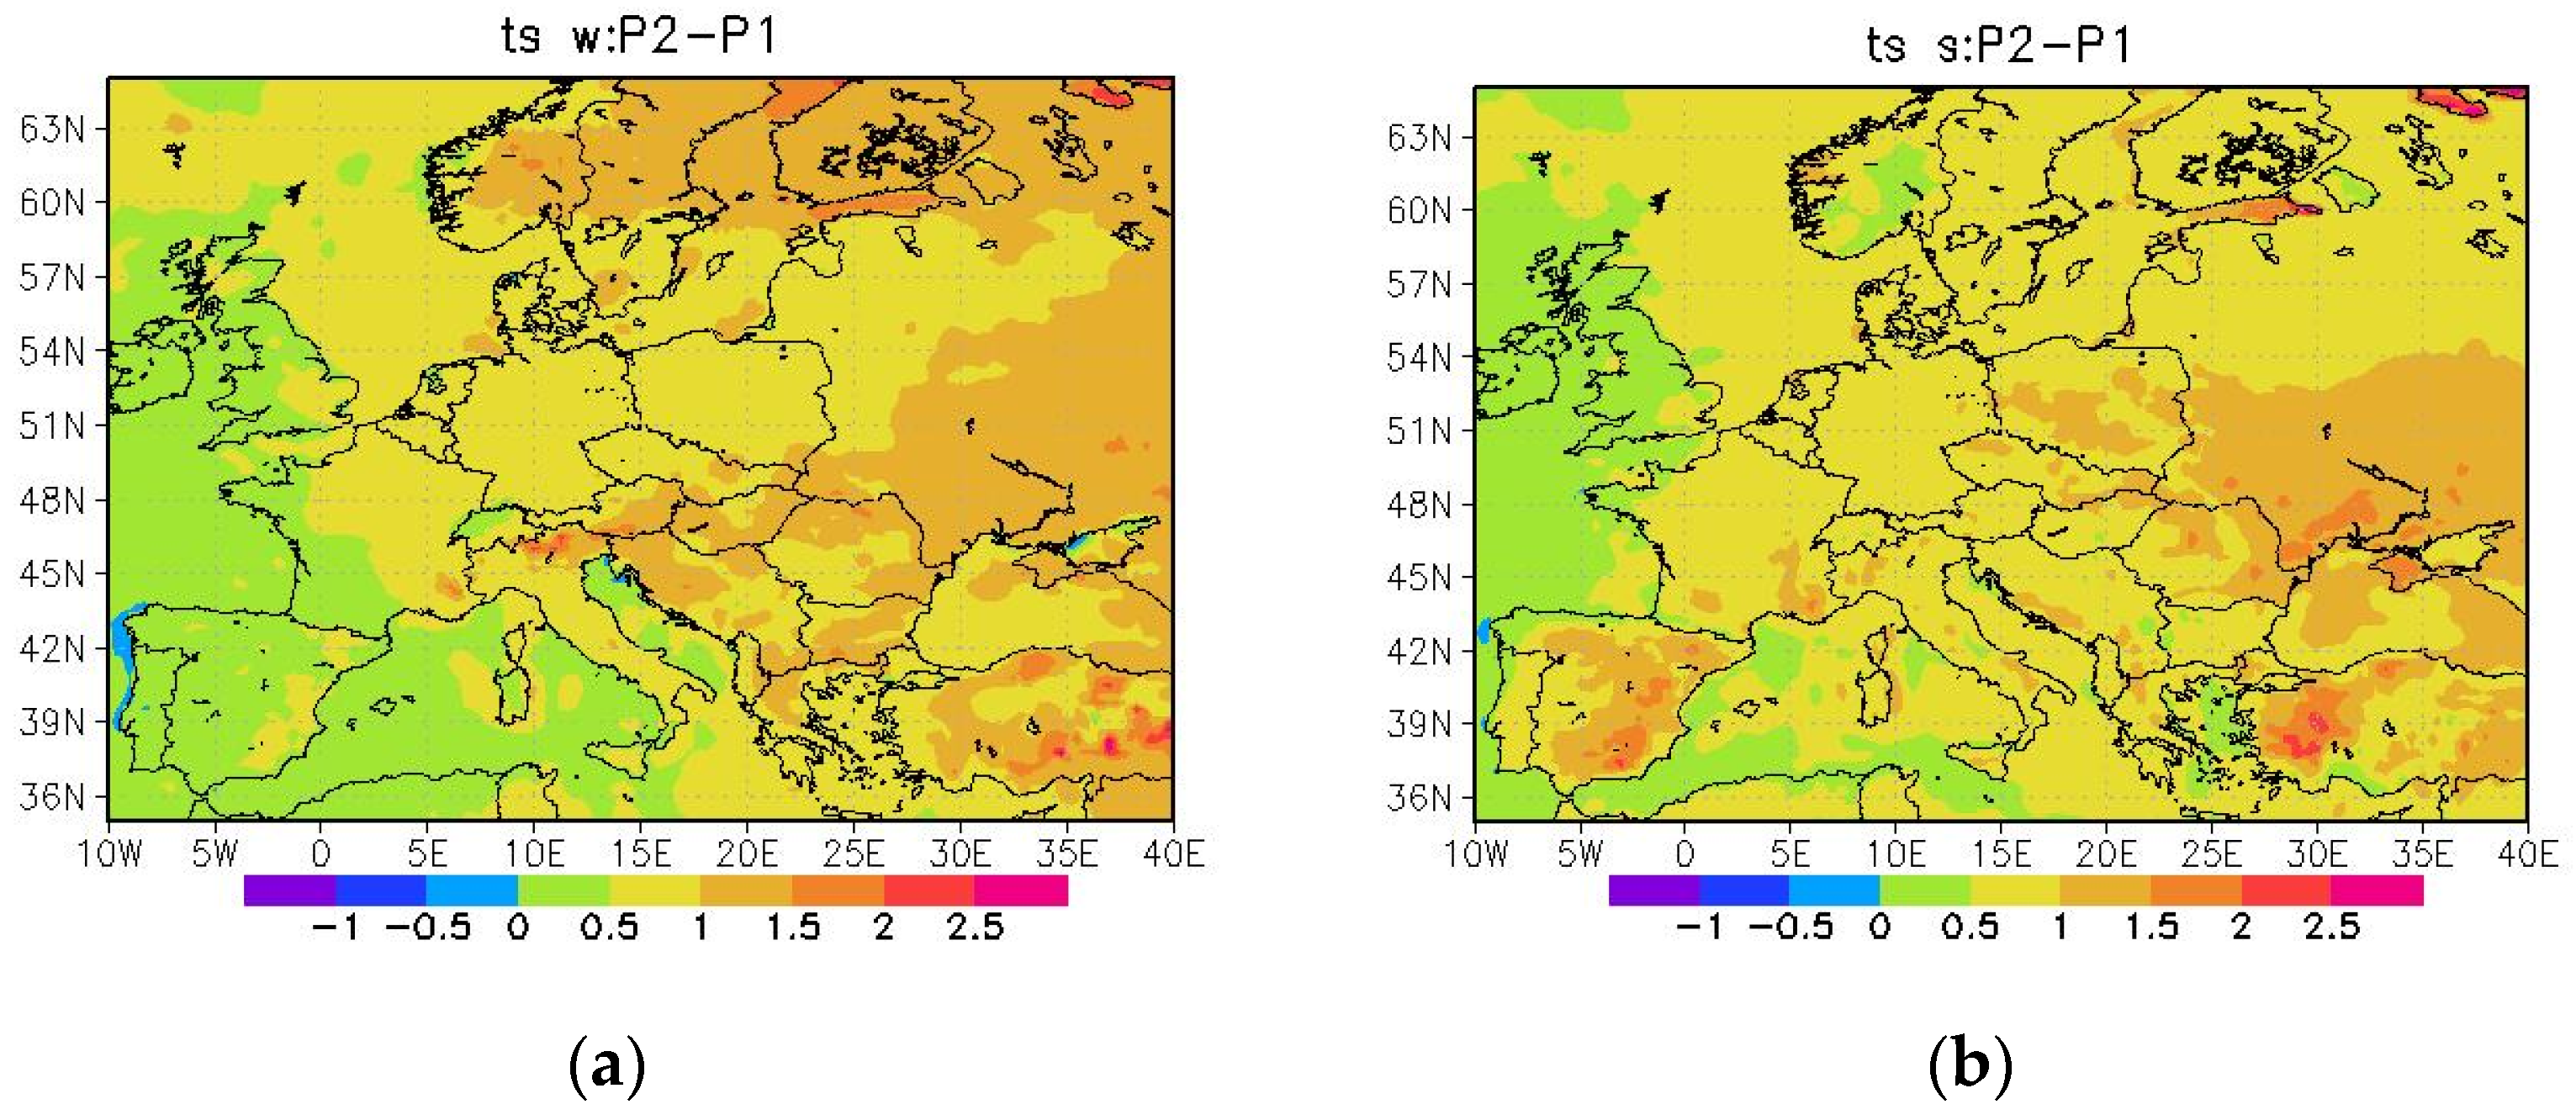
Surface temperature (10 cm of soil) difference (P2–P1) (shade) for winter (a) and summer (b).
The winter precipitation response agrees well with the area of winter jet thalweg anomaly (P2 versus P1) over Western–Central Europe and its southwards shift (Figure 14), and this is the same for summer, when increased precipitation in P2 is over South-eastern Europe and Northwestern Scandinavia (Figure 14, the ascendence areas southeast respectively northwest of the high-pressure Finland block in P2–P1 in Figure 8a).
The hottest anomaly large area at the surface in P2 relative to P1 north of the Black Sea (Figure 15) appears linked to a significant decrease in storm track numbers reaching D6 (blocked southwards in D3, Figure 5d), hence dryer soil and less evaporative cooling of the surface. These responses (Figure 7, Figure 10, Figure 14 and Figure 15) reflect the two-way interaction between storm tracks and eddy-driven jets.
5. Conclusions
This work attempted to investigate a few recent regional climate challenges, focusing mainly on Southeastern Europe, where an anomalous increase in summer precipitation was recently recorded and the same was the case for Southern Europe in winter as regional patterns of climate change. A main focus was on potential driving mechanisms for these regional changes in the context of their links to changes in extreme cyclones over SE Europe and Romania (D0) in terms of seasonal frequency, intensity, timing, and location. Additionally, of interest was the cause of the observed increased persistence of these extremes over a same sub-domain, leading to enhanced impact and damages. Finally, the drivers could be identified that were affected by external forcings or if natural variability had a dominant role—a question addressed in extended predictability operations.
The analysis here showed that Mediterranean origin tracks are the dominant source of cyclones over South Eastern Europe (except the northern parts) and the main source for extremes during the warm season, having potentially the most damaging impact on crops. The number of storm tracks appears to shift eastward of Central Europe in the last two decades in winter, and southwards and eastwards in Europe in summer. Meanwhile, with a focus on D0 we also analyzed seasonal and sub-regional changes in extreme cyclone tracks.
These show a winter increase in the number and persistence in the northeast, with a decrease in severity and a moderate increase in number over the western and southern parts of D0. During summer, both the severity and persistence of the tracks increased regionally, mainly in the south and southeast (where tracks were also more frequent) and track severity only increased in the northeast. These changes are associated with farther west and south Mediterranean origins in winter and farther south and southeastern origins during summer, associated with enforced split (N–S) of summer tracks.
A mechanism of change in extreme storm numbers and intensity over D0 is here shown to be related to anomalous polar jet shifts in the last few decades. These shifts modulate coupling with the subtropical jet (through their ageostrophic circulations) that in turn leads a southwestwards shift of the winter polar jet respectively a northeastwards shift in summer in the Eastern North Atlantic–Western European area. This feedback of the polar jet shift is due to a thalweg anomaly (centered at West–Central Europe, around 10° E) in winter trends and to a high-pressure anomaly (extended in a steady blocking circulation centered south of Finland) in summer trends, in response to a more relaxed coupling of the two jets in winter and stronger in summer (with maxima in autumn).
These further provide a mechanism of regionalization of extreme cyclone deepening variability through two paths: by shifting the origins of tracks towards enhanced latent heat sources and by shifting the jet streak anomalies relative to the extreme climatological tracks.
We also emphasize a systematic increase in the persistence of regional extremes, consistent with steady Rossby-waves identified in the seasonal jet anomalies (P2–P1), information useful in impact analysis.
Modes of atmospheric circulation variability are analyzed as possible drivers of these changes: we analyzed links between track variability and main pressure modes. We show that D0 track numbers are mainly driven during the cold season through combined action of AO and Polar–European modes’ trends, favoring the winter anomaly trough emphasized in P2–P1 at Central-Europe longitudes. In summer, the main signal for the target domains comes from AMO/East-Asian modes, which contributes to forcing trends of an anomalous southeast Scandinavian high, coupled with an East Mediterranean low. These links and the circulation mode’s changes are coherent with the changes found in the storm tracks.
These results may further have utility in seasonal prediction by providing indicators of track changes, based on the driving modes’ seasonal estimates and on the projected eddy-driven jet variability. Storm track projected variability in climate scenarios is analyzed in a companion paper.
Supplementary Materials
The following are available online at https://www.mdpi.com/article/10.3390/atmos12101362/s1, Figure S1: Validation of storm track classes from Catrina et al, 2019. Computed trajectories are blue/ red lines for winter/ summer events; plum cross represents the track position from meteorological analysis in (Catrina et al, 2019); orange circle represents secondary cyclonic forcing position present in the same time, interacting with the track, but not identified as cyclone center; orange dot lines indicate larger-scale context previous or during to the track (lead time is written in orange, in hours). Figure S2: Represents the same as in Figure 11 for average months SON. In plum is schematised the ageostrophic coupled circulation of the two jets. Table S1: Trends of atmospheric modes (year−1) over P0, P1 and P2 for the two seasons ONDJFM (w) and AMJJAS (s) (modes index data from https://www.cpc.ncep.noaa.gov/products/precip/Cwlink, accessed on 5 August 2021). Trends below 0.01 in absolute value are only specified as sign. Figure S3: Yearly correlations over P0: 0 lag between yearly means of the atmospheric modes and the mean number of tracks in boxes of 6x4 degrees lon/lat. The modes are: NAO (a,b), AO (c,d), PE (e,f), SCAND (g,h), EAWR (i,j), AMO (k,l). For each mode, the first plot is for detrended data (a,c,e,g,i,k), second for trended (b,d,f,h,j,l).
Author Contributions
Conceptualization, M.C., F.G., O.C. and M.P.; methodology, M.C., M.P. and O.C.; software, M.C.; validation, M.C. and O.C.; formal analysis, M.C., F.G. and M.P.; investigation, M.C.; resources, M.C. and O.C.; data curation, M.C., O.C. and M.P.; writing—original draft preparation, M.C.; writing—review and editing, M.C. and F.G.; visualization, M.C., F.G. and M.P.; supervision, M.C., F.G. and M.P.; project administration, M.C. and F.G. All authors have read and agreed to the published version of the manuscript.
Funding
This research received no external funding.
Institutional Review Board Statement
Not applicable.
Informed Consent Statement
Not applicable.
Data Availability Statement
Not applicable.
Conflicts of Interest
The authors declare no conflict of interest.
References
- Tuel, A.; Eltahir, E.A. Why is the Mediterranean a climate change hot spot? J. Clim. 2020, 33, 5829–5843. [Google Scholar] [CrossRef]
- Verdura, J.; Linares, C.; Ballesteros, E.; Coma, R.; Uriz, M.J.; Bensoussan, N.; Cebrian, E. Biodiversity loss in a Mediterranean ecosystem due to an extreme warming event unveils the role of an engineering gorgonian species. Sci. Rep. 2019, 9, 1–11. [Google Scholar] [CrossRef]
- Alpert, P.; Neeman, B.U.; Shay-El, Y. Climatological analysis of Mediterranean cyclones using ECMWF data. Tellus 1990, 42A, 65–77. [Google Scholar] [CrossRef]
- Flocas, A. Frontal depressions over the Mediterranean Sea and Central Southern Europe. Méditerranée 1988, 4, 43–52. [Google Scholar] [CrossRef]
- Lionello, P.; Abrantes, F.; Gacic, M.; Planton, S.; Trigo, R.; Ulbrich, U. The climate of the Mediterranean region: Research progress and climate change impacts. Reg. Environ. Chang. 2014, 14, 1679–1684. [Google Scholar] [CrossRef]
- Volosciuk, C.; Maraun, D.; Semenov, V.; Tilinina, N.; Gulev, S.K.; Latif, M. Rising Mediterranean Sea Surface Temperatures Amplify Extreme Summer Precipitation in Central Europe. Sci. Rep. 2016, 6, 32450. [Google Scholar] [CrossRef] [PubMed]
- Fischer, E.; Schär, C. Consistent geographical patterns of changes in high-impact European heatwaves. Nat. Geosci. 2010, 3, 398–403. [Google Scholar] [CrossRef]
- Diffenbaugh, N.S.; Pal, J.S.; Giorgi, F.; Gao, X. Heat stress intensification in the Mediterranean climate change hotspot. Geophys. Res. Lett. 2007, 34, L11706. [Google Scholar] [CrossRef]
- Romem, M.; Ziv, B.; Saaroni, H. Scenarios in the development of Mediterranean cyclones. Adv. Geosci. 2007, 12, 59–65. [Google Scholar] [CrossRef][Green Version]
- Catrina, O.; Ştefan, S.; Crăciun, C. Objective identification of Mediterranean cyclones and their trajectories towards Romania. Meteorol. Appl. 2019, 26, 429–441. [Google Scholar] [CrossRef]
- Hochman, A.; Alpert, P.; Kunin, P.; Rostkier-Edelstein, D.; Harpaz, T.; Saaroni, H.; Messori, G. The dynamics of cyclones in the twentyfirst century: The Eastern Mediterranean as an example. Clim. Dyn. 2020, 54, 561–574. [Google Scholar] [CrossRef]
- Bengtsson, L.; Hodges, K.I.; Roeckner, E. Storm tracks and climate change. J. Clim. 2006, 19, 3518–3543. [Google Scholar] [CrossRef]
- Neu, U.; Akperov, M.G.; Bellenbaum, N.; Benestad, R.; Blender, R.; Caballero, R.; Cocozza, A.; Dacre, H.F.; Feng, Y.; Fraedrich, K.; et al. IMILAST: A community effort to intercompare extratropical cyclone detection and tracking algorithms. Bull. Am. Meteorol. Soc. 2013, 94, 529–547. [Google Scholar] [CrossRef]
- Walker, E.; Mitchell, D.; Seviour, W. The numerous approaches to tracking extratropical cyclones and the challenges they present. Weather 2020, 75, 336–341. [Google Scholar] [CrossRef]
- Nita, I.A.; Sfîcă, L.; Apostol, L.; Radu, C.; Birsan, M.V.; Szep, R.; Keresztesi, A. Changes in cyclone intensity over Romania according to 12 tracking methods. Rom. Rep. Phys. 2020, 72, 706. [Google Scholar]
- Hofstatter, M.; Chimani, B.; Lexer, A.; Bloschl, G. A new classification scheme of European cyclone tracks with relevance to precipitation. Water Resour. Res. 2016, 52, 7086–7104. [Google Scholar] [CrossRef]
- Dacre, H.F.; Gray, S.L. The spatial distribution and evolution characteristics of North Atlantic cyclones. Mon. Weather Rev. 2009, 137, 99–115. [Google Scholar] [CrossRef]
- Trigo, I.F.; Davies, T.D.; Bigg, G.R. Objective climatology of cyclones in the Mediterranean region. J. Clim. 1999, 12, 1685–1696. [Google Scholar] [CrossRef]
- Horvath, K.; Lin, Y.-L.; Ivančan-Picek, B. Classification of cyclone tracks over the Apennines and the Adriatic Sea. Mon. Weather Rev. 2008, 136, 2210–2227. [Google Scholar] [CrossRef]
- Wernli, H.; Schwierz, C. Surface cyclones in the ERA-40 dataset (1958–2001). Part I: Novel identification method and global climatology. JAS 2006, 63, 2486–2507. [Google Scholar] [CrossRef]
- Lionello, P.; Trigo, I.F.; Gil, V.; Liberato, M.L.R.; Nissen, K.M.; Pinto, J.G.; Raible, C.C.; Reale, M.; Tanzarella, A.; Trigo, R.M.; et al. Objective climatology of cyclones in the Mediterranean region: A consensus viewamong methods with different system identification and tracking criteria. Tellus A Dyn. Meteorol. Oceanogr. 2016, 68, 29391. [Google Scholar] [CrossRef]
- Flocas, H.A.; Simmonds, I.; Kouroutzoglou, J.; Keay, K.; Hatzaki, M.; Bricolas, V.; Asimakopoulos, D. On cyclonic tracks over the eastern Mediterranean. J. Clim. 2010, 23, 5243–5257. [Google Scholar] [CrossRef]
- Lebedeva, M.G.; Krymskaya, O.V.; Lupo, A.R.; Chendev, Y.G.; Petin, A.N.; Solovyov, A.B. Trends in Summer Season Climate for Eastern Europe and Southern Russia in the Early 21st Century. Adv. Meteorol. 2016, 2016, 5035086. [Google Scholar] [CrossRef]
- Anders, I.; Stagl, J.; Auer, I.; Pavlik, D. Climate Change in Central and Eastern Europe. In Managing Protected Areas in Central and Eastern Europe Under Climate Change. Advances in Global Change Research; Rannow, S., Neubert, M., Eds.; Springer: Dordrecht, The Netherlands, 2014; Volume 58. [Google Scholar] [CrossRef]
- Spinoni, J.; Naumann, G.; Vogt, J.V. Pan-European seasonal trends and recent changes of drought frequency and severity. Glob. Planet. Chang. 2017, 148, 113–130. [Google Scholar] [CrossRef]
- Hatzaki, M.; Flocas, H.A.; Giannakopoulos, C.; Maheras, P. The Impact of the Eastern Mediterranean Teleconnection Pattern on the Mediterranean Climate. J. Clim. 2009, 22, 977–992. [Google Scholar] [CrossRef]
- Ullmann, A.; Fontaine, B.; Roucou, P. Euro-Atlantic weather regimes and Mediterranean rainfall patterns: Present-day variability and expected changes under CMIP5 projections. Int. J. Climatol. 2014, 34, 2634–2650. [Google Scholar] [CrossRef]
- Zampieri, M.; Ceglar, A.; Dentener, F.; Toreti, A. Wheat yield loss attributable to heat waves, drought and water excess at the global, national and subnational scales. Environ. Res. Lett. 2017, 12, 064008. [Google Scholar] [CrossRef]
- Dunstone, N.; Smith, D.; Scaife, A.; Hermanson, L.; Eade, R.; Robinson, N.; Andrews, M.; Knight, J. Skilful predictions of the winter North Atlantic Oscillation one year ahead. Nat. Geosci. 2016, 9, 809–814. [Google Scholar] [CrossRef]
- Ulbrich, U.; Lionello, P.; Belusic, D.; Jacobeit, J.; Knippertz, P.; Kuglitsch, F.G.; Leckebusch, G.C.; Luterbacher, J.; Maugeri, M.; Maheras, P.; et al. Climate of the Mediterranean: Synoptic patterns, temperature, precipitation, winds and their extremes. In Climate of the Mediterranean Region—From the Past to the Future; Lionello, P., Ed.; Elsevier: Amsterdam, The Netherlands, 2012; pp. 301–346. [Google Scholar] [CrossRef]
- Woollings, T.; Blackburn, M. The North Atlantic Jet Stream under Climate Change and Its Relation to the NAO and EA Patterns. J. Clim. 2012, 25, 886–902. [Google Scholar] [CrossRef]
- Shaw, T.; Baldwin, M.; Barnes, E.; Caballero, R.; Garfinkel, C.I.; Hwang, Y.-T.; Li, C.; O’Gorman, P.A.; Rivière, G.; Simpson, I.R.; et al. Storm track processes and the opposing influences of climate change. Nat. Geosci. 2016, 9, 656–664. [Google Scholar] [CrossRef]
- Gaetani, M.; Baldi, M.; Dalu, G.A.; Maracchi, G. Jetstream and rainfall distribution in the Mediterranean region. Nat. Hazards Earth Syst. Sci. 2011, 11, 2469–2481. [Google Scholar] [CrossRef]
- Krichak, S.O.; Breitgand, J.S.; Gualdi, S.; Feldstein, S.B. Teleconnection–extreme precipitation relationships over the Mediterranean region. Theor. Appl. Climatol. 2014, 117, 679–692. [Google Scholar] [CrossRef]
- Dowdy, A.; Catto, J.L. Extreme weather caused by concurrent cyclone, front and thunderstorm occurrences. Sci. Rep. 2017, 7, 1–8. [Google Scholar] [CrossRef]
- Pfahl, S.; Wernli, H. Quantifying the Relevance of Cyclones for Precipitation Extremes. J. Clim. 2012, 25, 6770–6780. [Google Scholar] [CrossRef]
- Trigo, I.F.; Bigg, G.R.; Davies, T.D. Climatology of cyclogenesis mechanisms in the Mediterranean. Mon. Weather Rev. 2002, 130, 549–569. [Google Scholar] [CrossRef]
- Giuntoli, I.; Fabiano, F.; Corti, S. Seasonal predictability of Mediterranean weather regimes in the Copernicus C3S systems. Clim. Dyn. 2021, 1–17. [Google Scholar] [CrossRef]
- Swingedouw, D.; Colin, C.; Eynaud, F.; Ayache, M.; Zaragosi, S. Impact of freshwater release in the Mediterranean Sea on the North Atlantic climate. Clim. Dyn. 2019, 53, 3893–3915. [Google Scholar] [CrossRef]
- Brönnimann, S.; Xoplaki, E.; Casty, C.; Pauling, A.; Luterbacher, J. ENSO influence on Europe during the last centuries. Clim. Dyn. 2007, 28, 181–197. [Google Scholar] [CrossRef]
- Greatbatch, R.J.; Lu, J.; Peterson, K.A. Nonstationary impact of ENSO on Euro-Atlantic winter climate. Geophys. Res. Lett. 2004, 31, L02208. [Google Scholar] [CrossRef]
- Pinto, J.G.; Raible, C.C. Past and recent changes in the North Atlantic oscillation. Wiley Interdiscip. Rev. Clim. Chang. 2012, 3, 79–90. [Google Scholar] [CrossRef]
- Trouet, V.; Panayotov, M.P.; Ivanova, A.; Frank, D. A pan-European summer teleconnection mode recorded by a new temperature reconstruction from the northeastern Mediterranean (ad 1768–2008). Holocene 2012, 22, 887–898. [Google Scholar] [CrossRef]
- Sixth Assessment Report—IPCC. Available online: https://www.ipcc.ch/assessment-report/ar6 (accessed on 5 October 2021).
- Collins, M.; Knutti, R.; Arblaster, J.; Dufresne, J.-L.; Fichefet, T.; Friedlingstein, P.; Gao, X.; Gutowski, W.J., Jr.; Johns, T.; Krinner, G.; et al. Chapter 12—Long-term Climate Change: Projections, Commitments and Irreversibility. In Climate Change 2013: The Physical Science Basis Contribution. IPCC Working Group I Contribution to AR5; IPCC, Ed.; Cambridge University Press: Cambridge, UK, 2013. [Google Scholar]
- Flaounas, E.; Kelemen, F.D.; Wernli, H.; Gaertner, M.A.; Reale, M.; Sanchez-Gomez, E.; Lionello, P.; Calmanti, S.; Podrascanin, Z.; Somot, S.; et al. Assessment of an ensemble of ocean–atmosphere coupled and uncoupled regional climate models to reproduce the climatology of Mediterranean cyclones. Clim. Dyn. 2018, 51, 1023–1040. [Google Scholar] [CrossRef]
- Caian, M.; Andrei, M.D. Late-Spring severe blizzard events over eastern Romania: A conceptual model of development. Atmosphere 2020, 10, 770. [Google Scholar] [CrossRef]
- Caian, M.; Jönsson, A.; Kjellström, E.; Wyser, K.; Schöld, S. Mid-latitude cyclones related to extremely high sea level events at the Swedish coast in recent and future climates. (to be submitted to Int. Clim.).
- Stockadale, T.; Alonso-Balmaseda, M.; Johnson, S.; Ferranti, L.; Molteni, F.; Magnusson, L.; Tietsche, S.; Vitart, F.; Decremer, D.; Weisheimer, A.; et al. ECMWF Technical Memorandum No 835 “SEAS5 and the Future Evolution of the Long-Range Forecast SystemYS5 Forecast System”. 2018. Available online: https://www.ecmwf.int/en/elibrary/18750-seas5-and-future-evolution-long-range-forecast-system (accessed on 8 August 2021).
- Annual Report of Member States ECMWF Products. 2020. Available online: https://www.ecmwf.int/en/elibrary/20169-application-and-verification-ecmwf-products-2021-romania (accessed on 5 October 2021).
- Dee, D.P.; Uppala, S.M.; Simmons, A.J.; Berrisford, P.; Poli, P.; Kobayashi, S.; Andrae, U.; Balmaseda, M.A.; Balsamo, G.; Bauer, P.; et al. The ERA-Interim reanalysis: Configuration and performance of the data assimilation system. Q. J. R. Meteorol. Soc. 2011, 137, 553–597. [Google Scholar] [CrossRef]
- Sinclair, M.R.; Watterson, I.G. Objective assessment of extratropical weather systems in simulated climates. J. Clim. 1999, 12, 3467–3485. [Google Scholar] [CrossRef]
- Hoskins, B.J.; Hodges, K.I. New perspectives on the northern hemisphere winter storm tracks. JAS 2002, 59, 1041–1061. [Google Scholar] [CrossRef]
- Flaounas, E.; Davolio, S.; Raveh-Rubin, S.; Pantillon, F.; Miglietta, M.M.; Gaertner, Μ.A.; Hatzaki, M.; Homar, V.; Khodayar, S.; Korres, G.; et al. Mediterranean cyclones: Current knowledge and open questions on dynamics, prediction, climatology and impacts. Weather Clim. Dyn. 2021. reprint. [Google Scholar] [CrossRef]
- Emanuel, K. Genesis and maintenance of Mediterranean hurricanes. Adv. Geosci. 2005, 2, 217–220. [Google Scholar] [CrossRef]
- Miglietta, M.; Moscatello, M.; Conte, A.; Mannarini, D.; Lacorata, G.; Rotunno, R. Numerical analysis of a Mediterranean ‘hurricane’ over south-eastern Italy: Sensitivity experiments to sea surface temperature. Atmos. Res. 2011, 101, 412–426. [Google Scholar] [CrossRef]
- Trigo, I.F. Climatology and interannual variability of storm-tracks in the Euro-Atlantic sector: A comparison between ERA-40 and NCEP/NCAR reanalyses. Clim. Dyn. 2006, 26, 127–143. [Google Scholar] [CrossRef]
- Maheras, P.; Flocas, H.A.; Patrikas, I.; Anagnostopoulou, C. A 40 year objective climatology of surface cyclones in the Mediterranean region: Spatial and temporal distribution. Int. J. Climatol. 2001, 21, 109–130. [Google Scholar] [CrossRef]
- Bordei-Ion, E. Rolul Lanţului Alpino-Carpatic în Evoluţia Ciclonilor Mediteraneeni; Edit. Academiei Republicii Socialiste România: Bucureşti, Romania, 1983. [Google Scholar]
- Grimani, D.; Beşleagă, N. Climatic aspects and synoptic considerations linked with Mediterranean cyclones developing over South-European mainland. Meteoroloy and Hydrology; Bucuresti, Romania No 2. , 1976. Available online: http://pesd.ro/articole/nr.2/14.%20Apostol_PESD_2008.pdf (accessed on 5 October 2021).
- Şorodoc, C. Formarea şi evoluţia ciclonilor mediteraneeni şi influenţa lor asupra timpului în R.P.Română. In Culeg. de lucr. ale I.M./1960; Institutul Meteorologic: Bucuresti, Romania, 1962; pp. 5–42. [Google Scholar]
- Hoskins, B.J.; Hodges, K.I. The annual cycle of Northern Hemisphere storm tracks. Part I: Seasons. J. Clim. 2019, 32, 1743–1760. [Google Scholar] [CrossRef]
- Kouroutzoglou, J.; Flocas, H.A.; Hatzaki, M.; Keay, K.; Simmonds, I. A high-resolution climatological study on the comparison between surface explosive and ordinary cyclones in the Mediterranean. Reg. Environ. Chang. 2014, 14, 1833–1846. [Google Scholar] [CrossRef]
- Dayan, U.; Nissen, K.; Ulbrich, U. Atmospheric conditions inducing extreme precipitation over the eastern and western Mediterranean. Nat. Hazards Earth Syst. Sci. 2015, 15, 2525–2544. [Google Scholar] [CrossRef]
- Krichak, S.O.; Feldstein, S.B.; Alpert, P.; Gualdi, S.; Scoccimarro, E.; Yano, J.I. Discussing the role of tropical and subtropical moisture sources in cold season extreme precipitation events in the Mediterranean region from a climate change perspective. Nat. Hazards Earth Syst. Sci. 2016, 16, 269–285. [Google Scholar] [CrossRef]
- Kaznacheeva, V.D.; Shuvalov, S.V. Climatic characteristics of Mediterranean cyclones. Russ. Meteorol. Hydrol. 2012, 37, 315–323. [Google Scholar] [CrossRef]
- Barnston, A.G.; Livezey, R.E. Classification, seasonality and persistence of low-frequency atmospheric circulation patterns. Mon. Weather Rev. 1987, 115, 1083–1126. [Google Scholar] [CrossRef]
- Almazroui, M.; Awad, A.M.; Islam, M.N.; Al-Khalaf, A.K. A climatological study: Wet season cyclone tracks in the East Mediterranean region. Theor. Appl. Climatol. 2015, 120, 351–365. [Google Scholar] [CrossRef]
- Mailier, P.J.; Stephenson, D.B.; Ferro, C.A.; Hodges, K.I. Serial clustering of extratropical cyclones. Mon. Weather Rev. 2006, 134, 2224–2240. [Google Scholar] [CrossRef]
- McDonald, R.E. Understanding the impact of climate change on Northern Hemisphere extra-tropical cyclones. Clim. Dyn. 2011, 37, 1399–1425. [Google Scholar] [CrossRef]
- Strong, C.; Davis, R.E. Winter jet stream trends over the Northern Hemisphere. Q. J. R. Meteorol. Soc. 2007, 133, 2109–2115. [Google Scholar] [CrossRef]
- Lee, S.H.; Williams, P.D.; Frame, T.H.A. Increased shear in the North Atlantic upper-level jet stream over the past four decades. Nature 2019, 572, 639–642. [Google Scholar] [CrossRef] [PubMed]
- Stendel, M.; Francis, J.; White, R.; Williams, P.D.; Woollings, T. The jet stream and climate change. In Climate Change; Elsevier: Amsterdam, The Netherlands, 2021; pp. 327–357. [Google Scholar] [CrossRef]
- Meleshko, V.P.; Johannessen, O.M.; Baidin, A.V.; Pavlova, T.V.; Govorkova, V.A. Arctic amplification: Does it impact the polar jet stream? Tellus A Dyn. Meteorol. Oceanogr. 2016, 68, 32330. [Google Scholar] [CrossRef]
- Binder, H.; Boettcher, M.; Joos, H.; Wernli, H. The role of warm conveyor belts for the intensification of extratropical cyclones in Northern Hemisphere winter. JAS 2016, 73, 3997–4020. [Google Scholar] [CrossRef]
Publisher’s Note: MDPI stays neutral with regard to jurisdictional claims in published maps and institutional affiliations. |
© 2021 by the authors. Licensee MDPI, Basel, Switzerland. This article is an open access article distributed under the terms and conditions of the Creative Commons Attribution (CC BY) license (https://creativecommons.org/licenses/by/4.0/).

