Abstract
In order to establish data to be used for comparison with future evolution related to climate change, physical, chemical and biological characteristics of dew and rainwater as collected during the 2005 dry season (plus a few data during the 2004 dry season) are reported. They have been collected in two characteristic tropical islands of French Polynesia, Tikehau (TKH), a low-lying coral atoll in the Tuamotu Archipelago, and the mountainous Tahiti island at the University of French Polynesia (TAH). Trade winds dominate the trajectory of air masses, ensuring constant temperature and humidity to the lower layers of the atmosphere where dew forms. In addition to the comparison of dew yields with a physical model using simple meteorological data (air and dew point temperatures, windspeed, cloud cover), the following parameters were studied: pH, electrical conductivity (EC), total dissolved solids (TDS), total hardness, suspended matter, ion concentration with major cations (Ca2+, K+, Na+, Mg2+, NH4+) and major anions (Cl−, SO42−, NO3−), reviviscible aerobe microorganisms and compared to two Polynesian spring waters (“Eau Royale” and “Vaimato”). Dew, with a chemical composition mainly consisting of Na+, Ca2+, Mg2+, Cl− and SO42−, exhibits much higher ion concentration than rain and compares well with the composition of local spring waters. The values of pH, EC and TDS are larger in dew than in rainwater. At TAH, the volume weighted mean (VWM) pH values of dew were 6.05 in 2004 and 5.23 in 2005, larger than the pH of rain (4.69). The VWM dew EC (at TAH, 203 μS·cm−1 in 2004 and 237 μS·cm−1 in 2005; 321 μS·cm−1 at TKH in 2005) and dew TDS (152 mg·L−1 at TAH and 225 mg·L−1 at TKH) were higher than the corresponding quantities in rain. Mean total hardness (TH) values of dew water are much higher than in rainwater (2.8 for dew versus 0.5 for rain at TAH and 5.7 for dew versus 0.5 for rain at TKH). Ions Na+, Mg2+ and Cl− are clearly of sea origin while the presence of Ca2+ is due to coral particles. From their chemical characteristics, dew and rainwater could be used as an alternative source of water in dry season but, due to the presence of reviviscible aerobe microorganisms at 22 °C and 36 °C (>300 CFU·mL−1), water must be disinfected to be potable.
1. Introduction
Dew is a ubiquitous phenomenon. Dew is not fog or rain, constituted of already condensed liquid droplets. Its formation by water vapor condensation from the surrounding atmosphere is well-known [1,2]. Water vapor can come either from soil moisture (“distillation” [3]) or from long range convected humid air masses. The radiation deficit at night between a surface and the atmosphere cools the surface by a few degrees, which, for a humid enough air (relative humidity (RH) > 70%) allows the dew point temperature to be reached and atmospheric water vapor to be condensed into liquid. Dew formation is dependent on the characteristics of the atmospheric boundary layer for radiative properties (water content, cloud coverage) and convective heat exchange (air flow near the condensing surface). With typically less than 70 Wm−2 radiative power available [2], the maximum yield cannot exceed 0.7–0.8 L·m−2 [1,2,4]. This low yield, however, can be a useful contribution to the biosphere [5,6,7,8,9,10,11,12,13,14,15,16] and to potable water in arid or semi-arid climates (see the reviews [2,17,18]). It can also be the source of plant disease [19,20,21,22] and, in urban areas, cause degradation to any inorganic matter that can be corroded (roofs, cars... see, e.g., [23,24,25]).
Dew chemical composition depends on the properties of the local environment. The different stages governing its composition are formation on dry deposition solids, dissolution of the soluble portion of the dry deposition by dew water, and sorption of gases into the dew solution. In contrast, rain comes from a cloud, formed when the atmosphere’s relative humidity reaches 100% with enough hygroscopic nuclei to foster nucleation. Nucleated droplets initially grow quickly but collision/coalescence processes are needed to produce precipitation in the end. The chemical composition of rain thus results from three different processes: nucleation scavenging (the chemical composition of nuclei determines the cloud initial composition), in-cloud scavenging (incorporation of non-activated particles and trace gases, including chemical reactions within droplets), sub-cloud scavenging (absorption of gases and take up of particles). Not every cloud gives rain, and a condensation nucleus may undergo many cloud cycling processes including chemical transformation before it reaches the Earth’s surface, often far away from its primary source.
Carbon dioxide, because of its high and constant concentration, plays a key role in the formation of acidity in the atmospheric liquid phase. An important pathway in alkalinity (carbonate) formation goes via nucleation and droplet formation as well as aerosol scavenging, the last process contributing significantly to sub-cloud scavenging into falling raindrops. The ability to capture particulates is very relevant for dew chemical composition and is strong at the beginning and weakened at the end of the condensation process. The acidity from dissolved gases (CO2, SO2, NOx) is mostly neutralized by Mg2+, Ca2+ and NH4+; sometimes a slight alkaline character is observed in dew. Dew events with the higher ionic concentration thus occur following long periods without rain.
Absorption of high soluble gases by dew and rainwater is very fast. Cloud cycling processes, microphysical conditions and heterogeneous reactions will influence dew and rain chemistry. When in equilibrium with atmospheric CO2, the HCO3− concentration is an exponential function of the pH-value. When the pH solutions are higher than 6.35 (pKa1 of H2CO3), [HCO3−] can become important. However, samples of the atmospheric multiphase system are most probably not in equilibrium with atmospheric CO2 due to complex chemical compositions, microphysical processes and heterogeneous interactions and [HCO3−] can only be obtained by analytical estimation and not deriving Henry’s law.
Dew water composition is thus a function of both long range convected atmosphere and locally produced gas and aerosols. The physico-chemical analysis of dew gives information about atmosphere from where it was condensed. Several studies during the last decades have been concerned with dew chemistry in urban areas; however, there are comparatively less studies concerning rural or remote areas (see the reviews in [2,17]). In particular, there is, to our knowledge, no report on chemical and biological studies of dew water and comparison with rainwater under tropical island conditions. This is all the more regrettable since data are needed to establish future evolution due to climate change. In this context, we report data obtained in 2004 and 2005 to serve as a reference.
Note that dew can be a valuable source of water as noted above. In the coral atolls of the Pacific Ocean, freshwater resources are very limited. Although the annual precipitations are sufficient for human use, with climate change, periodic droughts are more frequent during which the situation can become critical.
It is therefore the objective of this paper to give information on dew characteristics and especially on its chemical and biological quality as compared to rain and spring water. Data were collected during the dry season 16 May 2005–14 October 2005, plus a few data during the 2004 dry season. The paper is organized as follows. After having reported on measurements and methods in Section 2, Section 3 is devoted to the comparison of measured dew yields with a physical model using general meteorological parameters. The succeeding Section 4 and Section 5 deal with the trajectory of air masses and the physico-chemical characteristics of dew and rain samples measured on both sites. Finally, Section 6 reports on the biological analyses before concluding with the global analyses.
2. Measurements and Methods
Two representative sites were chosen in French Polynesia. A very low-lying coral atoll (highest elevation is 2 m) in the Tuamotu Archipelago (village of Tuherahera) and a high and mountainous island (Punaauia in the Tahiti island) whose highest elevation is 2241 m. The two sites are 320 km apart.
The Tikehau atoll (Figure 1a) covers 448 km2 with its lagoon. Two sites have been used. The first site (labeled # 1, from 21 June to 8 August 2005) is at the airport (latitude 14°07° S and longitude 148°14° W) and is exposed to the dominant trade winds. The second site (labeled # 2, from 8 August to 7 October 2005) is located 300 m west from site # 1 and is protected from the wind by coco trees. Both sites are 0.5 m above sea level (asl) and are labeled as TKH hereafter. The sites exhibit a tropical humid climate (Köppen-Geiger classification: Am) alternating two seasons, the current dry season (May to October) and the wet season (November to April) [26]. The wind regime is characterized by a permanent activity of the trade winds, with dominant direction east/north-east (day and night).
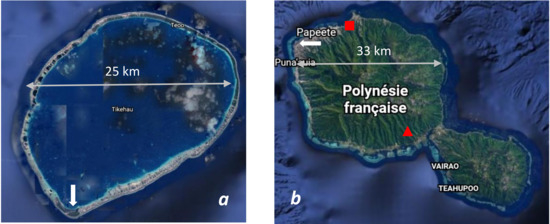
Figure 1.
(a) Tikehau atoll in the Tuamotu Archipelago (French Polynesia). The white arrow indicates the airport of Tuherahera. (b) Tahiti Island in the Society Islands. The white arrow indicates the University site (Outumaoro, municipality of Punaauia, French Polynesia). Water catchment points from spring water: Eau Royale ■, Vaimato ▲). Source: Google Earth.
The second measurement site (from 17 September to 30 September 2004 and 6 June to 15 October 2005; Figure 1b) is located at the University of French Polynesia at Punaauia (called TAH hereafter) along the west coast of Tahiti, at latitude 17°34′ S and longitude 149°36′ W. The elevation is 64 m asl and the climate is also tropical humid (Köppen-Geiger classification: Am) with two contrasted dry and wet seasons. The west coast of Tahiti is located downwind of the prevailing winds that are the trade winds. Therefore, it is the least rainy part of the island.
Dew volumes are measured under the same conditions in Tikehau and Tahiti using a standard condenser 1 m × 1 m, inclined at 30° horizontal, thermally isolated from below and covered with foil [27]. This foil is made of a low-density polyethylene film, 0.39 mm thick, in which a few % of TiO2 and BaSO4 micro-particles are embedded [28]. This foil is of food quality. In order to account for dry depositions, surface cleaning was completed only a few times. At TAH, the condensing surface was manually cleaned only 3 times with distilled water (20 June, 24 June and 19 July 2005) and foil replacement was made after a storm on 14 August 2005. In addition, on both sites, numerous rain episodes naturally cleaned the foils.
At Tikehau, the condenser faces west and thus remains somewhat protected from the trade winds and the first rays of the sun until 8:00 local time (UTC-10H). The TAH condenser is exposed north-east to face the most open part of the sky. The presence of some buildings and the asphalt parking lot nearby slightly decreases the sky view. Dew was collected each morning at 7:30 local time. The total collected volume corresponds to the volume of water that has run in the bottle due to gravity plus the volume of the manually scraped residual droplets.
Dew and rainwater were stored in polyethylene bottles at 3 °C for further analysis. Water was not filtered. As the minimum volumes needed for chemical analyses are large (~600 mL), it was necessary to cumulate dew water on several consecutive days. The result of the analyses thus corresponds to a mean on these corresponding days. Note that the number of samples used for the analysis is sometimes low (e.g., in 2004) but the constancy of the meteorological conditions as imposed by the dominant trade winds makes only a few samplings representative. The minimum volume for biological analyses was 15 mL. The dew and rain samples were brought every 2 weeks for immediate analyses to laboratories specialized in water analyses (Institut Louis Malardé and Laboratoire d’Etude et de Surveillance de l’Environnement, see Table 1). The following determinations were performed (i) physico-chemical properties: electrical conductivity EC, total water hardness TH and pH; (ii) chemical concentrations for cations (Na+, K+, Ca2+, Fe2+, Zn2+, Cu2+, Mg2+, NH4+ (only a few samples)) and anions (HCO3−, Cl−, SO42−, NO2−, PO43− and NO3−); (iii) bacteriological properties: reviviscible aerobe microorganisms (CFU) at 22 °C and 36 °C for less samples. In 2004, only pH and EC values were determined. Note that the atomic absorption spectrometry method measures elements, which are then related to ions in water since in aqueous medium of weak concentration (ionic force lower than 510−3 M/L, such as dew or rainwater), one considers that the totality of the elements is under ionic form.

Table 1.
Summary of methods and quality standards used for water sample analyses.
The quality control/analysis (QA/QC) of measurements corresponds to the content of the standards listed in Table 1. To be more precise, in order to obtain exact and reproducible results, the analysis sequence includes various QC tests: (i) zero point: ultra-pure water; (ii) pilot test (blank): realization of the test with all the reagents but on ultra-pure water; (iii) test of a point of the calibration range (midrange in general), prepared independently from the range of calibration (another batch of standard and another series of dilutions); (iv) a standard solution corresponding to the limit of quantification. The results are validated if (i) the calibration function is a curve whose correlation coefficient is R2 > 0.985, (ii) the measured limit of quantification should not vary more than ±60% from the theoretical value and (iii) the independent standard should not vary more than ±10% from the theoretical value.
Daily rain values are obtained in the following way. For the TAH site, hourly rainfall data are available thanks to the neighboring meteorological station of Faa’a (Météo-France). On the TKH atoll, there is no automatic meteorological station. However, precipitations can be estimated from the ERA-Interim [29,30], an atmospheric reanalysis produced by the European Centre for Medium-Range Weather Forecasts. Even if the spatial resolution of the data set is approximately 80 km, the rain data provided by ERA-Interim can be representative since the low elevation of the TKH atoll has no significant effect upon synoptic analysis.
For a given water sample, chemical compositions (dew, rain, water sources) have been evaluated by classical statistical indicators (min, max, mean and standard deviation) and the volume weighted mean (VWM). The latter takes into account the effect of dilution and is in general close to the median value. It is computed from:
where represents the variable to be weighted (ion concentration, electrical conductivity, etc.), and are, respectively, the variable value and the water sample volume for sample i. For the pH, the VWM value has been calculated from the [H+] concentrations:
Electrical conductivity (EC) values (25 °C, μS·cm−1) are measured with a Schott Geräte conductometer CG858 with a LF 5100T sensor. Other analyses are detailed in Table 1.
The number of samples for pH statistical values were at TAH 4 (dew in 2004), 31 (dew in 2005) and 4 (rain in 2005). For TKH, only one dew pH and two rain pH values measured in 2005 are available due to a failure of the pH meter. For EC statistical values, we have worked at TAH with 4 dew samples (in 2004) and 24 (in 2005) and 10 rain samples (in 2005). For TKH in 2005, 12 EC dew samples were used and two rain samples for EC.
Chemical and biological compositions were determined only in 2005. They are concerned with two rain samples and three dew samples, corresponding at TAH to the cumulation of 19 days and two rain samples and three dew samples at TKH, corresponding to the cumulation of 12 days.
Data are compared with water from two local spring waters, “Eau Royale” and “Vaimato” (the composition is taken in 2005; it is only slightly different from the 2020 values). “Eau Royale” is a spring water pumped from 63 m depth and located in the natural site of Mount Aorai at 600 m elevation (17°31′42″ S 149°31′36″ W). “Vaimato” is another spring water, located at Papeari district at Teva I Uta (17°45′12″ S 149°21′08″ W), pumped from 17 m depth at 50 m elevation (asl). Water comes from precipitations and is naturally filtered by the volcanic rocks and enriched over time with mineral salts and trace elements [31].
3. Hourly and Nightly Dew Yield Potential with Energy Balance Model
In a first study during the dry season (16 May–14 October 2005), Clus et al. [32] measured during the dry season the daily dew yield on both TKH and TAH sites using the same condensers as described above in Section 2. The main results were concerned with the evaluation of the dew potential. Mean dew yield of 0.07 mm·night−1 in Tahiti (max: 0.22 mm·night−1) and 0.102 mm·night−1 in Tikehau (max: 0.23 mm·night−1) were measured. Dew events represented up to 53.5% and 23.9% of the studied days in Tahiti and Tikehau, respectively, and 1.1% and 3.2% of rainwater, respectively. This small amount corresponds to an absence of drought during this period.
In order to estimate the dew potential, Beysens [33] developed an energy balance model that uses only a few classical meteorological data: cloud cover (N, oktas), wind speed (V, m·s−1), air temperature (Ta, °C), air relative humidity (RH, %) and dew point temperature (Td, °C). Near the ground level where dew forms, in the atmospheric boundary layer, the contribution from water vapor (about 0.2–2% by volume) and carbon dioxide (about 0.03% in volume) is of great importance for the radiative balance, with radiation from water vapor being by far the more important of the two. The data collected at TAH have been used to validate the model [33], with the meteorological parameters collected on site. Here we want to adapt and test this model from standard meteorological databases (Weather Underground, [34]) by using their historical time series. Tikehau data are not accessible in the database. For the period May–October 2005, Tahiti data have been extracted from the Faa’a airport station located at latitude 17.77° S, longitude 149.31° W, 4 m asl (distance: 2.5 km from the measurement site). During this period, the cumulative nightly dew yields of the previous study represented 4.70 mm (68 dew events). Daily dew yields h (mm·h−1) from the physical energy model [33] can be implemented using the airport data from the following formulation:
The numerical factor 1/12 corresponds to hourly data. The data for h > 0 correspond to condensation and h < 0 to evaporation, which have to be discarded. The quantity HL represents the convective heat losses between air and condenser, with a cut-off for windspeed V > V0 = 4.4 m·s−1 where condensation vanishes:
It means that when V > V0, the negative contribution of heat losses are so important that the dew yield becomes negative and should be discarded.
The quantity RE is the available radiative energy, which depends on air water content (measured by Td, in °C), site elevation H (in km) and cloud cover N (in oktas):
The Weather Underground hourly data base [34] provides the quantities Ta (°C), Td (°C), wind speed V (km·h−1, to be transformed in m·s−1), but N must be determined from the sky conditions according to standard descriptions of the local meteorology, “fair”, “partly cloudy”, “mostly cloudy”, and “cloudy”. According to NOAA’s national weather service glossary [35], the correlation sky conditions/cloud cover proposes N = 8/8 for “cloudy”, 5/8 to 7/8 for “mostly cloudy”, 3/8 or 4/8 for “partly cloudy” and “fair” (mainly for nocturnal conditions) corresponds to less than 3/8 opaque clouds, no precipitation, no extremes of visibility/temperature/wind.
By filtering the rain or fog events and integrating the time series on a daily time-step corresponding to h > 0, calculated cumulative daily yields are obtained and compared to the corresponding measured cumulative yield. According to the previous standard cloud coverage, we have implemented different configurations in our Matlab program, and the best correspondence is obtained for the following transformations: N = 0 for “fair”, N = 4 for “partly cloudy”, N = 6 for “mostly cloudy” and N = 8 for “cloudy” (Figure 2a). A linear correlation between collected and estimated dew yields is observed during the period, with sum h (calculated)/sum h (measured) = 1.092 ± 0.022 (uncertainty: one standard deviation) with R2 = 0.984. The computed cumulative dew yield exhibits a slightly smaller value than the observed yield, i.e., 4.55 mm versus 4.70 mm from the 6 months of observation, a phenomenon that was also observed when using the in-situ meteorological parameters [33]. A stepwise increase is observed in Figure 2a. This result is relative to the model sensitivity (described in [33]), which calculates the hourly dew production (mm·h−1) and generates low dew events. These low dew events correspond to pinned droplets that do not flow and evaporate in the morning, then preventing their evaluation.
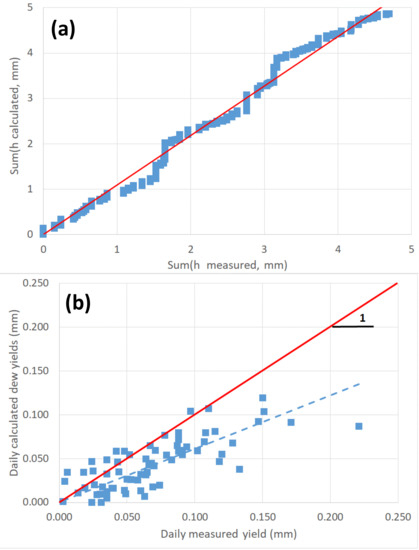
Figure 2.
(a) Cumulative daily dew yields (calculated vs. measured) on a 6 month dry period in 2005 at Tahiti according to the energy balance model [33]. (b) Daily dew yields on the studied period (calculated vs. measured). The interrupted line (blue) is a linear fit (slope = 0.611 with R2 = 0.549) and the full line (red) corresponds to Y = X.
When analyzing the dew frequency, the physical model is seen to produce more dew events (151 events versus 68 measured), however, with lower yields as can be seen in Figure 2b where the linear fit between experimental and calculated data gives the correlation h (calculated)/h (measured) = 0.611 ± 0.03 (uncertainty: one standard deviation) with R2 = 0.549. Very low dew yields are indeed not collected in experiments as discussed above.
4. Air Masses Trajectories
As discussed in the preceding Section 3, the formation of dew is mainly dependent on the air characteristics in the atmospheric boundary layer. The boundary layer thickness, H, can be approximated [36] by , with h in km. At night, in the conditions of dew formation where ≈ a few K, h ≈ 200 m. The motion of air masses is governed in TAH and TKH by the wind regime, characterized by (i) trade winds, blowing east, south-east during all seasons, (ii) episodes of disturbances being able to evolve in tropical depression, sometimes very vigorous, to the extreme of an hurricane (hot season, December to March), (iii) disturbances dependent on subtropical depressions, (iv) “mara’ amu” strong wind (July to November), coming at the back of the previous disturbances under the push of a mobile anticyclone (in general that of Kermadec).
Since dew does not form under strong winds (larger than about 4.4 m·s−1, see Section 3), measurements will be concerned only under the regime of trade winds as one will see below. These winds blow day and night predominantly from the south-east in the Southern Hemisphere. They extend from sea level (0 m) up to 1500 or 2000 m elevation. It is only from 6000 m elevation that the direction of the winds is reversed. Figure 3a,b reports the evolution and histogram of the wind direction (Dir.) during all days and nights during the studied period and (Figure 3c,d) during only the sampling nights. Data (hourly) are from the nearby Tahiti Faaa airport, 2.5 km from the sampling site, from the historical time series of Weather Underground [34]. Since there are no such meteo data available for TKH, we expect these data to be also representative of the nearby TKH location (320 km) as the involved air masses are the same. In Table 2, the mean values and standard deviations for windspeed V and wind direction are summarized. Night data during sampling and general data are close together, as expected from the constancy of trade winds in direction and amplitude. The sampling nights show mean windspeed slightly smaller than the mean value of all days and nights. This is expected as the dew occurrences are favored by weak windspeeds, which lower the convective heat exchanges between the condenser and the surrounding air [2]. The variability of the data (Figure 3 and Table 2), as measured by the standard deviations, reflects the natural local variation of the air masses around the mean direction, with the variability due to the specificity of the island where low elevation air masses have to circumvent the mountains.
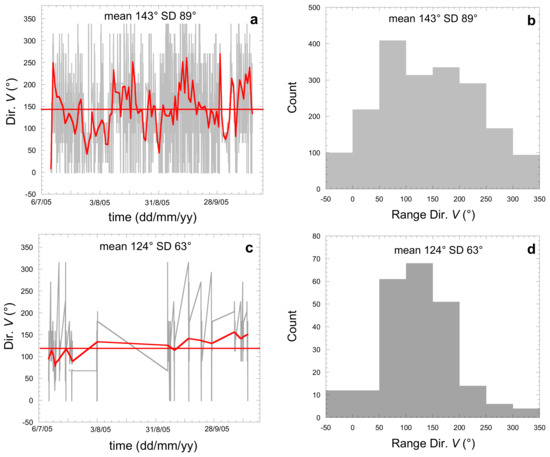
Figure 3.
Evolution of the wind speed direction Dir. V (°) (a,c) and histogram (b,d) at Tahiti airport 2.5 km from the sampling site (10 July–14 October 2005). (a,b) During day and night and (c,d) during dew sampling nights. Mean values with standard deviation SD are given. The bold line is the mean, and the bold curve is a smoothing function.

Table 2.
Mean values between 10 July 2005 and 14 October 2005 with standard deviation SD for windspeed V and wind direction Dir. concerning all days and nights and sampling nights.
In Figure 4, the air mass trajectories corresponding to minimum, mean and maximum directions of Figure 3c,d are reported. They indeed all correspond to directions around SE, the directions −1° and 315° being due to a temporary local variation of the wind direction. As the air masses flow above the ocean nearly always in the same direction, no important changes in temperature and relative humidity are then expected.
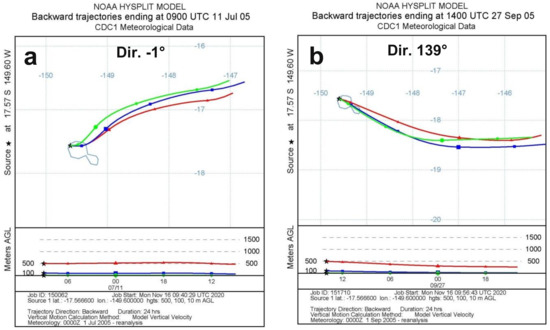
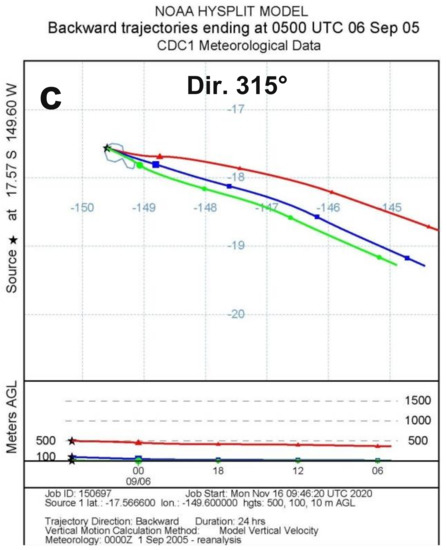
Figure 4.
Backward 24 h evolution of air masses at 10 m (green curve, circles), 100 m (blue curve, squares) and 500 m (red curve, triangles) above the ground level corresponding to (a) minimum night wind direction (−1°) on 11/7/2005 09:00 UTC (10/7/2005 23:00 TAH time), (b) mean night wind direction (139°) on 27/9/2005 14:00 UTC (27/9/2005 04:00 TAH time) and (c) maximum night wind direction (315°) on 6/9/2005 05:00 UTC (5/9/2005 19:00 TAH time). (a,c) directions are due to transitory local variations. (From NOAA’s HYSPLIT model [37,38]).
5. Chemical Analysis
The analytical results for dew and rain samples are shown in Table 3 for TAH and Table 4 for TKH. Chemical and biological data are presented and compared to (i) the chemical compositions of both Polynesian commercial local sources of water “Eau Royale” and “Vaimato”) and (ii) to WHO reference values for drinkable water [39]. A blank test was performed, revealing the presence of some deposited aerosols in small quantities (Ca2+, Zn2+) but no influence of substrate materials, in agreement with previous measurements by some of us [40]. The origin of calcium is coral, and Zn has a marine and anthropogenic origin (see Section 5.2 and Section 5.3). The methods used for water analyses are reported in Table 1 together with quality standards.

Table 3.
Chemical and biological analysis of dew and rain samples from the University of French Polynesia (TAH), Tahiti (year 2005, with pH and electrical conductivity (EC) data also in 2004). A number of chemical analyses data correspond to the mean of several successive dew water samples to reach the minimum value for analysis. The corresponding dates are listed in footnotes. WHO: ref. [39].

Table 4.
Chemical and biological analysis of dew and rain samples from the Tikehau atoll (TKH) (year 2005). A number of chemical analyses data correspond to the mean of several successive dew water samples to reach the minimum value for analysis. The corresponding dates are listed in footnotes. WHO: ref. [39].
5.1. Physico-Chemical Measurements
5.1.1. pH Values
The measurements of pH were carried out mainly at the TAH site (Table 3). Only a few data were measured in TKH, due to a failure of the pH-meter (dew at TAH: four samples in 2004, 31 samples in 2005; dew at TKH: no samples in 2004 and one sample in 2005; rain: no samples in 2004 and in 2005, four samples at TAH and two at TKH). At TAH, VWM dew = 6.05 (arithmetic mean: in 2004 and 5.23 in 2005 (arithmetic mean: with minimum 4.80 and maximum 7.17. For TKH (Table 4), the only available measurement in 2005 corresponds to pH (dew) = 6.720 (no data in 2004).
Figure 5a shows the pH evolution for rain and dew. As anticipated, there is no clear variation in time due to the stability of the meteorological conditions. Rain at the TAH site (Table 3) appears slightly more acidic than dew with VWM = 4.690 (min value = 3.67; max value = 6.77; arithmetic mean: ), nearly half a unit less than dew pH). For TKH (Table 4), the VWM = 6.44 (min = 6.29; max = 6.55; arithmetic mean: ). As usual [2,41], dew pH is less acidic than rain because dew reacts with more deposited aerosols (e.g., CaCO3) than rain. We note that dew samples are more acidic than the “Vaimato” and “Eau Royale” local spring waters (pHVaimato = 7.65 and pHEau_Royale = 7.9). The WHO drinking standards recommend 6.5 < pH < 9.5 [39], dew and rainwater pH are thus somewhat below the lower recommended value.
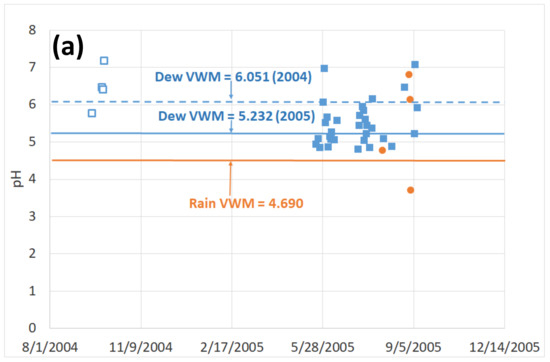
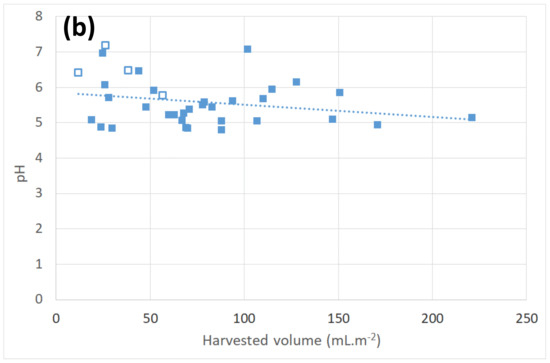
Figure 5.
(a): Evolution of pH (volume weighted) measured at TAH (□: 2004 data, ■: 2005 data). Interrupted line: dew volume weighted mean (VWM) for year 2004. Full lines: dew and rain VWM for year 2005. (b): Dew pH versus daily harvested volume at TAH (□: 2004 data, ■: 2005 data; dotted line: linear fit, see text).
Figure 5b presents the pH variation with respect to the daily harvested volume V at TAH (gravity flow plus scrapping). Note the decrease of one pH unity (pH = six to pH = five) for dew with volume from 12 to 221 mL·m−2. The data are fitted with the linear law pH = a·V + b with and (uncertainty: one standard deviation). This tendency to have lower pH with higher water volume corresponds to a lower concentration of reacting aerosols in water and is generally observed (see [2,41]).
5.1.2. Electrical Conductivity (EC)
Electrical conductivity is directly proportional to the mineral salts in solution and not to dissolved organic matter in water. Thus, the higher the concentration of dissolved solids, the higher the conductivity. Mean dew electrical conductivity is much larger than in rain samples. In Table 3, one can see that at TAH, VWM = 202.9 μS·cm−1 (2004 data) and 237.3 μS·cm−1 (2005 data) and at TKH (Table 4), VWM = 320.8 μS·cm−1, as compared to VWM = 16.0 μS·cm−1 and = 67.3 μS·cm−1. Rain EC is between five and 10 times smaller than dew EC in both locations.
Although dew and rain both absorb the ambient gases (CO2, SO2, NOx), rainwater samples contain less ion concentration than dew samples because of a larger dilution effect. The volumes of water are indeed much larger than the dew volumes. In addition, in contrast to rainwater, which rapidly runs off the substrate, dew has time to dissolve the aerosols falling on the condensing substrate for a whole night.
Several works have reported dew EC measurements. It appears that the present electrical conductivity in dew is more important than what was collected in Bordeaux/France ( = 29 μS·cm−1 and ~5 μS·cm−1 [40]); Ajaccio/France ( = 114 μS·cm−1 [42]); Paris/France (= 156 μS·cm−1 and ~59 μS·cm−1 [43]) or Zadar/Croatia ( ~196 μS·cm−1 and ~184 μS·cm−1 [41]). Polkowska et al. [44] obtained EC values in the range 41–62 μS·cm−1 for dew in Poland; Zdeb et al. [45] found ECs in the interval 40–150 μS·cm−1 in Poland on a non-industrialized suburban area. However, some of us have observed in Mirleft/Morocco and Gujarat/India, quite high ECs (respectively, 725 μS·cm−1 and 930 μS·cm−1 for dew) due to the high amount of aerosols in the vicinity of both sites [46,47]. Beysens [2] has reviewed many reports showing that dew EC values range from 18 to 930 µS·cm−1, a concentration that depends on the local deposition of aerosols.
Concerning rain EC, one notes that the electrical conductivity of rain samples is close to that of local river waters, between 40 and 150 μS·cm−1. These values are drawn from local Polynesian studies [48].
Figure 6a,b reports the EC evolution for rain and dew. As already noted in Section 4, the constancy of measurements is due to the stability of the meteorological conditions governed by the trade winds. Figure 6c reports the correlation of dew and rain ECs in relation to the total harvested volume V (scrapped and obtained by gravity). We obtain a classical dilution-governed evolution (see [2]), with a decrease in dew EC with the increase in V.
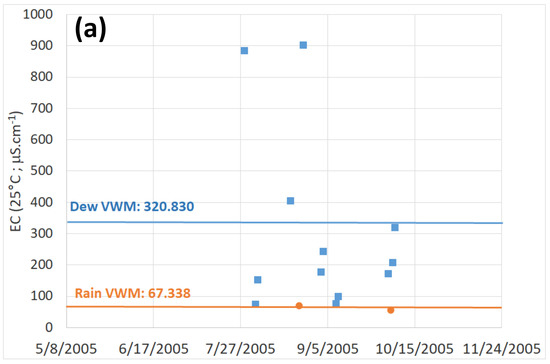
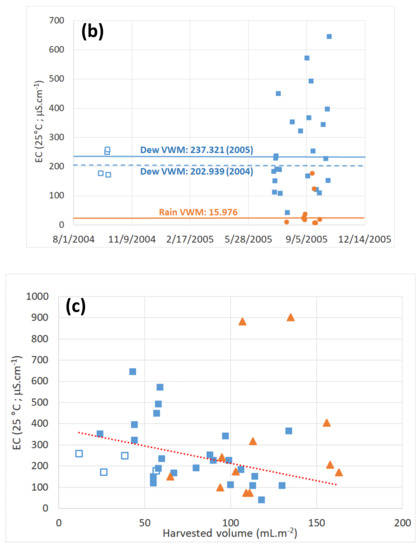
Figure 6.
Electrical conductivity (volume weighted) for dew (■) and rain (•) samples. (a) Evolution at TAH (□: 2004 data, ■: 2005 data). (b) Evolution at TKH. (c) Dew electrical conductivity versus daily harvested volume for TAH (□: 2004 data, ■: 2005 data) and TKH (▲). The dotted line is a fit to TAH data (2004 and 2005 data).
In order to verify the quality of the physico-chemical data, the calculated electrical conductivities for a given ion have been computed from the classical Kohlrausch law:
For a given ion i, is the number of charge, its concentration (mol·m−3) and the ionic conductivity (S·m2·mol−1).
The conductivity of the solution is given by:
Figure 7 reports the measured (σm) and calculated (σc) electrical conductivity for water samples (dew and rain, blank, and spring waters). As can be seen in Figure 7, σm is proportional to σc for dew and rainwater. With σm = aσc, a (dew) = 1.224 0.055 with R2 = 0.979 and a (rain) = 1.197 0.17 with R2 = 0.884 (all uncertainties are one standard deviation). The value a > 1 is correlated with the 17% difference of the ionic balance and shows that some anions are not taken into account (presumably organic acids, which are not measured). This difference is, however, below 20%, and should be acceptable according to WMO [49], meaning that the measured ions are indeed dominant in the EC determination. One notes that the EC mean values for dew and rain (TAH and TKH) respect the indicator criteria for drinkable water according to WHO (EC < 2500 μS·cm−1 [39]).
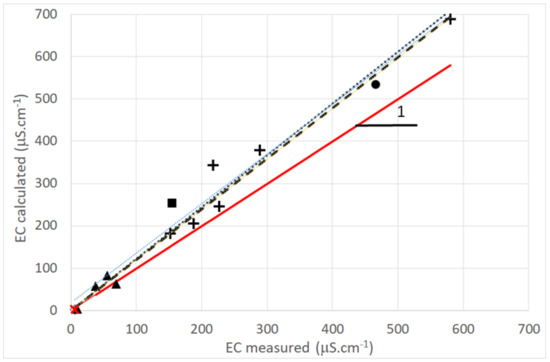
Figure 7.
Electrical conductivity (volume weighted) measured and computed from Kohlrausch’s law. Marks: +: dew; ▲: rain; x: blank test; ■: “Vaimato” spring water; •: “Eau Royale” spring water. The full line corresponds to Y = X. Dotted and interrupted lines correspond to linear dew and rain data fits (see text). (2005 data).
5.1.3. Total Dissolved Solids
One can approximate the total dissolved solids (TDS) from the electrical conductivity by the formula [50], which accounts for the major ions:
Here TDS is in mg·L−1 and EC is in μS·cm−1 at 25 °C. The correlation factor ke varies between 0.55 and 0.8. Taking the mean value ke ≈ 0.7, it comes for dew at TAH (volume weighted, Table 3), TDSdew (2004) = 142.0 mg·L−1 and TDSdew (2005) = 166.1 mg·L−1. At TKH (Table 4), VWM TDSdew = 224.6 mg·L−1. For rain, TDS is about (volume weighted) 11.2 mg·L−1 (TAH, 2005) and 47.1 mg·L−1 (TKH, 2005).
Following the EC values, the TDS values for rain are more than 10 times lower than for dew at TAH and five times lower at TKH. Similar to the electrical conductivity, TDS is higher in dew than in rain samples, corresponding to more dissolved ions in dew water. The fact that TDS is larger in TKH than in TAH can be understood by the low elevation of the atoll, favoring the capture of aerosols, of marine (NaCl, MgCl2) or local (CaCO3 coral) origins. As a matter of fact, the concentration of corresponding ions is larger at TKH than at TAH as can be seen in Section 5.2.
5.1.4. Total Hardness
The total hardness (TH) is the hydrotimetric title expressed in French degree (°f). It corresponds by definition to an equivalent of 10 mg·L−1 of calcium carbonate CaCO3 per degree. The water total hardness is a function of the Ca2+ and Mg2+ concentrations:
with MCa, MMg, the molar mass of Ca2+, Mg2+, CaCO3 (respectively, 40.08 g·mol−1, 24.3 g·mol−1 and 100.09 g·mol−1). The hydrotimetric title can thus be estimated with the simple formulation:
where and are the concentration of both cations in g·L−1.
Table 3 and Table 4 present the calculated TH (°f) for all samples. These values are compared with the measured TH in dew and rain and spring waters (Figure 8). A linear fit for dew data leads to TH (calculated) = (1.17 ± 0.067) TH (measured) with R2 = 0.968 (uncertainty: one standard deviation).
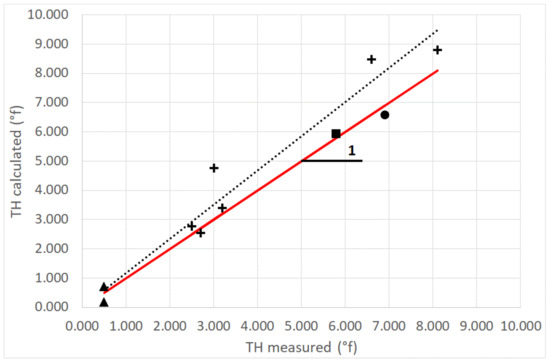
Figure 8.
Measured and estimated total water hardness TH (°f). Two rain samples (one at TAH and one at TKH) are missing. Marks: +: dew; ▲: rain. •: “Eau Royale” spring water; ■: “Vaimato” spring water. The full line corresponds to Y = X and the dotted line is a fit to the data (see text). (2005 data).
Dew and rain samples then present low total hardness values, corresponding to their low concentration of calcium (of coral origin) and magnesium (of marine origin). Water is thus very fresh () or fresh (). Dew exhibits TH values (VWM = 2.85/5.69 for TAH/TKH, min–max = 2.5–8.1) only slightly less than spring waters (THcalc = 5.92 and THmeas = 5.80 for Vaimato; THcalc = 6.58 and THmeas = 6.90 for “Eau Royale”), which also present a low concentration of calcium and magnesium. The values for spring water are relatively close, as expected since they have the same origin. The fact that these values are also close to the TAH values is a mere coincidence as the water origins are different.
5.2. Ion Concentrations
The mean concentration (mg·L−1) of all analyzed ions is shown in Figure 9 for the TAH and TKH sites. Figure 9 makes it possible to distinguish the major ions (cations: Figure 9a and anions: Figure 9c) from the minor ions (cations: Figure 9b and anions: Figure 9d) present in solution. For each ion i, dew VWM [Xi] are presented in Table 3 and Table 4. All chemical compositions (weighted by water volume or not) lead to the conclusion that for dew, rain, and spring water samples, the major cations are Na+, Ca2+, Mg2+ and K+. The concentrations of NH4+, Fe2+, Cu2+ are negligible (<0.05 mg·L−1), the Zn2+ concentrations exhibit higher concentrations, which however remain low (<0.5 mg·L−1). The origin of Zn is either natural (erosion, marine aerosols) or anthropogenic (steel galvanizing, pigments, corrosion protection of roofs and gutters, solid waste incineration). For dew, rain, and spring waters, [Na+] > [Ca2+] >> [Mg2+] ~ [K+] (a classification already observed in [47]. The origin of [Ca2+] is from coral. Other major ions are of marine origin (see Section 5.3 below). One observes for the “Eau Royale” spring water, a large [Na+] concentration, presumably from marine origin during the formation of the volcanic island.
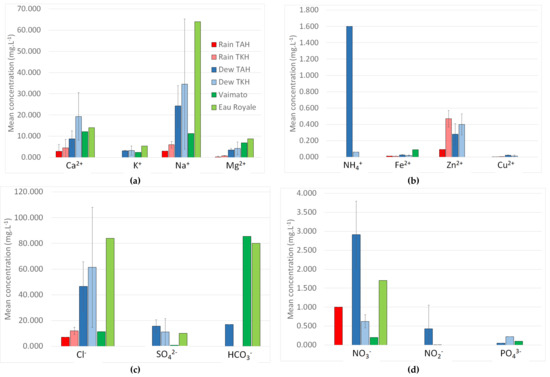
Figure 9.
Mean concentration (mg·L−1) of cations (major (a) and minor (b) ions) and anions (major (c) and minor (d)) compared to both Polynesian spring waters (“Vaimato” and “Eau Royale”). Standard deviations have been added for only dew and rain samples. (2005 data).
Three major anions are present: [Cl−] >> [HCO3−] > [SO42−]. Nitrate, nitrite and phosphate ions appear with low concentrations (<3 mg·L−1) with [NO3−] >> [NO2−] > [PO43−]. The presence in dew and rain samples of inorganic phosphorus (PO43–) and inorganic nitrogen (NO3−, NO2–, and NH4+) can have a sea origin because these chemicals are essential to the growth of marine organisms (nitrogen and phosphorus are incorporated into the tissues of marine organisms). The predominance of Na+, Mg2+, Cl− ions in dew water samples is widely described in the literature on sites close to the sea [40,42]. The large concentration of [Cl−] in “Eau Royale” spring water corresponds to the large [Na+] concentration seen above and can be attributed to fossil salt collected during the emergence of the volcanic island from the sea.
Both spring waters reveal a high concentration of HCO3− (~80 mg·L−1), missing in dew and rain samples except at a low level in dew at Tikehau (17 mg·L−1). Note that sulfate ions exhibit concentrations around 10–15 mg·L−1 in dew samples at Tikehau and Tahiti, but are missing in rain samples at the same locations, an effect which can be attributed to a larger dilution. Such a sulfate concentration is mainly of marine origin (see Section 5.3 below where the sulfate concentration, larger in TAH than in TKH, is presumably of anthropogenic origin).
The ionic balance has been determined to verify the quality of the chemical analysis. Based on each ionic concentration, the sum of cations (volume weighted) is compared to the sum of anions (volume weighted) in order to test electro-neutrality for dew, rain, blank and spring water samples (Figure 10). We can conclude that a good correlation is found for all samples where (R2 = 0.909) (uncertainty: one standard deviation) and for dew samples where (R2 = 0.921) (uncertainty: one standard deviation). A first group integrates all dew samples with equivalent concentrations ranging from one to five mEq·L−1 including, on the same scale, both spring waters (“Vaimato” and “Eau Royale”, about 1.7 and 4 mEq·L−1, respectively). A second group is concerned with the rain samples with small ion balance values (about 0.5 mEq·L−1). According to WMO [49], the acceptable difference for concentrations > 0.5 mEq/L is 10%. Then, the ratio between the sum of cations and sum of anions, which presents 17% imbalance, shows that some anions are not taken into account. These ions are presumably organic acids, which were not measured.
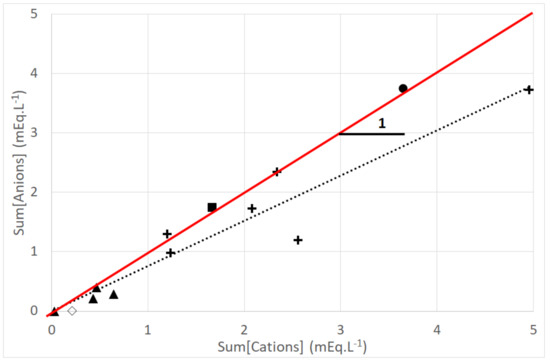
Figure 10.
Electrical neutrality. Sums of cations (Na+, K+, Ca2+, Fe2+, Zn2+, Cu2+, Mg2+, NH4+) versus sum of anions (HCO3−, Cl−, SO42−, NO2−, PO43−, NO3−). Marks: +: dew; ▲: rain; ◊: blank test; ■: “Vaimato” spring water; •: “Eau Royale” spring water. The full line corresponds to Y = X. The dotted line corresponds to a linear fit to dew data. (2005 data).
5.3. Marine Influence
Due to its location in the middle of the Pacific Ocean (respectively, 5900 km and 8200 km from Australia and South America mainland), with a wind regime dominated by trade winds (see Section 4), chemical compositions of water from French Polynesia islands are greatly influenced by the presence of the sea. In order to verify the marine contribution of dew and rain ions, the sea salt fraction (SSF) and non-sea-salt fraction (NSSF) were calculated. The six most abundant ions of seawater are chloride (Cl−), sodium (Na+), sulfate (SO42−), magnesium (Mg2+), calcium (Ca2+) and potassium (K+). By weight, these ions form about 99% of all sea salts. The presence of Na+ cation in dew and rain samples corresponds to a symptomatic sea origin and is considered as a reference for SSF and NSSF estimations following the equations:
with
where X is the mean concentration of ions measured in dew and rain samples, Xsea represents the concentration of the sea water ions [51,52] and the sodium concentration taken as a reference in sea water. Table 5 summarizes the results for SSF and NSSF for dew and rain relative to the major ions in solution.

Table 5.
Sea salt fraction (SSF) (%) and non-sea-salt fraction (NSSF) (%) for dew and rain samples relative to major cations (Ca2+, K+, Mg2+) and anions (Cl−, SO42−, HCO3−). In bold, the largest contributions are indicated. The contributions to SSF and NSSF cannot be calculated when the concentrations of chemical element X are too low (noted as -). (2005 data).
As expected, one can conclude that Na+, Mg2+ and Cl− are clearly of sea origin (dew and rain). This result can be correlated with the plot between {[Na+] + [Mg2+]} versus [Cl−] presented in Figure 11. It exhibits a linear correlation Y = aX between the sum of both Na+ and Mg2+ concentrations (mEq·L−1) versus Cl− (mEq·L−1). For dew samples, a = 0.899 ± 0.032 with R2 = 0.974 (uncertainty: one standard deviation) and for rain samples, a = 0.799 ± 0.027 with R2 = 0.996 (uncertainty: one standard deviation).
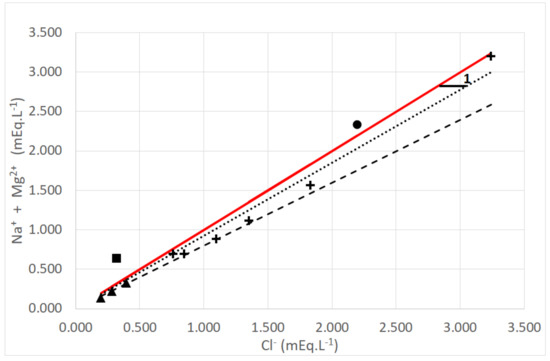
Figure 11.
Comparison between the volume weighted sum of Na+ and Mg2+ cations versus Cl− anion (sea salts NaCl and MgCl2). Due to the very low concentrations for Na+ and Cl−, one sample at TAH is missing. Marks: +: dew; ▲: rain; ■: “Vaimato” spring water; •: “Eau Royale” spring water. The full line corresponds to Y = X. Dotted (dew) and interrupted (rain) lines correspond to a linear fit of the data (see text). (2005 data).
In contrast, Ca2+, related to the presence of the coral reef, is of non-marine origin for dew and rain (%NSSF > 90%). In dew samples (TAH and TKH), the same result is observed for K+ (%NSSF > 64%) and HCO3− (%NSSF = 98% for TAH dew samples). The case of SO42− in dew is from sea origin in TKH, but rather undetermined at TAH, with %SSF values (and %NSSF) around 50%, in favor of mixed sea–anthropogenic activities origin.
6. Biological Analysis
The number of biological analyses was fewer than the chemistry analyses (five dew and one rain samples). They were concerned with bacteria reviviscible aerobe microorganisms (designed as CFU for dew and rain) [53]. The time lag between sampling and analysis, between 1 day and 2 weeks, makes the determined values a maximum, the initial water certainly showing fewer CFUs.
CFU developing at 22 °C corresponds to vegetal bacteria; its recommended maximum level by WHO is 100 CFU·mL−1 [39]. This level is exceeded in the present data where CFU >300 (Table 3 and Table 4). However, those bacteria are harmless to humans. These vegetal bacteria naturally come from the atmospheric environment of the condenser.
CFU developing at 36 °C corresponds to animal or human bacteria, and the recommended maximum level is 10 CFU·mL−1 for drinking-water leaving treatment plan [39]. At this level, total coliforms, thermotolerant coliforms and Escherichia coli should be absent. It is worth noticing that this level is exceeded in the present samples where CFU > 300. The origin of such bacteria can be found in human manipulation, contact with animals (small mammals), birds and insects (flies, ants), which can drink dew water and easily contaminate it.
Despite the small number of samples, which does not allow for a definitive conclusion to be made, for the sake of precaution, dew and rainwater should be submitted to a disinfection treatment before being used for human consumption.
7. Concluding Remarks
This work presents a comparison between rainwater and dew samples under humid tropical environments in French Polynesia at two sites, Tikehau and Tahiti islands, during the dry season of years 2004 and 2005. These results are compared with both local spring waters (“Vaimato” and “Eau Royale”). Dew, as usually observed, exhibits much higher ion concentration than rain, resulting from an aerosol dilution effect. Chemical composition mainly consists of Na+, Ca2+, Mg2+, Cl− and SO42−. The sea salt fraction assesses the marine origin of Na+, Mg2+, Cl− and SO42−. The deposition of coral particles can explain the presence of Ca2+ more importantly in dew water (four times higher than in rainwater). Although SO42− in dew is clearly from sea origin in Tikehau, it is in favor of mixed sea–anthropogenic origin in Tahiti. Dew compares well with the spring waters distributed in French Polynesia due to its large ion concentration. Both dew and rain are close to the WHO requirements but should be disinfected to be potable. The dry period leading to a shortage of water, dew and rain can thus represent a possible alternative for potable water if disinfected before use.
Author Contributions
Conceptualization, D.B.; Data curation, M.M. and D.B.; Formal analysis, M.M., O.C. and D.B.; Funding acquisition, P.O. and I.M.; Investigation, O.C. and D.B.; Methodology, M.M., I.M. and D.B.; Project administration, P.O.; Resources, P.O. and I.M.; Supervision, D.B.; Writing – original draft, M.M.; Writing – review & editing, M.M., P.O. and Daniel Beysens. All authors have read and agreed to the published version of the manuscript.
Funding
Support is gratefully acknowledged from the “Ministère Français de l’Outre-Mer” and “Collectivité Territoriale de Corse”. We are very grateful to the Natua family for having kindly welcomed the experiments in Tikehau. We are grateful to R. Matehau and D. Teiva for their help in the data collection. We would like to thank the French Polynesia department of Météo-France for the meteorological data and the Vaimato and Eau Royale companies for their contribution.
Informed Consent Statement
Not applicable.
Data Availability Statement
Publicly available datasets were analyzed in this study. This data can be found here: [https://ftp.espci.fr/incoming/beysens/Data_French_Polynesia].
Acknowledgments
This study has been carried through collaboration between the University of French Polynesia, the University of Corsica and the French Alternative Energies and Atomic Energy Commission. We gratefully thank Gaël Leclerc from LESE laboratory (Laboratoire d’Etude et de Surveillance de l’Environnement) for dew and rain samples analyses.
Conflicts of Interest
The authors declare no conflict of interest.
References
- Monteith, J.L.; Unsworth, M.H. Principles of Environmental Physics. Plants, Animals, and the Atmosphere, 4th ed.; Academic Press: Oxford, UK, 2013. [Google Scholar]
- Beysens, D. Dew Water; Rivers Publisher: Gistrup, UK, 2018. [Google Scholar]
- Monteith, J.L. Dew. Q. J. R. Meteorol. Soc. 1957, 83, 322–341. [Google Scholar] [CrossRef]
- Berkowicz, S.; Beysens, D.; Milimouk-Melnytchouk, I.; Heusinkveld, B.G.; Muselli, M.; Jacobs, A.F.G.; Clus, O. Urban dew collection in Jerusalem: A three-year analysis. In Proceedings of the 4th International Conference on Fog, Fog Collection and Dew, La Serena, Chile, 22–27 July 2007; pp. 297–300. [Google Scholar]
- Zangvil, A. Six years of dew observations in the Negev Desert, Israel. J. Arid Environ. 1996, 32, 361–371. [Google Scholar] [CrossRef]
- Ben-Asher, J.; Alpert, P.; Ben-Zvi, A. Dew is a major factor affecting vegetation water use efficiency rather than a source of water in the eastern Mediterranean area. Water Resour. Res. 2010, 46, w10532. [Google Scholar] [CrossRef]
- Jacobs, A.F.G.; van Boxel, J.H.; Nieveen, J. Nighttime exchange processes near the soil surface of a maize canopy. Agric. For. Meteorol. 1996, 82, 155–169. [Google Scholar] [CrossRef]
- Uclés, O.; Villagarcía, L.; Moro, M.J.; Canton, Y.; Domingo, F. Role of dewfall in the water balance of a semiarid coastal steppe ecosystem. Hydrol. Proc. 2013, 28, 2271–2280. [Google Scholar] [CrossRef]
- Konrad, W.; Burkhardt, J.; Ebner, M.; Roth-Nebelsick, A. Leaf pubescence as a possibility to increase water use efficiency by promoting condensation. Ecohydrology 2015, 8, 480–492. [Google Scholar] [CrossRef]
- Malik, F.T.; Clement, R.M.; Gethin, D.T.; Beysens, D.; Cohen, R.E.; Krawszik, W.; Parker, A.R. Dew harvesting efficiency of four species of cacti. Bioinspir. Biomim. 2015, 10, 036005. [Google Scholar] [CrossRef]
- Guo, X.; Zha, T.; Jia, X.; Wu, B.; Feng, W.; Xie, J.; Gong, J.; Zhang, Y.; Peltola, H. Dynamics of dew in a cold desert-shrub ecosystem and its abiotic controls. Atmosphere 2016, 2016, 32. [Google Scholar] [CrossRef]
- Wang, L.; Kaseke, K.; Seely, M. Effects of non-rainfall water inputs on ecosystem functions. WIREs Water 2017, 4, e1179. [Google Scholar] [CrossRef]
- Gerlein-Safdi, C.; Koohafkan, M.C.; Chung, M.; Rockwell, F.E.; Thompson, S.; Caylor, K.K. Dew deposition suppresses transpiration and carbon uptake in leaves. Agric. For. Meteorol. 2018, 259, 305–316. [Google Scholar] [CrossRef]
- Wang, L.; Kaseke, K.F.; Ravi, S.; Jiao, W.; Mushi, R.; Shuuya, T.; Maggs-Kolling, G. Convergent vegetation fog and dew water use in the Namib Desert. Ecohydrology 2019, 12, e2130. [Google Scholar] [CrossRef]
- Carlos, A.; Aguirre-Gutiérrez, F.H.; Gregory, R.; Delgadod, G.J.; Yepez, E.; Carbajala, N.; Escoto-Rodríguez, M.; Arredondo, J.T. The importance of dew in the water balance of a continental semiarid grassland. J. Arid Environ. 2019, 168, 26–35. [Google Scholar]
- Liu, M.; Cena, Y.; Wanga, C.; Gua, X.; Bowler, P.; Wu, D.; Zhang, L.; Jiang, G.; Beysens, D. Foliar uptake of dew in the sandy ecosystem of the Mongolia Plateau: A lifesustaining and carbon accumulation strategy shared differently by C3 and C4 grasses. Agric. For. Meteorol. 2020, 287, 107941. [Google Scholar] [CrossRef]
- Tomaszkiewicz, M.; Najm, M.A.; Beysens, D.; Alameddine, I.; El-Fadel, M. Dew as a sustainable non-conventional water resource: A critical review. Environ. Rev. 2015, 23, 425–442. [Google Scholar] [CrossRef]
- Kaseke, K.; Wang, L. Fog and dew as potable water resources—Maximizing harvesting potential and water quality concerns. GeoHealth 2018, 2, 327–332. [Google Scholar] [CrossRef]
- Goheen, A.C.; Pearson, R.C. Compendium of Grape Diseases. APS Press: St. Paul, MN, USA, 1988. [Google Scholar]
- Francl, L.J.; Panigrahi, S. Artificial neural network models of wheat leaf wetness. Agric. For. Meteorol. 1997, 88, 57–65. [Google Scholar] [CrossRef]
- Luo, W.; Goudriaan, J. Dew formation on rice under varying durations of nocturnal radiative loss. Agric. For. Meteorol. 2000, 104, 303–313. [Google Scholar] [CrossRef]
- Agam, N.; Berliner, P. Dew formation and water vapor adsorption in semi-arid environments—A review. J. Arid Environ. 2006, 65, 572–590. [Google Scholar] [CrossRef]
- Rubio, M.A.; Lissi, E.; Riveros, V.; Paez, M. Remoción de contaminantes por lluvias y rocíos en la región metropolitana. J. Chil. Chem. Soc. 2001, 46, 353–361. [Google Scholar] [CrossRef]
- Rubio, M.A.; Lissi, E.; Villena, G. Nitrite in rain and dew in Santiago city, Chile. Its possible impact on the early morning start of the photochemical smog. Atmos. Environ. 2002, 36, 293–297. [Google Scholar] [CrossRef]
- Xu, N.; Zhao, L.; Ding, C.; Zhang, C.; Li, R.; Zhong, Q. Laboratory observation of dewformation at an early stage of atmospheric corrosion of metals. Corros. Sci. 2001, 44, 163–170. [Google Scholar] [CrossRef]
- Laurent, V.; Maamaatuaiahutapu, K.; Maiau, J.; Varney, P. Atlas climatologique de la Polynésie française. Météo-France, Direction interrégionale de Polynésie française: Papeete, France, 2004; p. 201. [Google Scholar]
- OPUR. 2020. Available online: www.opur.fr (accessed on 7 October 2020).
- Nilsson, T.M.J.; Vargas, W.E.; Niklasson, G.A.; Granqvist, C.G. Condensation of water by radiative cooling. Renew. Energy 1994, 5, 310–317. [Google Scholar] [CrossRef]
- Dee, D.P.; Uppala, S.; Simmons, A.; Berrisford, P.; Poli, P.; Kobayashi, S.; Andrae, U.; Alonso-Balmaseda, M.; Balsamo, G.; Bauer, P.; et al. The ERA-Interim reanalysis: Configuration and performance of the data assimilation system. Q. J. R. Meteorol. Soc. 2011, 137, 553–597. [Google Scholar] [CrossRef]
- Berrisford, P.; Kållberg, P.; Kobayashi, S.; Dee, D.; Uppala, S.; Simmons, A.J.; Poli, P.; Sato, H. Atmospheric conservation properties in ERA-Interim. Q. J. R. Meteorol. Soc. 2011, 137, 1381–1399. [Google Scholar] [CrossRef]
- Ozog, R. Inventaire des données relatives à l’eau souterraine disponibles sur Tahiti: Rapport intermédiaire; Rapport BRGM/RP-61147-FR; BRGM: Orleans, France, 2012. [Google Scholar]
- Clus, O.; Ortega, P.; Muselli, M.; Milimouk, I.; Beysens, D. Study of dew water collection in humid tropical islands. J. Hydrol. 2008, 361, 159–171. [Google Scholar] [CrossRef]
- Beysens, D. Estimating dew yield worldwide from a few meteo data. Atmos. Res. 2016, 167, 146–155. [Google Scholar] [CrossRef]
- Weather Underground. 2020. Available online: https://www.wunderground.com/ (accessed on 7 October 2020).
- NOAA. National Weather Service. 2020. Available online: https://www.forecast.weather.gov (accessed on 7 October 2020).
- Berger, X.; Buriot, D.; Gamier, F. About the equivalent radiative temperature for clear skies. Sol. Energy 1984, 32, 725–733. [Google Scholar] [CrossRef]
- Stein, A.F.; Draxler, R.R.; Rolph, G.D.; Stunder, B.J.B.; Cohen, M.D.; Ngan, F. NOAA’s HYSPLIT atmospheric transport and dispersion modeling system. Bull. Am. Meteor. Soc. 2015, 96, 2059–2077. [Google Scholar] [CrossRef]
- Rolph, G.; Stein, A.; Stunder, B. Real-time Environmental Applications and Display sYstem: READY. Environ. Modell. Softw. 2017, 95, 210–222. [Google Scholar] [CrossRef]
- World Health Organization (WHO). Guidelines for Drinking-Water Quality, 4th ed.; Incorporating the 1st Addendum; World Health Organization: Geneva, Switzerland, 2017; p. 631. ISBN 9789241549950. [Google Scholar]
- Beysens, D.; Ohayon, C.; Muselli, M.; Clus, O. Chemical and biological characteristics of dew and rain water in an urban coastal area (Bordeaux, France). Atmos. Environ. 2006, 40, 3710–3723. [Google Scholar] [CrossRef]
- Lekouch, I.; Mileta, M.; Muselli, M.; Milimouk-Melnytchouk, I.; Šojate, V.; Kabbachi, B.; Beysens, D. Comparative chemical analysis of dew and rain water. Atmos. Res. 2010, 95, 224–234. [Google Scholar] [CrossRef]
- Muselli, M.; Beysens, D.; Soyeux, E.; Clus, O. Is Dew Water Potable? Chemical and Biological Analyses of Dew Water in Ajaccio (Corsica Island, France). J. Environ. Qual. 2006, 35, 1812–1817. [Google Scholar] [CrossRef] [PubMed]
- Beysens, D.; Mongruel, A.; Acker, K. Urban dew and rain in Paris, France: Occurrence and physico-chemical characteristics. Atmos. Res. 2017, 189, 152–161. [Google Scholar] [CrossRef]
- Polkowska, Z.; Astel, A.; Walna, B.; Małek, S.; Mędrzycka, K.; Górecki, T. Chemometric analysis of rainwater and throughfall at several sites in Poland. Atmos. Environ. 2005, 39, 837–855. [Google Scholar] [CrossRef]
- Zdeb, M.; Papciak, D.; Zamorska, J. An assessment of the quality and use of rainwater as the basis for sustainable water management in suburban areas. E3S Web Conf. 2018, 45, 00111. [Google Scholar] [CrossRef]
- Sharan, G.; Clus, O.; Singh, S.; Muselli, M.; Beysens, D. A very large dew and rain ridge collector in the Kutch area (Gujarat, India). J. Hydrol. 2011, 405, 171–181. [Google Scholar] [CrossRef]
- Lekouch, I.; Muselli, M.; Kabbachi, B.; Ouazzani, J.; Melnytchouk-Milimouk, I.; Beysens, D. Dew, fog, and rain as supplementary sources of water in south-western Morocco. Energy 2011, 36, 2257–2265. [Google Scholar] [CrossRef]
- Seguin, F. L’état de l’environnement en Polynésie française. Direct Environ. 2014, 193. [Google Scholar]
- Allan, M.A. Manual for the GAW Precipitation Chemistry Programme: Guidelines, Data Quality Objectives and Standard Operating Procedures; World Meteorological Organization: Geneva, Switzerland, 2004. [Google Scholar]
- Atekwanaa, E.A.; Atekwanaa, E.A.; Rowe, R.S.; Werkema, D.D., Jr.; Legall, F.D. The relationship of total dissolved solids measurements to bulk electrical conductivity in an aquifer contaminated with hydrocarbon. J. Appl. Geophys. 2004, 56, 281–294. [Google Scholar] [CrossRef]
- Klein, B.; Roether, W.; Manca, B.; Bregant, D.; Beitzel, V.; Kovacevic, V.; Lucchetta, A. The large deep water transient in the Eastern Mediterranean. Deep Sea Res. 1999, 46, 371–414. [Google Scholar] [CrossRef]
- Reynaud, S.; Ferier-Pagès, C.; Kamber, B.S.; Samankassou, E. Effect of salinity on the skeletal chemistry of cultured scleractinian zooxanthellate corals: Cd/Ca ratio as a potential proxy for salinity reconstruction. Coral Reefs 2014, 33, 169–180. [Google Scholar]
- Rodier, J. L’analyse de L’eau: Eaux Naturelles, Eaux Résiduaires, Eau de Mer, 8th ed.; Dunod: Paris, France, 1996. [Google Scholar]
Publisher’s Note: MDPI stays neutral with regard to jurisdictional claims in published maps and institutional affiliations. |
© 2021 by the authors. Licensee MDPI, Basel, Switzerland. This article is an open access article distributed under the terms and conditions of the Creative Commons Attribution (CC BY) license (http://creativecommons.org/licenses/by/4.0/).