Sustainable Development of the Historic Centre of Naples: The Impact of Vehicular Traffic and Food Service Business on Air Quality


Abstract
1. Introduction
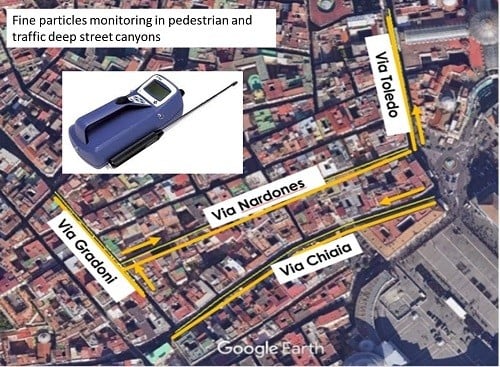
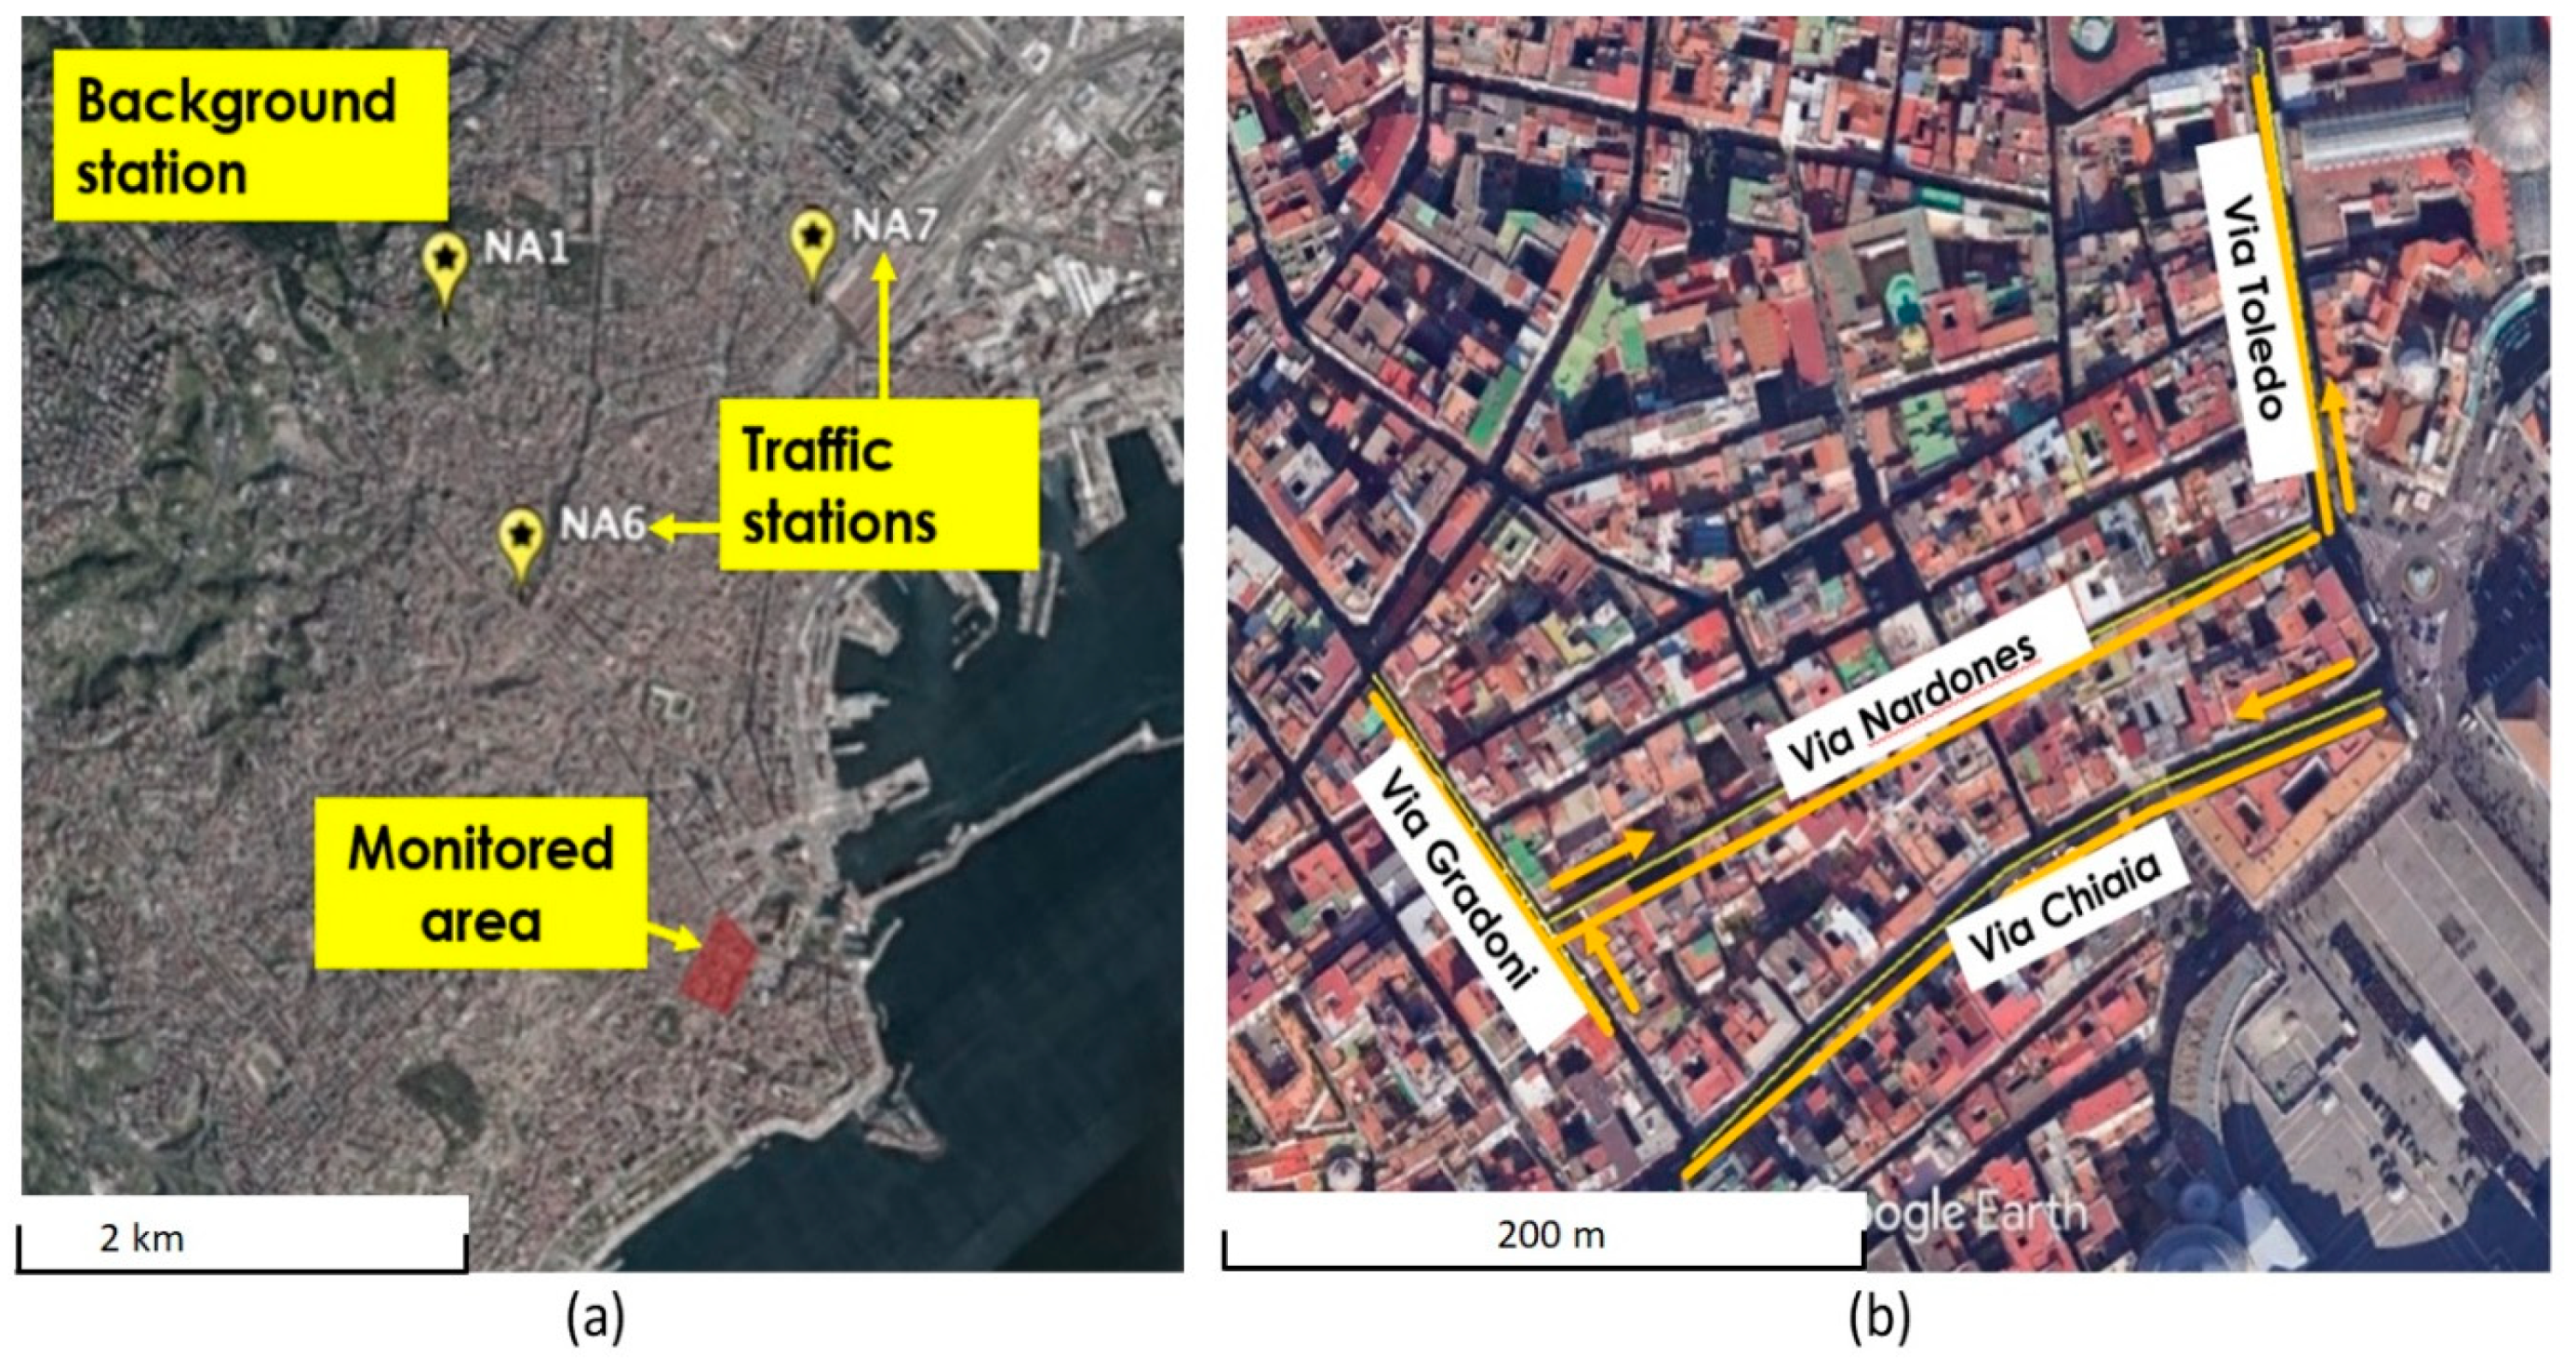
2. Experiments
3. Results
4. Discussion
5. Conclusions
- (i)
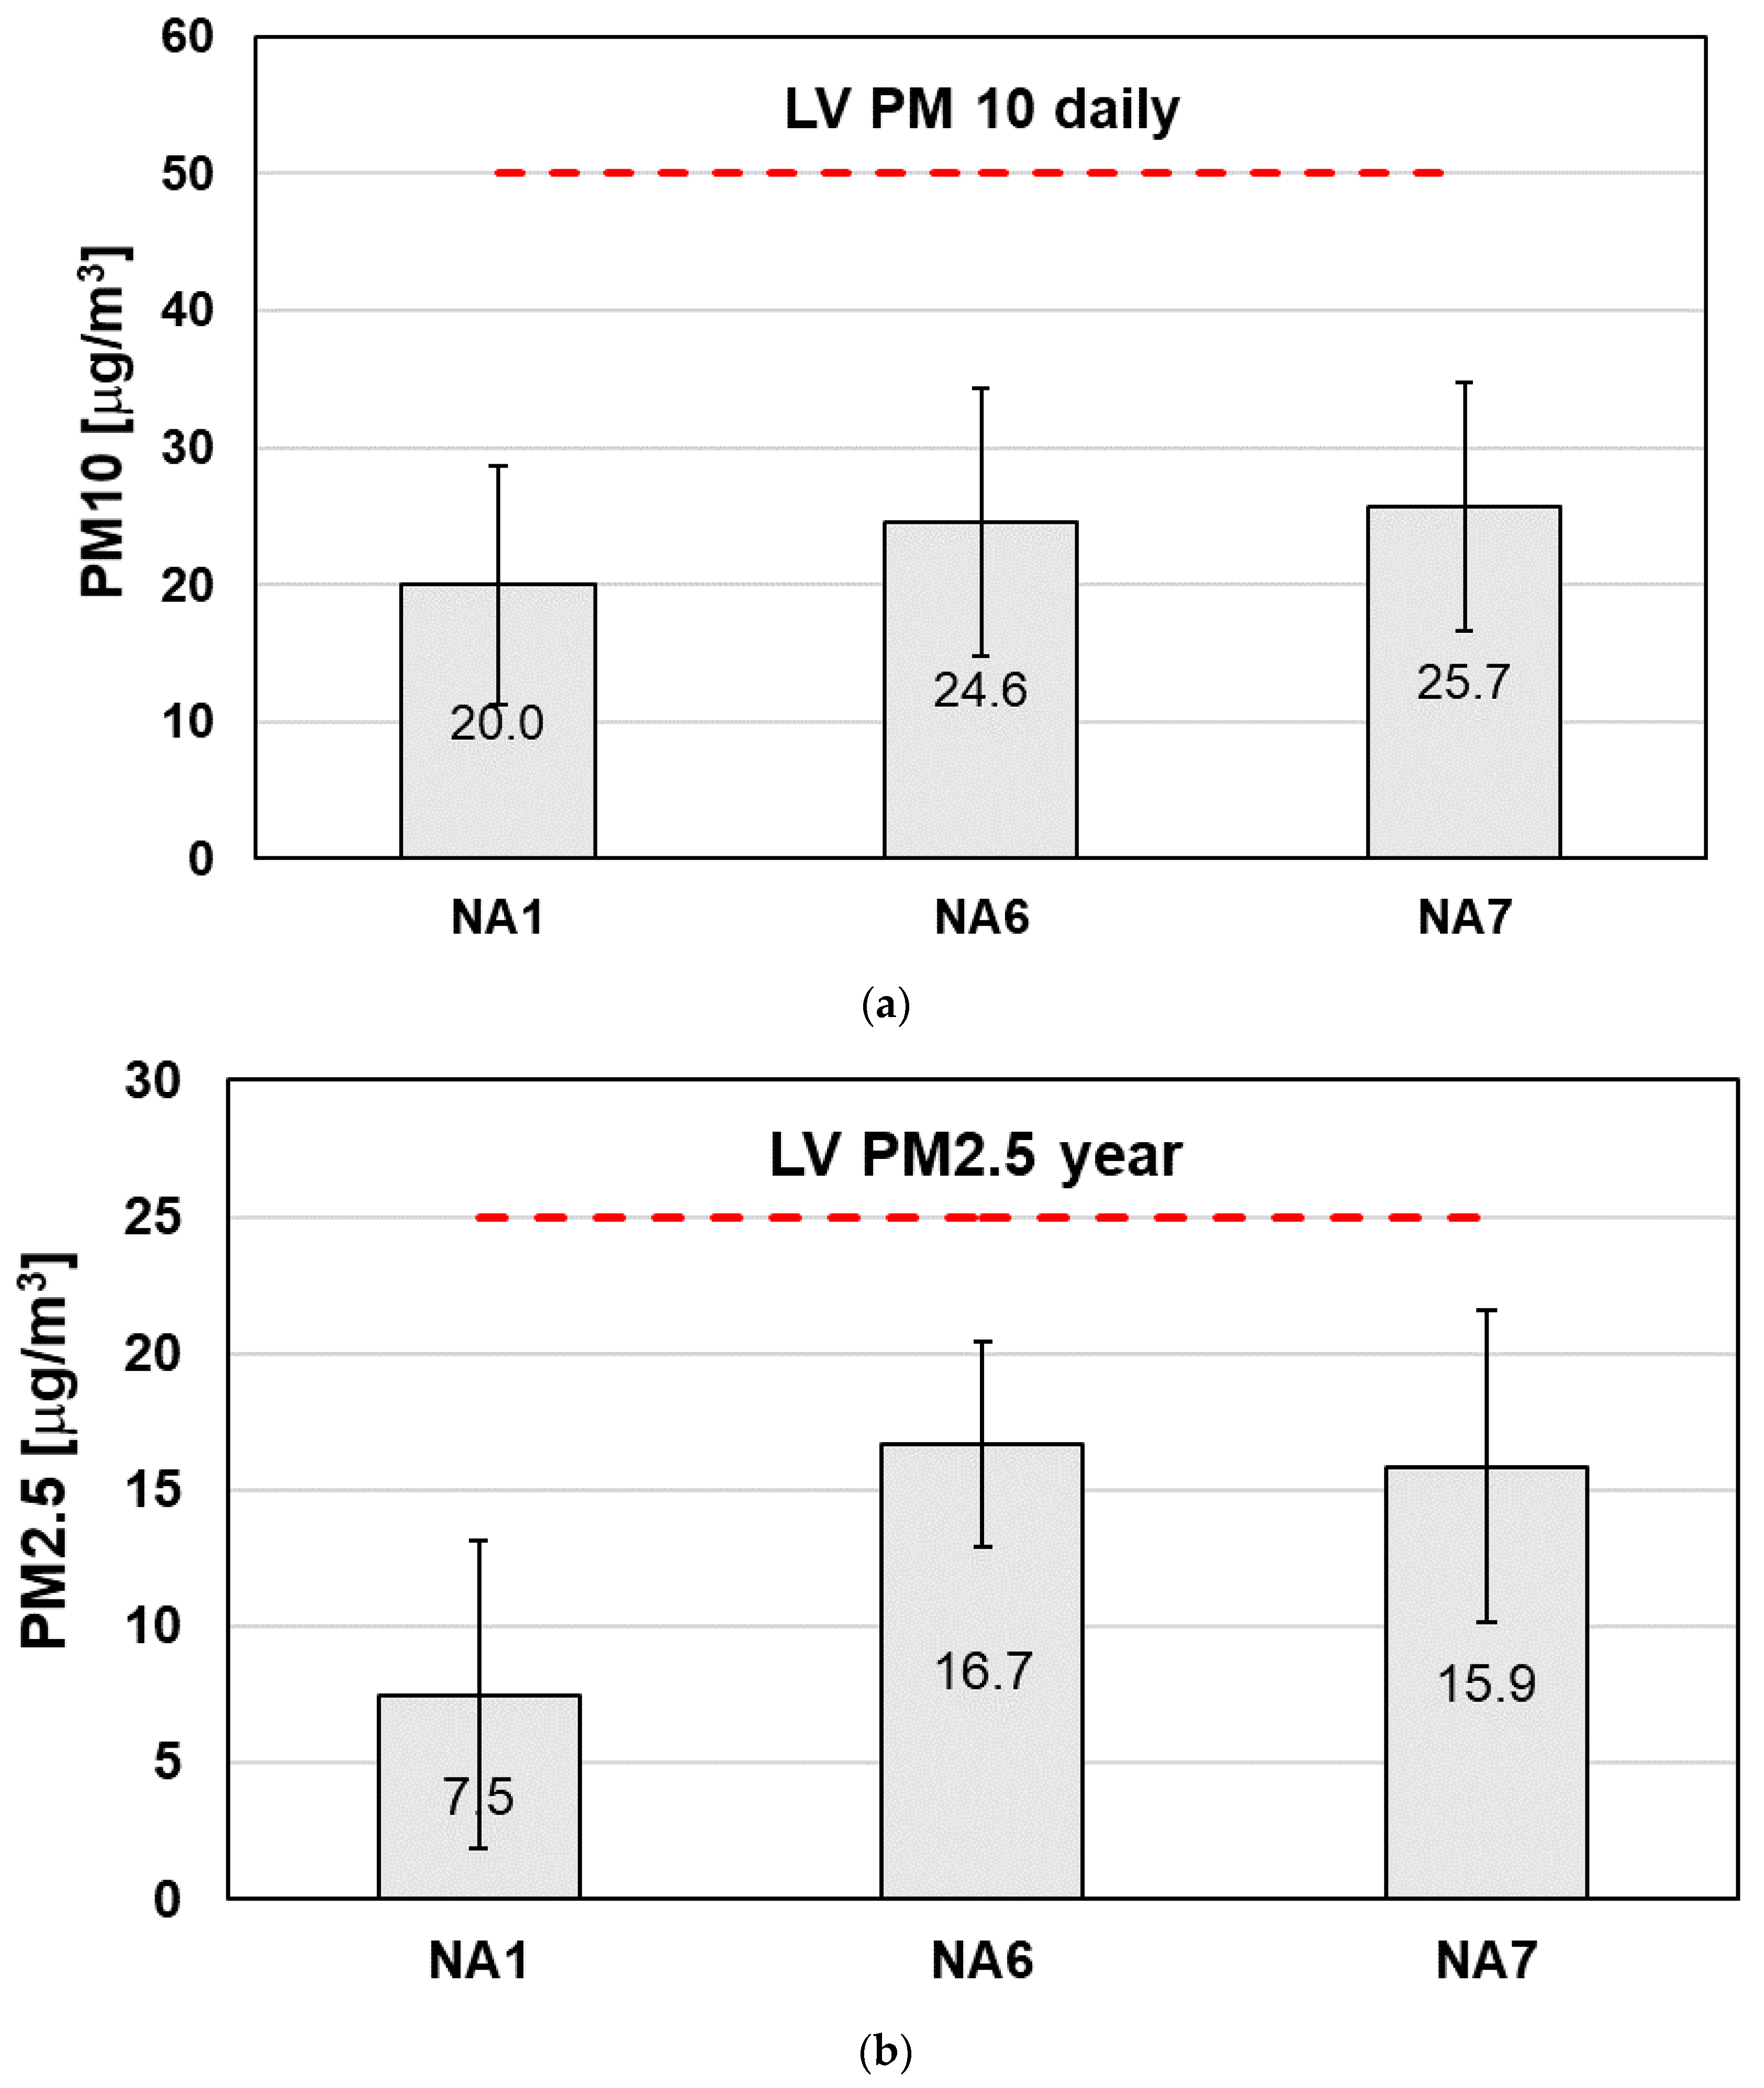
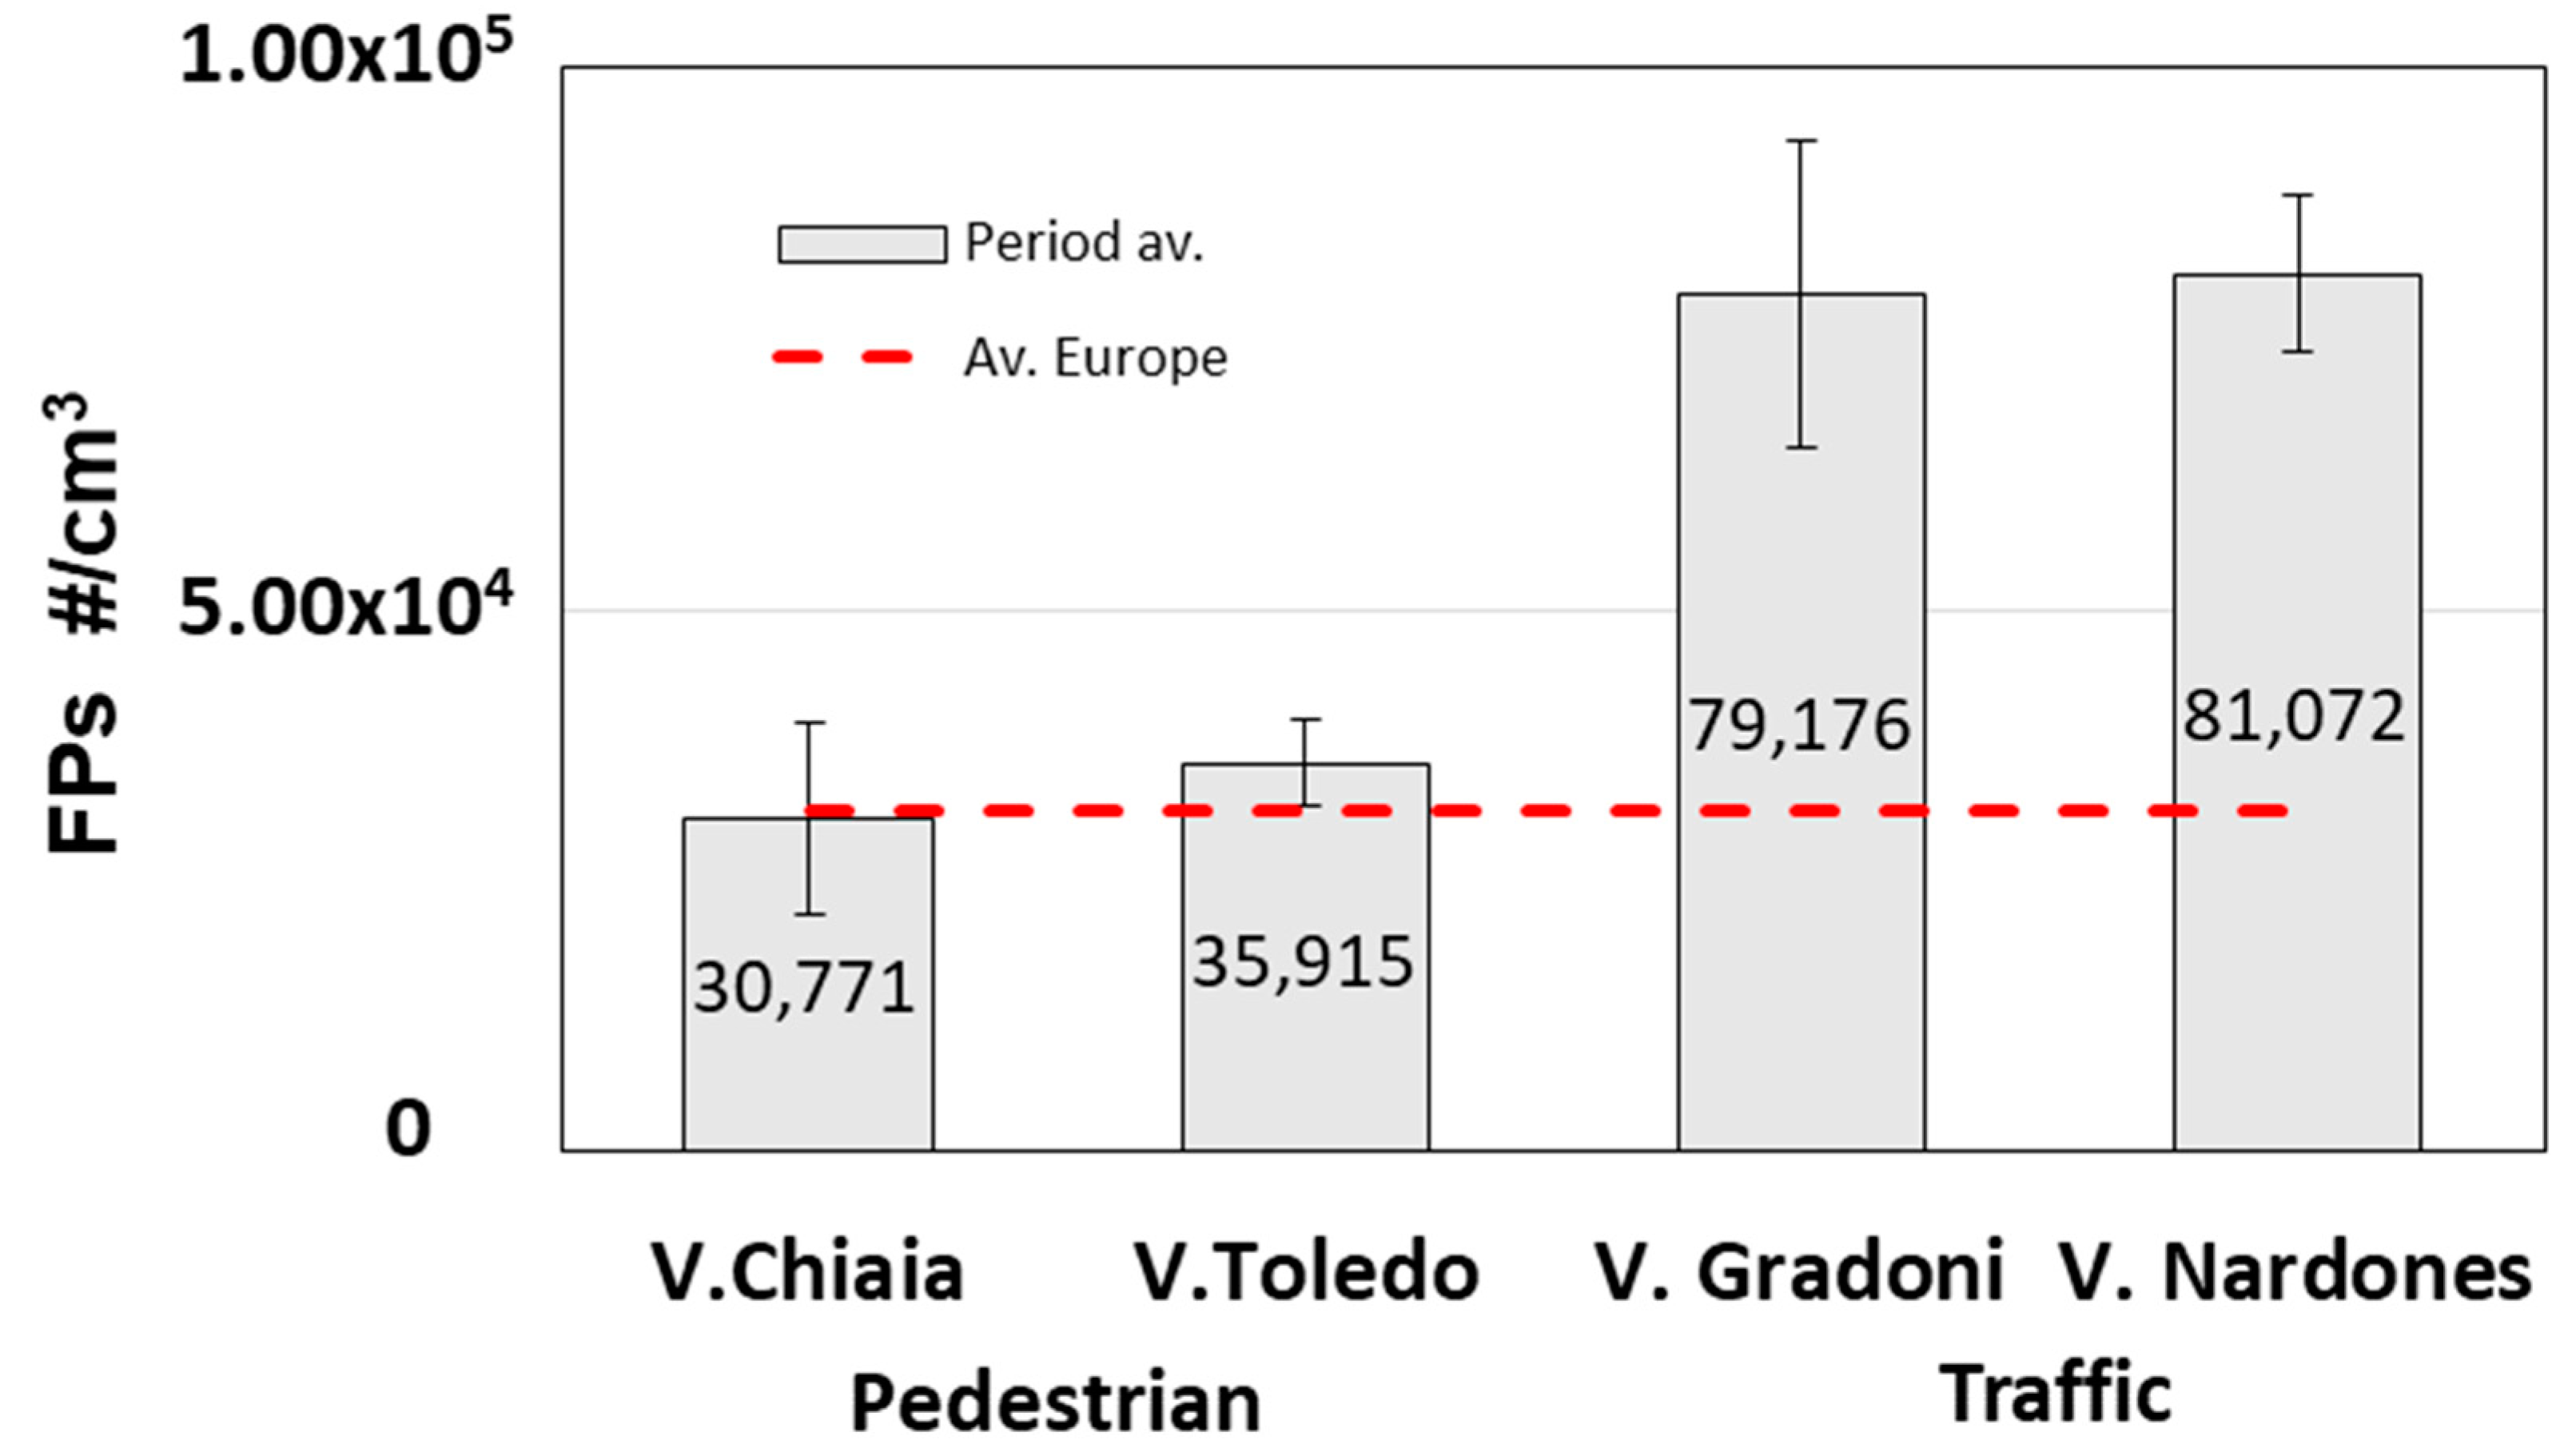
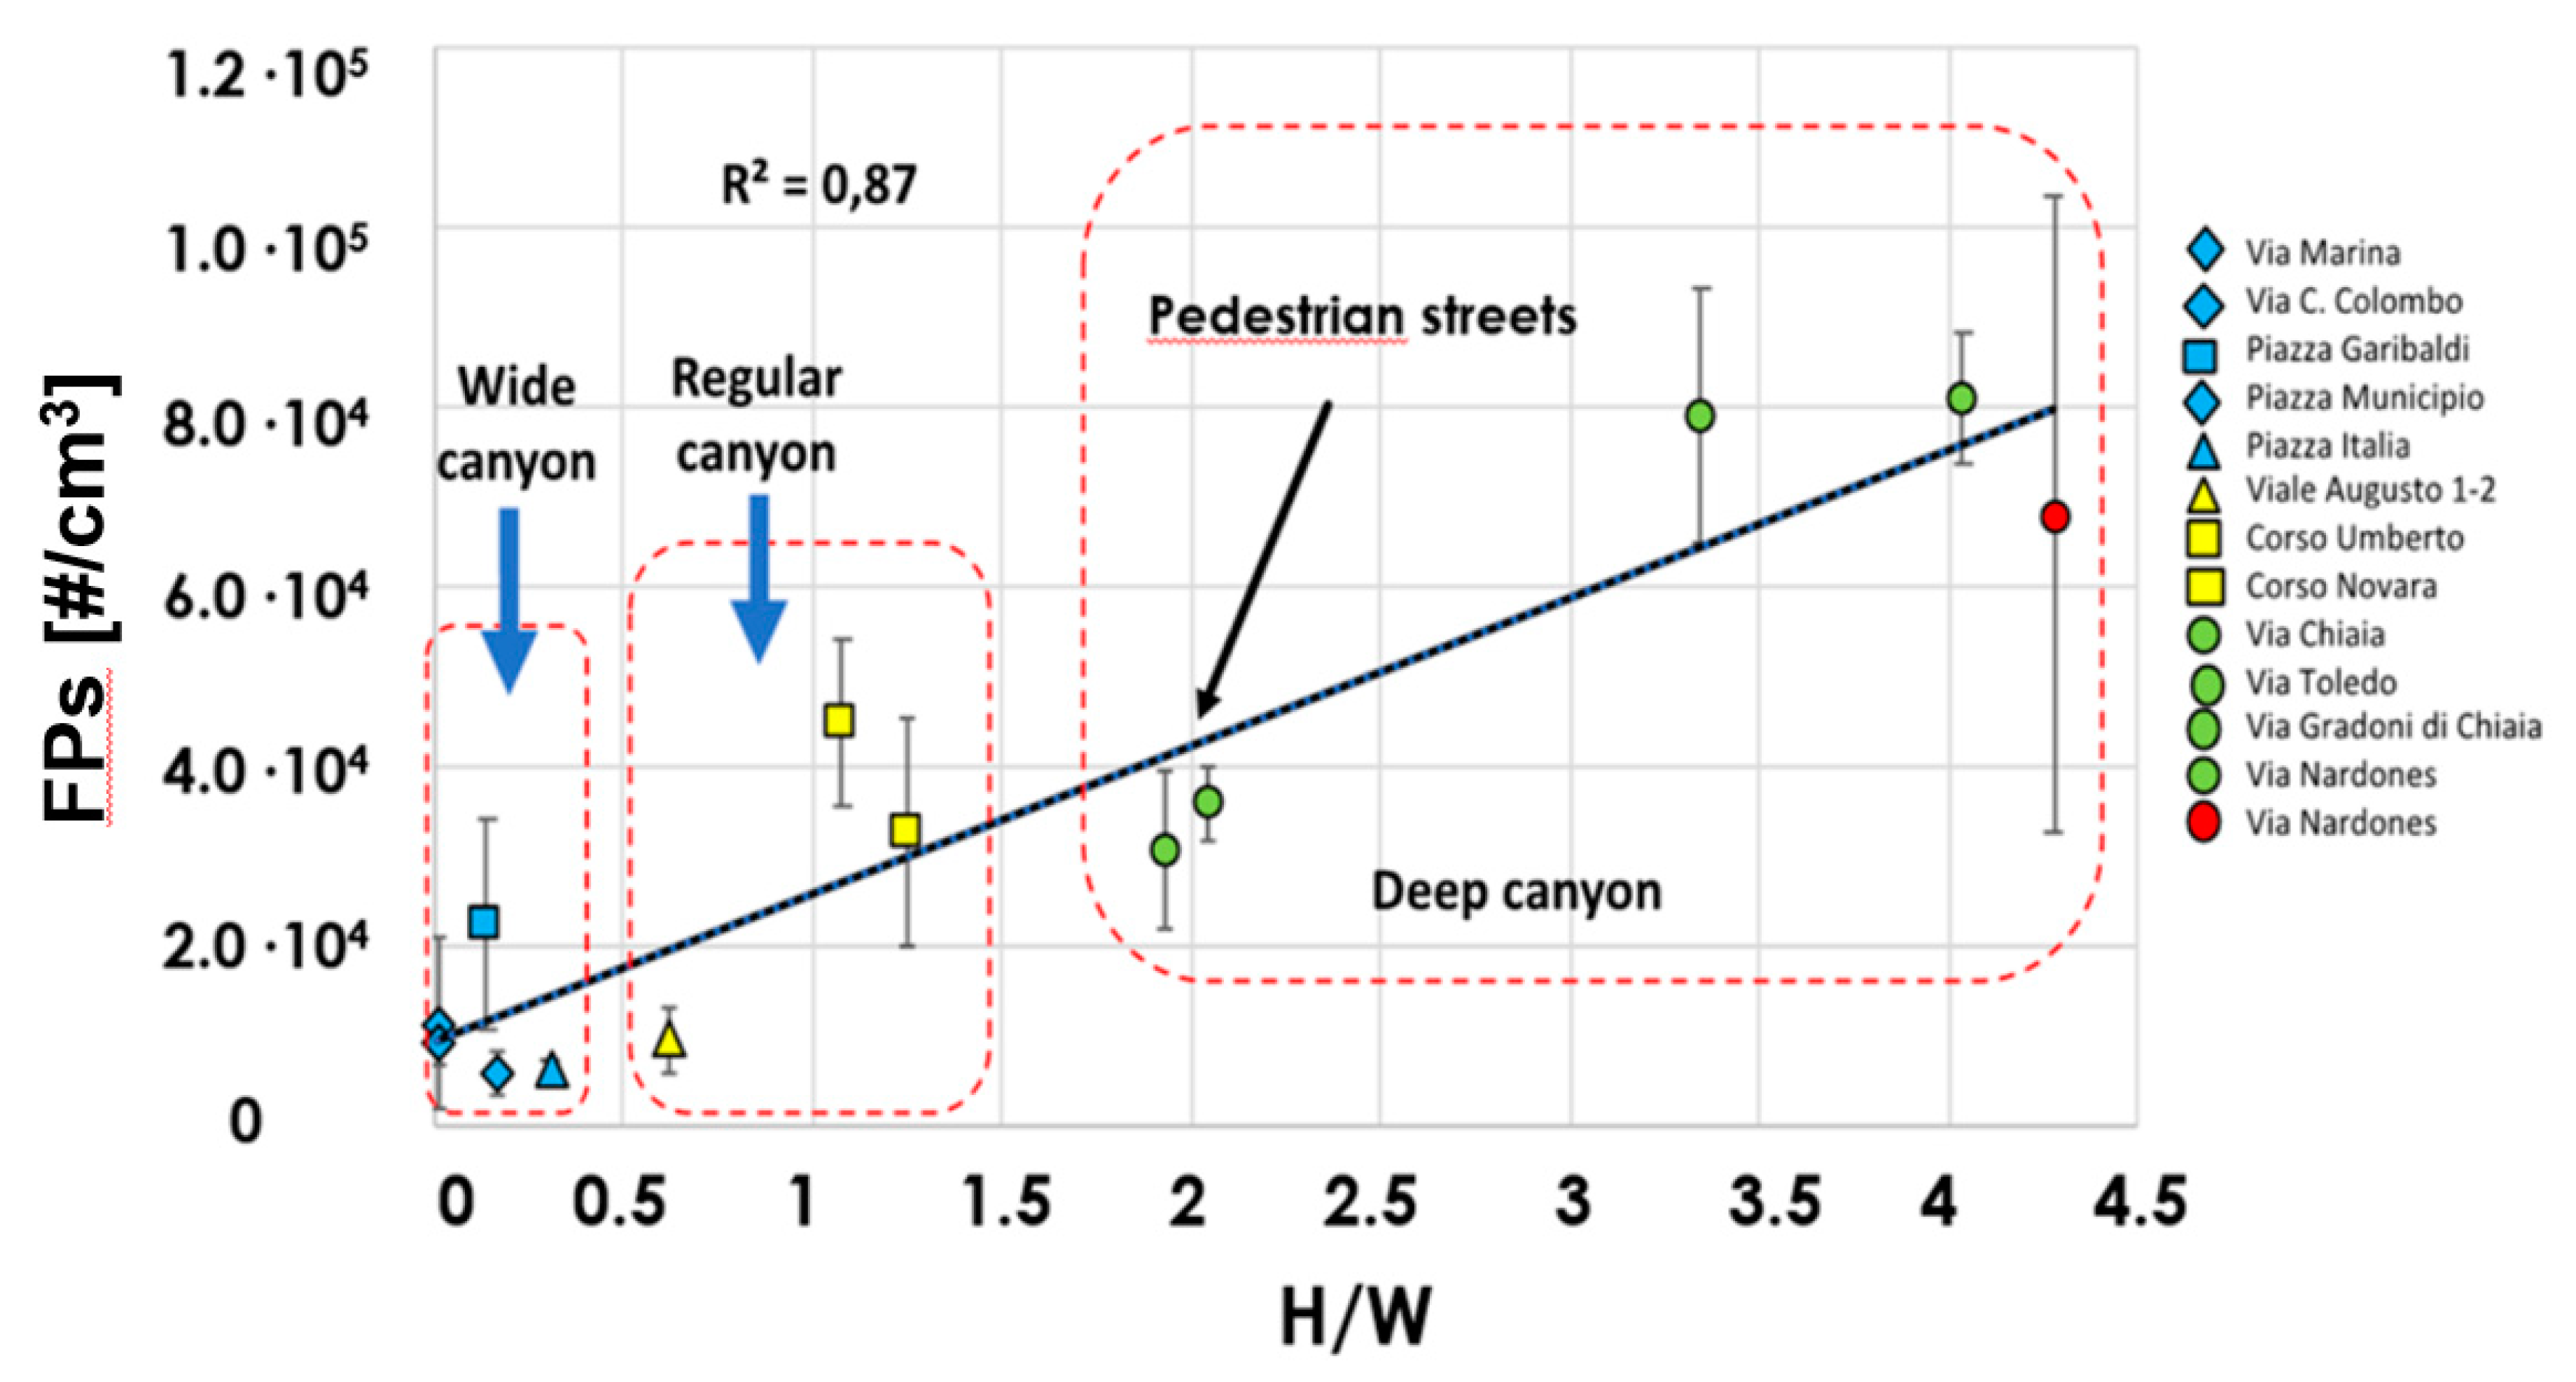
- Particle concentrations in the range 20–1000 nm measured with a condensation particle counter in deep traffic street canyons were on average about 8.0 104 #/cm3. This level could not be compared with limit values or guidelines but it was higher than the average value measured at roadsides in 42 cities in Europe (3.15 ± 1.60 104 #/cm3), and represent a health issue for the area. These results were even worse as they were measured during days of low PM10 and PM2.5 concentration in the urban area.
- (ii)
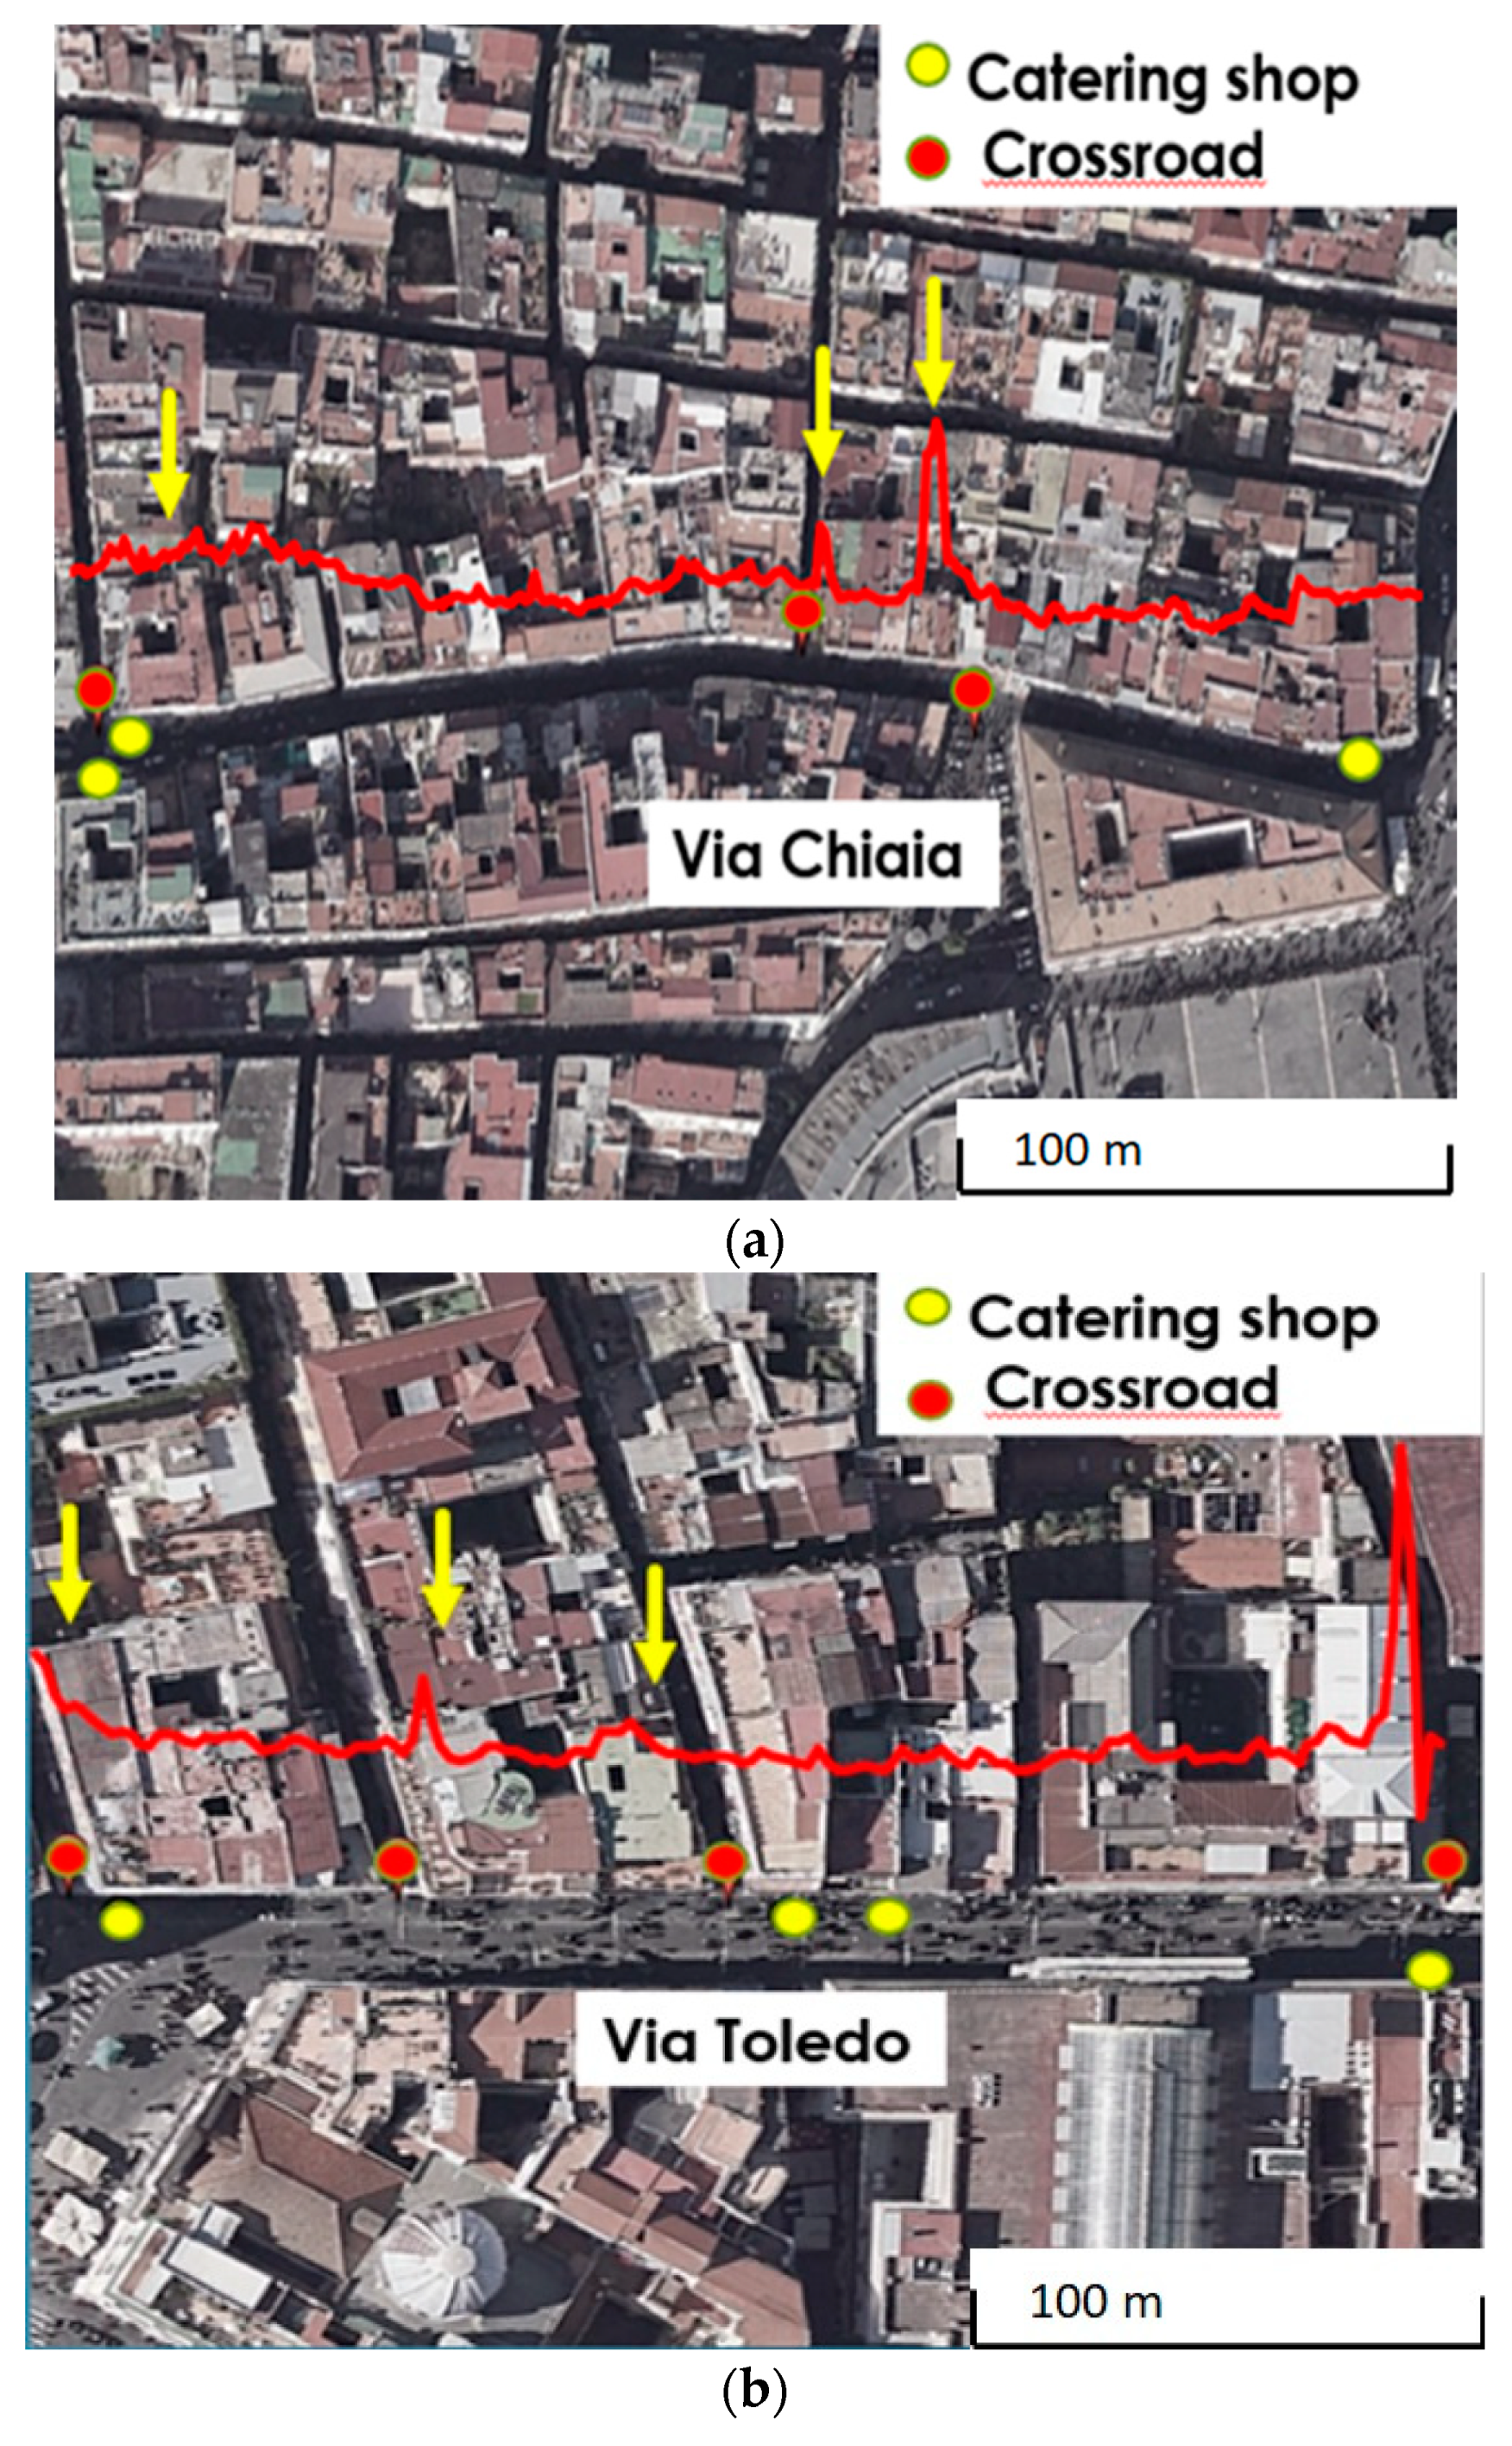
- A dramatic difference was observed between traffic (8.0∙104 #/cm3) and pedestrian streets (average 3.3∙104 #/cm3). The streets were remarkably close to each other, with similar H/W, the same orientation and other sources would contribute in the same way to FPs concentration. Therefore, it must be concluded that vehicular traffic was the main source of FPs in the area monitored.
Funding
Conflicts of Interest
References
- Sha, C.; Wang, X.; Lin, Y.; Fan, Y.; Chena, X.; Hang, J. The impact of urban open space and ‘lift-up’ building design on building intake fraction and daily pollutant exposure in idealized urban models. Sci. Total Environ. 2018, 633, 1314–1328. [Google Scholar] [CrossRef]
- World Health Organization. Who Global Urban Ambient Air Pollution Database; World Health Organization: Geneva, Switzerland, 2016. [Google Scholar]
- Degraeuwe, B.; Thunis, P.; Clappier, A.; Weiss, M.; Lefebvre, W.; Janssen, S.; Vranck, S. Impact of passenger car NOX emissions on urban NO2 pollution–Scenario analysis for 8 European cities. Atmos. Environ. 2017, 171, 330–337. [Google Scholar] [CrossRef]
- Aschmann, M. Addressing Air Pollution and Beyond in Ulaanbaatar: The Role of Sustainable Mobility. Geogr. Environ. Sustain. 2019, 12, 213–223. [Google Scholar] [CrossRef]
- Merico, E.; Gambaro, A.; Argiriou, A.A.; Alebic-Juretic, A.; Barbaro, E.; Cesari, D.; Chasapidis, L.; Dimopoulos, S.; Dinoi, A.; Donateo, A.; et al. Atmospheric impact of ship traffic in four Adriatic-Ionian port-cities: Comparison and harmonization of different approaches. Transp. Res. Part D Transp. Environ. 2017, 50, 431–445. [Google Scholar] [CrossRef]
- Masiol, M.; Squizzato, S.; Formenton, G.; Md Badiuzzaman, K.; Hopke, P.K.; Nenes, A.; Pandis, S.N.; Tositti, L.; Benetello, F.; Visin, F.; et al. Hybrid multiple-site mass closure and source apportionment of PM2.5 and aerosol acidity at major cities in the Po Valley. Sci. Total Environ. 2020, 704, 135287. [Google Scholar] [CrossRef] [PubMed]
- World Health Organization. WHO Guidelines for Indoor Air Quality: Selected Pollutants; The WHO European Centre for Environment and Health, Bonn Office: Bonn, Germany, 2010; ISBN 9789289002134. [Google Scholar]
- Łapko, A.; Panasiuk, A.; Strulak-Wójcikiewicz, R.; Landowski, M. The State of Air Pollution as a Factor Determining the Assessment of a City’s Tourist Attractiveness—Based on the Opinions of Polish Respondents. Sustainability 2020, 12, 1466. [Google Scholar] [CrossRef]
- Mersal, A. Sustainable urban future: Environmental planning for sustainable urban development. Procedia Environ. Sci. 2016, 34, 49–61. [Google Scholar] [CrossRef]
- Do, X.S.; Thomas, D.E.C. Urbanization and urban design in sustainable development, case study of the ToLich river regions in Hanoi. J. Urban Plan. Landsc. Environ. Des. 2017, 2, 37–52. [Google Scholar]
- Dempsey, N.; Bramley, G.; Power, S.; Brown, C. The social dimension of sustainable development: Defining urban social sustainability. Sustain. Dev. 2011, 19, 289–300. [Google Scholar] [CrossRef]
- Mueller, N.; Rojas-Rueda, D.; Khreis, H.; Cirach, M.; Andrés, D.; Ballester, J.; Bartoll, X.; Daher, C.; Deluca, A.; Echave, C.; et al. Changing the urban design of cities for health: The superblock model. Environ. Int. 2020, 134, 105132. [Google Scholar] [CrossRef]
- Kang, J.E.; Yoon, D.K.; Bae, H. Evaluating the effect of compact urban form on air quality in Korea. Environ. Plan. B Urban Anal. City Sci. 2019, 46, 179–200. [Google Scholar] [CrossRef]
- Jung, M.C.; Park, J.; Kim, S. Spatial Relationships between Urban Structures and Air Pollution in Korea. Sustainability 2019, 11, 476. [Google Scholar] [CrossRef]
- Borrego, C.; Martins, H.; Tchepel, O.; Salmim, L.; Monteiro, A.; Miranda, A.I. How urban structure can affect city sustainability from an air quality perspective. Environ. Model. Softw. 2006, 21, 461–467. [Google Scholar] [CrossRef]
- Chaberek-Karwacka, G. Streets as Factors for and Barriers to Cities in Sustaining Development: A Comparison of Gothenburg and Gdansk. In Making Cities Resilient, the Urban Book Series; Sharma, V., Chandrakanta, Eds.; Springer Nature Switzerland AG: Cham, Switzerland, 2019. [Google Scholar] [CrossRef]
- Rada, E.C. The sustainable city and air pollution. WIT transactions on ecology and the environment. In The Sustainable City IX Vol 191; WIT Press: Southampton, UK, 2014; Volume 2, pp. 1369–1380. ISSN 1743-3541. [Google Scholar]
- Vardoulakis, S.; Fisher, B.E.A.; Pericleous, K.; Gonzalez-Flesca, N. Modelling air quality in street canyons: A review. Atmos Environ. 2003, 37, 155–182. [Google Scholar] [CrossRef]
- Oke, T.R. Boundary Layer Climates, 2nd ed.; Methuen: London, UK, 1978. [Google Scholar]
- Sini, J.F.; Anquetin, S.; Mestayer, P.G. Pollutant dispersion and thermal effects in urban street canyons. Atmos. Environ. 1996, 30, 2659. [Google Scholar] [CrossRef]
- Salizzoni, P.; Soulhac, L.; Mejean, P. Street canyon ventilation and atmospheric turbulence. Atmos Environ. 2009, 43, 5056–5067. [Google Scholar] [CrossRef]
- Murena, F. Monitoring and modelling carbon monoxide concentrations in a deep street canyon: Application of a two-box model. Atmos. Pollut. Res. 2012, 3, 311. [Google Scholar]
- Tang, J.; McNabola, A.; Misstear, B. The potential impacts of different traffic management strategies on air pollution and public health for a more sustainable city: A modelling case study from Dublin, Ireland. Sustain. Cities Soc. 2020, 60, 102229. [Google Scholar] [CrossRef]
- Shafique, M.; Xue, X.; Luo, X. An overview of carbon sequestration of green roofs in urban areas. Urban For. Urban Green. 2020, 47, 126515. [Google Scholar]
- Potienko, N.; Kuznetsova, A.; Soya, D. Green Energy Technologies of Tall Buildings for Air Pollution Abatement in Metropolises. In EMMFT 2018; Murgul, V., Pasetti, M., Eds.; Springer Nature Switzerland AG: Cham, Switzerland, 2020; Volume 982, pp. 105–115. [Google Scholar]
- Murena, F. Solar towers for a better air quality in urban areas: Analysis of performances. In Proceedings of the 1st International Conference on Applications of Air Quality in Science and Engineering Purposes, Shuwaikh, Kuwait, 10–12 February 2020. [Google Scholar]
- Sohrabi, S.; Zietsman, J.; Khreis, H. Burden of Disease Assessment of Ambient Air Pollution and Premature Mortality in Urban Areas: The Role of Socioeconomic Status and Transportation. Int. J. Environ. Res. Public Health 2020, 17, 1166. [Google Scholar] [CrossRef]
- Samol, E.; Stergiopoulou, A.; Santana, P.; Rodopoulou, S.; Mitsakou, C.; Dimitroulopoulou, C.; Bauwelinck, M.; de Hoogh, K.; Costa, C.; Marí-Dell’Olmo, M.; et al. Spatial variability in air pollution exposure in relation to socioeconomic indicators in nine European metropolitan areas: A study on environmental inequality. Environ. Pollut. 2019, 249, 345–353. [Google Scholar] [CrossRef] [PubMed]
- Murena, F.; Vorraro, F. Vertical gradients of Benzene in a narrow street canyon in urban area of Naples. Atmos. Environ. 2003, 37, 4853–4859. [Google Scholar] [CrossRef]
- Murena, F.; Favale, G. Continuous monitoring of carbon monoxide in a deep street canyon. Atmos. Environ. 2007, 41, 2620–2629. [Google Scholar] [CrossRef]
- Kumar, P.; Robins, A.; Vardoulakis, S.; Britter, R. A review of the characteristics of nanoparticles in the urban atmosphere and the prospects for developing regulatory controls. Atmos. Environ. 2010, 44, 5035–5052. [Google Scholar] [CrossRef]
- Terracciano, C. Fine particles concentration in a street canyon. In Master Thesis in Environmental Engineering; University of Naples “Federico II”: Naples, Italy, 2019. [Google Scholar]
- Kumar, P.; Morawska, L.; Birmili, W.; Paasonen, P.; Hu, M.; Kulmal, M.; Harrison, R.M.; Norford, L.; Britter, R. Ultrafine particles in cities. Environ. Int. 2014, 66, 1–10. [Google Scholar] [CrossRef] [PubMed]
- Murena, F.; Prati, M.V. Spatial variability of fine particle number concentration in an urban area. In Proceedings of the Seventh International Conference on Environmental Management, Engineering, Planning and Economics (CEMEPE 2019) and SECOTOX Conference, Mykonos Island, Greece, 19–24 May 2019. [Google Scholar]
- Buonanno, G.; Fuoco, F.C.; Stabile, L. Influential parameters on particle exposure of pedestrians in urban microenvironments. Atmos. Environ. 2011, 45, 1434–1443. [Google Scholar] [CrossRef]
- Mejıa, J.F.; Morawsk, L.; Mengersen, K. Spatial variation in particle number size distributions in a large metropolitan area. Atmos. Chem. Phys. 2008, 8, 1127–1138. [Google Scholar]
- Birmili, W.; Tomsche, L.; Sonntag, A.; Opelt, C.; Weinhold, K.; Nordmann, S.; Schmidt, W. Variability of aerosol particles in the urban atmosphere of Dresden (Germany): Effects of spatial scale and particle size. Meteorol. Z. 2013, 22, 195–211. [Google Scholar] [CrossRef]
- Murena, F.; Prati, M.V. The contribution of high emitters vehicles to FPs number concentration in the historical center of Naples. In Proceedings of the 12th International Conference on Air Quality—Science and Application, Thessaloniki, Greece, 9–13 March 2020. [Google Scholar]
- Chianese, E.; Tirimberio, G.; Riccio, A. PM2.5 and PM10 in the urban area of Naples: Chemical composition, chemical properties and influence of air masses origin. J. Atmos. Chem. 2019, 76, 151–169. [Google Scholar] [CrossRef]
- Panagiotou, M.K.A.; Neophytou, D.; Hamlyn, R.E.; Britter, R. City breathability as quantified by the exchange velocity and its spatial variation in real inhomogeneous urban geometries: An example from central London urban area. Sci. Total Environ. 2013, 442, 466–477. [Google Scholar] [CrossRef]
- Toscano, D.; Murena, F. The effect on air quality of lock down directives to prevent the spread of SARS-CoV-2 pandemic in Campania region—Italy. Indications for a sustainable development. Sustainability 2020, 12, 5558. [Google Scholar] [CrossRef]
- Murena, F.; Mocerino, L.; Quaranta, F.; Toscano, D. Impact on air quality of cruise ship emissions in Naples, Italy. Atmos. Environ. 2018, 187, 70–83. [Google Scholar] [CrossRef]


| Street | Tract | L (m) | H | W (m) | H/W | L/W | Classification |
|---|---|---|---|---|---|---|---|
| Via Chiaia(pedestrian) | 1 | 114 | 20.00 | 11.63 | 1.72 | 9.80 | Long deep |
| 2 | 40 | 20.00 | 9.70 | 2.06 | 4.12 | Medium deep | |
| 3 | 161 | 22.99 | 9.70 | 2.37 | 16.60 | Long deep | |
| Total | 315 | 20.00 | 10.34 | 1.93 | Deep | ||
| Via Gradoni(traffic) | 1 | 74 | 27.00 | 6.11 | 4.42 | 12.11 | Long deep |
| 2 | 38 | 20.69 | 5.90 | 3.51 | 6.44 | Medium deep | |
| 3 | 27 | 22.00 | 6.16 | 3.57 | 4.38 | Medium deep | |
| 4 | 39 | 18.74 | 6.16 | 3.04 | 6.33 | Medium deep | |
| Total | 178 | 20.37 | 6.08 | 3.35 | Deep | ||
| Via Nardones(traffic) | 1 | 113 | 21.35 | 5.80 | 3.68 | 19.48 | Long deep |
| 2 | 59 | 24.81 | 5.80 | 4.28 | 10.17 | Long deep | |
| 3 | 143 | 22.04 | 5.80 | 3.80 | 24.66 | Long dee | |
| Total | 315 | 23.43 | 5.80 | 4.04 | Deep | ||
| Via Toledo(pedestrian) | 1 | 74 | 26.84 | 12.70 | 2.11 | 5.83 | Medium deep |
| 2 | 34 | 26.19 | 12.70 | 2.06 | 2.68 | Short deep | |
| 3 | 43 | 25.71 | 12.70 | 2.02 | 3.39 | Medium deep | |
| Total | 151 | 25.95 | 12.70 | 2.04 | Deep |
© 2020 by the author. Licensee MDPI, Basel, Switzerland. This article is an open access article distributed under the terms and conditions of the Creative Commons Attribution (CC BY) license (http://creativecommons.org/licenses/by/4.0/).
Share and Cite
Murena, F. Sustainable Development of the Historic Centre of Naples: The Impact of Vehicular Traffic and Food Service Business on Air Quality. Atmosphere 2020, 11, 938. https://doi.org/10.3390/atmos11090938
Murena F. Sustainable Development of the Historic Centre of Naples: The Impact of Vehicular Traffic and Food Service Business on Air Quality. Atmosphere. 2020; 11(9):938. https://doi.org/10.3390/atmos11090938
Chicago/Turabian StyleMurena, Fabio. 2020. "Sustainable Development of the Historic Centre of Naples: The Impact of Vehicular Traffic and Food Service Business on Air Quality" Atmosphere 11, no. 9: 938. https://doi.org/10.3390/atmos11090938
APA StyleMurena, F. (2020). Sustainable Development of the Historic Centre of Naples: The Impact of Vehicular Traffic and Food Service Business on Air Quality. Atmosphere, 11(9), 938. https://doi.org/10.3390/atmos11090938