Abstract
Strict social distancing rules are being implemented to stop the spread of COVID-19 pandemic in many cities globally, causing a sudden and extreme change in the transport activities. This offers a unique opportunity to assess the effect of anthropogenic activities on air quality and provides a valuable reference to the policymakers in developing air quality control measures and projecting their effectiveness. In this study, we evaluated the effect of the COVID-19 lockdown on the roadside and ambient air quality in Hong Kong, China, by comparing the air quality monitoring data collected in January–April 2020 with those in 2017–2019. The results showed that the roadside and ambient NO2, PM10, PM2.5, CO and SO2 were generally reduced in 2020 when comparing with the historical data in 2017–2019, while O3 was increased. However, the reductions during COVID-19 period (i.e., February–April) were not always higher than that during pre-COVID-19 period (i.e., January). In addition, there were large seasonal variations in the monthly mean pollutant concentrations in every year. This study implies that one air pollution control measure may not generate obvious immediate improvements in the air quality monitoring data and its effectiveness should be evaluated carefully to eliminate the effect of seasonal variations.
1. Introduction
The COVID-19 pandemic is spreading rapidly worldwide since its first outbreak in Wuhan, China in December 2019 [1,2]. By 12 August 2020, it has spread to 216 countries, areas or territories, causing 20 million infections and 737,000 deaths [3]. The pandemic has greatly affected nearly every aspect of human society, such as public health, economy, social activities, politics and the environment. Since the disease spreads primarily from person to person through small droplets from the nose or mouth with close contact (e.g., within 1 m) [4], strict social distancing rules have been implemented to stop the spread of the COVID-19 pandemic, such as working from home, reduced capacity of restaurants and shops, closure of borders, and limits on large public gatherings. As a result, many countries or cities have entered into various levels of lockdown shortly after when local transmissions were found. These lockdowns have greatly reduced the human activities such as road transport, civil aviation and navigation. Among them, road transport is the most affected sector. Road transport is a major source of air pollution in urban areas [5,6,7] and has a severe adverse effect on the public health due to its close proximity to the people [8,9]. Thus, it is widely perceived that the pandemic lockdowns would help mitigate the air pollution problem. Although such environmental benefits are not expected to be long lasting [10], it offers a unique opportunity to assess how a sudden and extreme change in human activities could affect the air pollution problem, which provides very useful information to the policymakers on developing air pollution control measures and projecting their effectiveness [11].
As a global megacity, Hong Kong has been facing serious air pollution problem for many years and great efforts have been devoted to the control of mobile emissions. However, it is often found difficult to confirm the air quality improvements due to different emission control programs [12]. Brimblecombe and Ning [12] and Brimblecombe [13] investigated the effect of road blockages during the 2014 and 2019 street protests on air quality in Hong Kong by using roadside air quality monitoring stations located near the protest sites. It was found that the improvement on air quality was not always obvious due to seasonal variations in meteorological conditions and synoptic transport of pollutants. Since the protests were mostly taken place at designated places, the analysis was only performed in the nearby roadside air quality stations but not in a wider area. It is worth mentioning that the ground level air pollution in Hong Kong is largely a local problem and regional air pollutants transportation may only play an insignificant role. A previous study reported that Hong Kong’s air pollution still exceeded the World Health Organization (WHO) limit twice even when there was no wind from Mainland China, although its air pollution was, on average, 15% worse when winds blew from Mainland China [14].
Hong Kong reported its first two COVID-19 cases on 23 January 2020 [15] and first death on 4 February 2020 [16]. Following that, the city acted swiftly to implement a series of social distancing rules to stop the spread. This enables us to evaluate how a city-wide traffic disruption would benefit the air quality. Therefore, this study is conducted to investigate how the COVID-19 social distancing rules have affected the roadside and ambient air quality in Hong Kong.
2. Methods
As part of the city’s air quality management, the Hong Kong Environmental Protection Department (HKEPD) is currently deploying 3 roadside and 13 ambient air quality monitoring stations to measure the criteria air pollutants, including carbon monoxide (CO), nitrogen dioxide (NO2), ozone (O3), sulfur dioxide (SO2), respirable suspended particulates (PM10) and fine suspended particulates (PM2.5). The pollutant concentrations are being continuously measured every hour by automatic analyzers. The 3 roadside stations are placed at 3.0–4.5 m above ground at the commercial and tourist areas (i.e., Central, Causeway Bay and Mong Kok). The 13 ambient stations are placed 11.0–28.0 m above ground which are distributed more evenly across the city. The heights of the roadside and ambient stations are chosen to gather air quality information representative of the exposure of the roadside pedestrians and the people in a building, respectively. The roadside stations are placed close to roads and the ambient stations are usually at the rooftop of buildings. More details about their locations, sensor models, measurement principles and accuracy specifications can be found in [17,18].
Air quality data during 1 January to 30 April 2020 are analyzed in this study. Table 1 lists the timelines of the key COVID-19 events and social distancing rules in Hong Kong. Since the report of the first two positive cases in late January and the first death in early February, the city has introduced a series of control measures to stop the spread of the pandemic. Therefore, the air quality data are categorized into two groups: the pre-COVID-19 period in January 2020 and the COVID-19 period in February–April 2020. Historical data collected during the same months in 2017–2019 are also analyzed to show the yearly variations.

Table 1.
Timelines of key COVID-19 events and social distancing rules in Hong Kong.
3. Results
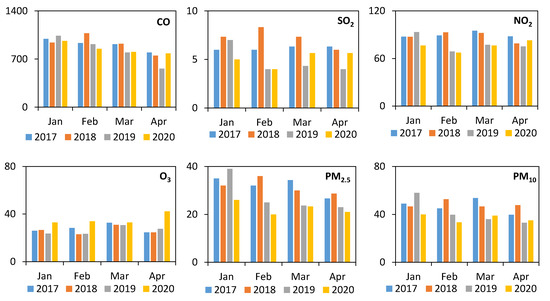
Figure 1 showed the average pollutant concentrations measured at the 3 roadside air quality monitoring stations during January–April in 2017–2020. The month-to-month variations were relatively large and there was no clear variation tendency from January to April for each year from 2017 to 2020, due to the changes in meteorological conditions. This indicates that a simple comparison of COVID-19 period (i.e., January 2020) vs. pre-COVID-19 period (i.e., February–April 2019) would lead to a random conclusion on the effect of COVID-19 on air quality. Therefore, comparing 2020 data with 2017–2019 data in the same month (Table 2) is more reliable due to the smaller difference in meteorological conditions. Generally, the 2020 CO, SO2, NO2, PM10 and PM2.5 concentrations showed reductions when comparing with the 2017–2019 data, except for a few comparisons such as NO2 in April 2019 and April 2018 which were actually slightly lower than the corresponding 2020 data. Specially, the emissions in April 2020 were generally higher than the previous year, although the human emission activities were reduced in April 2020 due to the COVID-19 social distancing. This increase may be because the meteorological conditions were not favorable for air movements and pollutants dispersion, thus resulting in the higher pollutant concentrations observed. As shown in Table 2, during the pre-COVID-19 period (i.e., January), 2020 data showed reductions of −2% to 7% for CO, 17% to 32% for SO2, 13% to 18% for NO2, 14% to 31% for PM10, and 19% to 33% for PM2.5 when comparing with 2017–2019 in the same month. While during the COVID-19 period (i.e., February–April), 2020 data showed reductions of −40% to 21% for CO, −42% to 52% for SO2, −10% to 28% for NO2, −8% to 37% for PM10, and 1% to 44% for PM2.5. Finally, O3 was the only pollutant that was constantly higher in 2020 than that in 2017–2019, with 24% to 39% higher in pre-COVID-19 period and 1% to 72% higher in COVID-19 period.

Figure 1.
Average roadside pollutant concentrations measured at the three roadside air quality monitoring stations. All pollutants units are in μg/m3.

Table 2.
Relative changes of roadside emissions of 2020 over 2017–2019 in each month. Negative and positive percentages indicate emission reductions and increases, respectively.
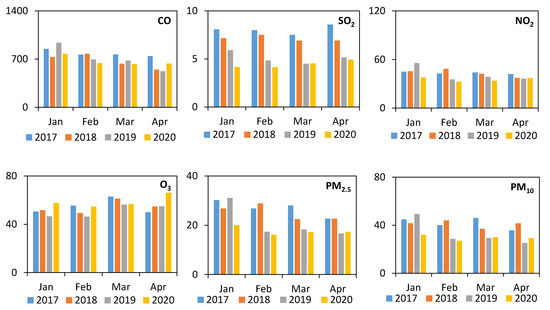
Regarding the ambient air quality (Figure 2), CO and NO2 were much lower, PM10 and PM2.5 were slightly lower, SO2 was similar while O3 was higher than their concentrations at roadside (Figure 1). Similar to the tendencies observed at roadside monitoring stations, Figure 2 showed that all criteria pollutants in 2020 demonstrated reductions when comparing with 2017–2019, except for O3 which generally increased. During the pre-COVID-19 period, as shown in Table 3, 2020 data show reductions of −7% to 17% foe CO, 30% to 49% for SO2, 16% to 32% for NO2, 23% to 35% for PM10, and 25% to 36% for PM2.5 when comparing with 2017–2019 data. During the COVID-19 period, the corresponding reductions were −21% to 18%, −1% to 48%, −2% to 33%, −16% to 38%, and −4% to 44%, respectively.

Figure 2.
Average ambient pollutant concentrations measured at the 13 ambient air quality monitoring stations. All pollutant units are in μg/m3.

Table 3.
Relative changes of ambient emissions of 2020 vs. 2017–2019 in each month. Negative and positive percentages indicate emission reductions and increases, respectively.
4. Discussion and Implications
The results in Figure 1 and Figure 2 and Table 2 and Table 3 showed that roadside and ambient NO2, PM10, PM2.5, CO and SO2 in January-April 2020 were generally reduced when comparing with the historical data in 2017–2019, while O3 was increased. However, comparing with the pre-COVID-19 period (i.e., January), the reductions were not always higher (emissions were even increased sometimes) during the COVID-19 period (i.e., February–April) when social distancing rules were introduced which greatly reduced the human movements, in particular the road transport and civil aviation sectors. Table 4 shows the monthly road traffic data of total passengers taking the public transport and the total vehicles through the Cross Harbor Tunnels during the studied periods. In particular, the Cross Harbor Tunnels link the Kowloon peninsula with Hong Kong Island, which are the two most important business districts. Therefore, the numbers of vehicles through them largely represent the traffic activities in Hong Kong. It should be noted that, before the pandemic, Hong Kong had been experiencing on-going large social unrests since June 2019 which had significantly reduced the civil aviation sector [19]. The social unrests had also reduced/stopped the traffic in the protest sites, but might only contribute insignificant reductions in the overall traffic of the whole city because the traffic could be diverted to other roads. Therefore, the COVID-19 lockdown since February 2020 mainly reduced the road transport sector in Hong Kong. This is evidenced in the data in Table 4, which show that road transport has been reduced by 15.7% of total passengers and 7.7% of total vehicles in January 2020, and then reduced obviously higher by 39.6–41.4% and 13.5–21.5%, respectively, in February to April 2020 when comparing with the same months last year. The small difference in pollutant reductions between pre-COVID-19 and COVID-19 periods could be explained by the inventories of anthropogenic emissions in Table 5, which show that road transport and civil aviation are not the dominant contributors of air pollutants even when they are combined, except for CO. As a result, the COVID-19 lockdown did not obviously reduce the pollutant concentrations.

Table 4.
Monthly traffic data of total passengers taking the public transport and total vehicles through the Cross Harbor Tunnels during January–April 2017–2020 [21].

Table 5.
Inventories of anthropogenic emissions by sectors in 2017 in Hong Kong [22].
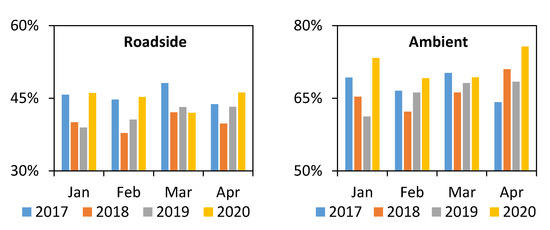
Finally, both roadside and ambient O3 concentrations in 2020 were higher than those in 2017–2019. This is because O3 is a secondary air pollutant which is formed through photochemical reactions of gaseous precursors (mainly NO2 and volatile organic compounds (VOCs)) in the presence of sunlight. Higher O3 emissions were usually observed with NO2 reductions which could have changed O3 formation from VOCs sensitive regime to mixed sensitive regime, as reported in previous studies [18,20]. Since NOx (i.e., NO + NO2) are involved in both the formation and reduction of O3, the net formation of O3 is actually determined by the ratio of NO2/NOx [18]. Figure 3 shows the average NO2/NOx ratios at both the roadside and ambient stations during the studied period. Generally, NO2/NOx ratios were higher in April 2020, which explained the higher O3 concentrations observed.

Figure 3.
Average roadside and ambient NO2/NOx ratios.
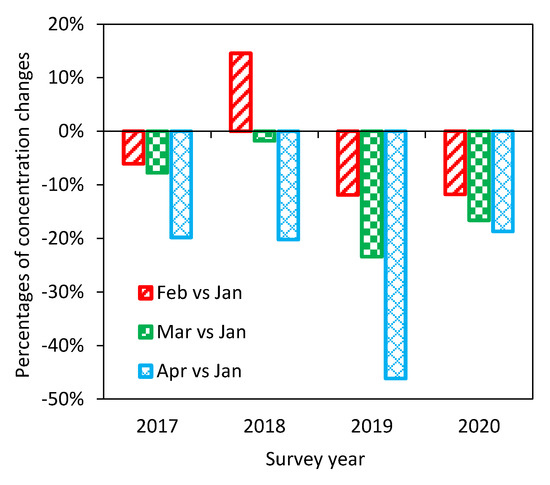
Overall, this study demonstrates that the effect of COVID-19 lockdown on air quality improvement is not always obvious. There are large seasonal pollutant variations, which suggest that a simple short-term comparison of pre-COVID-19 vs. COVID-19 periods could draw misleading conclusions on the effect of COVID-19 on air quality improvement. Taking roadside CO as an example (Figure 4), which is dominated by roadside transport (as shown in Table 5), it was 6% to 20% lower in February–April than January in 2017, −15% to 20% lower in 2018, 12% to 46% lower in 2019 and 12% to 19% lower in 2020. Although there was no pandemic lockdown in 2017–2019, CO reductions of February–April vs. January were observed in 2017–2019 and the reduction was even bigger in 2019 (12% to 46%) than that in 2020 (12% to 19%).

Figure 4.
Percentages of roadside CO concentration changes of COVID-19 period (i.e., February–April) relative to pre-COVID-19 period (i.e., January) for each year.
A number of studies have used the air quality monitoring data to investigate the environmental benefits of COVID-19 lockdowns in different cities, which usually compared the pre-COVID-19 vs. COVID-19 in short terms and reported significant reductions of some pollutants, ranging from about 10% to over 50%. Sharma et al. [23] compared the concentrations of criteria pollutants during 16 March to 14 April 2017–2020 in 22 Indian cities. Collivignarelli et al. [24] compared the criteria pollutants, black carbon, benzene and ammonia data of three 14-day periods in 2020 in Italy, including the reference period during 7–20 February, the partial lockdown during 9–22 March, and the total lockdown during 23 March to 5 April. Berman and Ebisu [25] compared the PM2.5 and NO2 data during 8 January to 21 April 2017–2020 in the United States. Chauhan and Singh [26] compared the PM2.5 data during December–March 2017–2020.
This study suggests that such short-term comparisons should be interpreted with caution as the seasonal variations are relatively large which could easily mask the real changes caused by lockdown and, thus, could lead to misleading conclusions. Further investigations are needed to explore the causes and characteristics of the seasonal variations, particularly the meteorological conditions. The effect of meteorological conditions on air pollution is a complicated problem. A number of factors can affect the air quality in a city, such as the wind speed and direction, temperature, humidity, rainfall and solar radiation. These factors influence the air movements and thus the dispersion of air pollutants. Besides the geographical conditions and chemical reactions also have significant effects on the air movements and formation of secondary pollutants (e.g., O3, PM2.5 and PM10). All these factors are highly dynamic which require further investigations on their effects on seasonal variations in ground level air pollution. This study also implies that one air pollution control measure may not necessarily generate obvious improvements in the short-term air quality monitoring data and the effectiveness should be evaluated carefully to eliminate the seasonal and meteorological effects.
5. Conclusions
This study investigated the effect of the COVID-19 social distancing rules on the roadside and ambient air quality in Hong Kong, China. The concentrations of six criteria pollutants (i.e., CO, NO2, O3, SO2, PM10 and PM2.5) collected during January–April 2020 were compared with the same months in 2017–2019. According to the development of COVID-19 pandemic in Hong Kong, the collected data were categorized into two groups, namely the pre-COVID-19 period (i.e., January 2020) and COVID-19 period (i.e., February–April 2020). The results showed that the effect of COVID-19 on air quality improvement was not always obvious. Comparing with the historical data in 2017–2019, the roadside and ambient NO2, PM10, PM2.5, CO and SO2 were generally reduced while O3 was increased in January–April 2020. The implementation of the social distancing rules had obviously reduced the road transport activities in terms of total passengers taking the public transport and the total vehicles through the Cross Harbor Tunnels. Despite this, the reductions during COVID-19 period were not always higher than that during pre-COVID-19 period, and sometimes the emissions were even higher during the COVID-19 period. In addition, there were large seasonal variations in the monthly mean pollutant concentrations in every year, suggesting that a simple comparison of pre-COVID-19 vs. COVID-19 periods would draw misleading conclusions on the effect of COVID-19 on air quality improvement. This study implies that one air pollution control measure may not generate obvious immediate improvements in the air quality monitoring data and its effectiveness should be evaluated carefully to eliminate the effect of seasonal and meteorological variations.
Author Contributions
Y.H. completed the analysis and wrote the manuscript with contributions from all the co-authors. Conceptualization, Y.H.; formal analysis, Y.H.; writing—original draft preparation, Y.H. and J.L.Z.; writing—review and editing, Y.H., J.L.Z., Y.Y., W.-c.M., C.F.C.L. and Y.-s.Y.; supervision, J.L.Z. All authors have read and agreed to the published version of the manuscript.
Funding
This research received no external funding.
Conflicts of Interest
The authors declare no conflict of interest. The contents of this paper are solely the responsibility of the authors and do not necessarily represent official views of the Hong Kong SAR Government.
Data availability
The data that support the findings of this study are available from the HKEPD website at https://cd.epic.epd.gov.hk/EPICDI/air/station/?lang=en.
References
- Carducci, A.; Federigi, I.; Verani, M. Covid-19 Airborne transmission and its prevention: Waiting for evidence or applying the precautionary principle? Atmosphere 2020, 11, 710. [Google Scholar] [CrossRef]
- Li, Q.; Guan, X.; Wu, P.; Wang, X.; Zhou, L.; Tong, Y.; Ren, R.; Leung, K.S.M.; Lau, E.H.Y.; Wong, J.Y.; et al. Early transmission dynamics in Wuhan, China, of novel coronavirus–infected pneumonia. N. Engl. J. Med. 2020, 382, 1199–1207. [Google Scholar] [CrossRef] [PubMed]
- WHO. Coronavirus Disease (COVID-19) Pandemic. Available online: https://www.who.int/emergencies/diseases/novel-coronavirus-2019 (accessed on 12 August 2020).
- WHO. Q&A on Coronaviruses (COVID-19)—How Does COVID-19 Spread? Available online: https://www.who.int/emergencies/diseases/novel-coronavirus-2019/question-and-answers-hub/q-a-detail/q-a-coronaviruses (accessed on 16 June 2020).
- Anenberg, S.C.; Miller, J.; Minjares, R.; Du, L.; Henze, D.K.; Lacey, F.; Malley, C.S.; Emberson, L.; Franco, V.; Klimont, Z. Impacts and mitigation of excess diesel-related NOx emissions in 11 major vehicle markets. Nature 2017, 545, 467–471. [Google Scholar] [CrossRef] [PubMed]
- Huang, Y.; Surawski, N.C.; Yam, Y.S.; Lee, C.K.C.; Zhou, J.L.; Organ, B.; Chan, E.F.C. Re-evaluating effectiveness of vehicle emission control programs targeting high-emitters. Nat. Sustain. 2020. [Google Scholar] [CrossRef]
- Zhou, J.; Tie, X.; Yu, Y.; Zhao, S.; Li, G.; Liu, S.; Zhang, T.; Dai, W. Impact of the emission control of diesel vehicles on Black Carbon (BC) concentrations over China. Atmosphere 2020, 11, 696. [Google Scholar] [CrossRef]
- Zhang, L.; Liu, W.; Hou, K.; Lin, J.; Zhou, C.; Tong, X.; Wang, Z.; Wang, Y.; Jiang, Y.; Wang, Z. Air pollution-induced missed abortion risk for pregnancies. Nat. Sustain. 2019, 2, 1011–1017. [Google Scholar] [CrossRef]
- Kampa, M.; Castanas, E. Human health effects of air pollution. Env. Pollut. 2008, 151, 362–367. [Google Scholar] [CrossRef] [PubMed]
- Guerriero, C.; Haines, A.; Pagano, M. Health and sustainability in post-pandemic economic policies. Nat. Sustain. 2020, 3, 494–496. [Google Scholar] [CrossRef]
- Zhang, R.; Zhang, Y.; Lin, H.; Feng, X.; Fu, T.-M.; Wang, Y. NOx emission reduction and recovery during COVID-19 in East China. Atmosphere 2020, 11, 433. [Google Scholar] [CrossRef]
- Brimblecombe, P.; Ning, Z. Effect of road blockages on local air pollution during the Hong Kong protests and its implications for air quality management. Sci. Total Env. 2015, 536, 443–448. [Google Scholar] [CrossRef] [PubMed]
- Brimblecombe, P. Street protests and air pollution in Hong Kong. Env. Monit. Assess. 2020, 192, 295. [Google Scholar] [CrossRef] [PubMed]
- Neo, K.W. So You Thought Hong Kong’s Pollution Comes from Mainland China? Smart Air. Available online: https://smartairfilters.com/en/blog/so-you-thought-hong-kongs-pollution-comes-from-mainland-china/ (accessed on 11 August 2020).
- Centre for Health Protection. Two Confirmed Imported Cases of Novel Coronavirus Infection in Hong Kong and the Revised Reporting Criteria. Available online: https://www.chp.gov.hk/files/pdf/letters_to_private_hospitals_20200123.pdf (accessed on 22 June 2020).
- The Straits Times. Hong Kong Reports First Death from Coronavirus, 39-Year-Old Had Travelled to Wuhan. Available online: https://www.straitstimes.com/asia/east-asia/hong-kong-reports-first-death-from-coronavirus (accessed on 22 June 2020).
- HKEPD. Air Quality in Hong Kong in 2017. Available online: http://www.aqhi.gov.hk/api_history/english/report/files/AQR2017e_final.pdf (accessed on 20 July 2020).
- Huang, Y.; Mok, W.-C.; Yam, Y.-S.; Zhou, J.L.; Surawski, N.C.; Organ, B.; Chan, E.F.C.; Mofijur, M.; Mahlia, T.M.I.; Ong, H.C. Evaluating in-use vehicle emissions using air quality monitoring stations and on-road remote sensing systems. Sci. Total Env. 2020, 740, 139868. [Google Scholar] [CrossRef] [PubMed]
- CAPA. Hong Kong Traffic Decline Hurts Airlines and Airport. Available online: https://centreforaviation.com/analysis/reports/hong-kong-traffic-decline-hurts-airlines-and-airport-505593 (accessed on 19 June 2020).
- Wang, N.; Lyu, X.; Deng, X.; Huang, X.; Jiang, F.; Ding, A. Aggravating O3 pollution due to NOx emission control in eastern China. Sci. Total Env. 2019, 677, 732–744. [Google Scholar] [CrossRef] [PubMed]
- HKTD. Monthly Traffic and Transport Digest. Available online: https://www.td.gov.hk/en/transport_in_hong_kong/transport_figures/monthly_traffic_and_transport_digest/index.html (accessed on 20 July 2020).
- HKEPD. Hong Kong Air Pollutant Emission Inventory. Available online: https://www.epd.gov.hk/epd/english/environmentinhk/air/data/emission_inve.html (accessed on 20 July 2020).
- Sharma, S.; Zhang, M.; Anshika; Gao, J.; Zhang, H.; Kota, S.H. Effect of restricted emissions during COVID-19 on air quality in India. Sci. Total Env. 2020, 728, 138878. [Google Scholar] [CrossRef] [PubMed]
- Collivignarelli, M.C.; Abbà, A.; Bertanza, G.; Pedrazzani, R.; Ricciardi, P.; Carnevale Miino, M. Lockdown for CoViD-2019 in Milan: What are the effects on air quality? Sci. Total Env. 2020, 732, 139280. [Google Scholar] [CrossRef] [PubMed]
- Berman, J.D.; Ebisu, K. Changes in U.S. air pollution during the COVID-19 pandemic. Sci. Total Env. 2020, 739, 139864. [Google Scholar] [CrossRef] [PubMed]
- Chauhan, A.; Singh, R.P. Decline in PM2.5 concentrations over major cities around the world associated with COVID-19. Env. Res. 2020, 187, 109634. [Google Scholar] [CrossRef] [PubMed]
© 2020 by the authors. Licensee MDPI, Basel, Switzerland. This article is an open access article distributed under the terms and conditions of the Creative Commons Attribution (CC BY) license (http://creativecommons.org/licenses/by/4.0/).