Cloudiness Information Services for Solar Energy Management in West Africa


Abstract
1. Introduction
- How does the sub-daily surface solar radiation vary from one year to the other in WA?
- What percentage of incoming solar radiation is attenuated by clouds in WA?
- How persistent are cloudy and cloudless conditions in the region?
2. Materials and Methods
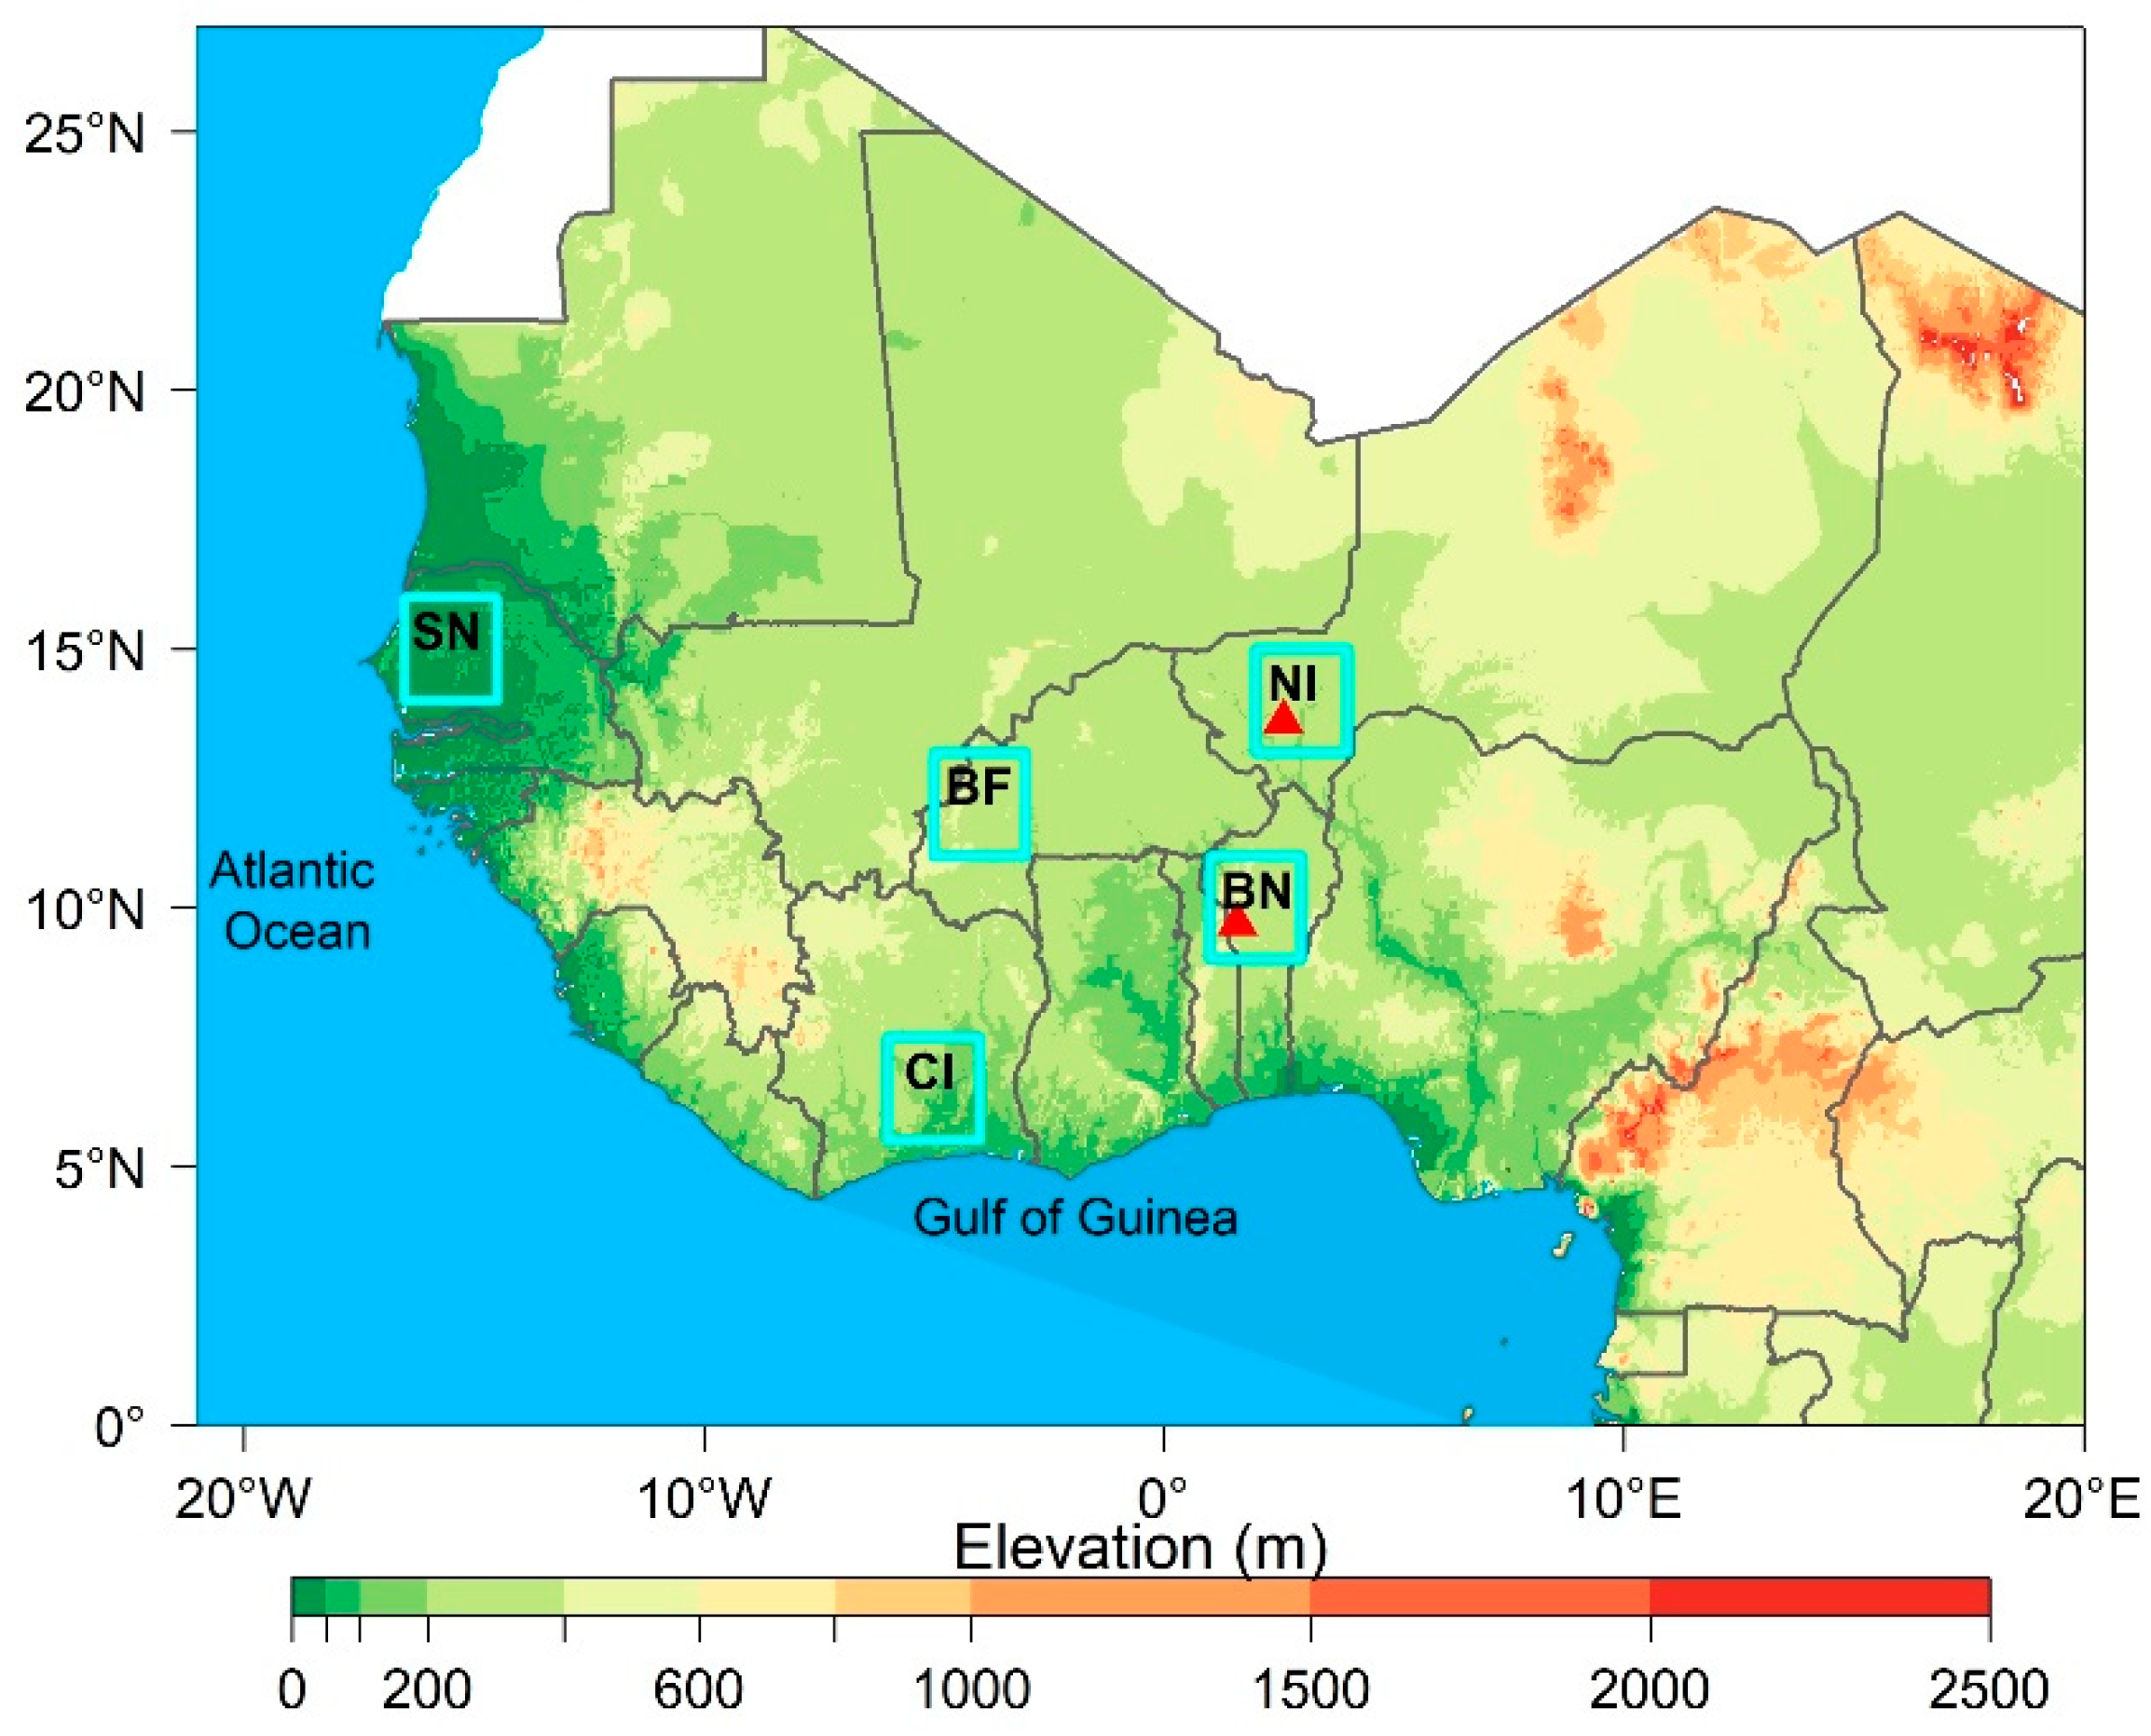
2.1. Data
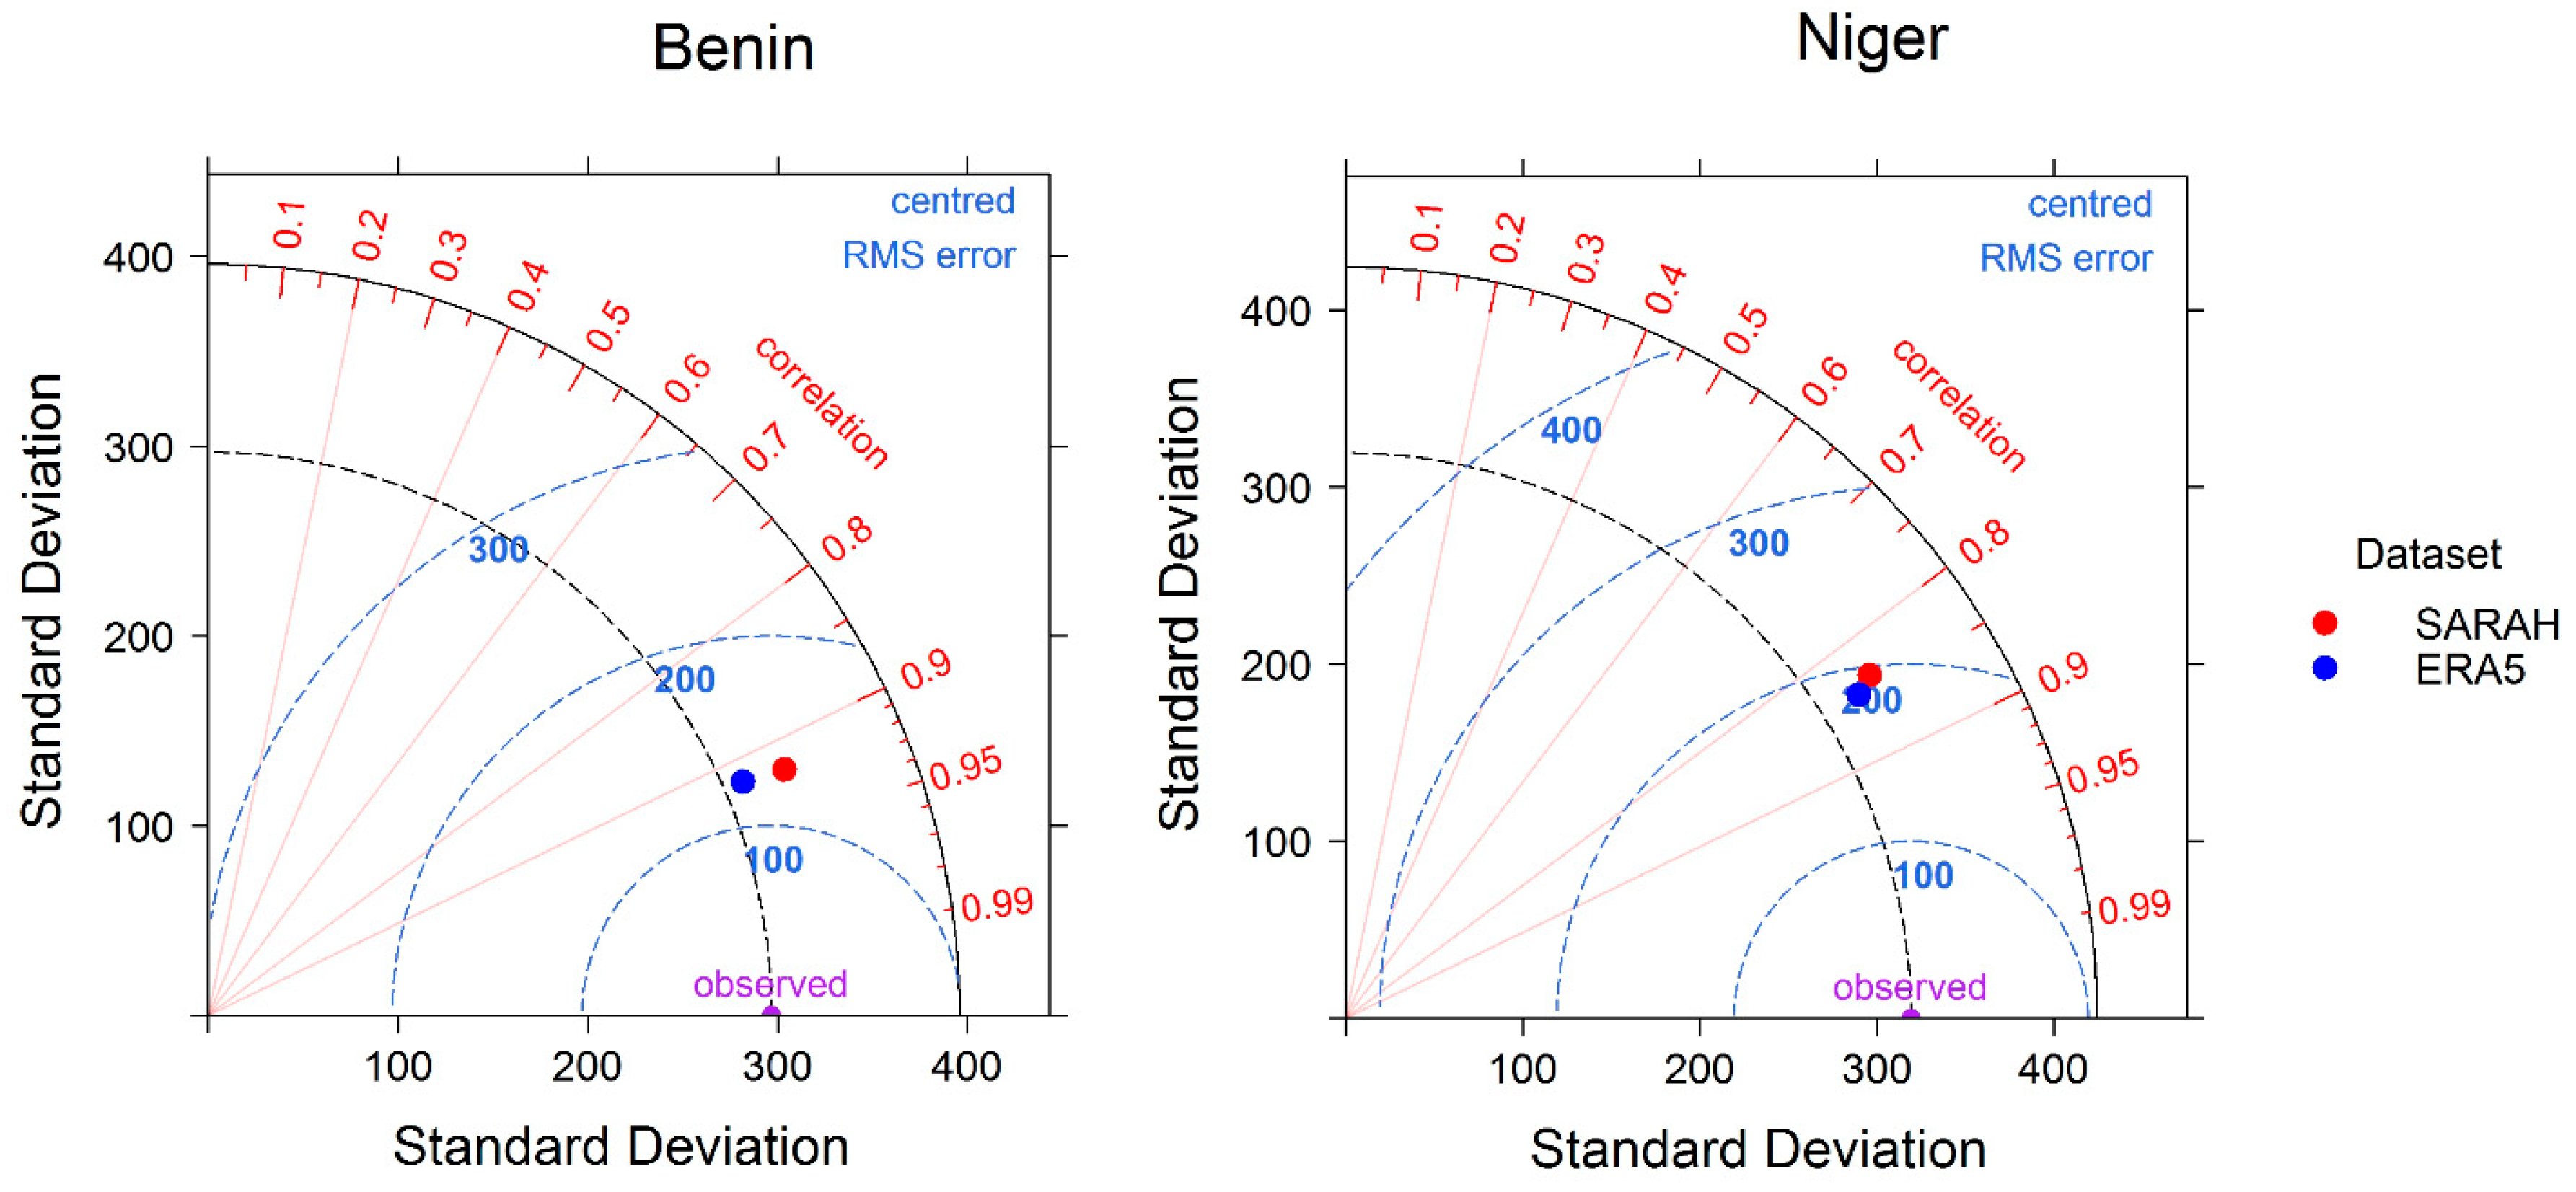
Data Evaluation
2.2. Methodology
3. Results and Discussion
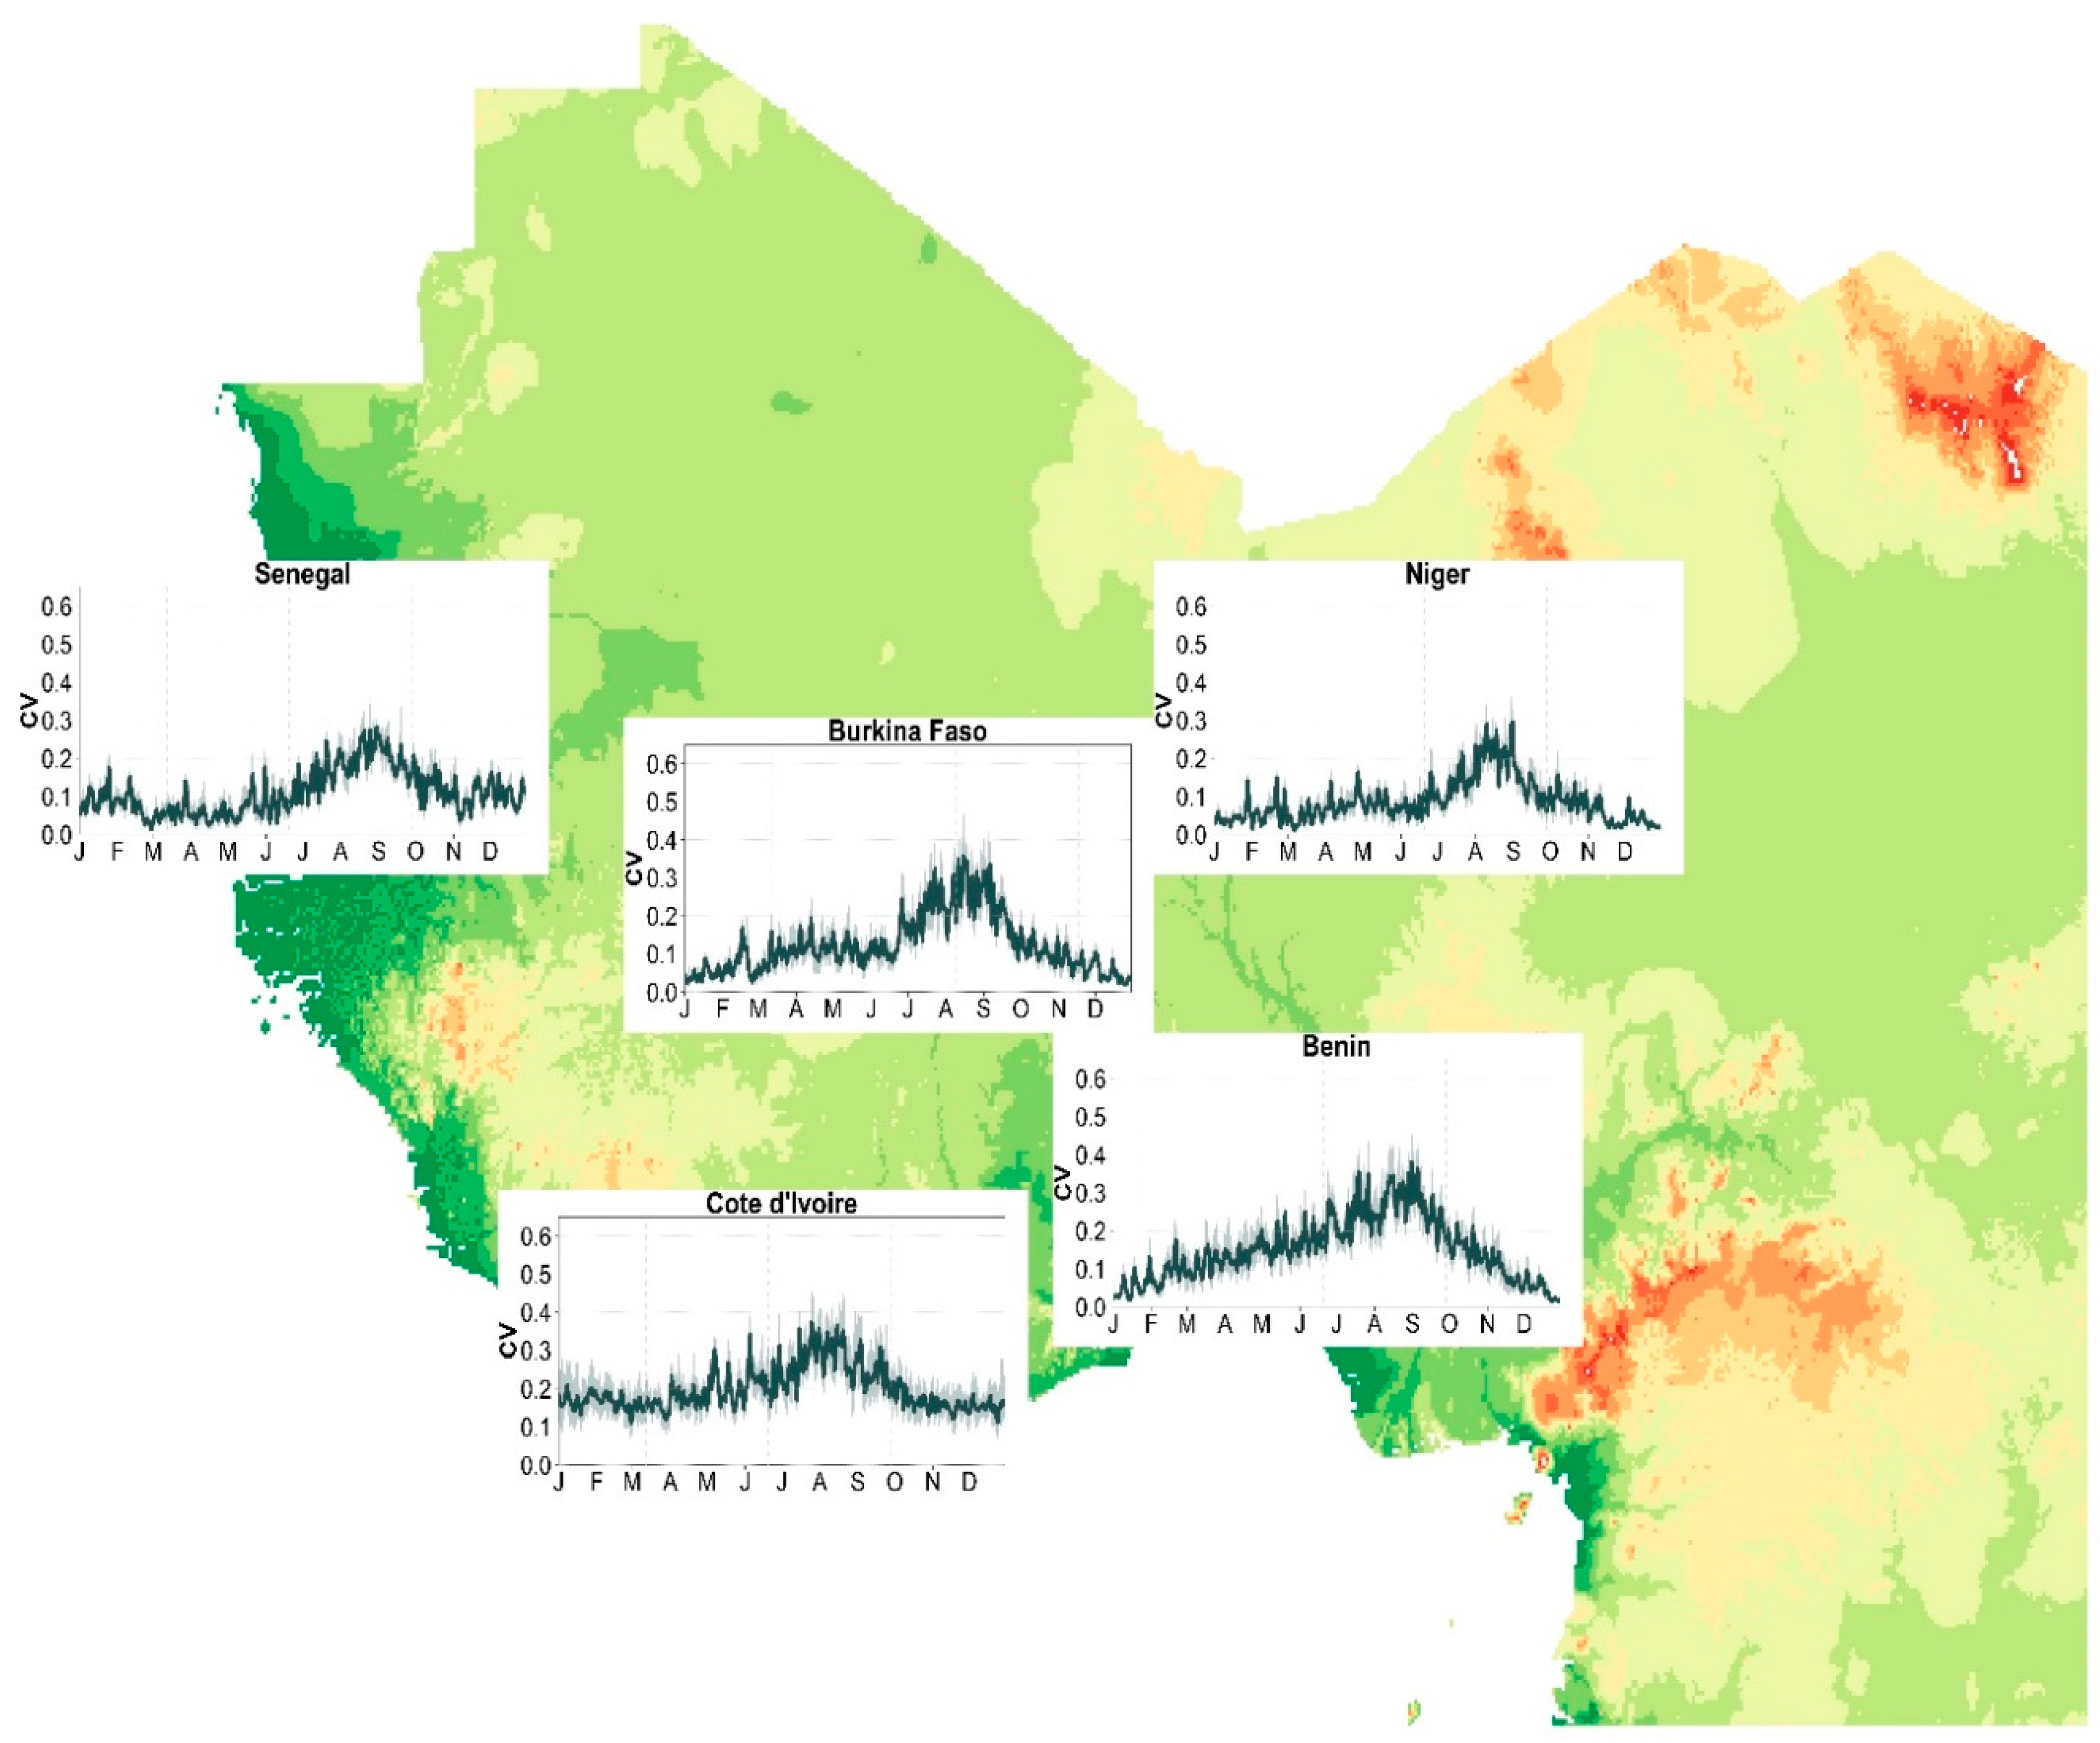
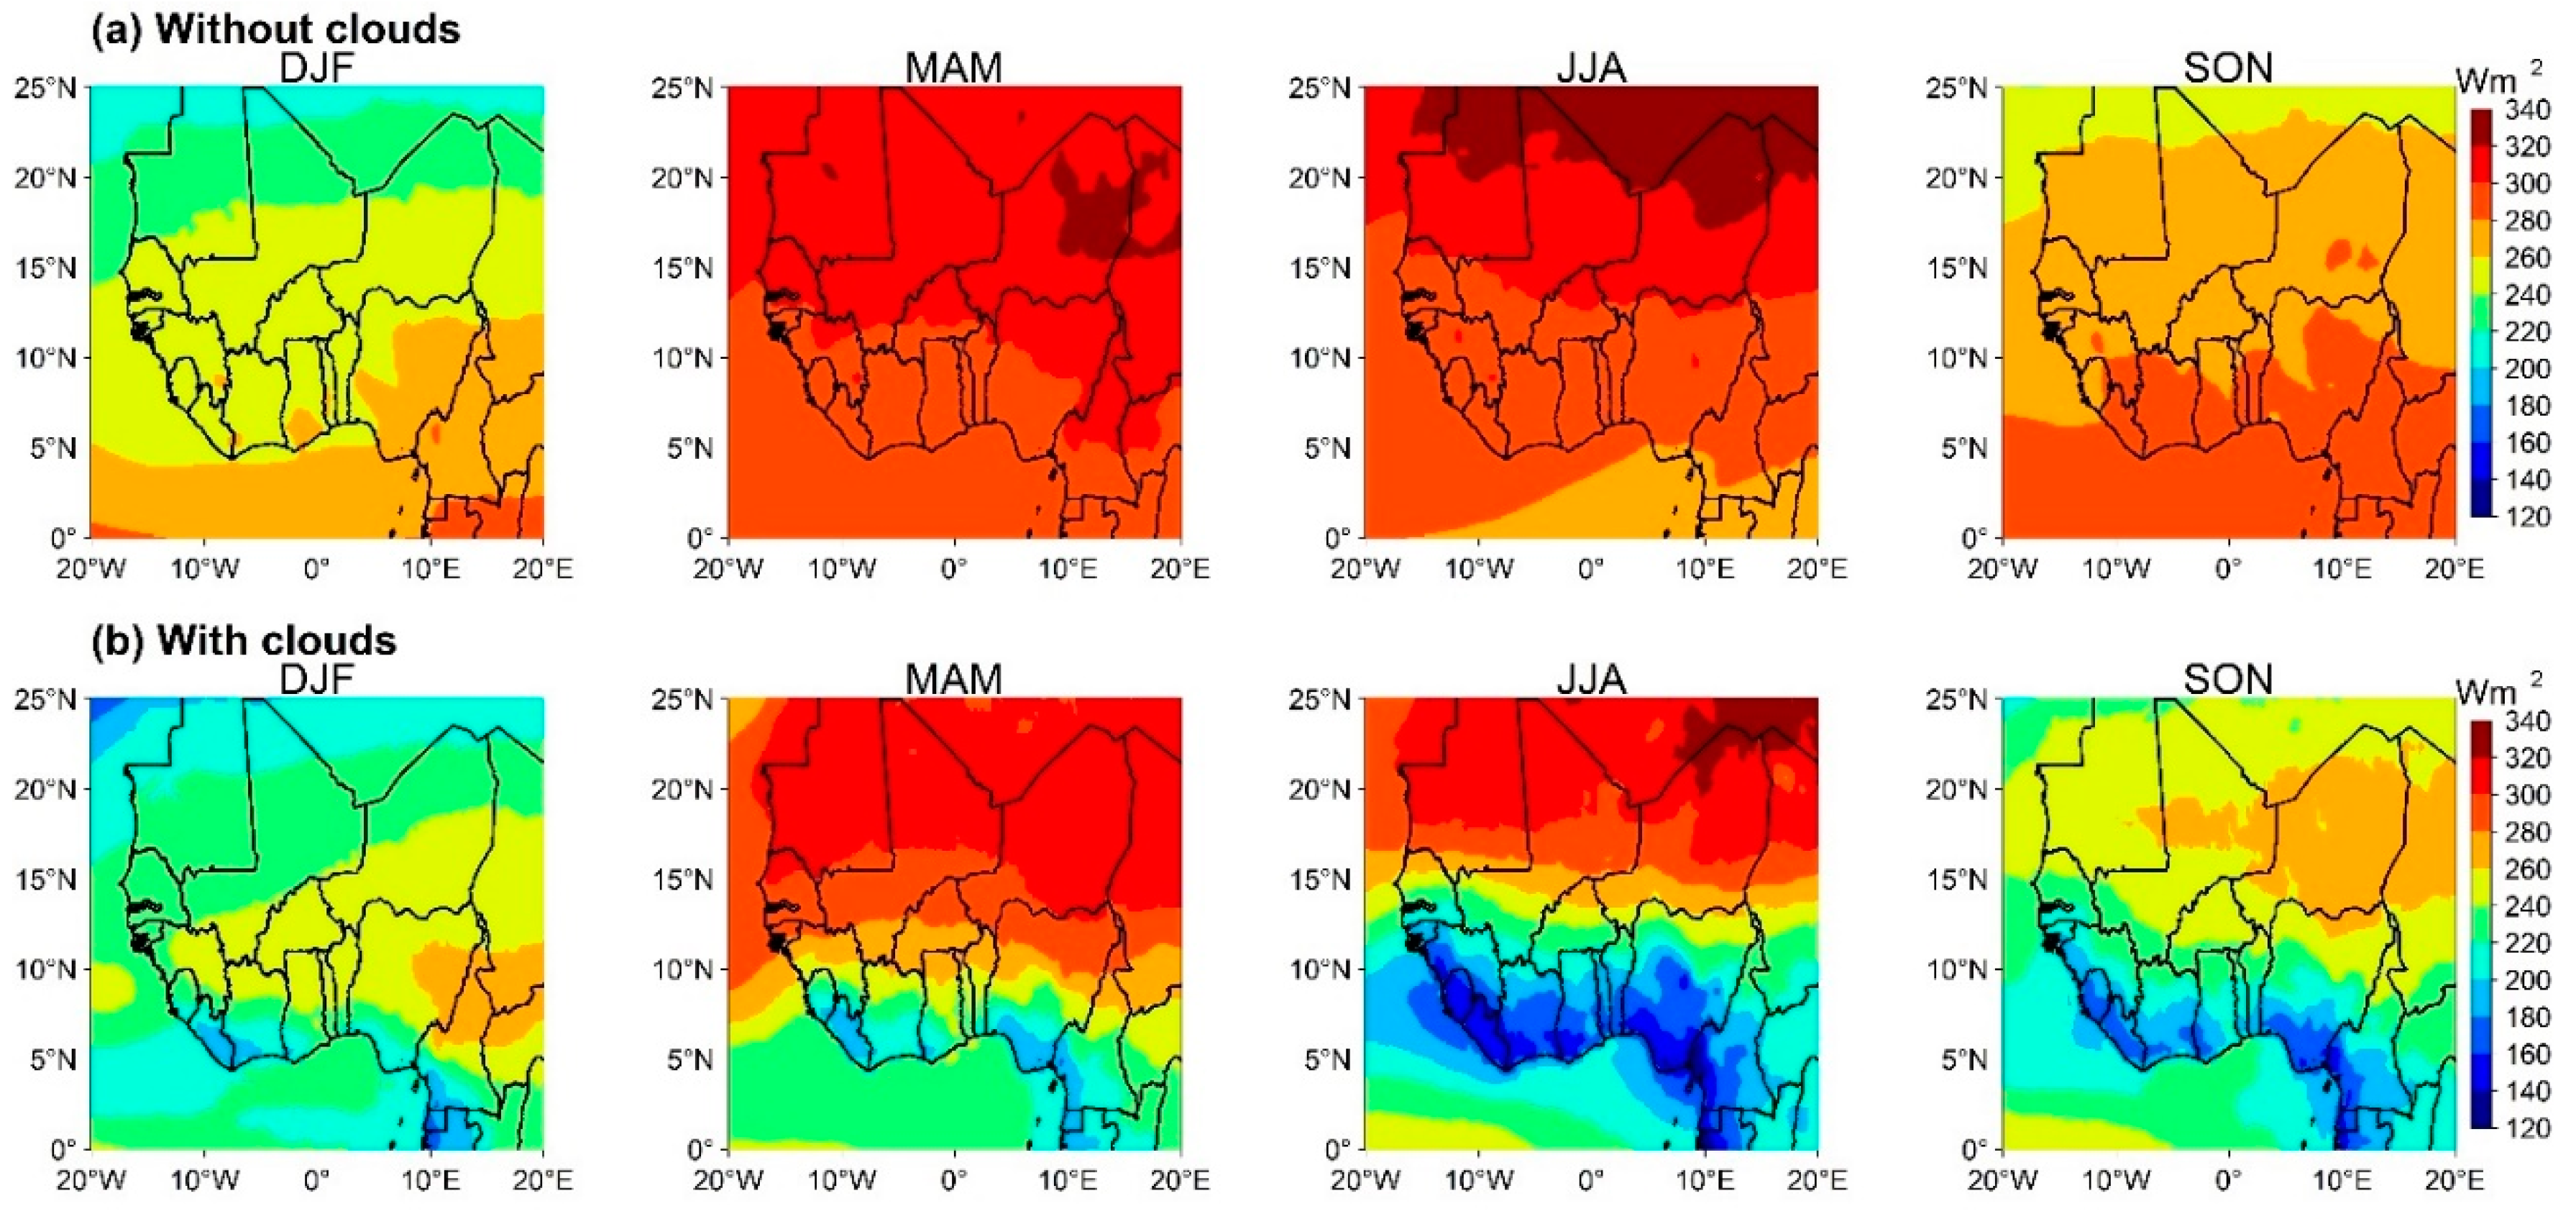
3.1. Variability of Received Surface Solar Radiation
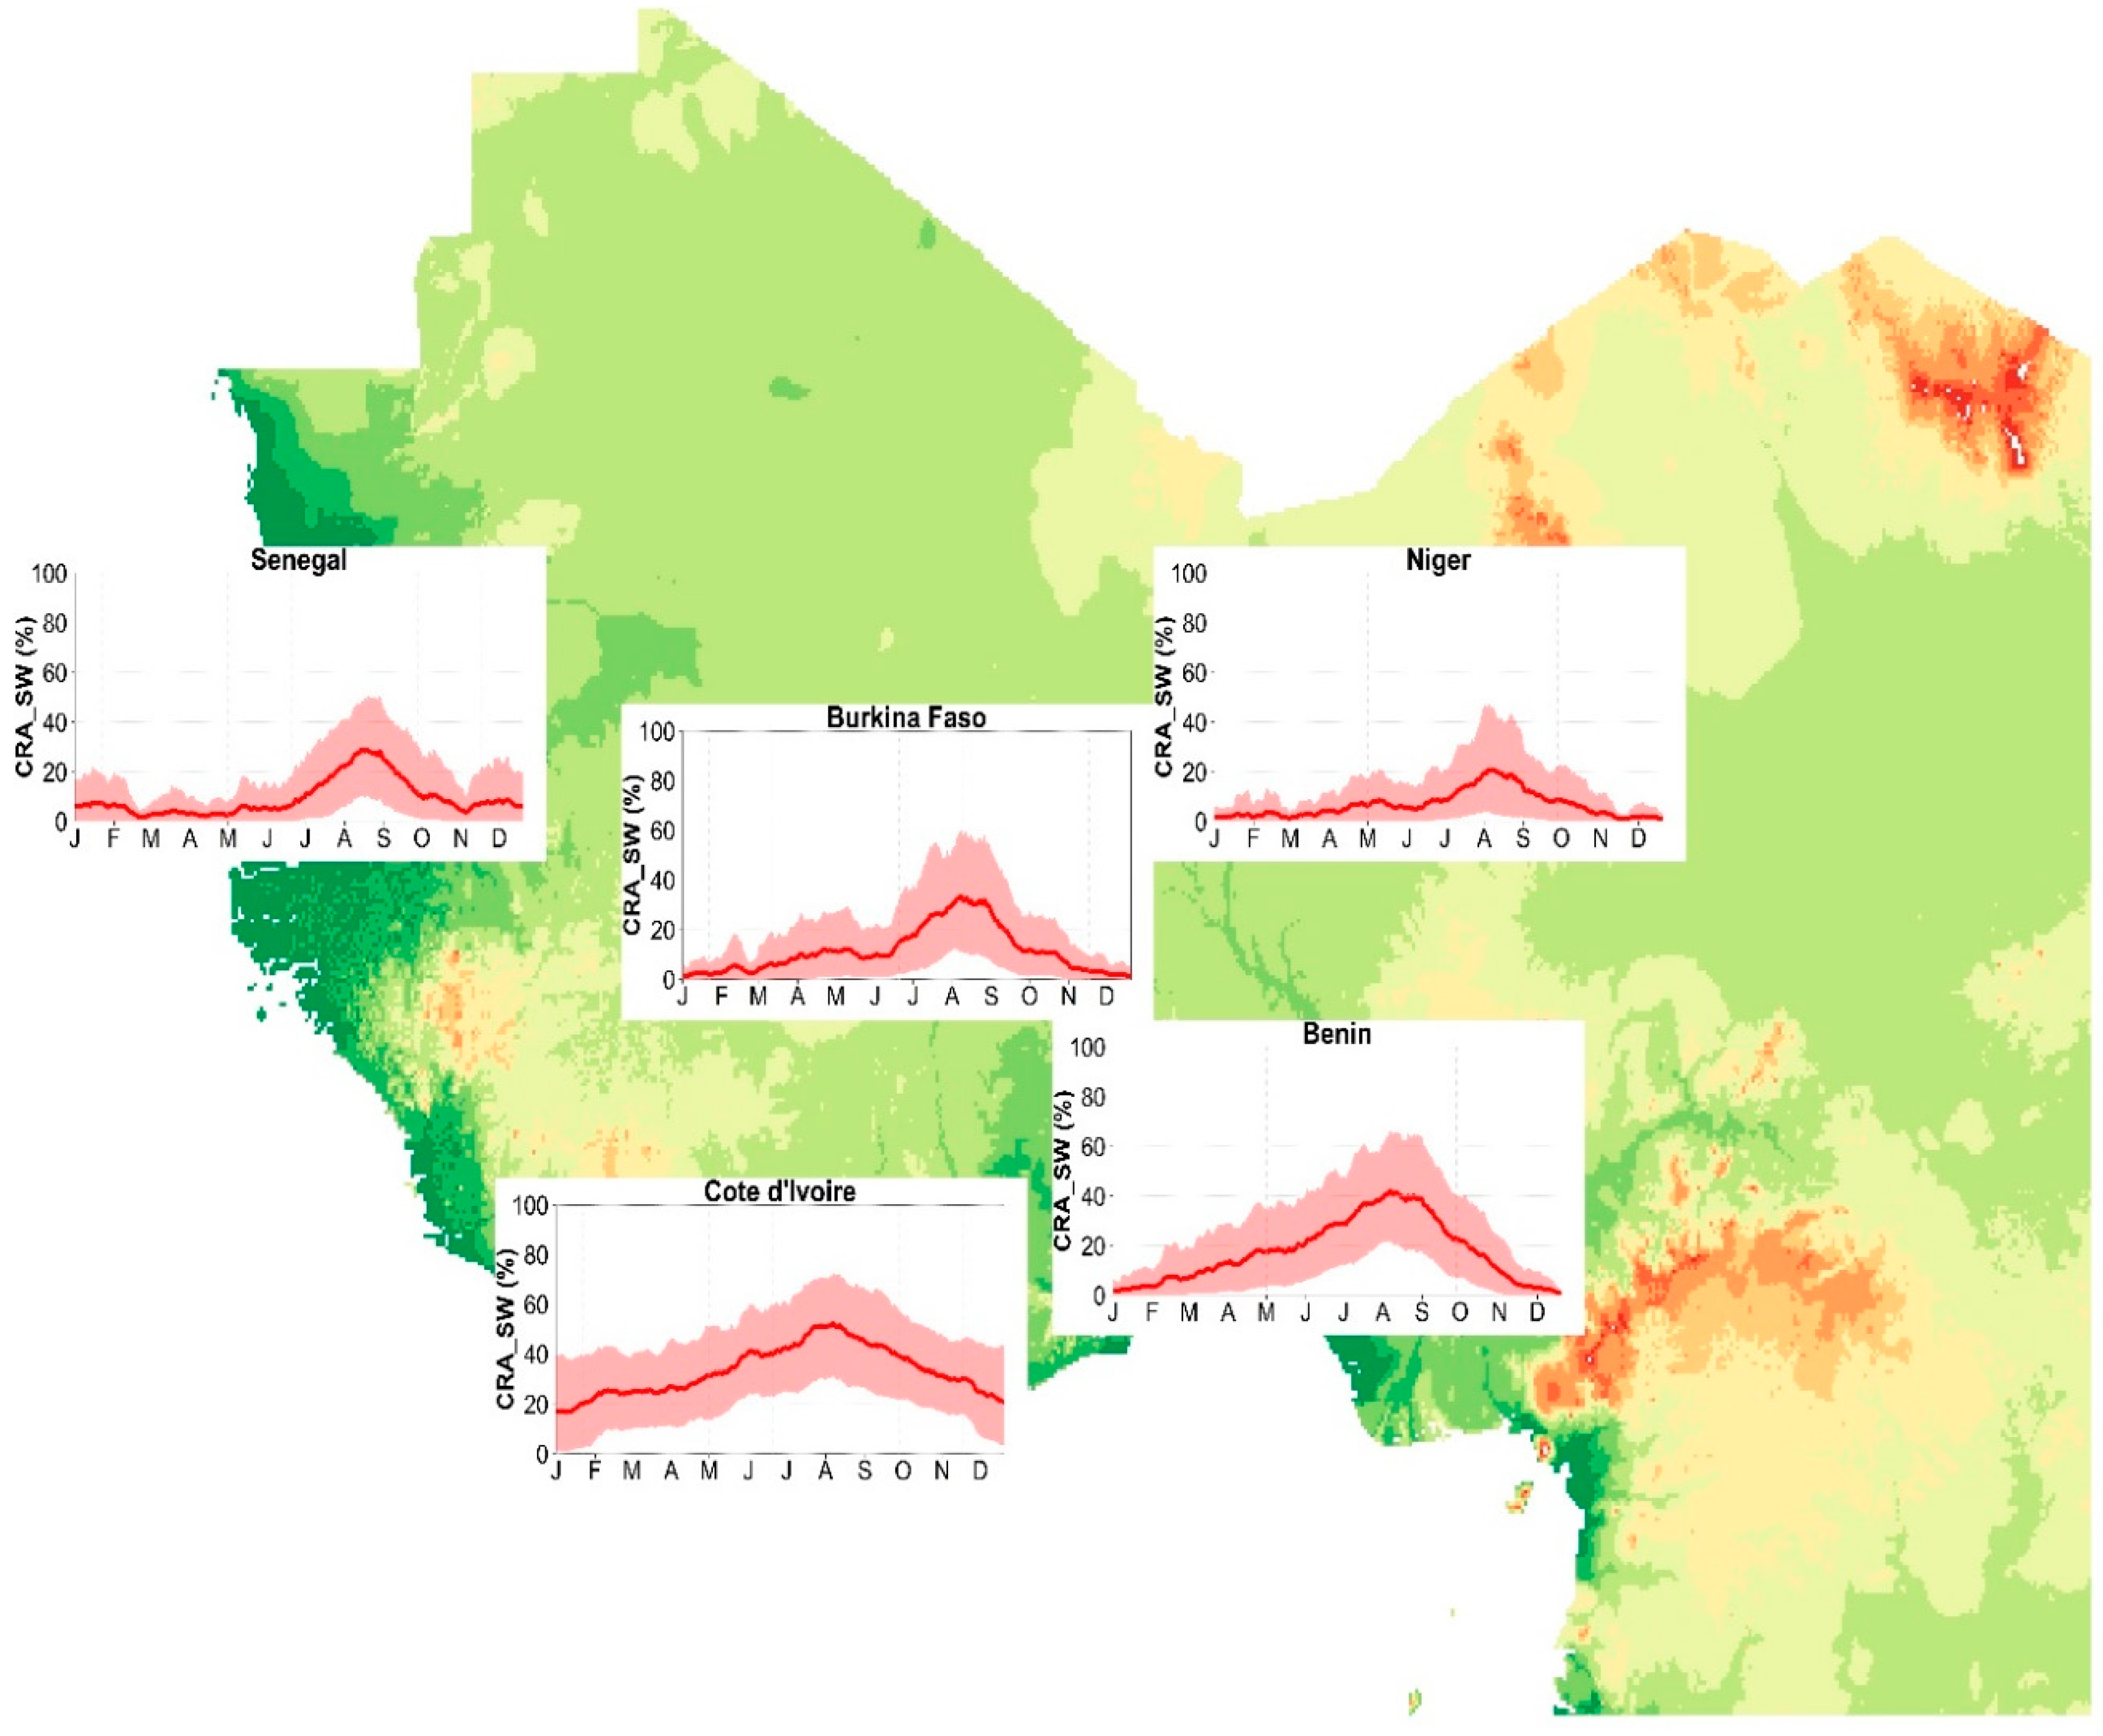
3.2. Attenuation of Incoming Solar Radiation by Clouds
3.3. Dependence of Cloud Radiation Attenuation of Cloud Fraction
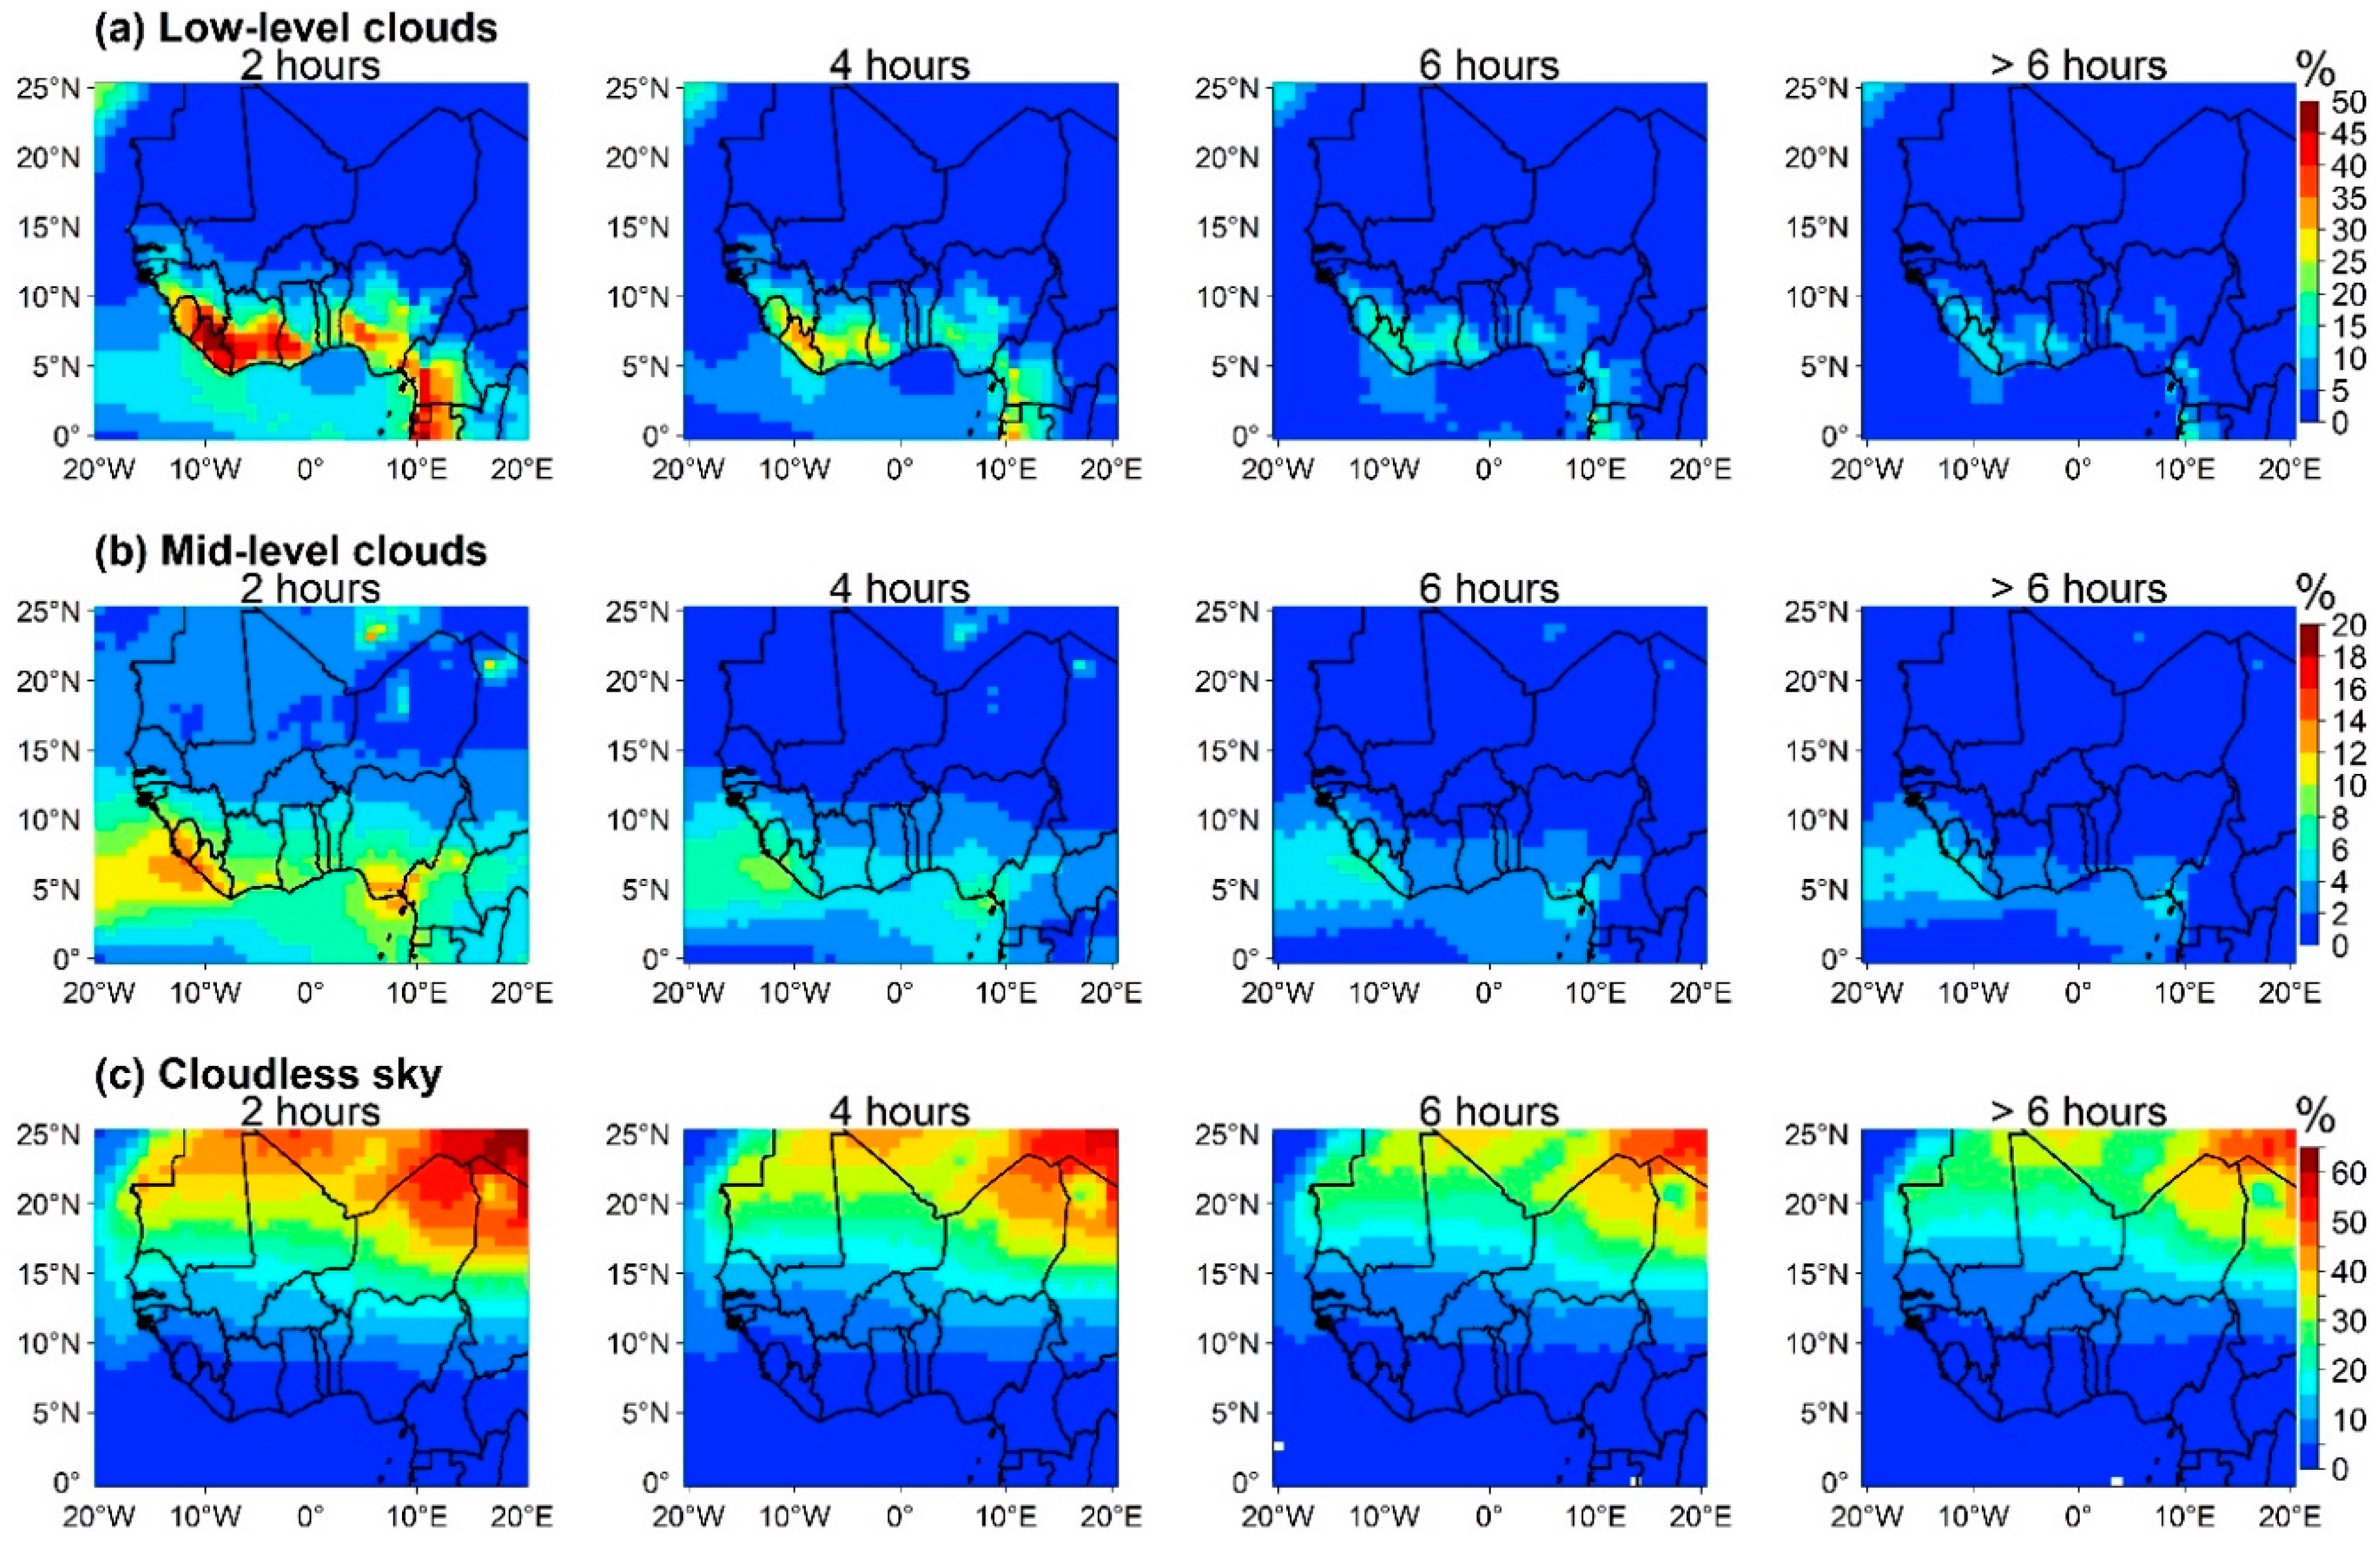
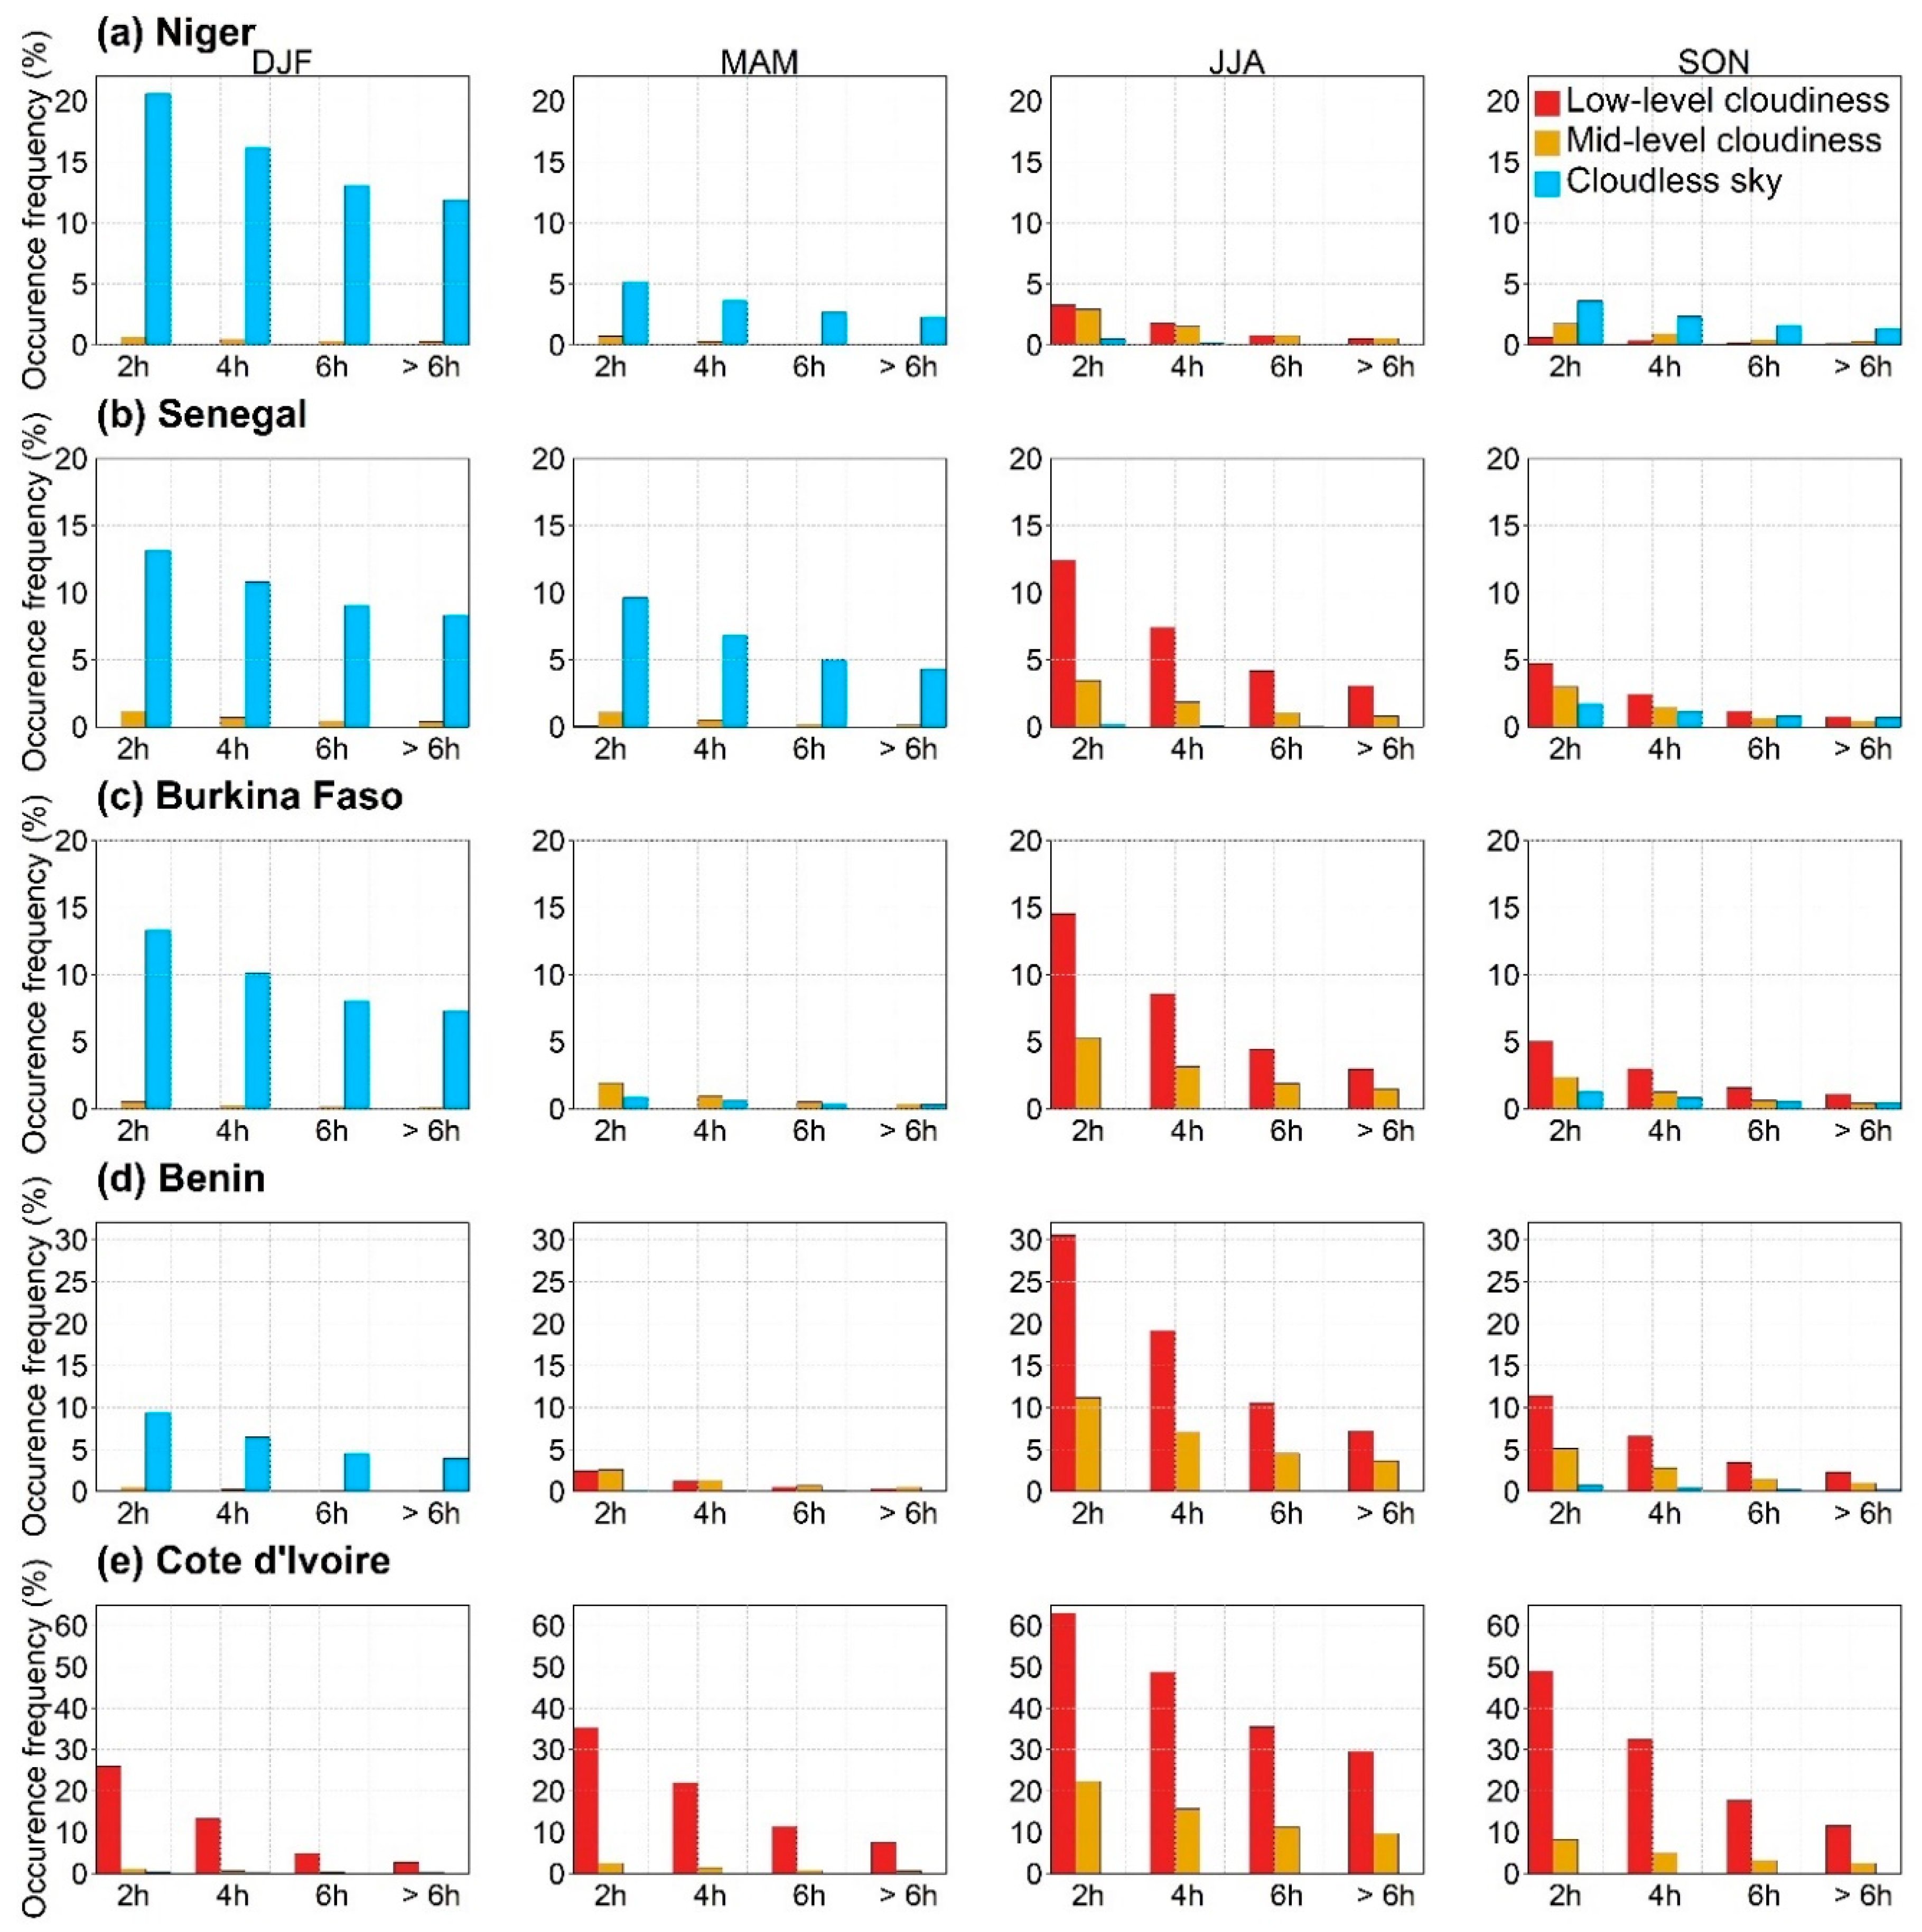
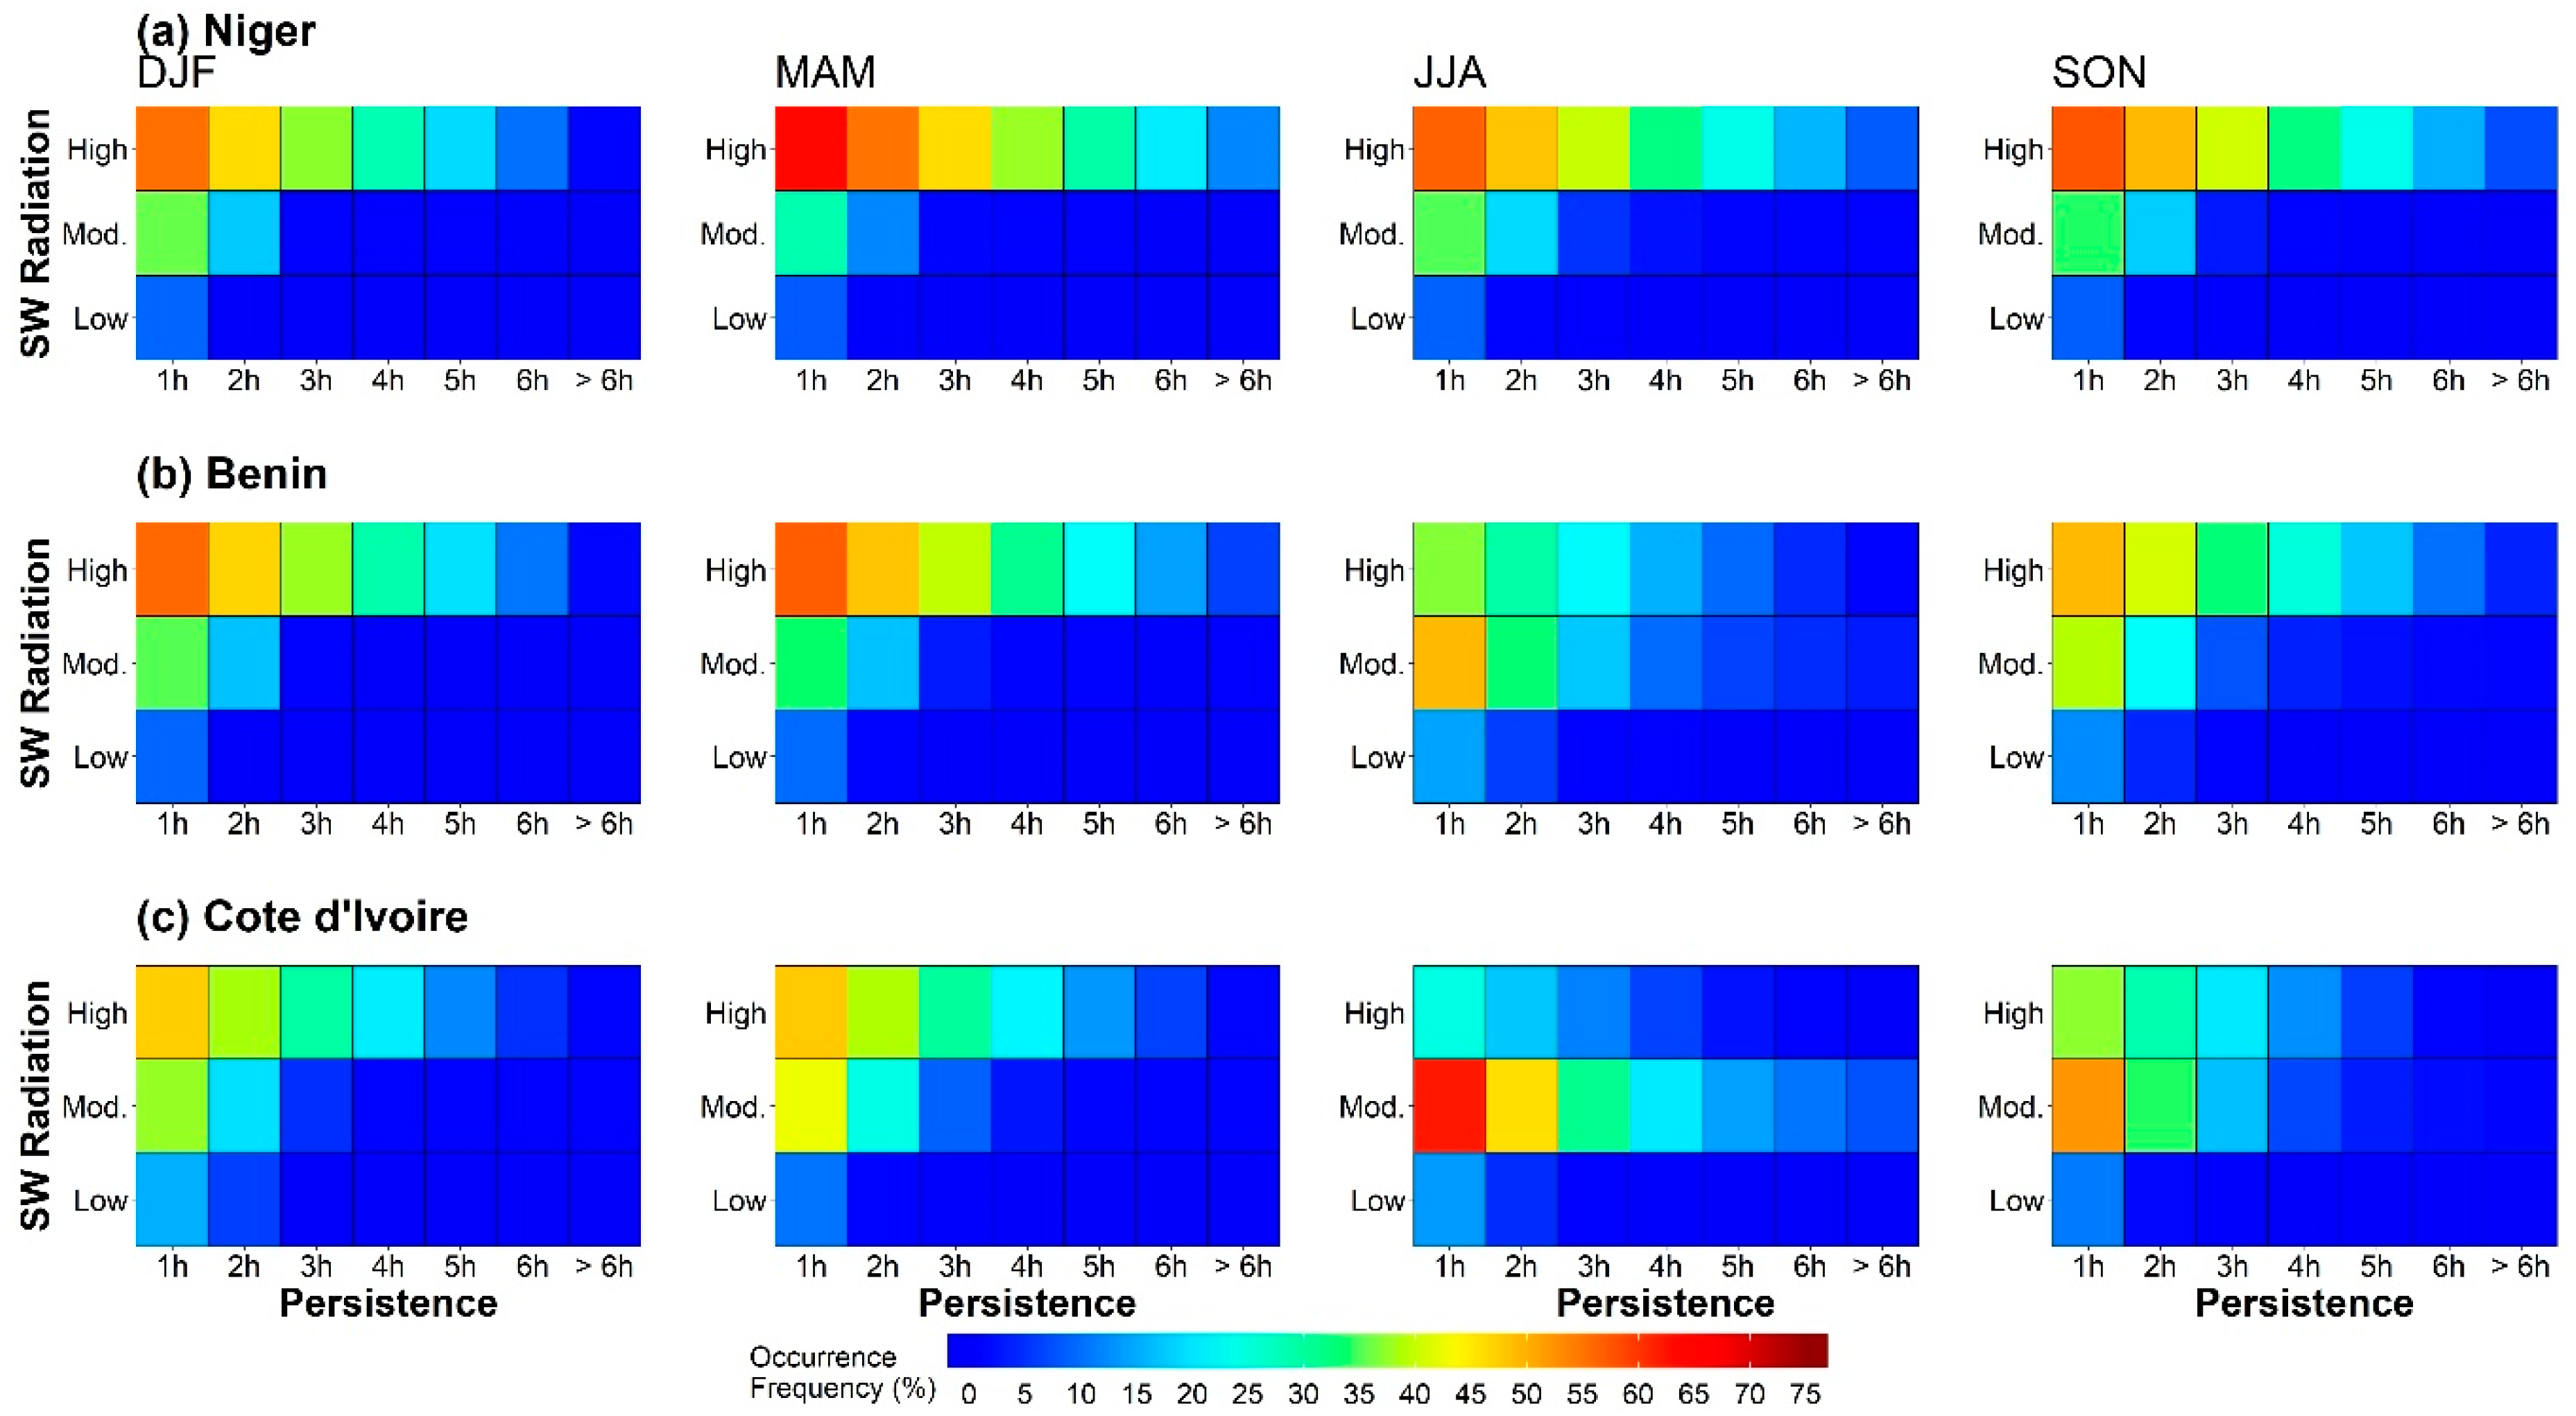
3.4. Multi-Timescale Persistence of Sky Conditions
4. Summary and Conclusions
Author Contributions
Funding
Acknowledgments
Conflicts of Interest
References
- IPCC. Climate Change 2013: The Physical Science Basis. Contribution of Working Group I to the Fifth Assessment Report of the Intergovernmental Panel on Climate Change; Stocker, T.F., Qin, D., Plattner, G.-K., Tignor, M., Allen, S.K., Boschung, J., Nauels, A., Xia, Y., Bex, V., Midgley, P.M., Eds.; Cambridge University Press: Cambridge, UK; New York, NY, USA, 2013. [CrossRef]
- Allen, M.R.; Dube, O.P.; Solecki, W.; Aragón-Durand, F.; Cramer, W.; Humphreys, S.; Kainuma, M.; Kala, J.; Mahowald, N.; Mulugetta, Y.; et al. Framing and Context. In Global Warming of 1.5 °C. An IPCC Special Report on the Impacts of Global Warming of 1.5 °C Above Pre-Industrial Levels and Related Global Greenhouse Gas Emission Pathways, In the Context of Strengthening the Global Response to the Threat of Climate Change; Masson-Delmotte, V., Zhai, P., Pörtner, H.-O., Roberts, D., Skea, J., Shukla, P.R., Pirani, A., Moufouma-Okia, W., Péan, C., Pidcock, R., et al., Eds.; IPCC: Geneva, Switzerland, 2018. [Google Scholar]
- Global Energy & CO2 Status Report 2019; IEA: Paris, France, 2019.
- Rogelj, J.; Shindell, D.; Jiang, K.; Fifita, S.; Forster, P.; Ginzburg, V.; Handa, C.; Kheshgi, H.; Kobayashi, S.; Kriegler, E.; et al. Mitigation Pathways Compatible with 1.5 °C in the Context of Sustainable Development. In Global Warming of 1.5 °C. An IPCC Special Report on the Impacts of Global Warming of 1.5 °C Above Pre-Industrial Levels and Related Global Greenhouse Gas Emission Pathways, in the Context of Strengthening the Global Response to the Threat of Climate Change; Masson-Delmotte, V., Zhai, P., Pörtner, H.-O., Roberts, D., Skea, J., Shukla, P.R., Pirani, A., Moufouma-Okia, W., Péan, C., Pidcock, R., et al., Eds.; IPCC: Geneva, Switzerland, 2018. [Google Scholar]
- Yushchenko, A.; de Bono, A.; Chatenoux, B.; Patel, M.K.; Ray, N. GIS-Based Assessment of Photovoltaic (PV) and Concentrated Solar Power (CSP) Generation Potential in West Africa. Renew. Sustain. Energy Rev. 2017, 81, 2088–2103. [Google Scholar] [CrossRef]
- Hermann, S.; Miketa, A.; Fichaux, N. Estimating the Renewable Energy Potential in Africa: A GIS-Based Approach; IRENA-KTH working paper; International Renewable Energy Agency: Abu Dhabi, UAE, 2014. [Google Scholar]
- MPEER (Ministre du Pétrole, de l’Energie et des E. R). Rapport d’Activités MPEER 2018. Available online: http://www.energie.gouv.ci/uploads/documents/rapports/RAPPORT_D_ACTIVITES_MPEER_2018.pdf (accessed on 5 August 2020).
- Kuwonu, F. Harvesting the Sun. Scaling Up Solar Power to Meet Africa’s Energy Needs. Available online: https://www.un.org/africarenewal/magazine/april-2016/harvesting-sun (accessed on 15 May 2020).
- Moner-Girona, M.; Bódis, K.; Korgo, B.; Huld, T.; Kougias, I.; Pinedo-Pascua, I.; Monforti-Ferrario, F.; Szabó, S. Mapping the Least-Cost Option for Rural Electrification in Burkina Faso: Scaling-up Renewable Energies; Publications Office of the European Union: Luxembourg, 2017. [Google Scholar] [CrossRef]
- Pyrina, M.; Hatzianastassiou, N.; Matsoukas, C.; Fotiadi, A.; Papadimas, C.D.; Pavlakis, K.G.; Vardavas, I. Cloud Effects on the Solar and Thermal Radiation Budgets of the Mediterranean Basin. Atmos. Res. 2013, 152, 14–28. [Google Scholar] [CrossRef]
- Bouniol, D.; Couvreux, F.; Kamsu-Tamo, P.H.; Leplay, M.; Guichard, F.; Favot, F.; O’connor, E.J. Diurnal and Seasonal Cycles of Cloud Occurrences, Types, and Radiative Impact over West Africa. J. Appl. Meteorol. Climatol. 2012, 51, 534–553. [Google Scholar] [CrossRef]
- Dajuma, A.; Yahaya, S.; Touré, S.; Diedhiou, A.; Adamou, R.; Konaré, A.; Sido, M.; Golba, M. Sensitivity of Solar Photovoltaic Panel Efficiency to Weather and Dust over West Africa: Comparative Experimental Study between Niamey (Niger) and Abidjan (Côte d’Ivoire). Comput. Water Energy Environ. Eng. 2016, 5, 123–147. [Google Scholar] [CrossRef]
- Stanelle, T.; Vogel, B.; Vogel, H.; Bäumer, D.; Kottmeier, C. Feedback between Dust Particles and Atmospheric Processes over West Africa during Dust Episodes in March 2006 and June 2007. Atmos. Chem. Phys. 2010, 10, 10771–10788. [Google Scholar] [CrossRef]
- Liou, K.N. An Introduction to Atmospheric Radiation Volume 84 of International Geophysics, 2nd ed.; Elsevier Science: Amsterdam, The Netherlands, 2002. [Google Scholar]
- Wang, K.C.; Dickinson, R.E.; Wild, M.; Liang, S. Atmospheric Impacts on Climatic Variability of Surface Incident Solar Radiation. Atmos. Chem. Phys. 2012, 12, 9581–9592. [Google Scholar] [CrossRef]
- Engeland, K.; Borga, M.; Creutin, J.-D.; François, B.; Ramos, M.-H.; Vidal, J.-P. Space-Time Variability of Climate Variables and Intermittent Renewable Electricity Production–A Review. Renew. Sustain. Energy Rev. 2017, 79, 600–617. [Google Scholar] [CrossRef]
- van der Linden, R.; Fink, A.H.; Redl, R. Satellite-Based Climatology of Low-Level Continental Clouds in Southern West Africa during the Summer Monsoon Season. J. Geophys. Res. Atmos. 2015, 120, 1186–1201. [Google Scholar] [CrossRef]
- Hill, P.G.; Allan, R.P.; Chiu, J.C.; Stein, T.H.M. A Multisatellite Climatology of Clouds, Radiation, and Precipitation in Southern West Africa and Comparison to Climate Models. J. Geophys. Res. 2016, 121, 10857–10879. [Google Scholar] [CrossRef]
- Danso, D.K.; Anquetin, S.; Diedhiou, A.; Lavaysse, C.; Kobea, A.; Touré, N.E. Spatio-Temporal Variability of Cloud Cover Types in West Africa with Satellite-Based and Reanalysis Data. Q. J. R. Meteorol. Soc. 2019, 145, 3715–3731. [Google Scholar] [CrossRef]
- Bonkaney, A.; Madougou, S.; Adamou, R. Impacts of Cloud Cover and Dust on the Performance of Photovoltaic Module in Niamey. J. Renew. Energy 2017, 2017, 8. [Google Scholar] [CrossRef]
- Hill, P.G.; Allan, R.P.; Chiu, J.C.; Bodas-Salcedo, A.; Knippertz, P. Quantifying the Contribution of Different Cloud Types to the Radiation Budget in Southern West Africa. J. Clim. 2018, 31, 5273–5291. [Google Scholar] [CrossRef]
- Copernicicus Climate Change Service (C3S). ERA5: Fifth Generation of ECMWF Atmospheric Reanalysis of the Global Climate; Copernicus Climate Change Service Climate Data Store (CDS). Available online: https://cds.climate.copernicus.eu/cdsapp#!/home (accessed on 5 September 2018).
- Sterl, S.; Liersch, S.; Koch, H.; Lipzig, N.P.M.V.; Thiery, W. A New Approach for Assessing Synergies of Solar and Wind Power: Implications for West Africa. Environ. Res. Lett. 2018, 13. [Google Scholar] [CrossRef]
- Forbes, R. Clouds and Precipitation: From Models to Forecasting. Available online: https://confluence.ecmwf.int/download/attachments/70951731/cloud_forbes_TCOP_Feb2017.pdf?api=v2 (accessed on 5 August 2020).
- Lott, N.; Baldwin, R.; Jones, P. The FCC Integrated Surface Hourly Database, a New Resource of Global Climate Data. Nat. Clim. Data Center Tech. Rep. 2001. Available online: https://doi.org/http://Www1.Ncdc.Noaa.Gov/Pub/Data/Techrpts/Tr2000101/Tr2001-01.Pdf (accessed on 5 August 2020).
- Galle, S.; Grippa, M.; Peugeot, C.; Moussa, I.B.; Cappelaere, B.; Demarty, J.; Mougin, E.; Panthou, G.; Adjomayi, P.; Agbossou, E.K.; et al. AMMA-CATCH, a Critical Zone Observatory in West Africa Monitoring a Region in Transition. Vadose Zo. J. 2018, 17, 1–24. [Google Scholar] [CrossRef]
- Pfeifroth, U.; Kothe, S.; Müller, R.; Trentmann, J.; Hollmann, R.; Fuchs, P.; Werscheck, M. Surface Radiation Data Set—Heliosat (SARAH)—Edition 2, Satellite Application Facility on Climate Monitoring; EUMETSAT Satellite Application Facility on Climate Monitoring (CM SAF): Offenbach, Germany, 2017. [Google Scholar] [CrossRef]
- Gbobaniyi, E.; Sarr, A.; Sylla, M.B.; Diallo, I.; Lennard, C.; Dosio, A.; Dhiédiou, A.; Kamga, A.; Klutse, N.A.B.; Hewitson, B.; et al. Climatology, Annual Cycle and Interannual Variability of Precipitation and Temperature in CORDEX Simulations over West Africa. Int. J. Climatol. 2014, 34, 2241–2257. [Google Scholar] [CrossRef]
- Klein, C.; Heinzeller, D.; Bliefernicht, J.; Kunstmann, H. Variability of West African Monsoon Patterns Generated by a WRF Multi-Physics Ensemble. Clim. Dyn. 2015, 45, 2733–2755. [Google Scholar] [CrossRef]
- Parker, D.J.; Diop-Kane, M. Meteorology of Tropical West. Africa: The Forecasters’ Handbook, 1st ed.; John Wiley & Sons Ltd.: Chichester, UK, 2017. [Google Scholar] [CrossRef]
- Brown, C.E. Coefficient of Variation. In Applied Multivariate Statistics in Geohydrology and Related Sciences; Springer: Berlin/Heidelberg, Germany, 1998; pp. 155–157. [Google Scholar] [CrossRef]
- Ramanathan, V.; Cess, R.D.; Harrison, E.F.; Minnis, P.; Barkstrom, B.R.; Ahmad, E.; Hartmann, D. Cloud-Radiative Forcing and Climate: Results from the Earth Radiation Budget Experiment. Science 1989, 243, 57–63. [Google Scholar] [CrossRef]
- Luiz, E.W.; Martins, F.R.; Gonçalves, A.R.; Pereira, E.B. Analysis of Intra-Day Solar Irradiance Variability in Different Brazilian Climate Zones. Sol. Energy 2018, 167, 210–219. [Google Scholar] [CrossRef]
- Shivashankar, S.; Mekhilef, S.; Mokhlis, H.; Karimi, M. Mitigating Methods of Power Fluctuation of Photovoltaic (PV) Sources—A Review. Renew. Sustain. Energy Rev. 2016, 59, 1170–1184. [Google Scholar] [CrossRef]
- Sultan, B.; Janicot, S. The West African Monsoon Dynamics. Part II: The “Preonset” and “Onset” of the Summer Monsoon. J. Clim. 2003, 16, 3407–3427. [Google Scholar] [CrossRef]
- Nicholson, S.E. The ITCZ and the Seasonal Cycle over Equatorial Africa. Bull. Am. Meteorol. Soc. 2018, 99, 337–348. [Google Scholar] [CrossRef]
- Nicholson, S.E. A Revised Picture of the Structure of the “Monsoon” and Land ITCZ over West Africa. Clim. Dyn. 2009, 32, 1155–1171. [Google Scholar] [CrossRef]
- Sultan, B.; Janicot, S. Abrupt Shift of the ITCZ over West Africa and Intra-Seasonal Variability. Geophys. Res. Lett. 2000, 27, 3353–3356. [Google Scholar] [CrossRef]
- Hayward, D.F.; Oguntoyinbo, J.S. Climatology of West. Africa; Hutchinson: London, UK, 1987. [Google Scholar]
- Stein, T.H.M.; Parker, D.J.; Delanoë, J.; Dixon, N.S.; Hogan, R.J.; Knippertz, P.; Maidment, R.I.; Marsham, J.H. The Vertical Cloud Structure of the West African Monsoon: A 4 Year Climatology Using CloudSat and CALIPSO. J. Geophys. Res. Atmos. 2011, 116, 1–13. [Google Scholar] [CrossRef]
- Bourgeois, E.; Bouniol, D.; Couvreux, F.; Guichard, F.; Marsham, J.H.; Garcia-Carreras, L.; Birch, C.E.; Parker, D.J. Characteristics of Mid-Level Clouds over West Africa. Q. J. R. Meteorol. Soc. 2018, 144, 426–442. [Google Scholar] [CrossRef]
- Danso, D.K.; Anquetin, S.; Diedhiou, A.; Kouadio, K.; Kobéa, A.T. Daytime Low-Level Clouds in West Africa—Occurrence, Associated Drivers and Shortwave Radiation Attenuation. Earth Syst. Dynam. Discuss. 2020. in review. [Google Scholar] [CrossRef]
- Crouvi, O.; Schepanski, K.; Amit, R.; Gillespie, A.R.; Enzel, Y. Multiple Dust Sources in the Sahara Desert: The Importance of Sand Dunes. Geophys. Res. Lett. 2012, 39, 1–8. [Google Scholar] [CrossRef]
- Knippertz, P.; Todd, M.C. Mineral Dust Aerosols over the Sahara: Processes of Emission and Transport, and Implications for Modeling. Rev. Geophys. 2012, 50, 28. [Google Scholar] [CrossRef]
- Pfeifroth, U.; Sanchez-Lorenzo, A.; Manara, V.; Trentmann, J.; Hollmann, R. Trends and Variability of Surface Solar Radiation in Europe Based On Surface- and Satellite-Based Data Records. J. Geophys. Res. Atmos. 2018, 123, 1735–1754. [Google Scholar] [CrossRef]


| Input Data | Symbol | Details |
|---|---|---|
| Surface downwelling shortwave radiation, all sky | Input for cloud radiative attenuation of all clouds and of different cloud types | |
| Surface downwelling shortwave radiation, clear sky | ||
| Total cloudiness | TC | Input for cloud radiative attenuation of all clouds |
| High-level cloudiness | HLC | Input for cloud radiative attenuation of high-level clouds |
| Mid-level cloudiness | MLC | Input for cloud radiative attenuation of mid-level clouds |
| Low-level cloudiness | LLC | Input for cloud radiative attenuation of low-level clouds |
| Region | |||
|---|---|---|---|
| HLC | MLC | LLC | |
| Senegal | 0.59 | 0.94 | 0.93 |
| Burkina Faso | 0.53 | 0.93 | 0.99 |
| Niger | 0.5 | 0.92 | 0.91 |
| Benin | 0.45 | 0.93 | 0.96 |
| Cote d’Ivoire | 0.72 | 0.97 | 0.92 |
© 2020 by the authors. Licensee MDPI, Basel, Switzerland. This article is an open access article distributed under the terms and conditions of the Creative Commons Attribution (CC BY) license (http://creativecommons.org/licenses/by/4.0/).
Share and Cite
Danso, D.K.; Anquetin, S.; Diedhiou, A.; Adamou, R. Cloudiness Information Services for Solar Energy Management in West Africa. Atmosphere 2020, 11, 857. https://doi.org/10.3390/atmos11080857
Danso DK, Anquetin S, Diedhiou A, Adamou R. Cloudiness Information Services for Solar Energy Management in West Africa. Atmosphere. 2020; 11(8):857. https://doi.org/10.3390/atmos11080857
Chicago/Turabian StyleDanso, Derrick Kwadwo, Sandrine Anquetin, Arona Diedhiou, and Rabani Adamou. 2020. "Cloudiness Information Services for Solar Energy Management in West Africa" Atmosphere 11, no. 8: 857. https://doi.org/10.3390/atmos11080857
APA StyleDanso, D. K., Anquetin, S., Diedhiou, A., & Adamou, R. (2020). Cloudiness Information Services for Solar Energy Management in West Africa. Atmosphere, 11(8), 857. https://doi.org/10.3390/atmos11080857