Article

Using High-Density Rain Gauges to Validate the Accuracy of Satellite Precipitation Products over Complex Terrains

1
Key Laboratory of Agricultural Water Resource, Hebei Laboratory of Agricultural Water-Saving, Center for Agricultural Resources Research, Institute of Genetics and Developmental Biology, Chinese Academy of Sciences, Shijiazhuang 050021, China
2
Sino-Danish College, University of Chinses Academy of Sciences, Beijing 101400, China
3
Sino-Danish Center for Education and Research, Beijing 100190, China
4
Key Laboratory of Water Cycle and Related Land Surface Processes, Institute of Geographic Sciences and Natural Resources Research, Chinese Academy of Sciences, Beijing 100011, China
*
Author to whom correspondence should be addressed.
Atmosphere 2020, 11(6), 633; https://doi.org/10.3390/atmos11060633
Submission received: 13 April 2020 / Revised: 9 June 2020 / Accepted: 11 June 2020 / Published: 15 June 2020
(This article belongs to the Section Meteorology)

Abstract

:
Topography and precipitation intensity are important factors that affect the quality of satellite precipitation products (SPPs). A clear understanding of the accuracy performance of SPPs over complex terrains and its relationship with topography is valuable for further improvement of product algorithms. The objective of this study is to evaluate three SPPs—the Climate Prediction Center morphing method bias corrected product (CMORPH CRT), Global Precipitation Measurement Integrated MultisatellitE Retrievals (IMERG), and Tropical Rainfall Measuring Mission 3B42V7 (TRMM 3B42V7) against a high-density network of 104 rain gauges over the Taihang Mountains from 1 January 2016 to 31 December 2017, with special focus on the reliability of products’ performance at different elevation and precipitation intensity. The results show that three SPPs slightly overestimate daily precipitation, compared to rain gauge observations, with bias ratios (β) from 1.02 to 1.06 over the entire regions. In terms of accuracy, 3B42 slightly outperforms CRT and IMERG over the Taihang Mountains. As for different elevation ranges, three SPPs show better performance in terms of accuracy in low and moderate elevation (0–500 m) regions. Similar performances of precipitation detection capability can be found for three products over the whole areas, with detection scores ranging from 0.53 to 0.58. Better precipitation detecting performance of three SPPs was discovered in high-elevation (>1000 m) regions. We adopted a linear regression (LR) model and Locally Weighted Regression (LWR) model in an attempt to discover the linear/non-linear relationships between SPPs’ performances and topographic variations. In the accuracy statistical metrics, the errors of 3B42 and CRT showed significantly positive correlations (p < 0.01) with elevation variations. The critical success index for three products gradually increased with elevation variation based on the LR model. The correlation coefficient and probability of detection for three products showed significant non-linear trends in the LWR model. The probability distribution function for the three products in different elevation regions is similar to that over the entire regions. Three SPPs slightly overestimated the frequency of heavy rain events (6.9 < precipitation intensity (PI) ≤ 19.6 mm/d); CRT and 3B42 tended to underestimate the frequency of no rain events (PI < 0.1 mm/d), while IMERG generally overestimated the frequency of no rain events. Our results not only give a detailed assessment of mainly current SPPs over the Taihang Mountains, but also recommend that further improvement on retrieval algorithm is needed by considering topographical impacts for SPPs in the future.

1. Introduction

Precipitation is an important variable in global water and energy circulation systems [1,2], and accurate precipitation measurements have direct benefits for water resources related applications such as disaster prevention, agricultural water usage, water resource management, and weather prediction [3,4,5]. Currently, methods of measuring precipitation traditionally included ground-based rain gauges, weather radars, and remote sensing [6,7]. By far the most accurate ground-based measurement via its “point-scale” observations are often limited due to an insufficient number of gauges and sparse network in some remote regions such as less accessible mountainous and oceanic regions [8,9].
One alternative source for overcoming such a limitation in ground-based measurement using point scale is space-based assessment and observation of precipitation [10,11]. Satellite precipitation products (SPPs) are promising sources for estimating precipitation. With SPPs having been employed at regional and at near-global scales, they are quickly becoming important data resources in global hydrometeorological applications [3,12,13,14]. Continued improvement in temporal and spatial resolutions of satellite-based products has been achieved through recent updates in sensor and technology methods via the merging of various data sources such as radar data, thermal infrared data, active/passive microwave data, and information from the Global Telecommunication System [15,16].
Nevertheless, different surface cover types can generate different influences on the performances of SPPs. Over the ocean, passive microwave (PMW) sensors can largely distinguish a surface radiation signal and warm emission signal from liquid hydrometeors because microwave emissivity is low and highly polarized [5]. In contrast, many greatly variable surface-covered features such as soil moisture, roughness, vegetation properties, canopy, and snow cover will lead to higher variability of microwave emissivity over the land [17]. Consequently, the working quality of PMW precipitation estimation is significantly influenced by the spatial distribution and microphysical characteristics of precipitation [18]. For example, the spatial patterns of precipitation are typically characterized by short distances and occur within short time periods and high-intensity rainfall events over the mountainous areas, which lead to the rainfall underestimation by PMW algorithms [19]. In addition, some studies have reported that precipitation overestimation is possible because ice cover over the mountaintop is misclassified as rain clouds by PMW such as in central regions of America and east Africa [19,20].
Terrain complexity poses a challenge to accurate precipitation measurement by SPPs in the future. Bharti and Singh [21], who validated the TRMM 3B42V7 product against rain gauges over the northwest Himalayan region, found that the bias of precipitation estimation was strongly dependent on local climatic and topographical factors. Tong et al. [22] found that satellite products offer great potential for providing high-resolution precipitation information in remote regions, but more considerations should be made in terms of precipitation variability and terrain complexity. Recent research found a particular evaluation of quasi-global scale high-resolution satellite-based products (TRMM 3B42 and GPM IMERG) over the southern Tibetan Plateau based on a high-density rain gauge network [9]. The results demonstrated that the performances of satellite-derived precipitation were highly dependent on elevation and rainfall intensity. However, another standpoint was that a satellite product such as TRMM 3B42V6 depended more on precipitation intensity than on topography [23]. In the era of global climate change, an increased frequency of extreme events poses a threat to human populations and economic development in affected areas. Extreme precipitation events have frequently occurred across the world in recent decades. A significant positive trend in the frequency of extreme precipitation was observed in the United States, North China, Philippines, India, etc. [24,25,26,27]. In addition to global warming, precipitation extremes are also influenced by many other factors, such as topography as well as tropical cyclones [28,29]. SPPs are promising approaches for obtaining precipitation estimates. Further research is urgently needed into whether SPPs can accurately observe short and heavy precipitation or even extreme precipitation over complex terrains.
Around the world, current studies mainly focus on the evaluation and comparison the accuracy of SPPs on different timescales such as daily, monthly, seasonal, and annual precipitation over the mountainous regions. Little research has reported on the accuracy of SPPs in different elevation ranges and the relationship between SPPs’ accuracy and elevation variations. On the other hand, the short-term strong precipitation in complex terrains may lead to serious natural disasters such as flood, landslides and debris flow, etc., which pose serious threats to humans. Consequently, this work pays closer attention to explore the above issues so as to offer the results of an assessment that could be utilized to improve retrieval algorithms and the knowledge of local precipitation information to early warning of natural disasters. This study assesses the accuracy of three satellite-derived precipitation products, namely CMORPH CRT, TRMM 3B42V7 and newly released GPM IMERG (abbreviated as CRT, 3B42, and IMERG below, respectively) in different elevation regions based on a high-density and -quality network of rain gauges over the Taihang Mountains. The major objectives of this study include: (1) the general performances of three products in complex terrains; (2) the relationship between the performances of SPPs and elevation variation based on ordinary linear regression and non-linear regression models; and (3) the performances of three products in observing precipitation with different intensity over different elevation regions. Because variations in precipitation may be caused by changes in event frequency, changes in precipitation intensity for each event [5]. This study combines rain gauges and SPPs in situations of light-, medium-, heavy-, very heavy-, and extreme-precipitation in entire regions and in regions at different elevations.

2. Study Area and Datasets
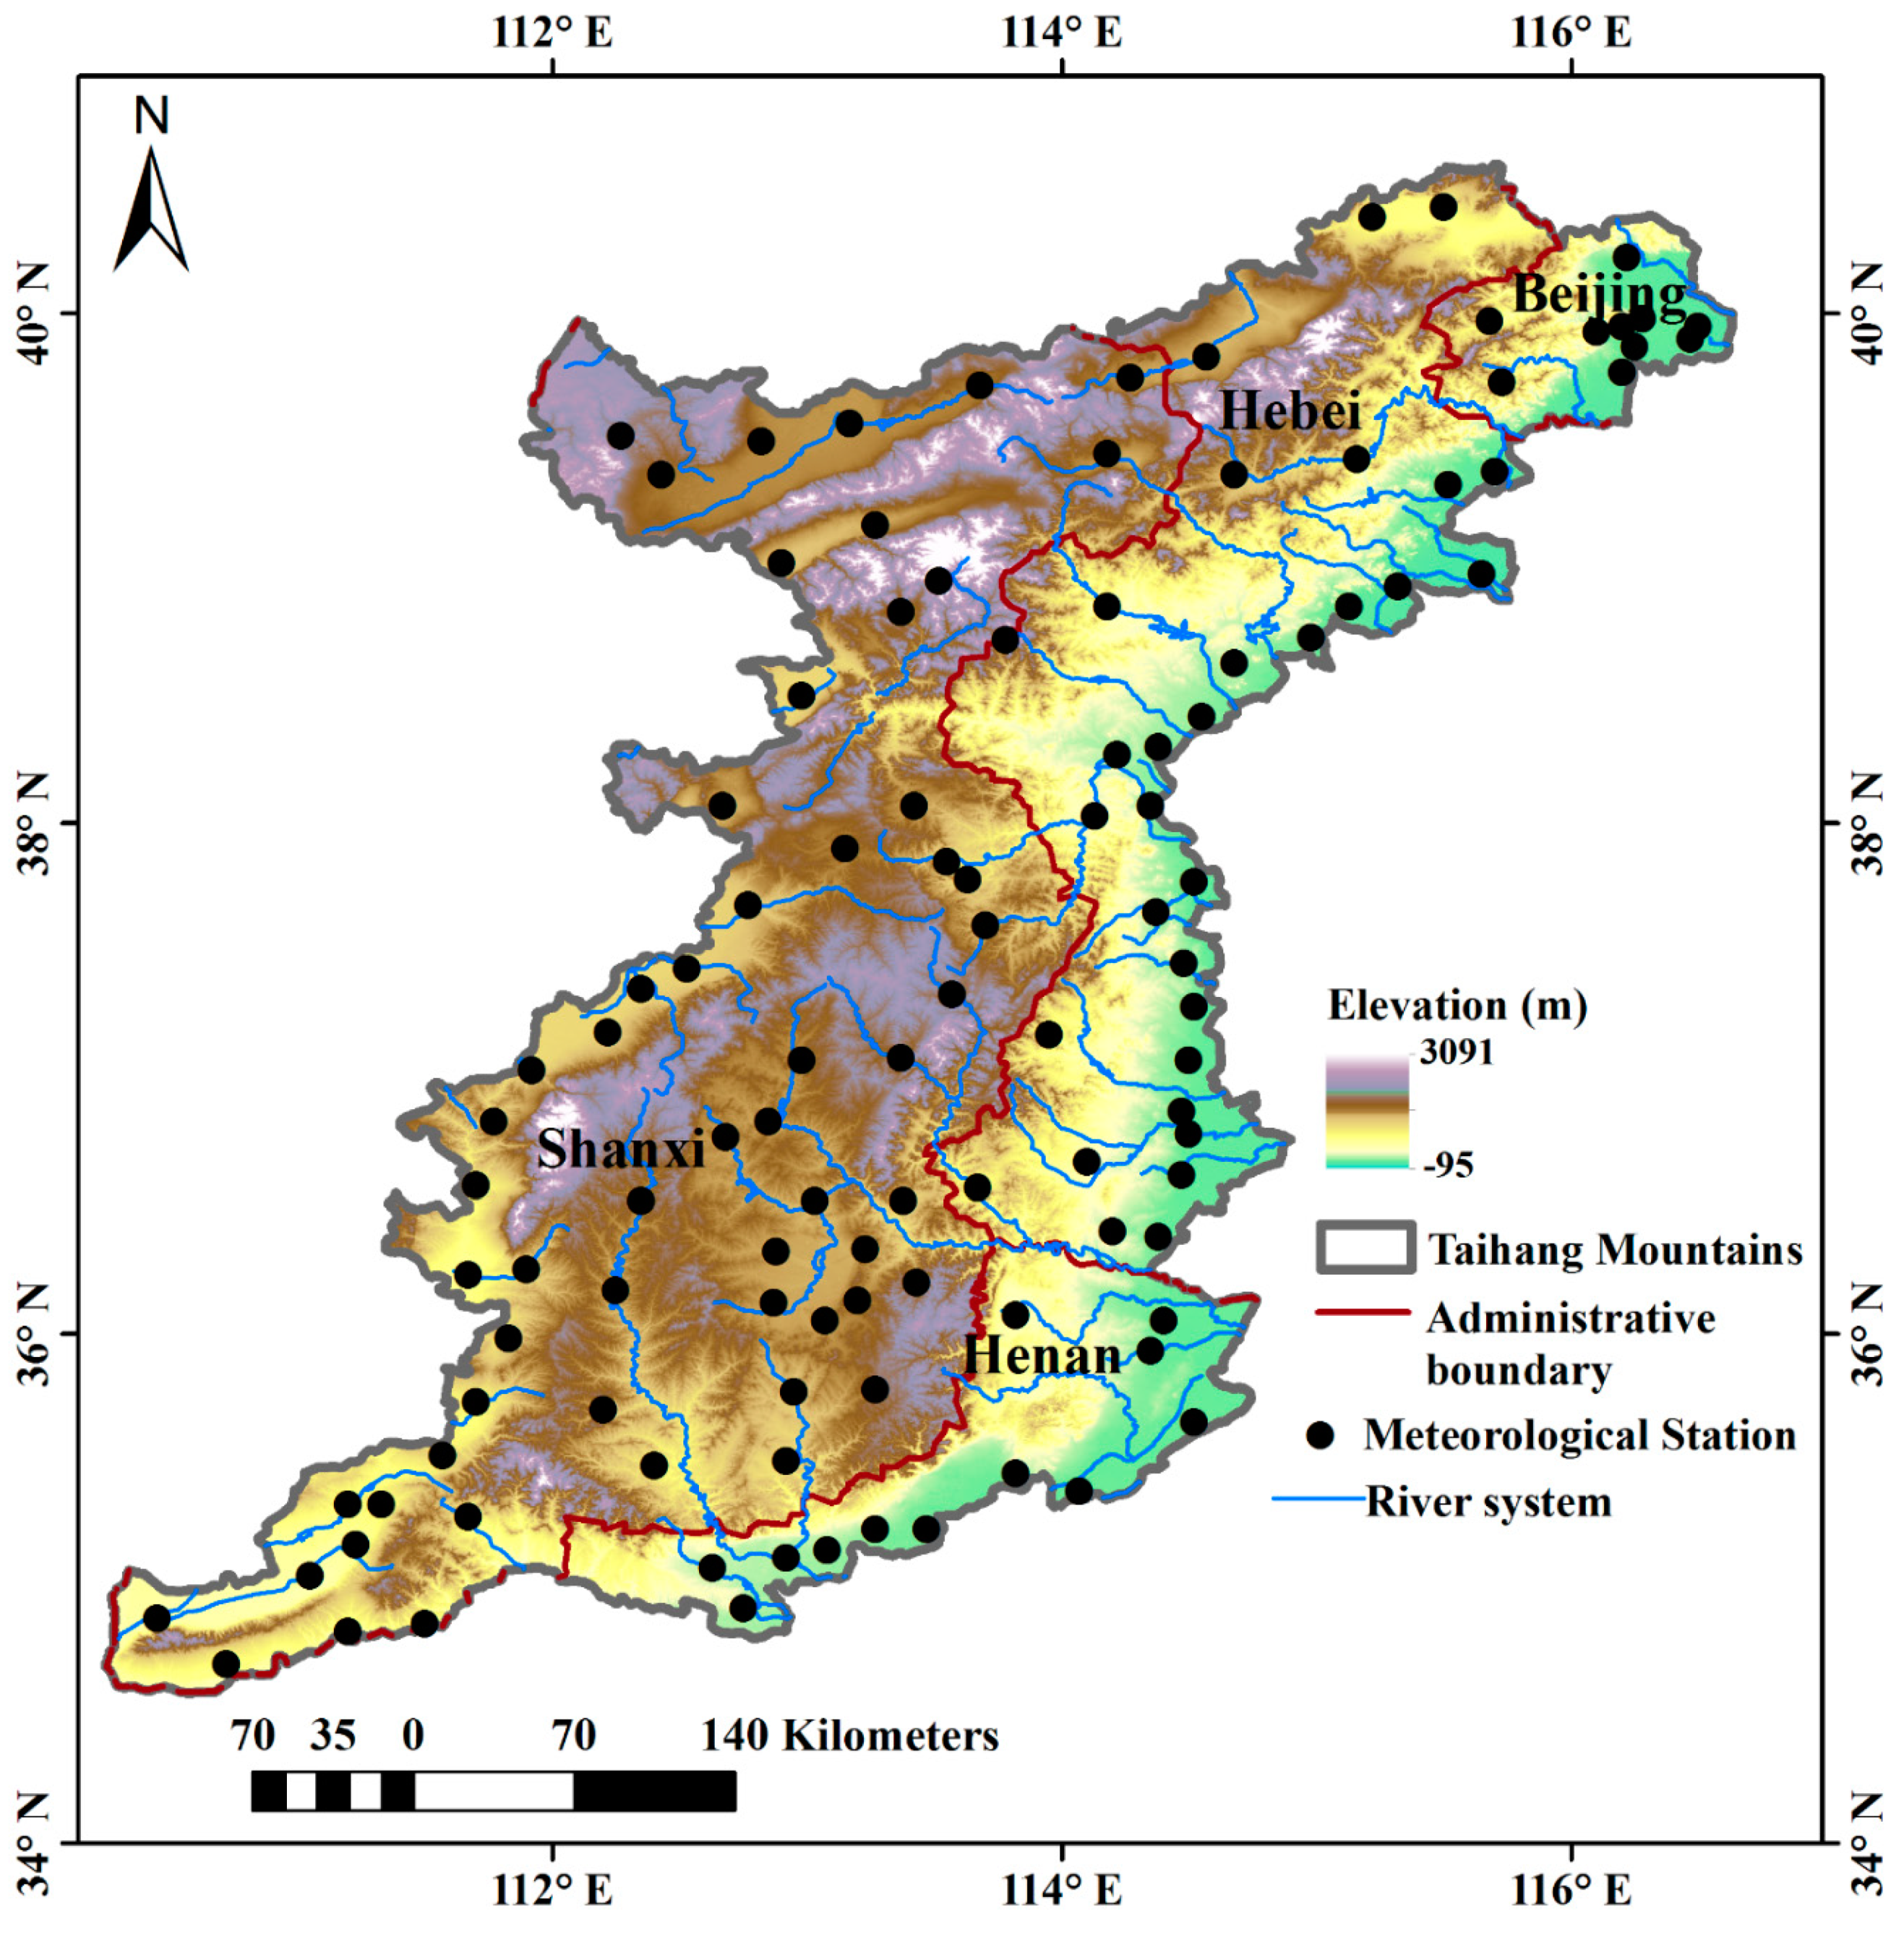
2.1. Study Area

The Taihang Mountains, the northeast range of a mountain belt in North China, extend across four provinces (Beijing, Hebei, Shanxi, and Henan) and 101 counties. These mountains are considerable transition zones between the Loess Plateau and the North China Plain [30]. The Taihang Mountains, located between 34°34′–40°43′ N and 110°14′–114°33′ E, are approximately 120,000 km2 in size. A terrain map is given in Figure 1. The average elevation in the study area ranges from −95 m to 3091 m and the relative difference in elevation over 3000 m (Figure 1). Low-altitude regions are concentrated to the east, bordering the North China Plain. High-altitude regions are concentrated in the northern and central parts of the Taihang Mountains, near the Loess Plateau.
This mountain area is exposed to moderate annual rainfall [30]. The annual average precipitation (2005–2014) was 456.57 mm and the annual mean temperature was 11.36 °C [30]. Both precipitation and temperature decrease from the southwest to the northeast [31]. The mid-latitude monsoon climate is characterized by being hot and wet in summers and cold and dry in winters [32]. Interactions between the mountain and the humid, moist weather pattern from the East Asian summer monsoon cause the differences in spatial distribution of rainfall [33,34]. Mesoscale topography mainly influences rainfall area and intensity via the disturbance of the dynamic field and moisture distribution [35]. The windward and leeward slopes of a mountain commonly have different natural environments since terrain can block the rise of warm and moist air, resulting in cooler temperatures and more frequent rainfall events in certain locations [36].

2.2. Rain Gauge Dataset

Rain gauge data comes from Hebei, Shanxi, and Henan meteorological bureaus of China. Ground-based rain gauge data from 1 January 2016 to 31 December 2017 were adopted as the verified information to examine the SPPs performance in the corresponding period over the Taihang Mountains. Strict quality check and control procedures, including (i) eliminating outliers, (ii) examining internal consistency, and (iii) examining spatial consistency were developed by Shen and Xiong to ensure the high quality of the rain gauge data [37]. Moreover, the rain gauge network used here is independent of the GPCC networks. It is worth mentioning that the density of rain gauge network is about 8.7/10,000 km2 (a gauge within 0.0375° grid), which is higher than other similar studies in other mountainous regions such as the Tibetan Plateau, Ethiopia as well as the main mountains of China [1,9,19]. The type of rain gauge is the automatic tipping bucket rainfall station. Because some products in the study were provided only on an hourly basis, or a three-hourly basis, the daily precipitation is the accumulated rainfall over 24 h starting at 08:00 am (Beijing time), equivalent to 00:00 Coordinated Universal Time (UTC), allowing daily rainfall values from the rain gauge stations to be directly compatible with the SPPs since SPPs also measure daily rainfall at 00:00 UTC. Recognizing that time resolution has a critical role in evaluating a precipitation product’s performance, the SPPs in this study are considered on a daily scale.

2.3. Satellite-Based Datasets

The suitable SPPs were found in this study can be utilized in the future for weather forecast and hydrological modelling in selected regions. Therefore, three of the most state-of-the-art SPPs with relatively high spatial resolution are compared against rain gauges. All of these SPPs are widely-used all over the world, and thus, offer abundant research results to compare with this work. A brief introduction of each SPP is provided in the next paragraphs, which include the development institutions, algorithms, version information, satellite sensors, etc.

2.3.1. CMORPH CRT

The CMORPH dataset, provided by the National Oceanic and Atmospheric Administration (NOAA), is the global precipitation product with fine temporal and spatial resolution (Table 1). This product integrates multiple PMW information from low Earth-orbiting satellites and Infrared Radiation (IR) sensors from the geostationary platforms [38]. This technique uses precipitation estimations that have been exclusively derived from low orbiting satellite microwave observations, whose features are transported via the spatial propagation of information obtained entirely from geostationary satellite IR data [38]. Since 1998, CMORPH V1.0 has provided the near-real-time and bias-corrected products named CMORPH-RAW and CMORPH-CRT, respectively. The CMORPH CRT product with a temporal/spatial resolution of 0.5 h/8 km was used in this study. The Uniform Resource Locators (URLs) of CMORPH CRT dataset is: ftp://ftp.cpc.ncep.noaa.gov.

2.3.2. TRMM 3B42V7

The Tropical Rainfall Measuring Mission (TRMM) for monitoring precipitation in tropical and subtropical zones was developed in collaboration with the United States National Aeronautics and Space Administration (NASA) and Japan Aerospace Exploration Agency (JAXA) (Table 1). The TRMM satellite was decommissioned in April 2015 and re-entered Earth’s atmosphere and was destroyed later in the year. The satellite was equipped with the TRMM microwave imager (TMI), precipitation radar (PR), visible and infrared sensor (VIRS), lightning imaging sensor (LIS), and Clouds and the Earth’s Radiant Energy System (CERES). Among equipment sensors carried by the TRMM satellite, PR was a groundbreaking development that provides a three-dimensional structure of rainstorms beneficial to detection precision [39,40].
The TRMM Multi-satellite Precipitation Analysis (TMPA) is one of the TRMM products designed to combine precipitation measurement from various satellite systems and rain gauges [39,40]. The latest TMPA version 7 consists of two main products, which include three-hourly combined microwave-IR estimates (3B42) and monthly combined microwave-IR-gauge (3B43) products at 0.25° spatial resolution. According to the introduction of NASA web page, this 3B42 V7 is no longer produced after 31 December 2019. The 3B42 product is further divided into near real-time (3B42RT) and gauge-adjusted research (3B42) products. This study adopted the 3B42 product with a spatial/temporal resolution of 0.25°/3 h. The URLs of TRMM 3B42V7 dataset is https://daac.gsfc.nasa.gov/datasets?keywords=TRMM_3B42_7&page=1.

2.3.3. GPM IMERG

TRMM’s follow-up satellite precipitation program, the Global Precipitation Measurement (GPM) project, a collaboration between NASA and JAXA, initiated precipitation observations in 2014 (Table 1). GPM brings advanced precipitation measurements from research and operational sensors from the partner satellite to provide next-generation global precipitation data products. GPM satellites provide global precipitation data products within 3 h and 0.5 h, based on microwave and microwave infrared data, respectively, and they extended the scope of observations to the north and south polar regions. Of the GPM satellite’s two main sensors, the GPM microwave imager (GMI) was utilized to measure the intensity, type and size of the precipitation, and the dual-frequency precipitation radar (DPR) was applied to observe the inner structure of storms [41,42]. The three versions of daily IMERG products are IMERG Day 1 Early Run, with a near real-time with real-time delay of 6 h; IMERG Day 1 Late Run, with a reprocessed near real-time delay of 18 h; and IMERG Day 1 Final Run, with a gauge-adjusted four-month latency. In this study, IMERG Day 1 Final Run daily products were chosen as the data was obtainable beginning 12 March 2014. The URLs of GPM IMERG dataset is https://pmm.nasa.gov/precipitation-measurement-missions.

3. Methodology

3.1. Methodology for Data Comparison

Following Zambrano-Bigiaini et al. [11] and Sharifi et al. [5], we adopted the point-to-pixel analysis method to allow the series data observed by the rain gauge to be compared with the corresponding SPPs pixel for each gauge over the entire regions. Only the pixel where there is at least one ground-based rain gauge was selected for calculation. Comparison was directly between rain gauges and pixels when the stations were within the pixels. In cases where ground-based rain gauge approached the edge between two pixels to the corner of four pixels (<0.01° off the edge), the average value of two or four pixels around the rain gauge is utilized as the basis for comparison. For a pixel with two or more rain gauges, the average area precipitation is taken as the arithmetic mean of all rain gauges within that pixel.

3.2. Classification of Elevation Group and Precipitation Intensity (PI)

All rain gauges in this region was divided into elevation categories based on topographic areas corresponding to different elevations. The categories are (i) 0–100 m for plain, (ii) 100–500 m for hill, (iii) 500–1000 m for mountainous region, and (iv) >1000 m for plateau. As previous studies have suggested that during wet days, an extreme event can be taken as one with precipitation exceeding the 98th percentile of daily precipitation value [43]. The percentile method was utilized to determine differences in precipitation intensity. Therefore, we adopted percentile-based values to explore SPPs performance at varied precipitation intensity. The 50th, 70th, 90th, and 98th percentiles of rain gauge data correspond respectively to light, moderate, heavy, very heavy, and extreme precipitation thresholds for daily precipitation. Similar classifications of precipitation intensities were also used in Sharifi et al. [5].

3.3. Statistical Analysis

The study’s extensive evaluation of eight statistical metrics to quantify products’ accuracy was given in Table 2. The correlation coefficient (CC) was used to depict the linear correlation level between satellite data and gauge observations. The bias ratio (β) was adopted to describe the underestimation (β < 1) or overestimation (β > 1) of SPPs against observed counterparts. The variability ratio (γ) illustrates that the degree of dispersion satellite data is higher or lower as compared to ground observations. The modified Kling-Gupta efficiency (KGE’), a relatively new index that integrates statistics consisting of CC, β, and γ [44], can comprehensively show SPPs’ performance accuracy. Another important index describing errors is the root mean square error (RMSE). Contingency table indexes include the probability of detection (POD), the false alarm ratio (FAR), and the critical success index (CSI), which are used to describe the consistency between estimated and observed rain events. Because the minimum observation of rain gauge is 0.1 mm, we regarded 0.1 mm/d as rain/no rain threshold [45].
To find out the overall characteristics of precipitation, the precipitation frequencies with different intensities are as important as knowing the mean and spatial/temporal variation patterns of precipitation [46,47]. Even though the same amount of precipitation in the form of long-lasting light rain or a short duration and heavy storm, it is likely to yield different results in natural hazards, e.g., flood and landslide [37,48]. In this regard, a Probability Distribution Function (PDF) can provide detailed information about the frequency of rainfall with different intensities [49].

3.4. Regression Models

In this study, we adopted two regression models to explore the relationship between performances of SPPs and elevation variations. Linear regression (LR) is a common and classical parametric method to find out the relations between one or more independent variables via the least squares function.
Additionally, we introduced another regression model called Locally Weighted Regression (LWR) [50], which was a non-parametric method. Each time a new sample was predicted, the adjacent data would be retrained to obtain the new parameter value. The data to be predicted were only related to the distance to training data. The closer the distance, the larger the correlation, and vice versa. In this way, we would be able to effectively avoid the interference of under-fitting and far-reaching data. The prediction step of LWR is:
(1)
Find the minimum value of i w ( i ) ( y i θ T ( x ( i ) ) ) 2 via fitting θ ;
(2)
The predicted value is θ T x
y i is the dependent variable, ? ? T is not a fixed parameter of model, and it varies with each data training. w ( i ) is a weight, not a fixed value; we can adjust the value of w ( i ) to determine the impact of different training data on the modelling results, and the w ( i ) formula is as follow:
w ( i ) = exp ( ( x ( i ) x ) 2 2 τ 2 )
In the above formula, x is the sample data of the new prediction, which is a vector, and τ controls the rate of weight change.
Meanwhile, the characteristic of w ( i ) is:
If   | x ( i ) x | 0 ,   then   w ( i )   1 ;
If   | x ( i ) x | + ,   then   w ( i )   0 .
It can be seen that for the point closer to the predicted sample data x , the weight is larger and the point is farther than the predicted sample data x .

4. Results

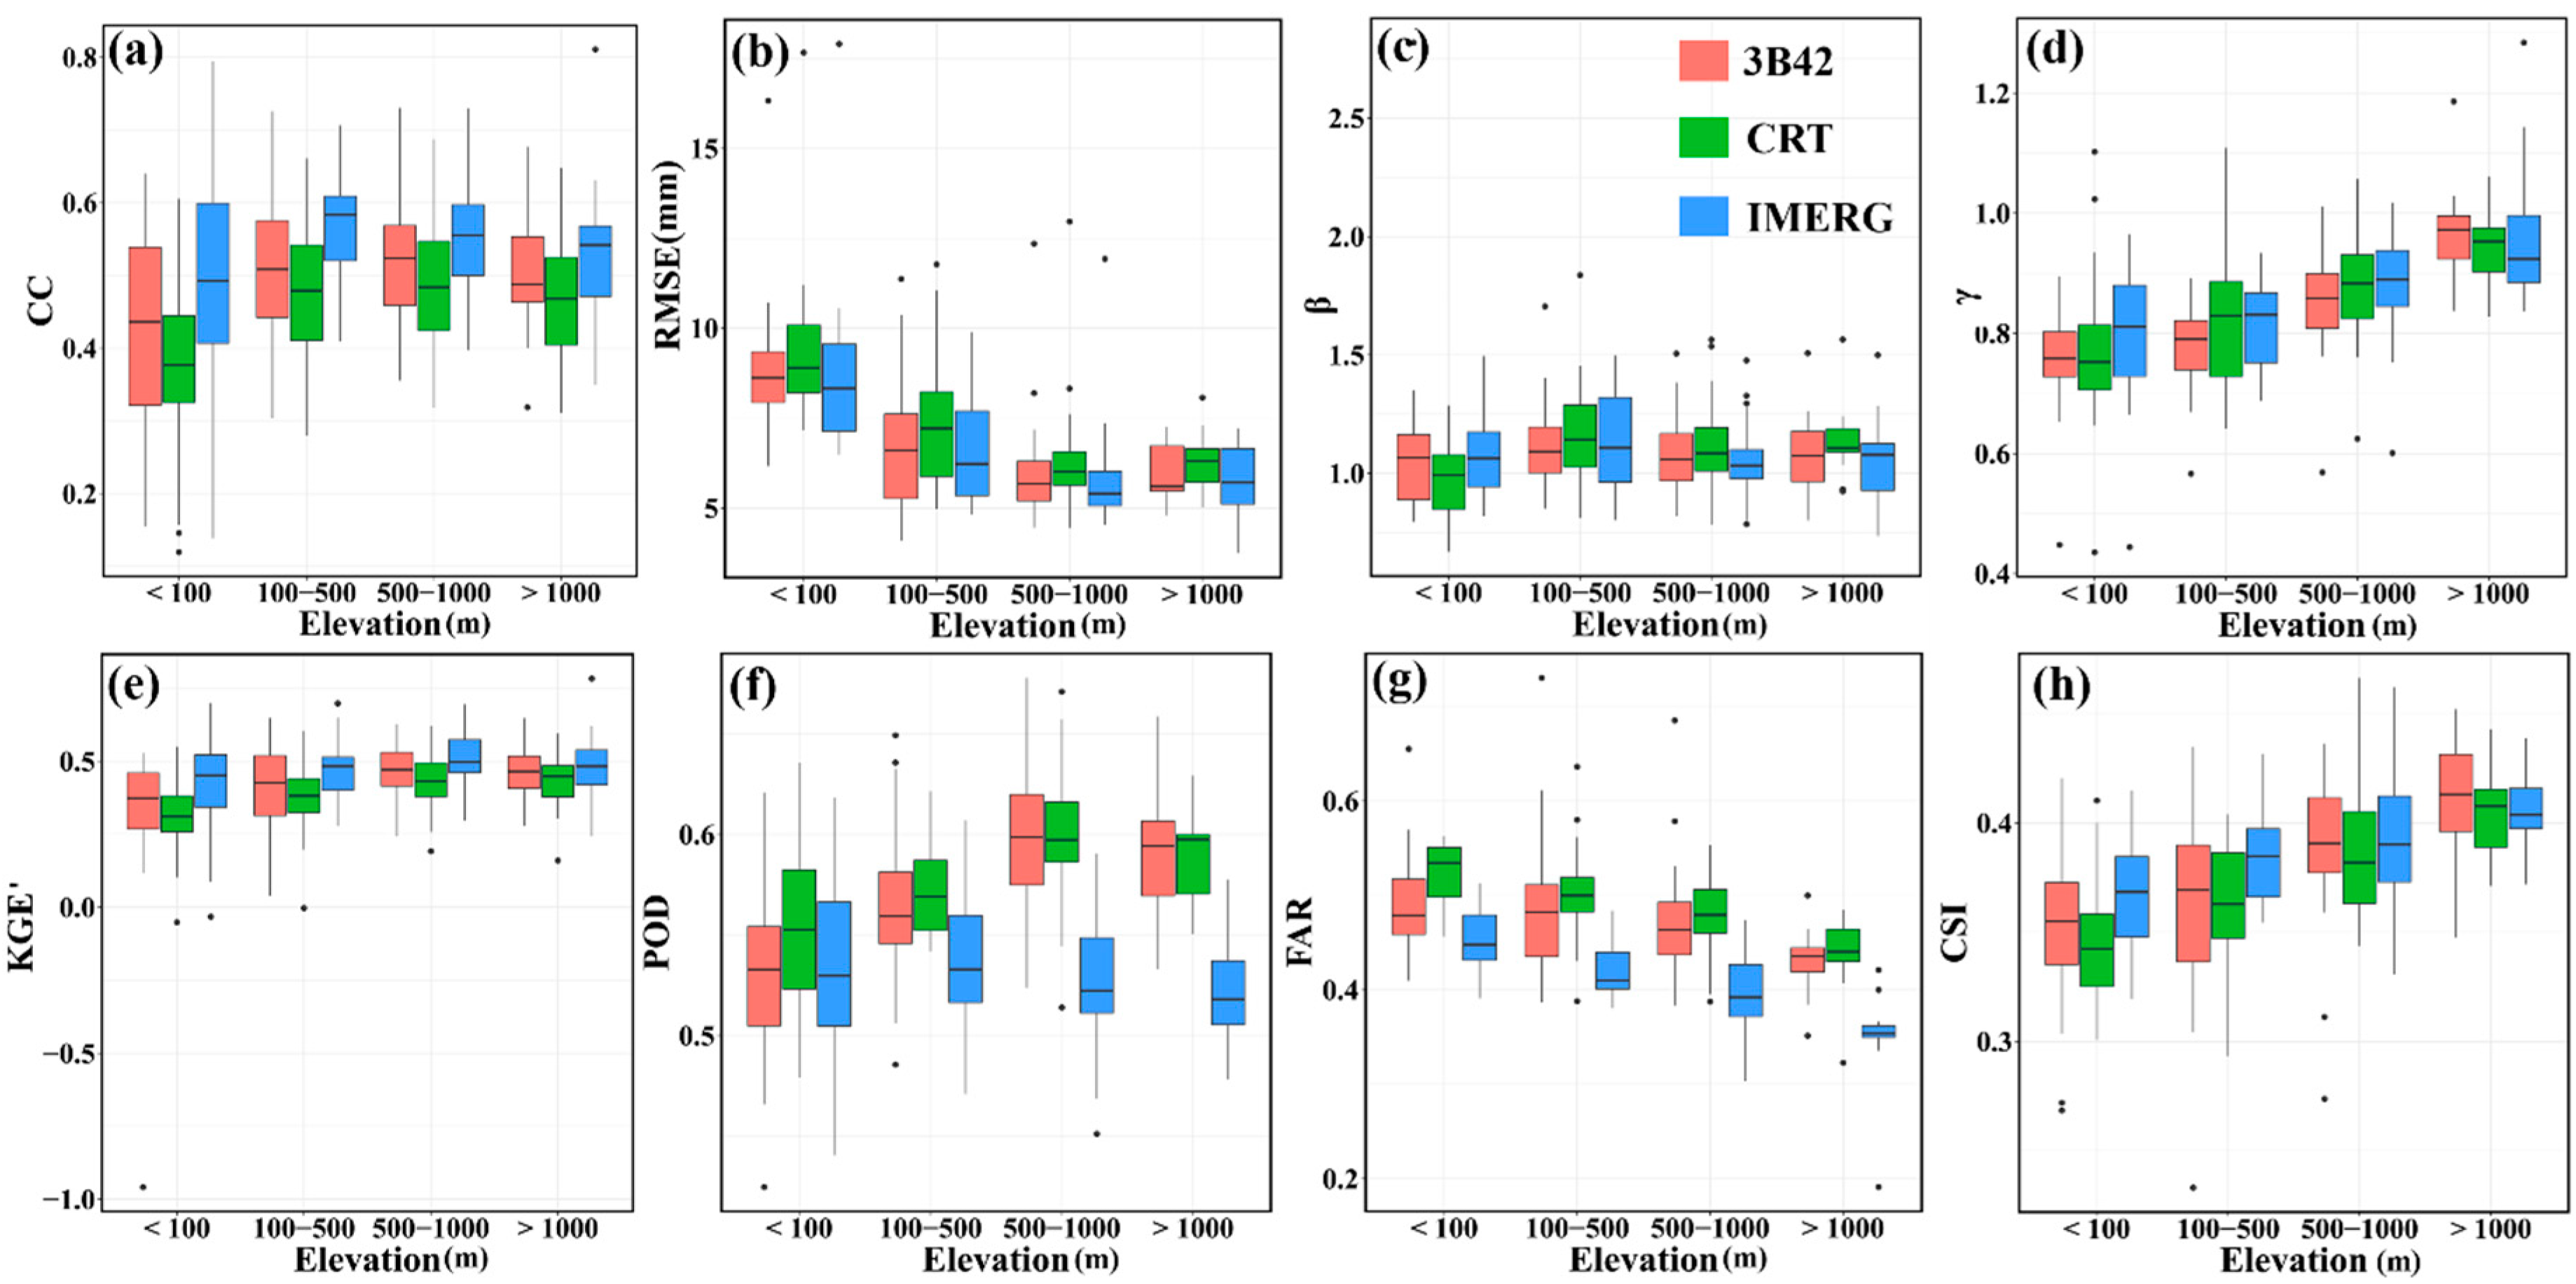
4.1. Overall Performance in Different Elevation Regions

For daily precipitation, the performance of the three SPPs can be evaluated in terms of a ground-based dataset in different elevation categories. Table 3 shows the inter-comparison of daily precipitation from all rain gauges and three SPPs at the corresponding grids collocated with rain gauges. Three SPPs provide overall larger daily precipitation estimates than rain gauges, with the β values ranging from 1.02 to 1.06 over the entire regions. The consistencies between the two satellite products (IMERG and 3B42) and rain gauges are comparable, with a slight favor for IMERG. However, CRT shows a poor correlation with rain gauges, with a CC value of 0.26.
To explore the performance of SPPs in different elevation ranges, we divided all rain gauges into different categories according to their altitudes. The mean gauge precipitation of the entire region is 1.63 mm/d. In each elevation group, the lowest precipitation was found in the medium elevation (100–500 m) regions with value of 1.59 mm/d, and the highest precipitation in the low elevation (<100 m) regions with value of 1.68 mm/d (Table 3). The highest consistencies of the three SPPs achieved in the 100–500 m regions, with CC values ranging from 0.46 to 0.57. β of IMERG and 3B42 do not differ much across different elevation categories; they show a nearly unbiased tendency in different elevation groups with the exception of 100–500 m elevation regions. However, CRT shows a relatively larger overestimation in comparison with IMERG and 3B42 in moderate (100–500 m) and high elevation (>1000 m) areas (Table 3). γ of three SPPs generally increase with elevation, indicating serious underestimation of the variability of precipitation at low elevation regions. For all elevation categories, RMSE values are lower for IMERG and 3B42 than for CRT (Table 3), and IMERG and 3B42 show approximately similar RMSE values over the Taihang Mountains. KGE’ summarizes the three previous evaluation metrics (CC, β, γ) into one. Three SPPs present a moderate overall performance in all elevation ranges, with KGE’ value range from 0.31 to 0.54. Table 4 shows error metrics of categorical validation statistics for CRT, IMERG, and 3B42 data on a daily scale at whole and different elevation regions. The error metrics of three SPPs over different elevation ranges is similar to that over the entire region. POD values of CRT and 3B42 generally increase with elevation, while those of IMERG decrease with elevation. FAR values of three SPPs decrease with the rise of elevation, and CSI show an increasing trend with elevation. Table 3 shows the evaluation metrics calculated between CRT, IMERG, 3B42, and rain gauge data over the whole region and for different elevation ranges.
Figure 2 shows the box plot of grid-scale statistics for CRT, IMERG, and 3B42 over the Taihang Mountains. For each box, the central mark is the median, and the edges of the box are the 25th and 75th percentiles. In terms of CC, three products show similar magnitude at different elevation groups with lower values in the low elevation (<100 m) regions. In terms of RMSE, IMERG shows better performance than 3B42 and CRT. Meanwhile, RMSE of three products decrease with elevation variation (Figure 2b). With respect to β, three products slightly overestimate precipitation for each elevation group, but precipitation variabilities are underestimated by three products in all elevation categories (Figure 2d). Better performances are found in high-elevation regions (>1000 m). As indicated by Figure 2e, three SPPs show relatively poorer performance in low elevation (0–100 m) regions. IMERG shows a slightly higher median KGE’ value among the three SPPs in the four elevation categories. The precipitation detecting performance was evaluated in terms of categorical scores, i.e., the capability in detecting rain and non-rain events over different elevation regions. Figure 2f,g illustrate that 3B42 and CRT have higher POD (higher probability of correctly detecting rain events), while IMERG shows lower FAR (lower probability of falsely identifying rain events) in 500–1000 m elevation regions, thus resulting in higher CSI (CSI provides an integrated measure of categorical scores) values in relatively high-elevation (i.e., 500–1000 m) regions (Figure 2h).

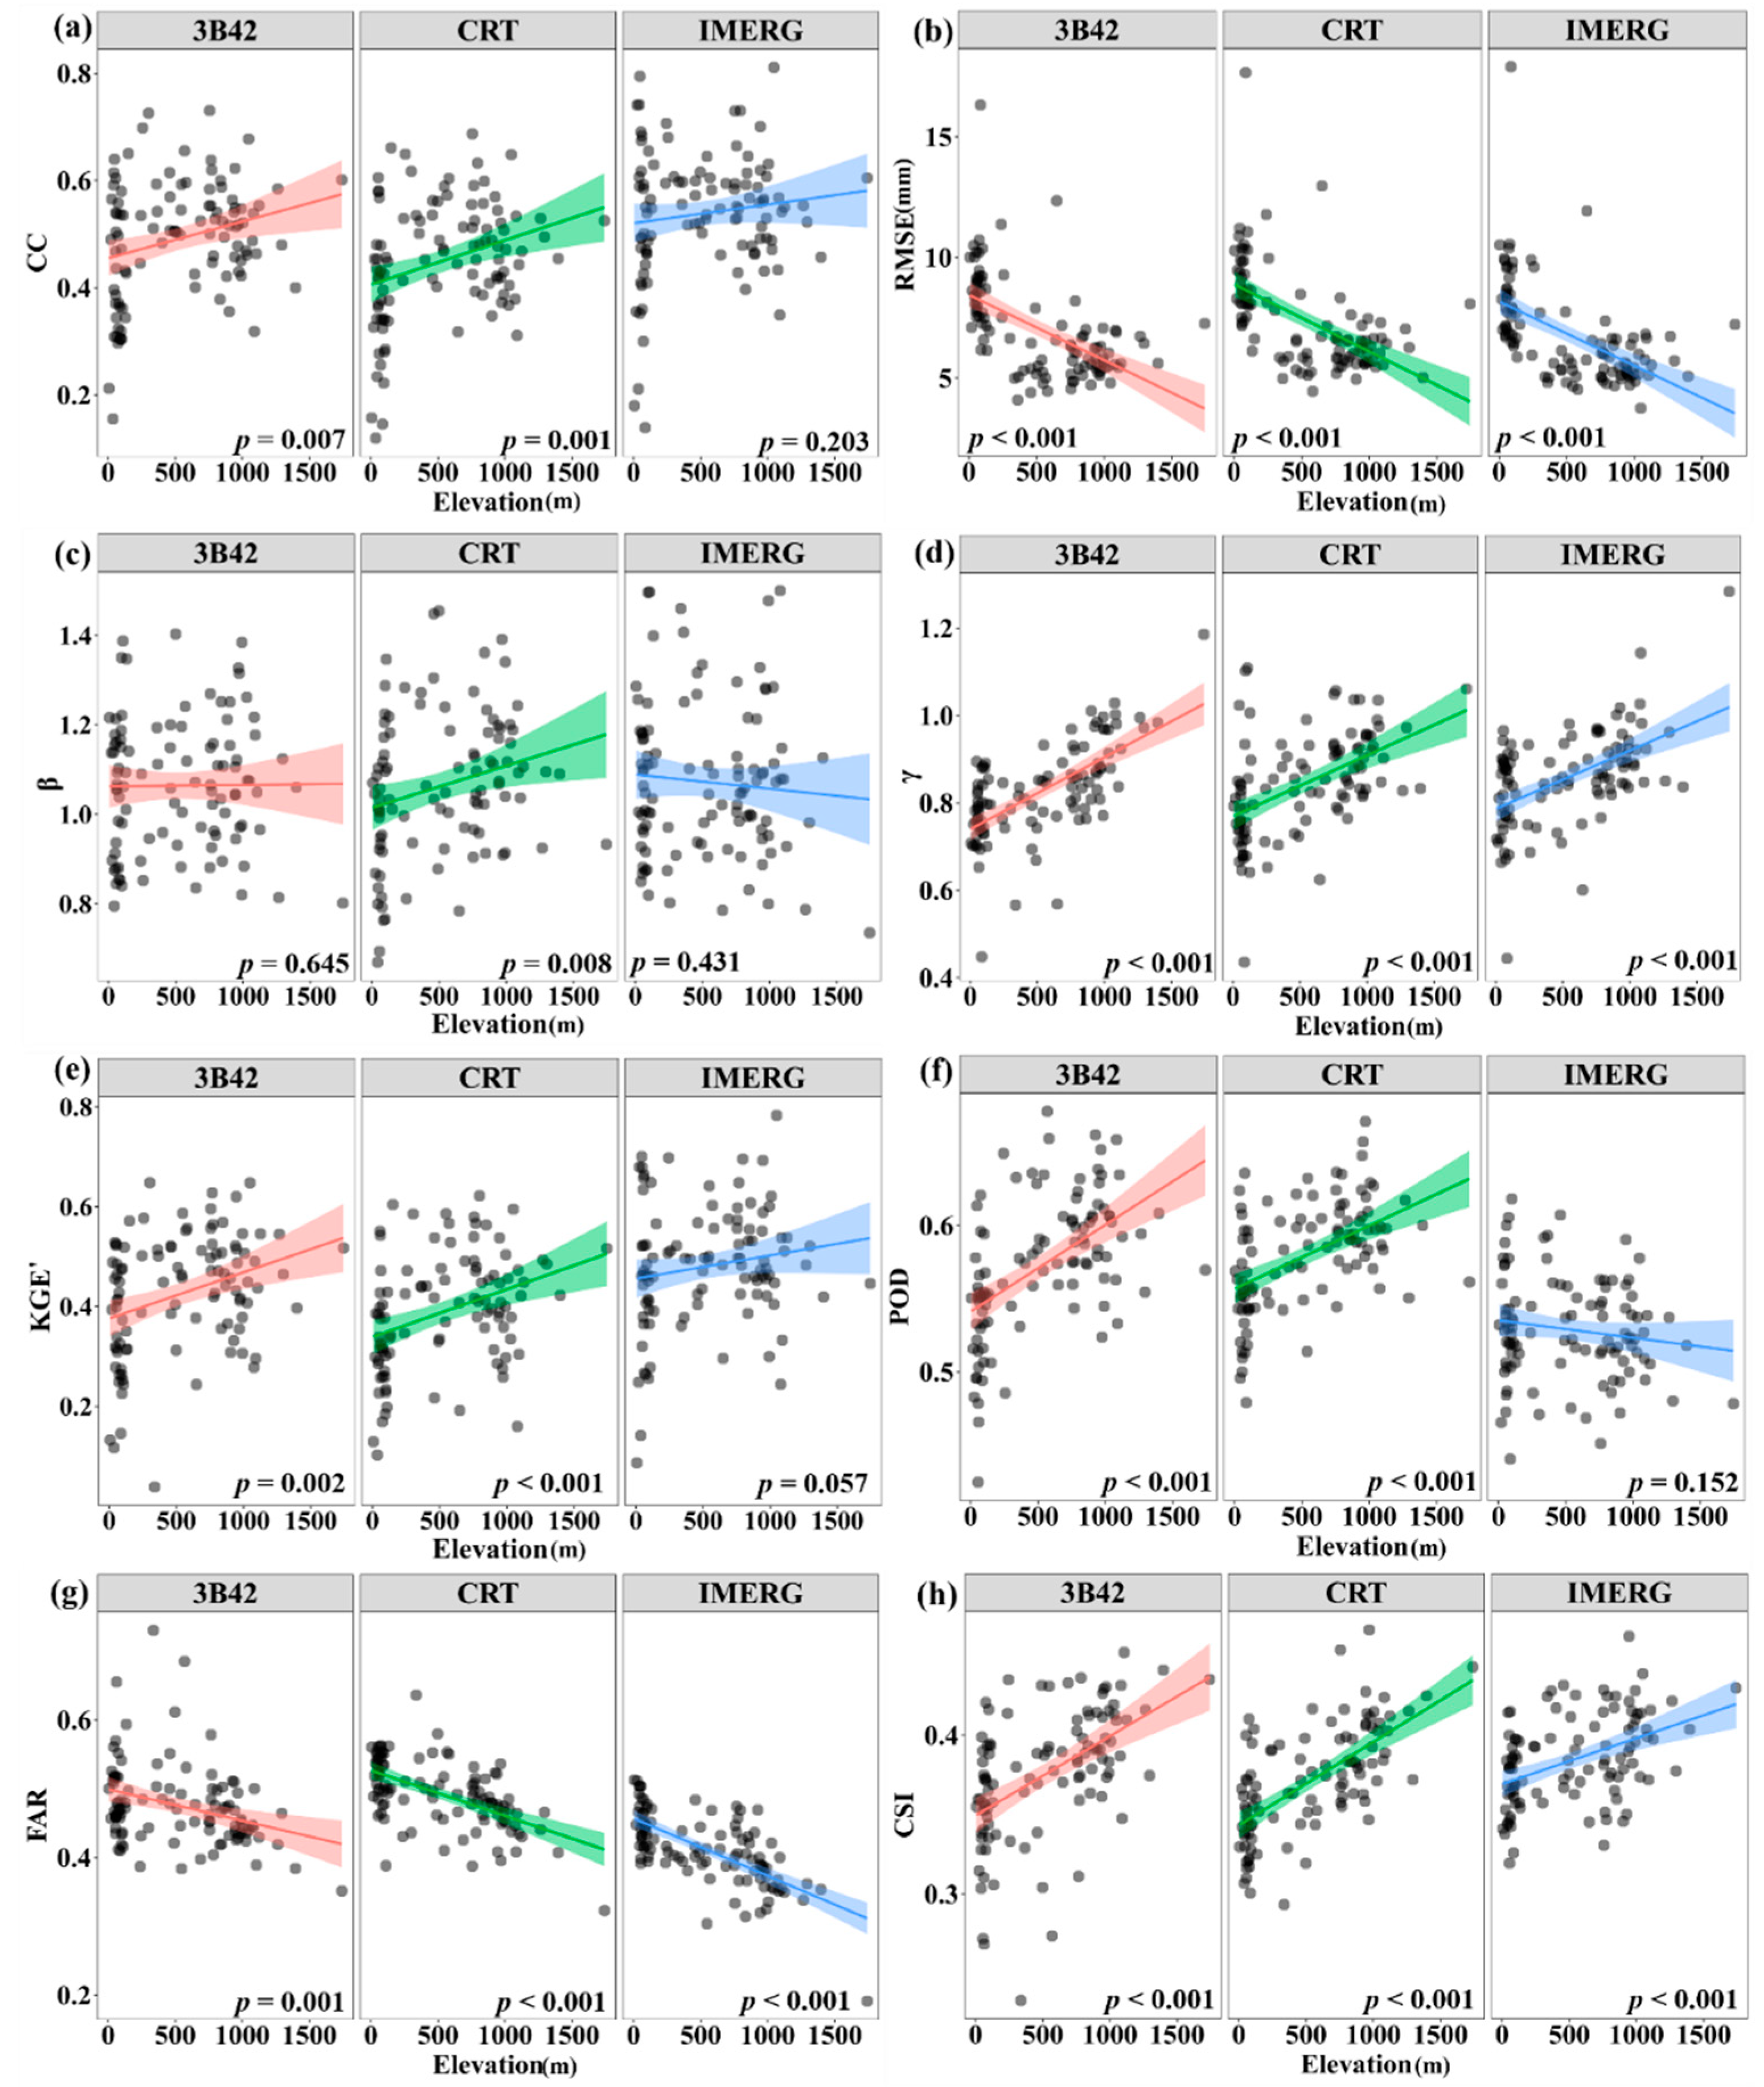
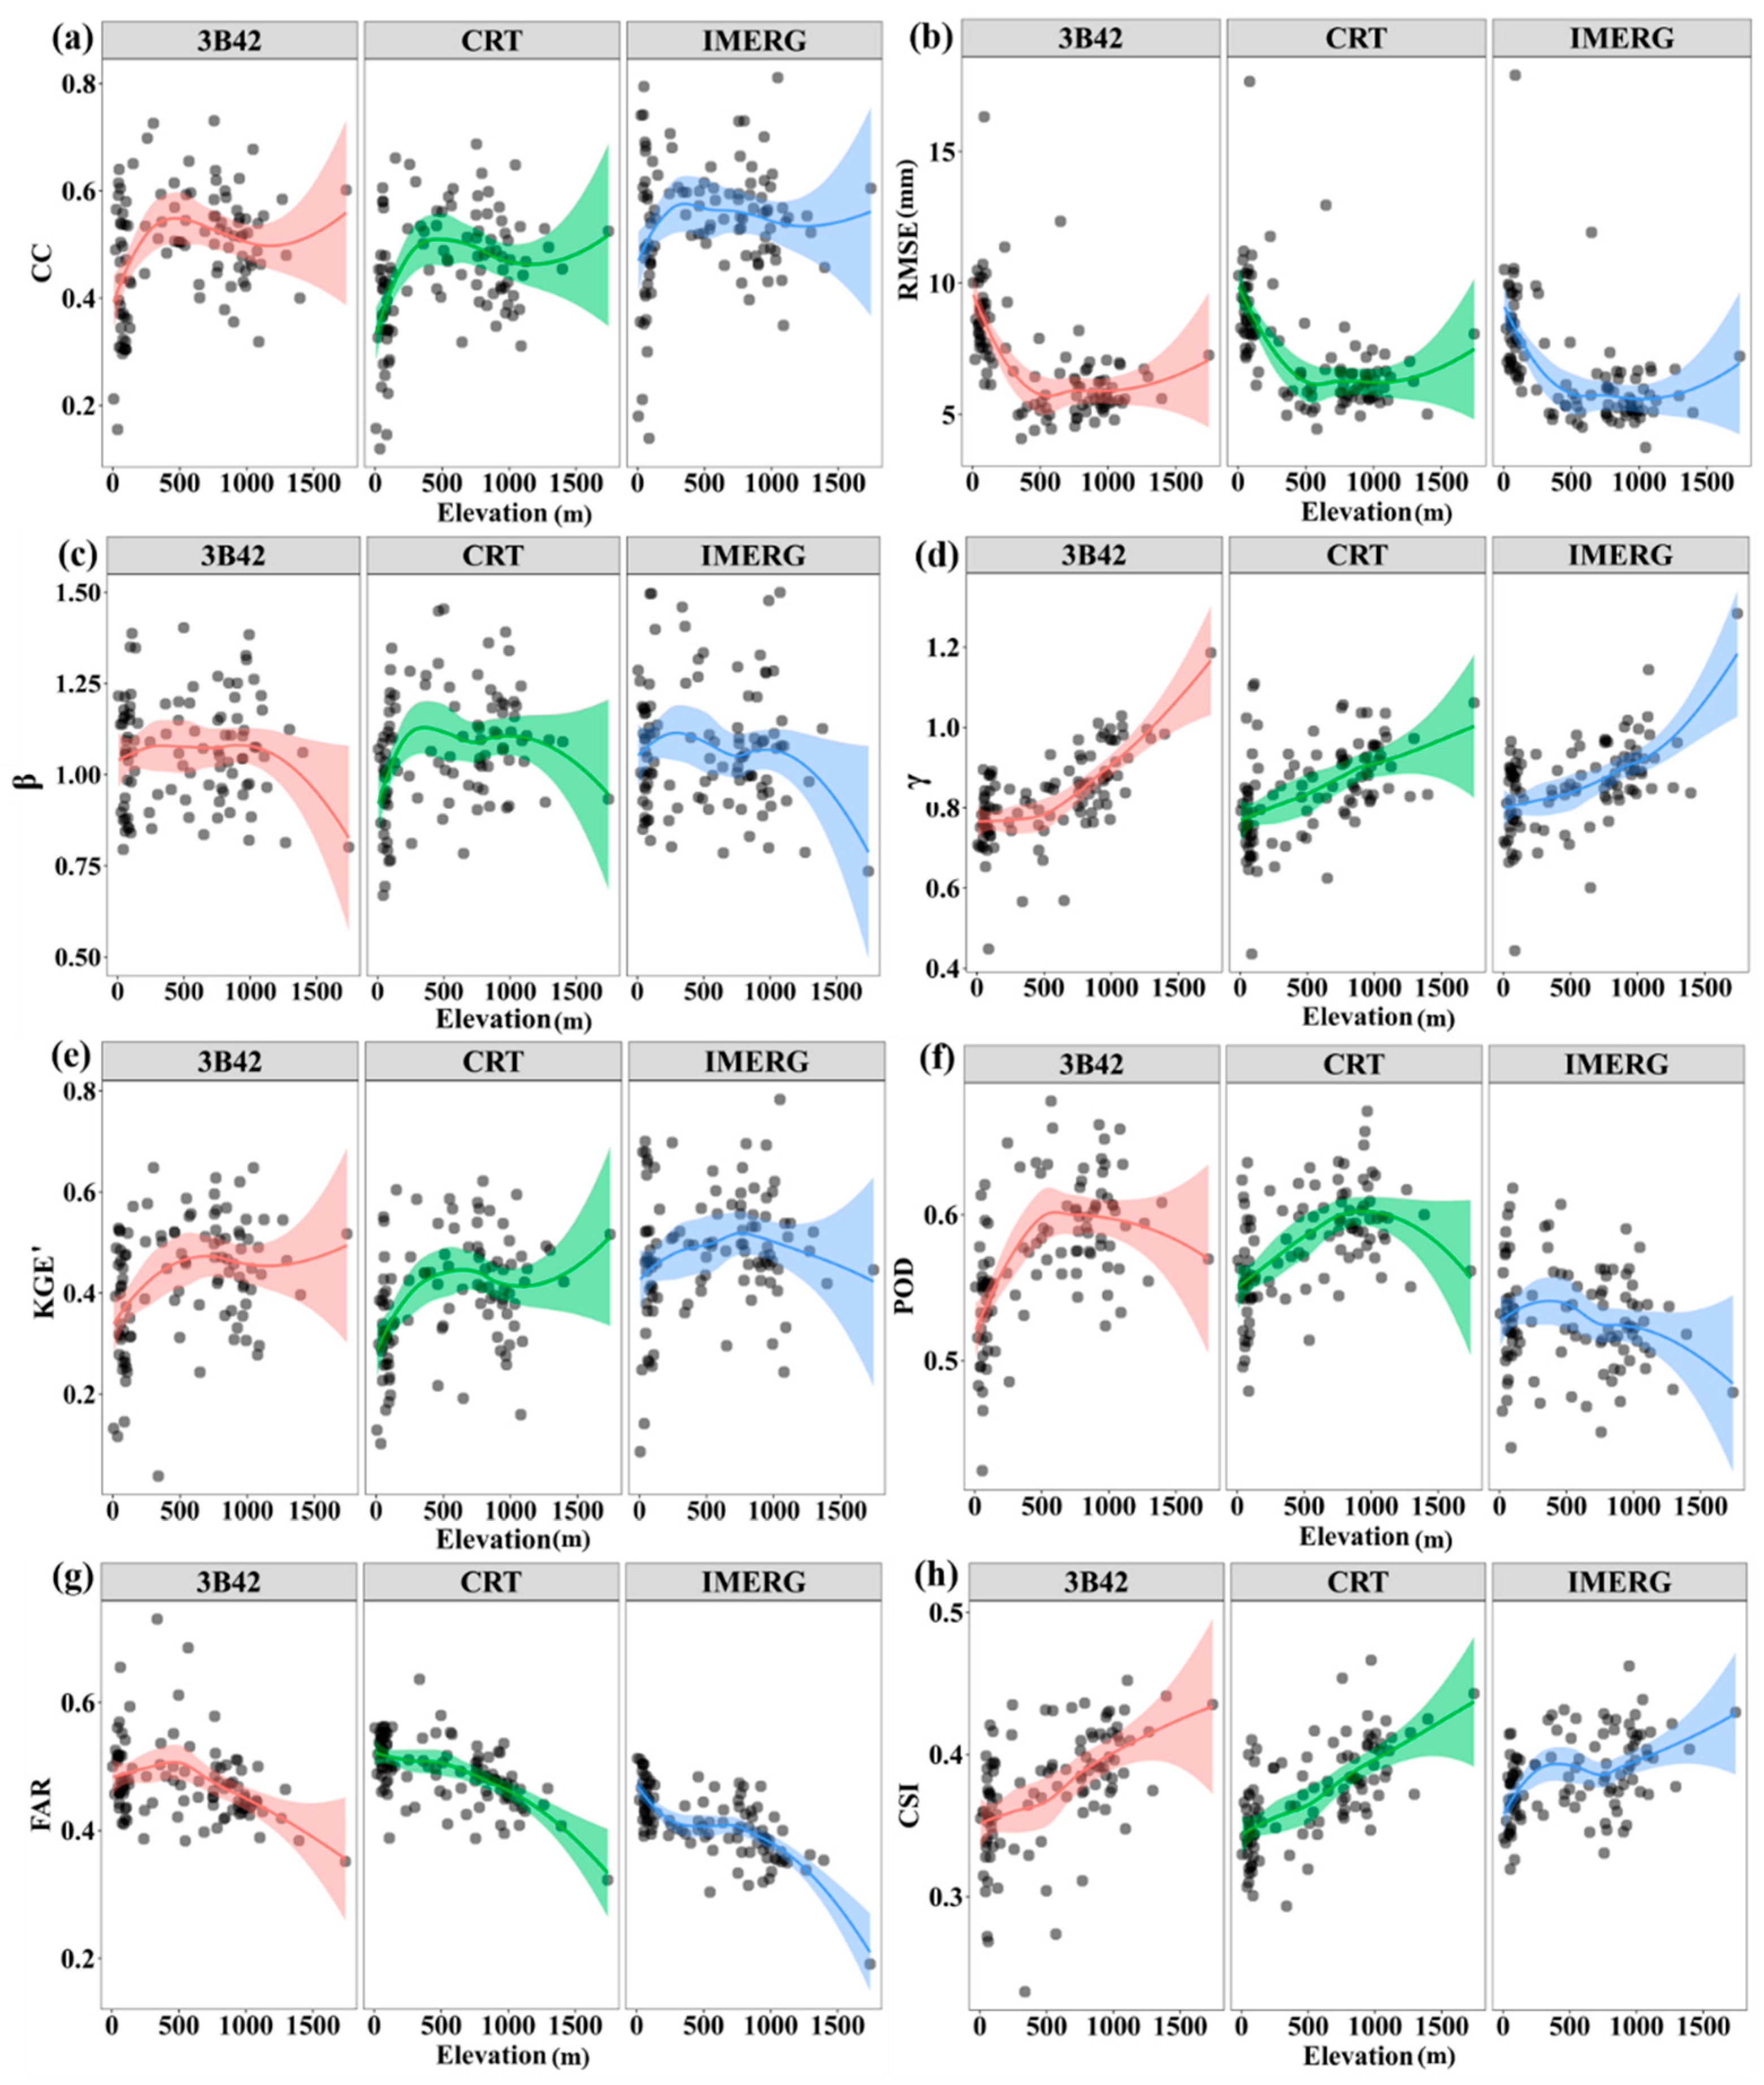
4.2. Reliability of the Performance of SPPs on Elevation

The result of further observation of the reliability of SPPs based on the linear regression model at different elevations was displayed in Figure 3. With elevation, 3B42 and CRT show an increased CC (statistically significant trend at a confidence level of 99%, p < 0.01); IMERG also poses increased CC values with elevation, but neither is statistically significant (Figure 3a). It is noteworthy that all the SPPs show decreased RMSE values (p < 0.001) with elevation (Figure 3b). The β values of three SPPs expect for CRT fail to show significant correlation with elevation (Figure 3c). However, the γ values of 3B42 and IMERG increase (p < 0.001) with elevation (Figure 3d). Categorical validation statistics for each gauge against its elevation are shown in Figure 3f–h. POD values show similar trend for both 3B42 and CRT, a significantly increasing trend with greater elevation, while the decreasing trend of that of IMERG with elevation suggests the GPM product’s non-improvement in POD over high elevation regions. CSI shows significantly increasing trend with elevation for three SPPs (p < 0.001), and the slope of trend line for CSI is slightly larger for 3B42 and CRT than for IMERG. All in all, three SPPs show better precipitation detection performance in higher elevation regions, mainly owing to lower FAR in such areas.
Although many evaluation statistical metrics including CC, RMSE, γ, POD, FAR, and CSI show significant linear correlations with elevation, the common weakness of linear regression is under-fitting and over-fitting, which make the model fail to achieve the best prediction effects. Therefore, Locally Weighted Regression (LWR) is considered to explore the non-linear (non-parameter) relations between the performance of SPPs and elevation. Figure 4 shows the relationships between all evaluation indices and elevation for 3B42, CRT, and IMERG. Results for LWR are roughly similar to those for linear regression for γ, KGE’, FAR, and CSI for three SPPs (Figure 4d,e,g,h). However, the CCs of the three products have a non-linear variation tendency like sinusoidal variations with elevation in the LWR model, and the specific trend is that CC values increase gradually from low-elevation regions, peak in areas at about 400 m and falls back to a lower level at around 1000 m (Figure 4a). In particular, RMSE of three SPPs show a trend of decreasing first and then increasing with elevation, and the lowest values occurred in about 500 m regions (Figure 4b). Likewise, the β of CRT also presents a slight to non-linear variation with elevation variations (Figure 4c). In the LWR model, the POD of 3B42 and CRT show first a rise and then a decrease with elevation, reaching the fitting peak roughly in regions of 500 m and 800 m (Figure 4f).

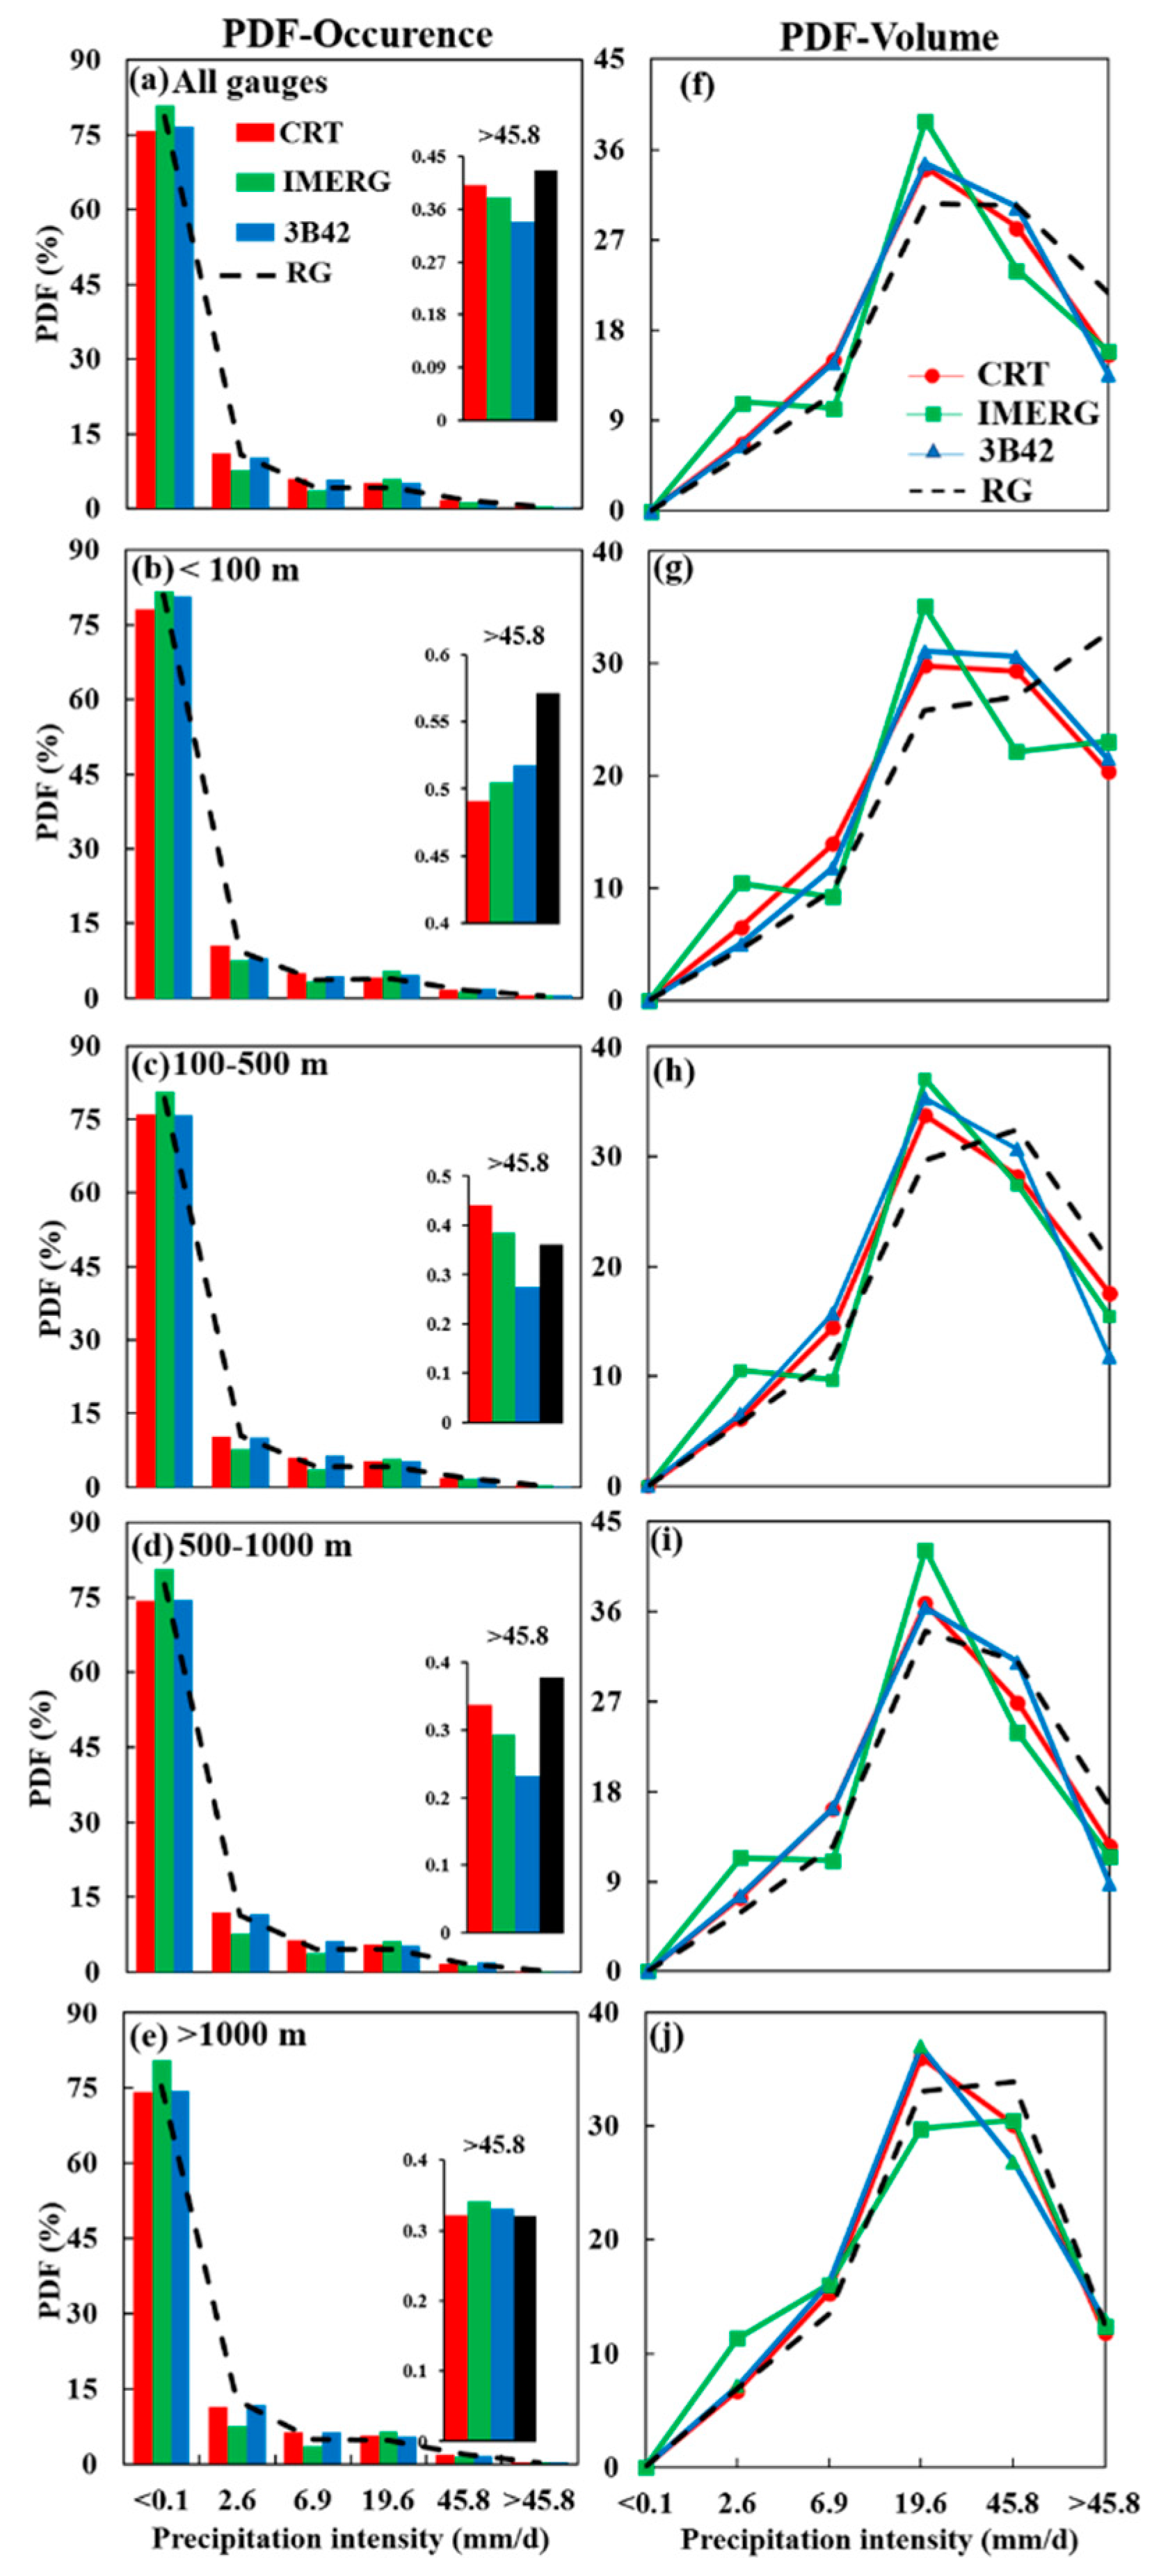
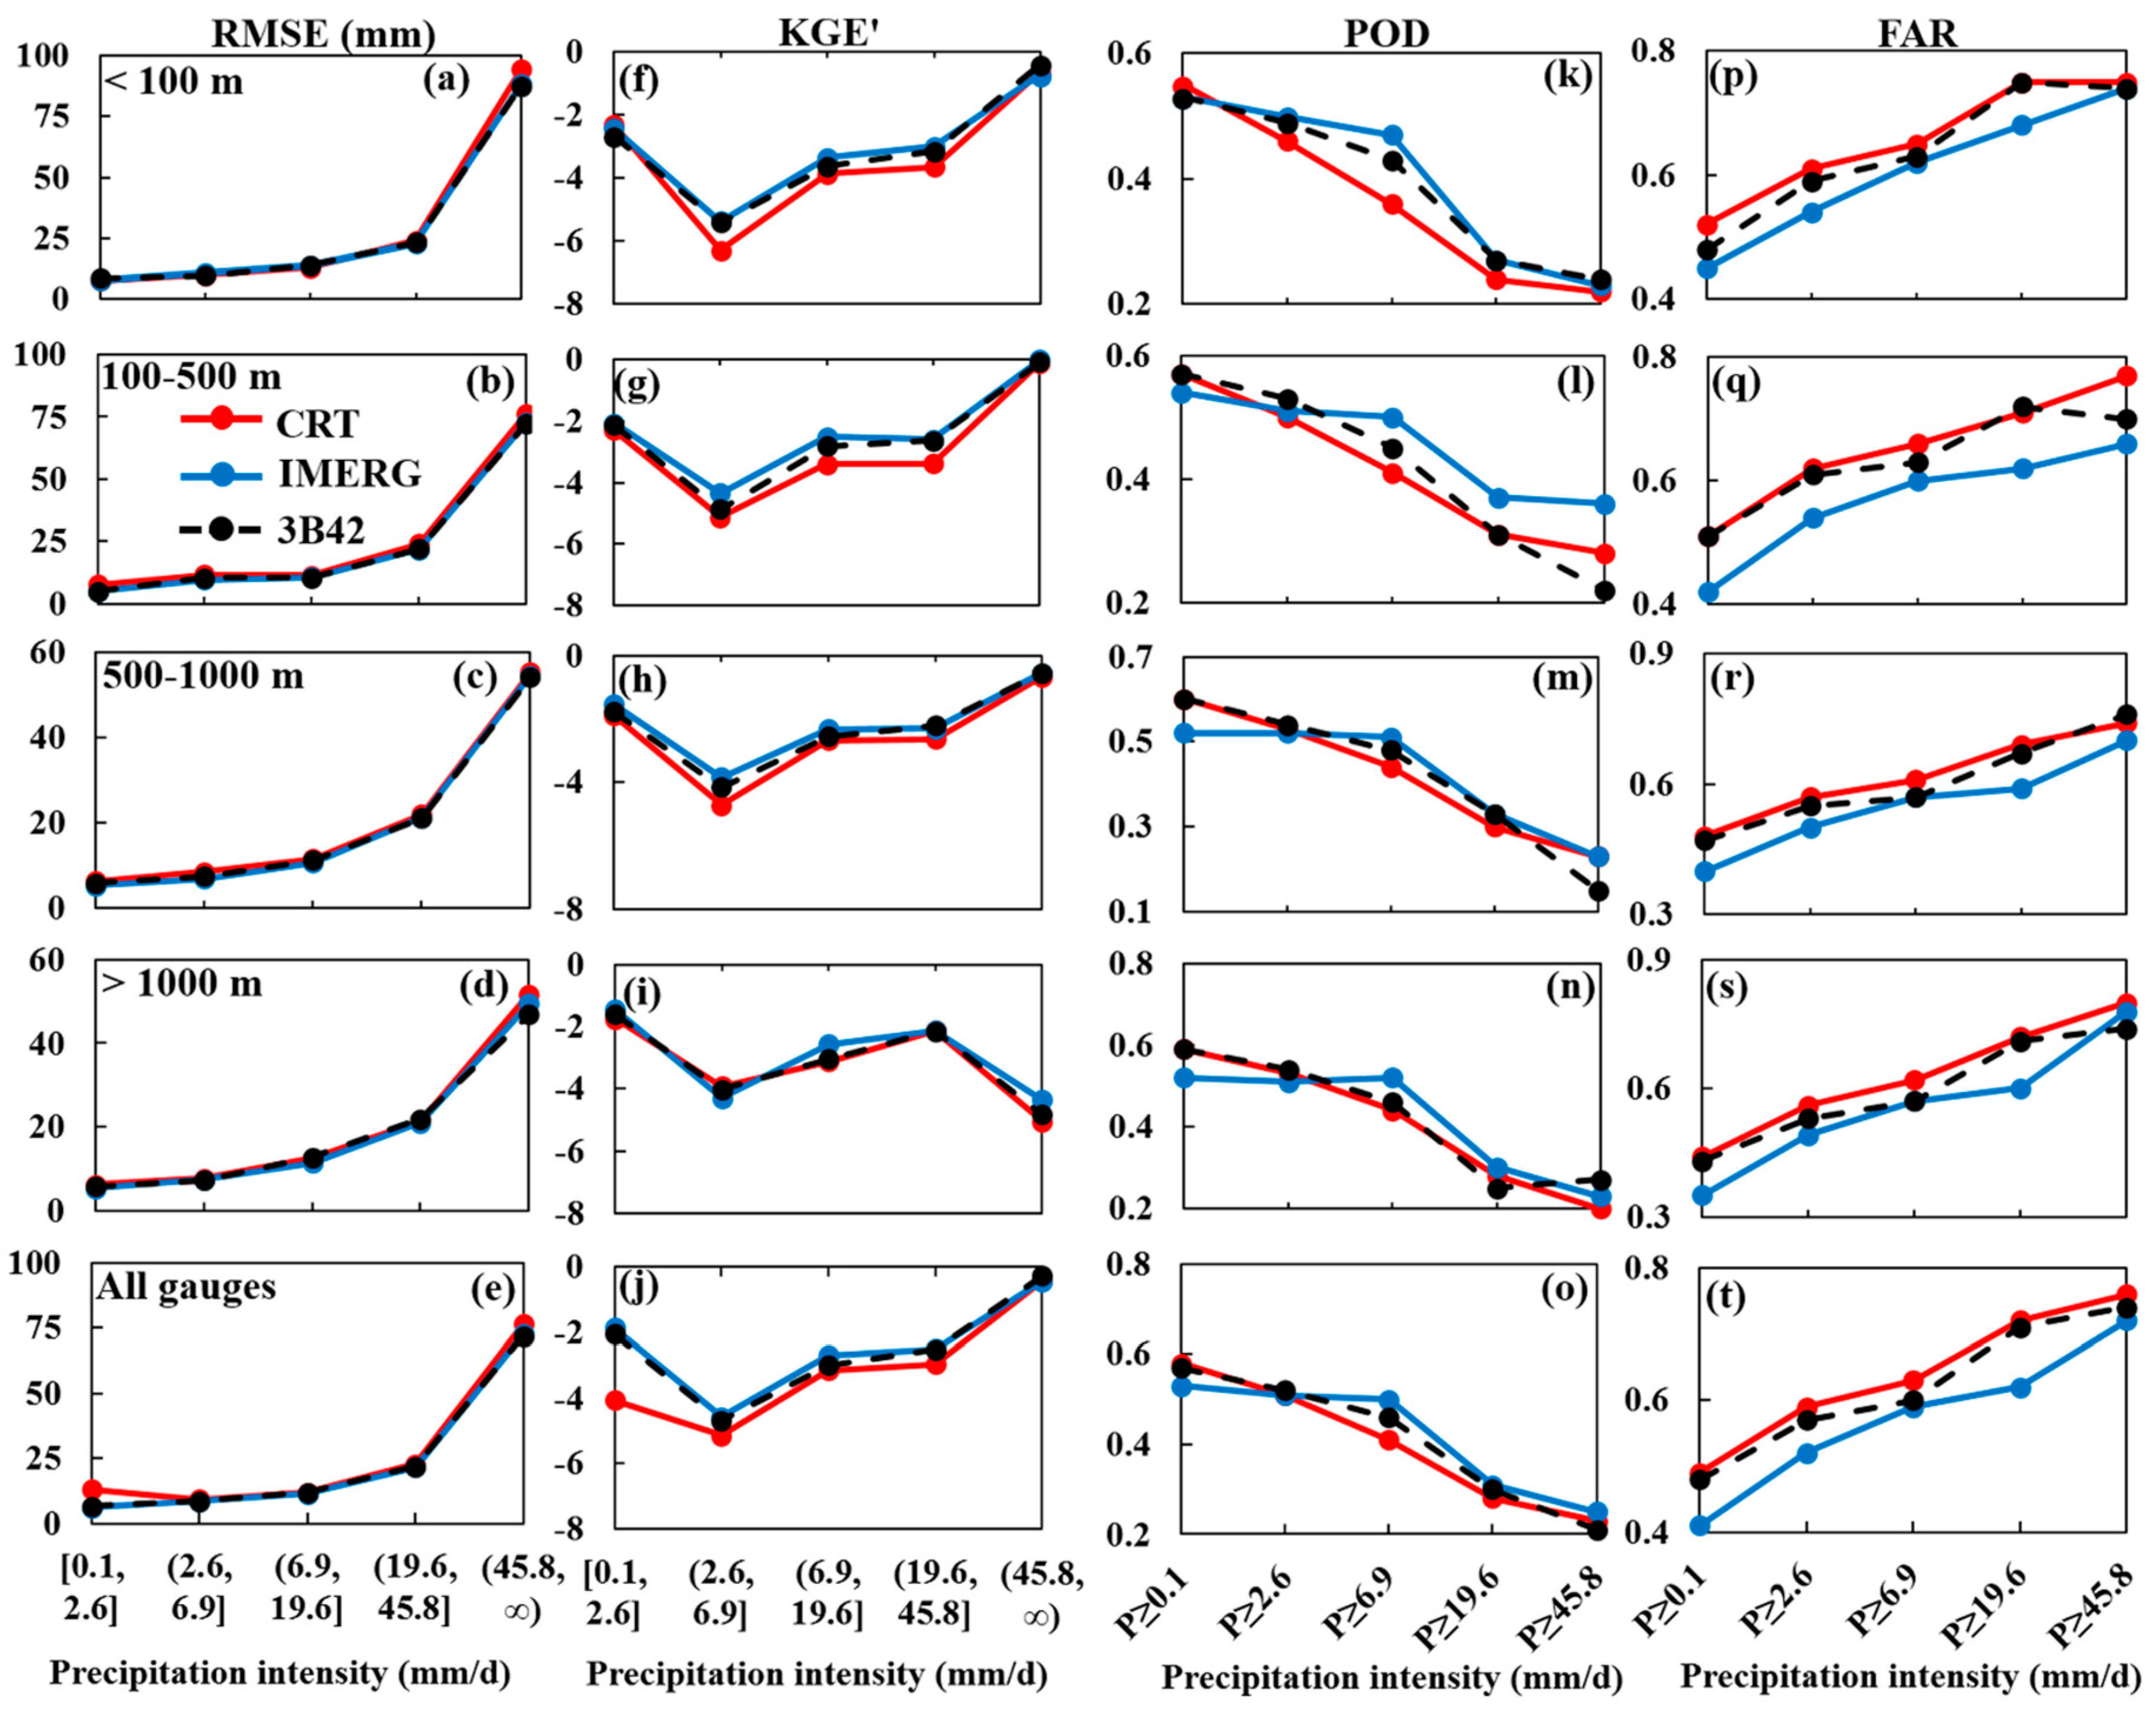
4.3. Reliability of the Performance of SPPs on Precipitation Intensity in Different Elevation Regions

Figure 5 shows PDF occurrence (PDFo) and PDF volume (PDFv) for the entire region and different elevation regions. PDFo and PDFv of three SPPs have great consistency over the Taihang Mountains. CRT and 3B42 tend to underestimate the frequency of no rain events, while IMERG generally overestimated their frequencies (Figure 5a). Three SPPs slightly overestimated the frequency of heavy precipitation events (6.9 < PI ≤ 19.6 mm/d). This overestimation in the frequency of heavy precipitation events is responsible for the overestimation in the total precipitation volume of heavy precipitation (PI > 19.6 mm/d). In particular, the three SPPs show an underestimation in the frequency of extreme precipitation (PI > 45.8 mm/d); except that the frequency probabilities from CRT and IMERG were larger than rain gauges when the rain rate was greater than 45.8 mm/d over the >1000 m regions (Figure 5e). The frequencies of CRT for extreme precipitation demonstrate the most-similar pattern with ground-based observations over the entire regions (all gauges).
Figure 6e,j,o,t show SPPs’ accuracy and precipitation detection capability performance in different precipitation intensities and thresholds over the whole regions. In light of different precipitation intensity measurements, the RMSE values of the three SPPs increase with the rise in precipitation intensity (Figure 6a–d). From the perspective of slope of line in different intensity ranges, the slope of line between very heavy rainfall and extreme rainfall is greater than other ranges, indicating that SPPs perform less well when observing extreme precipitation events. In all elevation groups, SPPs tend to overestimate (β > 1) the amount of light and moderate precipitation events (0.1 ≤ PI ≤ 6.9 mm/d), whereas the opposite is true for heavy, very heavy, and extreme precipitation events (Table S1). Because the KGE’ is a comprehensive evaluation index to reflect SPP overall accuracy performance, three products show worse accuracy performance in the moderate precipitation (2.6 < PI ≤ 6.9 mm/d) range compared to extreme precipitation (PI > 45.8 mm/d) range (Figure 6j). The detecting ability of IMERG and 3B42 for moderate precipitation events (2.6 ≤ PI ≤ 6.9 mm/d) is superior to that of CRT based on the results of POD and FAR values. POD values of three products decrease with the increment of precipitation intensity, while FAR values increase with the rise of precipitation intensity.
As for different elevation groups, the variation trends of RMSE value are similar to the entire region with the increase of precipitation intensity. Generally, the RMSE values of the three SPPs for observing extreme precipitation events (PI > 45.8 mm/d) in low and medium elevation (<500 m) regions were higher than that in high elevation regions (Table S1). Likewise, the KGE’ values of IMERG gradually increased from moderate precipitation to very heavy precipitation over all elevation regions (Figure 6h). Commonly, CRT, IMERG, and 3B42 showed relatively better accuracy performance in estimating extreme precipitation in regions of below 1000 m (Figure 6f–h). However, the three SPPs showed poor performance in observing extreme precipitation (PI > 45.8 mm/d) in high elevation (>1000 m) regions (Figure 6i). Between low-elevation and high-elevation, we found no significant difference in detection skill for three SPPs, with the similar magnitude POD and FAR values (Figure 5 and Table S2).

5. Discussion

Previous studies have suggested that topographic variations exert complex controls on precipitation and pose challenges across different seasons to satellite estimates derived from the observation of satellite sensors, including infrared, active microwave, and passive microwave sensors [51,52,53], especially in mountainous regions [1,54]. For example, Zambrano-Bigiarini et al. [11] evaluated seven satellite products, and found that all, except for PGFv3, performed poorly for higher elevations, particularly in 2000–3500 m over Chile. Xu et al. [9] discovered that the performance of GPM IMERG and TRMM 3B42V7 significantly correlated with topographic variation and that there is no detection skill for two products at high-elevation (>4500 m) regions over the southern Tibetan Plateau. The results of this study agree with their findings in that the performance of SPPs is significantly influenced by complex terrains, especially regarding precipitation detection capability. However, our results differ from Gao and Liu [23], who discovered that the correlation coefficient between TRMM data and ground-based data showed an indistinctively topographic dependence.
According to the comparison of the two types of regression models, to some degree, we found that the linear regression model can explain the relationships between some error indices and terrain variations. Other models, such as the LWR model, should also be considered as a solution to improve the algorithms of satellite products, especially new-version GPM products over the complex terrains. By using the LWR model, we were able to discover that the CC, RMSE, and POD of SPPs show distinct non-linear correlation with elevation variation. For example, the CC of the three products had a non-linear variation tendency like sinusoidal function with elevation variations in LWR model. The RMSE of the three SPPs displayed a trend of decreasing first and then increasing with elevation, and the lowest values occurred in about 500 m regions. The POD of 3B42 and CRT first showed a rise and then a decrease with elevation, reaching the fitting peak roughly in 500 m and 800 m regions. These change features can be considered in the improvement of future algorithm products.
The reliability of the performance of satellite products on elevation variation may be connected with not just defective skills in retrieval of light rain events [55,56], but also for solid precipitation (e.g., ice and snow) and for corresponding measurement techniques. For instance, TRMM 3B42 had poor performance over highly undulating terrain, which might be occasioned by its embedded surface snow screening procedure [9]. Snow and ice-covered surfaces at the top of mountains generate stronger scattering, limiting microwave algorithms’ ability to correctly define scatter signals over land [40]. It also has been pointed out that satellite sensors show better quality in open surface by comparison with complex terrain regions, and the retrieval results of satellite products are affected by complex terrains [55,57]. Currently, the thermal infrared radiation thresholds were utilized to distinguish between raining and non-raining clouds, causing the IR rainfall retrieval algorithms to miss light-rainfall events due to the relatively warm clouds in mountainous regions [57]. In addition to IR, heavy regional rain or strong thunderstorms can be underestimated by PMW algorithms over the mountainous regions during the summertime [20]. On the other hand, due to blocking of the mountains, orographic rainfall is more likely to generate in the complex terrains. Orographic precipitation, produced when moist air passes over mountainous terrain, creates a challenge for passive microwave algorithms. Since it relies largely on data from scattering by ice or snow taken in by satellite products over land [19], the combination of complex topography and the associated warm-wet water uplift process could lead to significant errors in satellite precipitation estimates.
This study supports other findings that SPPs differ in reliability for different precipitation intensity ranges over different elevation regions. The initial step of precipitation observation is to obtain raw data by satellite sensors, which include infrared and microwave sensors [58,59]. In general, the main work principles of infrared and microwave sensing are to detect information about the brightness/temperature of the cloud top and precipitation particles, respectively, essentially facet precipitation information [60,61]. In this study, precipitation intensity was classified based on rain gauge data (point data), which cannot fully represent the precipitation intensity of gauges’ surroundings (facet precipitation information). This is a possible reason for finding that SPPs differ in reliability at different precipitation intensity ranges.
GPM IMERG had a better performance in detecting light and moderate rain events in this study. 3B42 showed relatively low precipitation detection scores, and the POD values decreased with the rise in precipitation intensity. Consistent with our findings, previous studies have reported that TRMM products have not performed well in correctly detecting light and heavy precipitation events in Thailand and the northern Indian Ocean [62,63]. Specifically, the good detection ability for three products occurred in high elevation regions (>1000 m). Furthermore, relatively high FAR values for classified precipitation might be due to spurious events detected by satellites and/or the inability of satellite products to detect precipitation in precisely specified precipitation categories [64]. In fact, SPPs are more likely to detect the amount of precipitation somewhat lower or higher than the specified intensities.

6. Conclusions

In this study, three state-of-the-art SPPs datasets (CMORPH CRT, GPM IMERG, and TRMM 3B42V7) are evaluated against observations at 104 rain gauges over the Taihang Mountains, a highly challenging task due to the area’s rugged, complex topography and high elevation (ranging from sea level to 3091 m). Our validation is extensively based on a high-density network of rain gauges, with special focus on examining CRT, IMERG, and 3B42 product performance and credibility for varied topography and precipitation intensity.
The following summarizes our key findings:
  • Over the whole regions, the three SPPs provided overall larger daily precipitation estimates than rain gauges, and 3B42 slightly outperformed CRT and IMERG. In the different elevation groups, the three products showed better performance accuracy in the 0–500 m regions. The three SPPs showed a similar precipitation detection performance over the whole area, and exhibited good precipitation detecting ability in high-elevation (>1000 m) regions.
  • The errors of 3B42 and CRT showed a significant positive (p < 0.01) correlation with elevation. Precipitation detection performance of three products was gradually improved with the rise in elevation.
  • Over the whole regions, three SPPs slightly overestimated the frequency of heavy rain events (6.9 < PI ≤ 19.6 mm/d). CRT and 3B42 tended to underestimate the frequency of no rain events (PI < 0.1 mm/d), while IMERG overestimated the frequency of no rain events. Our study infers that the precipitation detection performances of the three SPPs become worse with the increase of precipitation intensity.

Supplementary Materials

The following are available online at https://www.mdpi.com/2073-4433/11/6/633/s1, Table S1: The accuracy performance of satellite precipitation products in different precipitation intensity (PI) range over different elevation regions; Table S2: The precipitation detection performance of satellite precipitation in different precipitation intensity range over different elevation regions.

Author Contributions

Conceptualization, L.Y. and Y.Y.; Data curation, L.Y.; Writing—Original draft, L.Y. and Y.Z.; Writing—L.Y. All authors have read and agreed to the published version of the manuscript.

Funding

This research was funded by the National Natural Science Foundation of China grant number 41671021 and the National Key Research and Development Program of China grant number 2018YFE0110100. The APC was funded by above.

Acknowledgments

We thank all organizations and developers of CMORPH, GPM IMERG, and TMPA TRMM products for providing the dataset freely to public. We are grateful for Huilong Li and Lexin Ma’s contribution in the process of data analysis. The authors also thank the editor and anonymous reviewers for their constructive and detailed comments for improving the quality of our paper.

Conflicts of Interest

The authors declare no conflict of interest.

References

  1. Xia, T.; Wang, Z.J.; Zheng, H. Topography and data mining based methods for improving satellite precipitation in mountainous areas of China. Atmosphere 2015, 6, 983–1005. [Google Scholar] [CrossRef] [Green Version]
  2. Wang, C.; Tang, G.; Han, Z.; Guo, X.; Hong, Y. Global intercomparison and regional evaluation of GPM IMERG version-03, version-04 and its latest version-05 precipitation products: Similarity, difference and improvements. J. Hydrol. 2018, 564, 342–356. [Google Scholar] [CrossRef]
  3. Pan, M.; Li, H.; Wood, E. Assessing the skill of satellite-based precipitation estimates in hydrologic applications. Water Resour. Res. 2010, 46, 201–210. [Google Scholar] [CrossRef]
  4. Ma, Z.; Zhou, Y.; Hu, B.; Liang, Z.; Shi, Z. Downscaling annual precipitation with TMPA and land surface characteristics in China. Int. J. Clim. 2017, 37, 5105–5119. [Google Scholar] [CrossRef]
  5. Sharifi, E.; Steinacker, R.; Saghafian, B. Multi time-scale evaluation of high-resolution satellite-based precipitation products over northeast of Austria. Atmos. Res. 2018, 206, 46–63. [Google Scholar] [CrossRef]
  6. Yong, B.; Liu, D.; Gourley, J.J.; Tian, Y.; Huffman, G.J.; Ren, L.; Hong, Y. Global view of real-time TRMM multisatellite precipitation analysis: Implications for its successor global precipitation measurement mission. Bull. Am. Meteorol. Soc. 2015, 96, 283–296. [Google Scholar] [CrossRef]
  7. Tan, M.L.; Santo, H. Comparison of GPM IMERG, TMPA 3B42 and PERSIANN-CDR satellite precipitation products over Malaysia. Atmos. Res. 2018, 202, 63–76. [Google Scholar] [CrossRef]
  8. Magginoi, V.; Meyers, P.C.; Robinson, M.D. A review of merged high-resolution satellite. Precipitation product accuracy during the tropical rainfall measuring mission (TRMM) era. J. Hydrometeorol. 2016, 17, 1101–1117. [Google Scholar] [CrossRef]
  9. Xu, R.; Tian, F.; Yang, L.; Hu, H.; Lu, H.; Hou, A. Ground validation of GPM IMERG and TRMM 3B42V7 rainfall products over southern Tibetan plateau based on a high-density rain gauge network. J. Geophys. Res. Atmos. 2017, 122, 1–15. [Google Scholar] [CrossRef]
  10. Duan, Z.; Liu, J.; Tuo, Y.; Chiogna, G.; Disse, M. Evaluation of eight high spatial resolution gridded precipitation products in Adige Basin (Italy) at multiple temporal and spatial scales. Sci. Total Environ. 2016, 573, 1536–1553. [Google Scholar] [CrossRef] [Green Version]
  11. Zambrano-Bigiarini, M.; Nauditt, A.; Birkel, C.; Verbist, K.; Ribbe, L. Temporal and spatial evaluation of satellite-based rainfall estimates across the complex topographical and climatic gradients of Chile. Hydrol. Earth Syst. Sci. 2017, 21, 1295–1320. [Google Scholar] [CrossRef] [Green Version]
  12. Bitew, M.M.; Gebremichael, M. Evaluation of satellite rainfall products through hydrologic simulation in a fully distributed hydrologic model. Water Resour. Res. 2011, 47, W06526. [Google Scholar] [CrossRef]
  13. Song, H.J.; Sohn, B.J. Two Heavy Rainfall Types over the Korean Peninsula in the Humid East Asian Summer Environment: A Satellite Observation Study. Mon. Weather. Rev. 2015, 143, 363–382. [Google Scholar] [CrossRef]
  14. Zhu, Q.; Xuan, W.; Liu, L.; Xu, Y.P. Evaluation and hydrological application of precipitation estimates derived from PERSIANN-CDR, TRMM 3B42V7 and NCEP-CFSR over humid regions in China. Hydrological. Processes 2016, 30, 3061–3083. [Google Scholar] [CrossRef]
  15. Kidd, C.; Levizzani, V.; Turk, J.; Ferraro, R. Satellite precipitation measurements for water resource monitoring. JAWRA J. Am. Water Resour. Assoc. 2009, 45, 567–579. [Google Scholar] [CrossRef]
  16. Wang, K.; Guan, Q.; Chen, N.; Tong, D.; Hu, C.; Peng, Y.; Dong, X.; Yang, C. Optimizing the configuration of precipitation stations in a space-ground integrated sensor network based on spatial-temporal coverage maximization. J. Hydrol. 2017, 548, 625–640. [Google Scholar] [CrossRef]
  17. Aires, F.; Prigent, C.; Bernardo, F.; Jiménez, C.; Saunders, R.; Brunel, P. A Tool to Estimate Land-Surface Emissivities at Microwave frequencies (TELSEM) for use in numerical weather prediction. Q. J. R. Meteorol. Soc. 2011, 137, 690–699. [Google Scholar] [CrossRef] [Green Version]
  18. Carr, N.; Kirstetter, P.E.; Hong, Y.; Gourley, J.J.; Schwaller, M.; Petersen, W.; Wang, N.; Ferraro, R.R.; Xue, X. The influence of surface and precipitation characteristics on TRMM microwave imager rainfall retrieval uncertainty. J. Hydrometeorol. 2015, 16, 1596–1614. [Google Scholar] [CrossRef]
  19. Dinku, T.; Ceccato, P.; Grover-Kopec, E.; Lemma, M.; Connor, S.J.; Ropelewski, C.F. Validation of satellite rainfall products over East Africa complex topography. Int. J. Remote. Sens. 2007, 28, 1503–1526. [Google Scholar] [CrossRef]
  20. Gottschalck, J.; Meng, J.; Rodell, M.; Houser, P. Analysis of multiple precipitation products and preliminary assessment of their impact on global land data assimilation system land surface states. J. Hydrometeorol. 2005, 6, 573–598. [Google Scholar] [CrossRef]
  21. Bharti, V.; Singh, C. Evaluation of error in TRMM 3B42V7 precipitation estimates over the Himalayan region. J. Geophys. Res. Atmos. 2015, 120, 12458–12473. [Google Scholar] [CrossRef]
  22. Tong, K.; Su, F.; Yang, D.; Zhang, L.; Hao, Z. Tibetan plateau precipitation as depicted by gauge observations, reanalyses and satellite retrievals. Int. J. Climatol. 2014, 34, 265–285. [Google Scholar] [CrossRef]
  23. Gao, Y.C.; Liu, M.F. Evaluation of high-resolution satellite precipitation products using rain gauge observations over the Tibetan plateau. Hydrol. Earth Syst. Sci. 2013, 17, 837–849. [Google Scholar] [CrossRef] [Green Version]
  24. Cinco, T.A.; Guzman, R.G.; Hilario, F.D.; Wilson, D.M. Long-term trends and extremes in observed in daily precipitation and near surface air temperature in the Philippines for the period 1951–2010. Atmos. Res. 2014, 145–146, 12–26. [Google Scholar] [CrossRef]
  25. Gu, X.; Zhang, Q.; Li, J.; Singh, V.P.; Sun, P. Impact of urbanization on nonstationarity of annual and seasonal precipitation extremes in China. J. Hydrol. 2019, 575, 638–655. [Google Scholar] [CrossRef]
  26. Vu, T.M.; Mishra, A.K. Nonstationary frequency analysis of recent extreme precipitation events in the United States. J. Hydrol. 2019, 575, 999–1010. [Google Scholar] [CrossRef]
  27. Sarkar, S.; Maity, R. Increase in probable maximum precipitation in a changing climate over India. J. Hydrol. 2020, 585, 124806. [Google Scholar] [CrossRef]
  28. Zhang, Q.; Xiao, M.; Li, J.; Singh, V.P.; Wang, Z. Topography-based spatial patterns of precipitation of precipitation extremes in the Poyang Lake basin, China: Changing properties and causes. J. Hydrol. 2014, 512, 229–239. [Google Scholar] [CrossRef]
  29. Gu, X.; Zhang, Q.; Singh, V.P.; Liu, L.; Shi, P. Spatiotemporal patterns of annual and seasonal precipitation extremes distributions across China and potential impact of tropical cyclones. Int. J. Climatol. 2017, 37, 4186–4198. [Google Scholar] [CrossRef]
  30. Fu, T.; Han, L.; Gao, H.; Liang, H.; Li, X.; Liu, J. Pedodiversity and its controlling factors in mountain regions—A case study of Taihang Mountain, China. Geoderma 2018, 310, 230–237. [Google Scholar] [CrossRef]
  31. Fu, T.; Han, L.; Gao, H.; Liang, H.; Liu, J. Geostatistical analysis of pedodiversity in Taihang Mountain region in North China. Geoderma 2018, 328, 91–99. [Google Scholar] [CrossRef]
  32. Tang, G.; Carroll, R.W.H.; Lutz, A.; Lin, S. Regulation of precipitation-associated vegetation dynamics on catchment water balance in a semiarid and arid mountainous watershed. Ecohydrology 2016, 9, 1248–1262. [Google Scholar] [CrossRef]
  33. Ding, Y.; Chan, J.C.L. The East Asian summer monsoon: An overview. Meteorol. Atmos. Phys. 2005, 89, 117–142. [Google Scholar] [CrossRef]
  34. Yang, M.; Yao, T.; Guo, X.; Wang, H.; Hao, L. Comparison analysis of the summer monsoon precipitation between northern and southern slopes of Tanggula Mountains, Qinghai-Xizang (Tibetan) plateau: A case study in summer 1998. Hydrol. Process. 2006, 21, 1841–1847. [Google Scholar] [CrossRef]
  35. Briggs, P.R.; Cogley, J.G. Topographic bias in mesoscale precipitation networks. J. Clim. 1996, 9, 205–218. [Google Scholar] [CrossRef]
  36. Daly, C. Guidelines for assessing the suitability of spatial climate data sets. Int. J. Climatol. 2006, 26, 707–721. [Google Scholar] [CrossRef]
  37. Shen, Y.; Xiong, A. Validation and comparison of a new gauge-based precipitation analysis over mainland China. Int. J. Climatol. 2016, 36, 252–265. [Google Scholar] [CrossRef]
  38. Joyce, R.J.; Janowiak, J.E.; Arkin, P.A.; Xie, P. CMORPH: A method that produces global. precipitation estimates from passive microwave and infrared data at high spatial and temporal resolution. J. Hydrometeorol. 2004, 5, 287–296. [Google Scholar] [CrossRef]
  39. Huffman, G.J.; Adler, R.F.; Bolvin, D.T.; Nelkin, E.J. The TRMM multi-satellite precipitation analysis (TMPA): Quasi-global, multiyear, combined-sensor precipitation estimate at fine scales. J. Hydrometeorol. 2007, 8, 38–55. [Google Scholar] [CrossRef]
  40. Huffman, G.J.; Bolvin, D.T. TRMM and other data precipitation date set documentation. In NASA Global Change Master Directory Doc; Mesoscale Atmospheric Processes Laboratory: Greenbelt, MD, USA, 2013; pp. 1–44. Available online: https://www.researchgate.net/publication/228892338 (accessed on 13 June 2020).
  41. Hou, A.Y.; Skofronick-Jackson, G.; Kummerow, C.D.; Shepherd, J.M. Global Precipitation Measurement. Part II: Precipitation: Advances in Measurement, Estimation and Prediction; Springer: Berlin/Heidelberg, Germany, 2008; Volumes 131–169. [Google Scholar] [CrossRef]
  42. Hou, A.Y.; Kakar, R.K.; Neeck, S.; Azarbarzin, A.; Kummerow, C.D.; Kojima, M.; Oki, R.; Nakamura, K.; Lguchi, T. The Global Precipitation Measurement Mission. Bull. Am. Meteorol. Soc. 2014, 95, 701–722. [Google Scholar] [CrossRef]
  43. Simonović, P.S. Floods in a Changing Climate. Risk Management, 1st ed.; Cambridge University Press: Cambridge, UK, 2012. [Google Scholar]
  44. Kling, H.; Fuchs, M.; Paulin, M. Runoff conditions in the upper Danube basin under an ensemble of climate change scenarios. J. Hydrol. 2012, 424–425, 264–277. [Google Scholar] [CrossRef]
  45. Tang, G.; Ma, Y.; Long, D.; Zhong, L.; Hong, Y. Evaluation of GPM Day-1 IMERG and TMPA Version-7 legacy products over mainland China at multiple spatiotemporal scales. J. Hydrol. 2016, 533, 152–167. [Google Scholar] [CrossRef]
  46. Tian, Y.; Peters-Lidard, C.D.; Choudhury, B.J.; Garcia, M. Multitemporal analysis of TRMM-based satellite precipitation products for land data assimilation applications. J. Hydrometeorol. 2007, 8, 1165–1183. [Google Scholar] [CrossRef]
  47. Sohn, B.J.; Ryu, G.H.; Song, H.J.; Ou, M.L. Characteristic features of warm-type rain producing heavy rainfall over the Korean Peninsula inferred from TRMM measurements. Mon. Weather Rev. 2013, 141, 3873–3888. [Google Scholar] [CrossRef]
  48. Li, Z.; Yang, D.; Hong, Y. Multi-scale evaluation of high-resolution multi-sensor blended global precipitation products over the Yangtze River. J. Hydrol. 2013, 500, 157–169. [Google Scholar] [CrossRef]
  49. Kirstetter, P.E.; Hong, Y.; Gourley, J.J.; Schwaller, M.; Petersen, W.; Zhang, J. Comparison of TRMM 2A25 products, version 6 and version 7, with NOAA/NSSL ground radar–based national mosaic QPE. J. Hydrometeorol. 2013, 14, 661–669. [Google Scholar] [CrossRef] [Green Version]
  50. Cleveland, W.S.; Devlin, S.J. Locally Weighted Regression: An Approach to Regression Analysis by Local Fitting. J. Am. Stat. Assoc. 1998, 83, 596–610. [Google Scholar] [CrossRef]
  51. Anders, A.M.; Roe, G.H.; Hallet, B.; Montgomery, D.R.; Finnegan, N.J.; Putkonen, J. Spatial patterns of precipitation and topography in the Himalaya. Geol. Soc. Am. Spec. Pap. 2006, 398, 39–53. [Google Scholar] [CrossRef] [Green Version]
  52. Scheel, M.L.M.; Rohrer, M.; Huggel, C.; Santos Villar, D.; Silvestre, D.; Huffman, G.J. Evaluation of TRMM Multi-satellite Precipitation Analysis (TMPA) performance in the central Andes region and its dependency on spatial and temporal resolution. Hydrol. Earth Syst. Sci. 2011, 15, 2649–2663. [Google Scholar] [CrossRef] [Green Version]
  53. Mantas, V.M.; Liu, Z.; Caro, C.; Pereira, A. Validation of TRMM multi-satellite precipitation analysis (TMPA) products in the Peruvian Andes. Atmos. Res. 2015, 163, 132–145. [Google Scholar] [CrossRef]
  54. Gebregiorgis, A.S.; Hossain, F. Understanding the dependence of satellite rainfall uncertainty on topography and climate for hydrologic model simulation. IEEE Trans. Geosci. Remote. Sens. 2013, 5, 704–718. [Google Scholar] [CrossRef]
  55. EI Kenaway, A.M.; Lopez-Moreno, J.I.; McCabe, M.F.; Vicente-Serrano, S.M. Evaluation of the TMPA-3B42 precipitation product using a high-density rain gauge network over complex terrain in northeastern Iberia. Glob. Planet. Chang. 2015, 133, 188–200. [Google Scholar] [CrossRef] [Green Version]
  56. Li, Z.; Yang, D.; Gao, B.; Jiao, Y.; Hong, Y.; Xu, T. Multiscale hydrologic applications of the latest satellite precipitation products in the Yangtze River basin using a distributed hydrologic model. J. Hydrometeorol. 2015, 16, 407–426. [Google Scholar] [CrossRef]
  57. Hirpa, F.A.; Gebremichael, M.; Hopson, T. Evaluation of high-resolution satellite precipitation products over very complex terrain in Ethiopia. J. Appl. Meteorol. Climatol. 2010, 49, 1044–1051. [Google Scholar] [CrossRef]
  58. Stampoulis, D.; Anagnostou, E.N. Evaluation of global satellite rainfall products over continental Europe. J. Hydrometeorol. 2012, 13, 588–603. [Google Scholar] [CrossRef]
  59. Dembélé, M.; Zwart, S. Evaluation and comparison of satellite-based rainfall products in Burkina Faso, West Africa. Int. J. Remote. Sens. 2016, 37, 3995–4014. [Google Scholar] [CrossRef] [Green Version]
  60. Arkin, P.A. The relationship between fractional coverage of high cloud and rainfall accumulations during GATE over the B-scale array. Mon. Weather Rev. 1979, 107, 1382–1387. [Google Scholar] [CrossRef] [Green Version]
  61. Liang, J.; Liu, X.; Huang, K.; Li, X.; Shi, X.; Chen, Y.; Li, J. Improved snow depth retrieval by integrating microwave brightness temperature and visible/infrared reflectance. Remote. Sens. Environ. 2015, 156, 500–509. [Google Scholar] [CrossRef]
  62. Chokngamwong, R.; Chiu, L.S. Thailand daily rainfall and comparison with TRMM products. J. Hydrometeorol. 2008, 9, 256–266. [Google Scholar] [CrossRef]
  63. Prakash, S.; Gairola, R.M. Validation of TRMM-3B42 precipitation product over the tropical Indian Ocean using rain gauge data from the RAMA buoy array. Theor. Appl. Climatol. 2014, 115, 451–460. [Google Scholar] [CrossRef]
  64. Blacutt, L.A.; Herdies, D.L.; Gonçalves, L.G.G.; Vila, D.A.; Marcoe, A. Precipitation comparison for the CFSR, MERRA, TRMM3B42 and Combined Scheme dataset in Bolivia. Atmos. Res. 2015, 163, 117–131. [Google Scholar] [CrossRef] [Green Version]
Figure 1. Regional map of the Taihang Mountains, including elevation, location of rain gauges, and river systems.
Atmosphere 11 00633 g001
Figure 2. Box plot of grid-based metrics: CC (a), RMSE (b), β (c), γ (d), KGE’ (e), POD (f), FAR (g), and CSI (h) calculated by evaluated CRT, IMERG, and 3B42 against gauge observations at different elevation zones for the two-year study period (January 2016–December 2017).
Atmosphere 11 00633 g002
Figure 3. Relationship between evaluation metrics and elevation for 3B42, CRT, and IMERG based on linear regression model. Each dot represents a rain gauge. The straight line shows the liner trends estimated least squares error method. The p values of the significance test for the liner trend are shown in the figure accordingly. Figure (a–h) stands for the metrics of CC, RMSE, β, γ, KGE’, POD, FAR and CSI, respectively.
Atmosphere 11 00633 g003
Figure 4. Relationship between evaluation metrics and elevation for 3B42, CRT and IMERG based on locally weighted regression model. Figure (a–h) stands for the metrics of CC, RMSE, β, γ, KGE’, POD, FAR and CSI, respectively.
Atmosphere 11 00633 g004
Figure 5. Occurrence probability distribution functions (PDFo) (ae) and volume probability distribution functions (PDFv) (fj) of precipitation estimate from CRT, IMERG, 3B42, and rain gauges over different elevation ranges.
Atmosphere 11 00633 g005
Figure 6. RMSE (ae), KGE’ (fj), POD (ko), and FAR (pt) from CRT, IMERG, and 3B42 products in different precipitation intensity over different elevation ranges.
Atmosphere 11 00633 g006
Table 1. Summary of satellite-based products providing data at a quasi-global scale.
DatasetFull NameLatitudinal CoverageSpatial ResolutionTemporal CoverageReferences
CMORPHNOAA Climate Prediction Center (CPC) MORPHing technique60° N–60° S8 km, 0.25°January 1998–present[38]
TRMM 3B42V7TRMM Multi-satellite Precipitation Analysis research product 3B42 Version 750° N–50° S0.25°January 1998–December 2019[39]
GPM IMERGGPM Integrated Multi-satelliteE Retrievals Version 0560° N–60° S0.1°June 2014–present[41,42]
Table 2. List of statistic metrics used in the evaluation and comparison of satellite precipitation products.
Statistic MetricsEquationPerfect Value
Correlation Coefficient (CC) C C = 1 N n = 1 N ( S n S ¯ ) ( G n G ¯ ) σ S σ G 1
Bias Ratio (β) β = S ¯ G ¯ 1
Variability Ratio (γ) γ = σ S / S ¯ σ G / G ¯ 1
Modified KGE (KGE’) K G E = 1 ( C C 1 ) 2 + ( ? 2 1 ) 2 + ( ? 3 1 ) 2 1
Root Mean Squared Error (RMSE) R M S E = 1 N n = 1 N ( S n G n ) 2 0
Probability of Detection (POD) P O D = n 11 n 11 + n 01 1
False Alarm Ratio (FAR) F A R = n 10 n 11 + n 10 0
Critical Success Index (CSI) C S I = n 11 n 11 + n 01 + n 10 1
Notation: N is the number of samples; S n is the satellite precipitation estimate; S ¯ is the averaged satellite precipitation estimate; G n is the gauge based precipitation observation; G ¯ is the averaged gauge based precipitation observation; σ G is the standard deviations of satellite precipitation series; σ G is the standard deviations of gauge based precipitation observation; n 11 is the number of precipitation events observed by satellites and gauges at the same time; n 01 is the number of precipitation events observed by gauges but not by satellites; n 10 is the opposite to n 01 .
Table 3. Elevation metrics calculated between CRT, IMERG, 3B42, and rain gauge data over the whole region and for different elevation ranges.
Elevation (m)Total GaugesMean Rain (mm/d)CCβγRMSE (mm)KGE’
CRTIMERG3B42CRTIMERG3B42CRTIMERG3B42CRTIMERG3B42CRTIMERG3B42
Whole regions1041.630.360.520.481.041.051.060.800.810.777.437.067.290.330.480.43
<100301.680.370.490.430.951.041.020.730.770.729.438.879.090.310.430.37
100–500201.590.460.570.521.151.121.110.760.760.737.686.797.150.390.490.44
500–1000401.600.470.540.511.091.031.060.850.850.836.425.896.070.450.520.47
>1000141.650.470.540.511.111.021.050.940.960.976.395.796.060.460.540.51
Table 4. Error metrics of categorical validation statistics for CRT, IMERG, and 3B42 on daily precipitation scale in different elevation ranges.
Elevation (m)Total GaugesPODFARCSI
CRTIMERG3B42CRTIMERG3B42CRTIMERG3B42
Whole regions1040.580.530.570.490.410.480.370.380.38
<100300.550.530.530.530.450.480.340.370.35
100–500200.570.540.570.510.420.510.360.390.35
500–1000400.600.520.590.480.400.470.390.390.39
>1000140.590.520.590.440.350.430.400.400.41

