1. Introduction
It is well documented that synoptic-scale convectively coupled Kelvin waves (KWs) and easterly waves have important influences on the variability of deep convection and low-level flow in the global tropics. Over Africa, KWs have an important impact on convection and rainfall during boreal summer e.g., [
1,
2,
3] and during spring e.g., [
4,
5]. A brief analysis indicates that KWs explain 5–10% of total convective variability from July to September over North Africa and about 15% from March to May over equatorial Africa e.g., [
4]. In comparison, African easterly waves (AEWs) contribute 25–35% to the total convective variability over North Africa and more than 40% the over eastern Atlantic [
6]. It is to be noted that the diurnal variance explains about 40% of the total convective activity in this region e.g., [
7]. If one focuses on synoptic scale (2–20 day) variability alone, then KWs contribute 10–25% and AEWs contribute 35–50% of the July to September synoptic-scale variability over the peak rainfall areas in West Africa (not shown). This suggests that KW and AEW activity together can explain a significant portion of the total variability over the summer monsoon regions in Africa and eastern Atlantic.
Summertime KWs over Africa and the Atlantic are characterized by a zonal wavelength of about 5000 km and a phase speed of about 15 m s
−1 [
1,
8]. Research on the role of KWs on rainfall and convection over Africa has received more attention during the last decade or so. Mathews [
9] suggested that moisture flux into West Africa increases as a result of the passage of KWs. He noted that a KW passage modifies the temperature profile and cyclonic shear associated with the African easterly jet (AEJ), which would increase the potential for the development of intense convection and rainfall. Mounier et al. [
1] noted that KWs modulate mesoscale convective systems over Africa through enhancing the low-level monsoon flow. Ventrice and Thorncroft [
3] also noted that KW passage has important influences on daily rainfall and on the initiation of AEWs. Additionally, Mounier et al. [
1] suggested the impact of KWs on convection over West Africa is comparable to that of AEWs. Similarly, Ventrice and Thorncroft [
3] suggested that KWs frequently modulate local convection and the dynamical environment that enables AEW activity to increase in boreal summer. In contrast, Mekonnen et al. [
2] noted that although KW activity over Africa impacts daily rainfall, it is negatively correlated with summer mean rainfall. KWs explain a smaller part (<10%) of the total convective variability over Africa, while AEWs explain nearly half of it. So, a simple variability analysis suggests the impact of KWs may not be comparable to the impact of AEWs, suggesting a need for further investigation.
Mekonnen et al. [
2] also studied the interannual variability of KW and suggested that AEW initiation as a result of KW events might not be common from a climatological perspective. Mekonnen et al. speculated that the influence of KW might be more during the dry years than wet years over Africa because KW activity is more pronounced in dry years. To reinforce their assumption, they studied a synoptic case study and found that some of the AEWs over East Africa were triggered in association with KW activity during the summer of 1987, one of the driest years over West and East Africa. However, they did not explore variations between wet and dry years, separately. It seems counter-intuitive that KWs are less common and have less effect during the wet years compared with the dry years. This study aims to expand on this.
Mekonnen et al. [
6] analyzed the contrast between convective structures during a summer dry year, 1990, and a wet year, 1988, over North Africa. They showed that eastward propagating structures associated with KWs were more pronounced in the dry year. In contrast, eastward propagating convective structures during the wet year were weaker, but westward propagating convective structures associated with AEWs were much more coherent and pronounced in the wet year (1988) compared with the dry year (1990). This implies that the role of KWs in convection and its potential interaction with AEWs over Africa requires more scrutiny by considering dry and wet years, separately. Further, past studies e.g., references [
2,
3] noted that KWs enhance the deep convection over the region and that enhanced convection is instrumental for AEW initiation and/or strength. However, the KW–AEW relationship has not been fully explored and whether the interaction would be stronger or weaker during dry and wet African years is not documented. Understanding the KW–AEW connection will have important contributions in medium-to-longer-range forecast efforts.
The objective of this paper is to examine a hypothesis that Kelvin waves have a more important impact in dry years than in wet years during the July the September rainfall season. To achieve our objective, we will use a suite of satellite and observational data sets including reanalysis products described below.
2. Data Sources and Analysis Methods
(a) Rainfall from the African Rainfall Climatology Version 2 (ARC2) for Famine Early Warning System Network
The ARC2 data is African centered, 0.1° grid, daily rainfall estimate spanning from 1983 to present and covers 40° N–40° S and 20° W, 55° E. The estimates are based on 3-hourly geostationary infrared (10–12 μm window) products of the European Organization for the Exploitation of Meteorological Satellites (EUMETSAT) and quality controlled Global Telecommunication System (GTS) rain gauge records. This data set is compiled by Novella and Thiaw [
10] at NOAA’s CPC (Climate Prediction Center). Novella and Thiaw [
10] run various tests to ensure data quality. They reported that the ARC2 rainfall is generally consistent with other widely used rainfall datasets such as GPCP (Global Precipitation Climatology Project) and CMAP (CPC Merged Analysis of Precipitation) products. They noted, however, that ARC2 underestimates July–September (JAS) rainfall over Guinea and Ethiopian highlands compared with GPCP and CMAP. They noted that the discrepancies are results of sparse stations in the GTS gauge network and also the rainfall estimation from satellite brightness temperature does not capture warm cloud precipitation. The ARC2 data is available in near-real-time and used for Famine Early Warning Systems Network (FEWS-NET) in Africa, which makes it desirable for this research. More details of the ARC2 data and benefits over other data sets can be found in Novella and Thiaw [
10].
(b) Infrared Cold Cloud Brightness Temperature (TB)
Deep convection is examined using T
B data obtained from the Cloud Archive User Service (CLAUS) of the European Union. CLAUS T
B is a product of multiple satellite observations (both geostationary and polar-orbiting) in a 10–12-μm window. It is a resample at 0.5° global horizontal grid with a 3-h time step and details can be found in Hodges et al. [
11]. This dataset has been successfully applied in a range of studies on tropical waves and convection e.g., [
7,
12]. The period of recording used here is from 1984 to 2008. The CLAUS T
B dataset is chosen because of its higher spatial resolution compared with other products that are used to study deep convection (c.f. outgoing long-wave radiation with a 1.0° daily grids, for example).
(c) ECMWF Interim Reanalysis
Dynamic, thermodynamic, and moisture fields are obtained from European Centre for Medium Range Weather Forecast (ECMWF) Interim reanalysis (ERAI). The ERAI is available at 6-h intervals on 37 pressure levels. We used a 1.5° horizontal grid. Details of the ERAI data can be found in Simmons et al. [
13] and Dee et al. [
14]. We used ERAI from 1984 to 2012. We compared ERAI composites and mean fields with the recently released ECMWF 5th generation reanalysis (ERA5) composites and found that the results are nearly the same. The only slight differences noted are ERAI composites are more smoothed compared with ERA5 composites.
Analysis Methods
Wavenumber-frequency filtering on CLAUS T
B data was performed following the method in Wheeler and Kiladis [
15], with a slight difference in that the filtering was carried out without separating the data into symmetric and anti-symmetric components e.g., [
2,
16]. KW filtering is carried out within the period 2.5 to 17 days and eastward wave number 1 to 14. African easterly wave activity was studied by retaining filtered data within periods 2 to 7.5 days and westward wavenumbers 6 to 20, also referred to as tropical depression-type disturbances–TD–in Kiladis et al. [
17].
Composite analyses were performed using dry and wet years, separately. These years were chosen based on ARC2 rainfall data (details in
Section 3 below). Dry and wet year composites are prepared using two ways: (1) composites based on average dry and wet rainfall seasons (time-based averages) and (2) regression composites—composites computed using linear regression as in Wheeler et al. [
18]. Regression composites are total fields correlated and regressed against a base-point time series and results are presented in the form of anomalies scaled by one standard deviation of the base point time series. The base-point time series is constructed based on the KW-filtered CLAUS T
B time series in Central Africa at 10° N, 20° E for dry and wet years, separately. We note that KW-filtered variance for the JAS season is a maximum near 10° N, 20° E in central Africa (
Figure 1). Therefore, regression composites for dry years are prepared by projecting total variables such as zonal wind or T
B onto KW-filtered T
B time series during dry years, and similar for wet years.
To provide context and facilitate interpretations, we present the mean environment using a suite of datasets in the next section.
3. KW and Rainfall Variability
Figure 1 presents the July to September (JAS) mean rainfall and KW variance (computed using KW filtered T
B). The JAS rainfall peaks near 10°–12.5° N including the highlands of Cameroon-Nigeria and sharply drops north of 15° N. Rainfall is also at a minimum south of about 7.5° N in West Africa (west of 5° E) as the season’s convective zone retreats to the north. Highest rainfalls are observed over West and East African highlands. The geographic distribution seen in the figure closely matches the known rainfall distribution e.g., [
19]. Maximum KW variance is seen over central Africa centered near 10° N, 20° E (box to the right in
Figure 1). Other KW-variance maxima are observed over equatorial eastern Atlantic and Indian oceans (not shown). The area of maximum KW variance (>20K
2) coincides with maximum rainfall over land and over the eastern Atlantic.
As shown in
Figure 1, rainfall over Africa presents strong variability across the continent and in time e.g., [
20]. Year-to-year variability of rainfall over West (10°–15° N, 15° W–10° E) and Central Africa (7.5°–12.5° N, 10°–30° E) is presented in
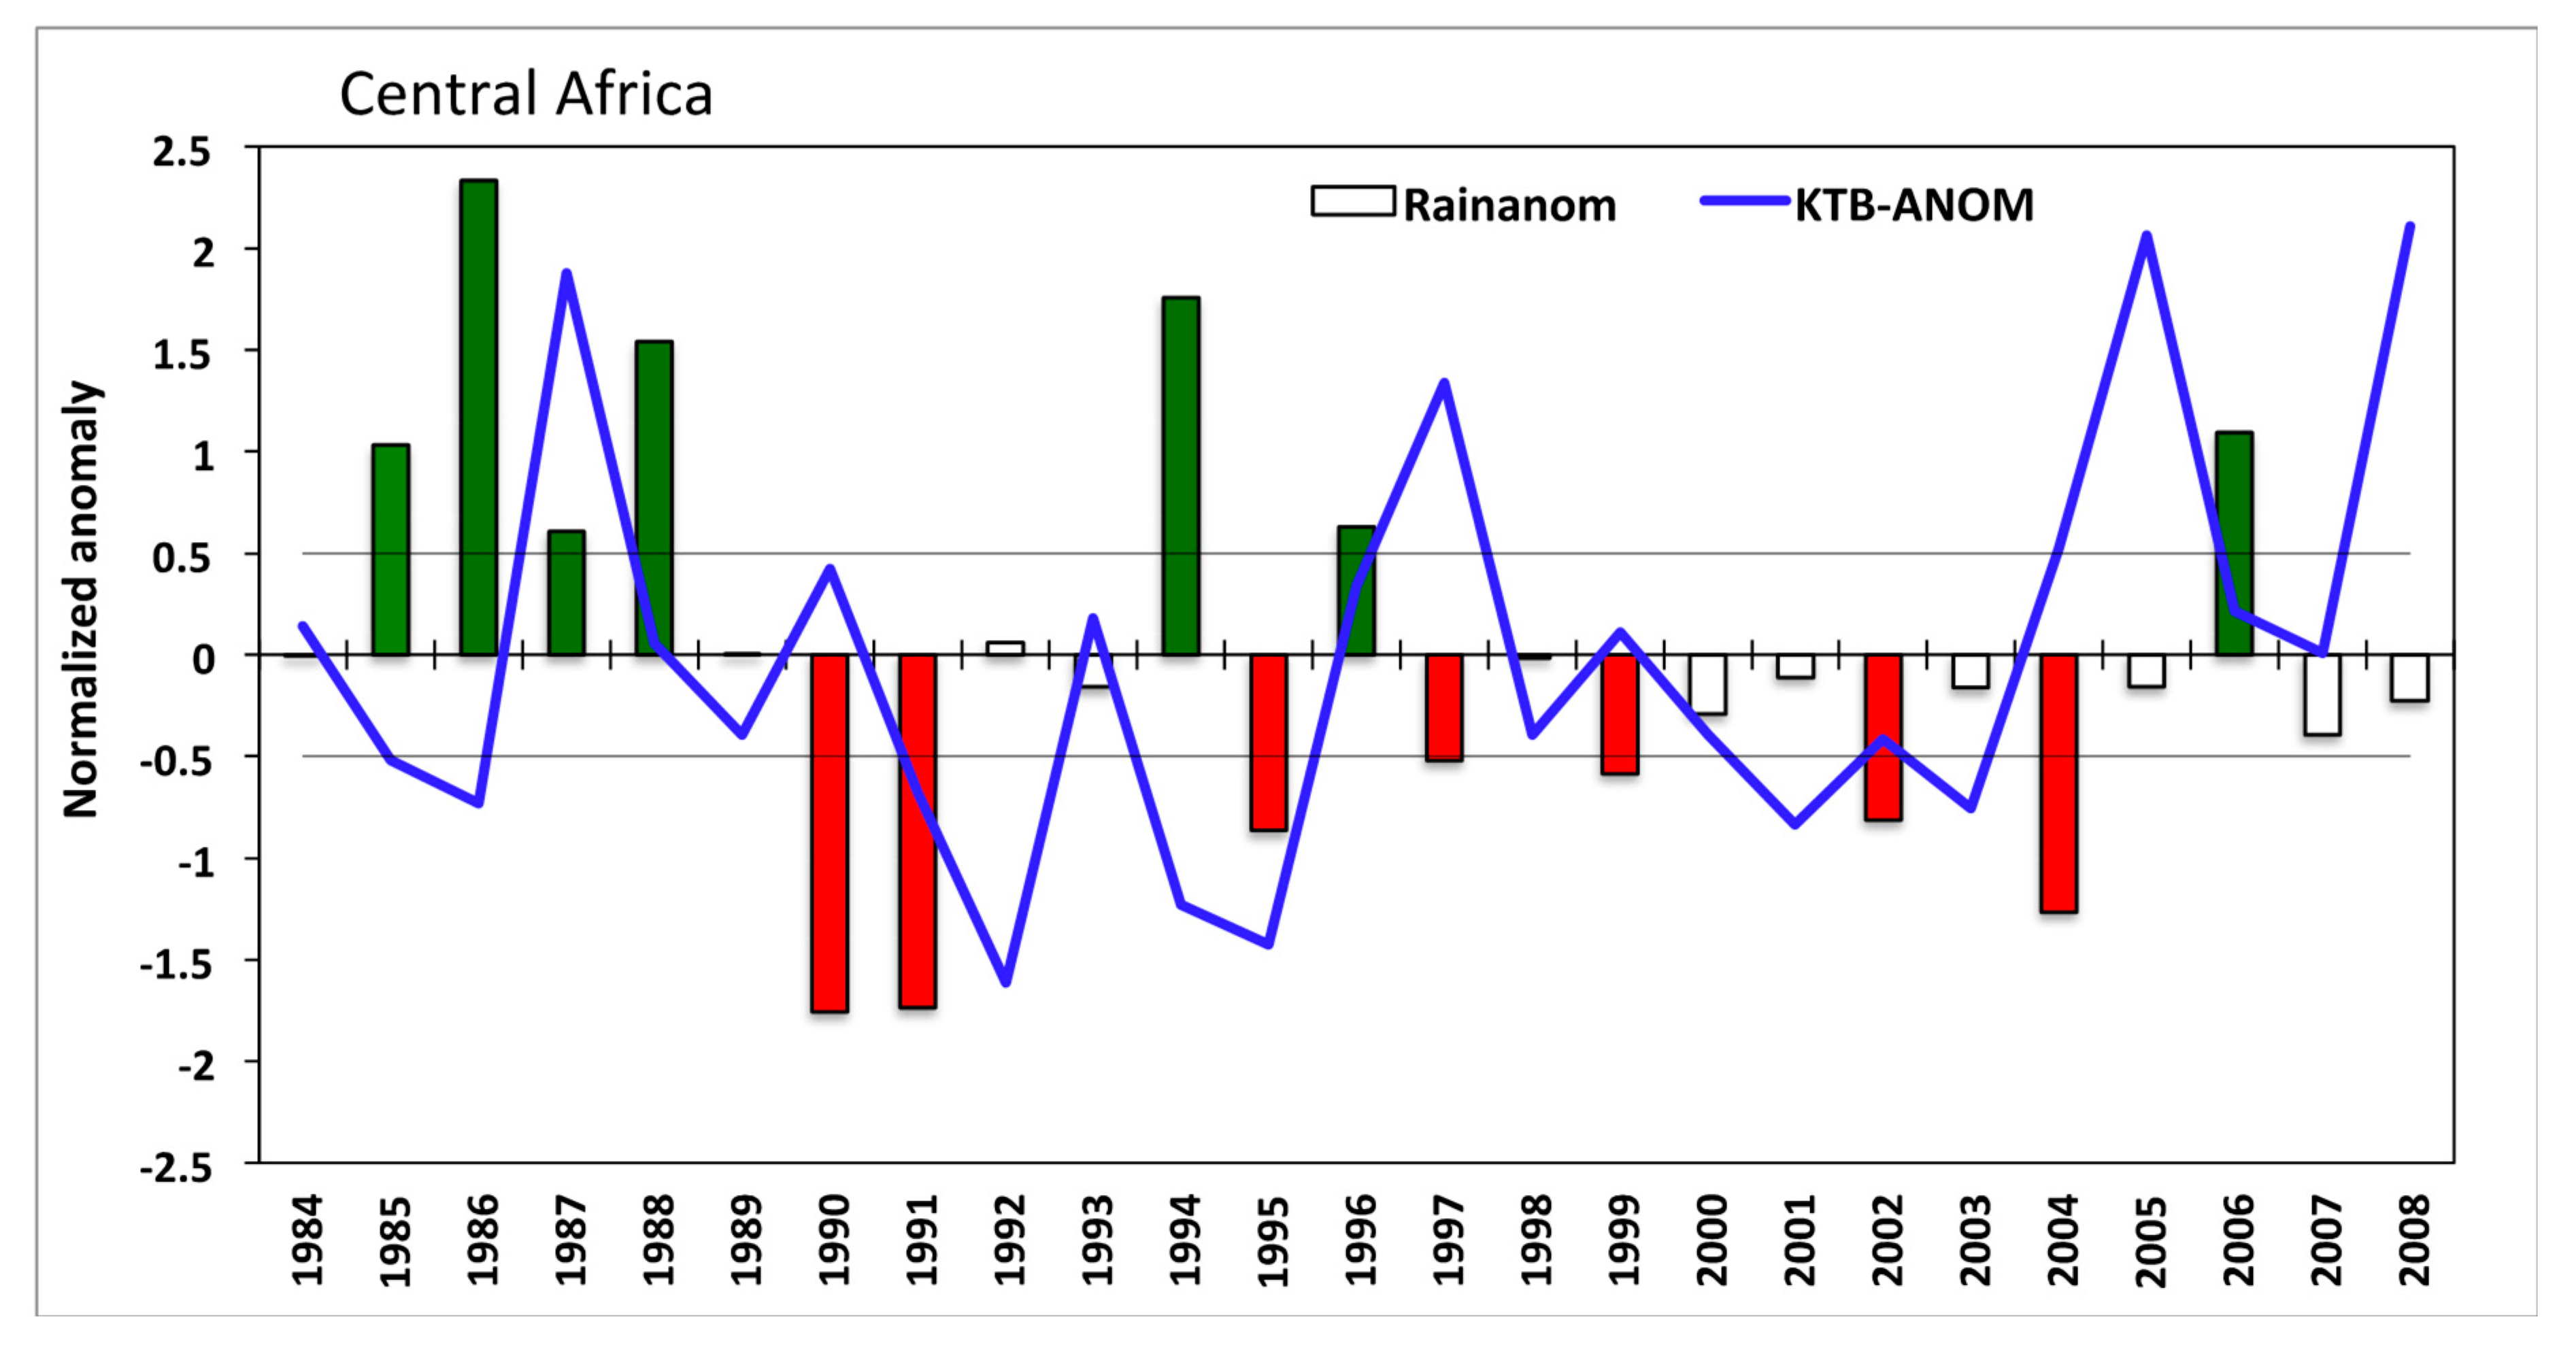
Figure 2. As shown in the figure, the JAS rainfall over northern Africa is highly variable. While 1998 was one of the wettest years (≥1.75σ) in West Africa, the year was drier than average in Central Africa. The 1986 season was one of the wettest (>2σ) for Central Africa, but it was only slightly above average for West Africa. While 1984 was a very dry year (1.75σ below-average) for West Africa, the rains were about average over Central Africa. Dry years in West Africa include 1987 and 1996, but these years were above-average for Central Africa. The marked variability in time and across the region might complicate separating dry and wet years for the whole of North Africa. However, since the KW variance peaks in Central Africa (
Figure 1), we base our dry and wet year separation using Central African rainfall variability (
Figure 3). This is also an important region where mesoscale deep convection that triggers AEWs intensifies. The KW–AEW–Convection interaction will be investigated later in this paper.
Figure 3 presents the year-to-year variability of KW variance (measure of KW activity) and rainfall over Central Africa (7.5°–12.5° N, 10°–30° E) during JAS. It is evident that KW activities are highly variable. KW activities were greater than 0.5σ in 6 out of 25 years, while lower than −0.5σ in 9 years. In particular, anomalously high KW variances (≥1σ) were observed in 1987, 1997, 2005 and 2008, while anomalously low activities (≤−1σ) were seen in 1992, 1994 and 1995.
Central African JAS rainfall was above-average (≥0.5σ) in 7 years, while below-average (≤−0.5σ) in 7 years. Anomalously high rainfall years include 1985, 1986, 1988, 1994 and 2006, while anomalously low rainfall years include 1990–1991, 1995 and 2004. We define dry and wet years in reference to 0.5σ of JAS normalized Central African rainfall (
Figure 3). A dry year is defined as rainfall ≤ −0.5σ and a wet year is defined as rainfall ≥ 0.5σ. African agricultural and hydrological activities are sensitive to rainfall changes, so anomalous rainfall significantly impacts many economic activities. The choice of 0.5σ as a threshold to distinguish dry and wet events is dictated by a consideration of susceptibility of economic activities and also in the interest of utilizing a sufficient number of representative samples in time. Based on this criterion, therefore, seven dry (1990, 1991, 1995, 1997, 1999, 2002 and 2004) and seven wet (1985, 1986, 1987, 1988, 1994, 1996 and 2006) years were identified (
Figure 3).
Several studies have found that dry years over North Africa are, in part, associated with warmer than normal periods of sea surface temperature (SST) or El Niño episodic events over equatorial East Pacific Ocean e.g., [
21]. The highest KW variances over Africa occurred in summer months of above-average SST years. Some of the highest KW activity years such as 1987, 1997 and 2004 were also strong El Niño years (A complete list of El- Niño and La- Niño years can be found online at reference [
22]). However, not all dry years and strong El Niño episodic years are high KW activity years. For example, 1991 and 2002 were anomalously dry years and strong El Niño years but KW activities during these years were below-average. KW anomalies are negative in five of the seven wet years, but positive in four of the seven dry years (
Figure 3).
The correlation between the concurrent Central African rainfall and KW activity is weak (−0.11). Mekonnen et al. [
2] observed a somewhat stronger negative correlation (−0.38) between KW activity and CMAP rainfall. The differences may be related to different datasets used. The CMAP rainfall used in Mekonnen et al. [
2] is much smoother (monthly time-step at 2.5° horizontal grid) and has a shorter period than used here. Novella and Thiaw [
10] have also indicated that ARC2 tends to underestimate rainfall over the eastern African highlands (the study area) compared with CMAP. Regardless, KW activity and rainfall anomalies were in opposite directions in about 10 out of 25 years, while in the same direction in 6 years. Mekonnen et al. [
2] discussed that KWs are more active during El Niño events, while African rainfall is negatively correlated with El Niño events. As discussed in the Introduction, most of JAS rainfall and deep convection over Africa is more strongly associated with AEW activities than KWs. It is unclear if AEWs still have a stronger impact during dry African years. Therefore, we investigate a hypothesis that most of the rainfall during the dry years is associated with more active KWs, rather than AEWs. To test this, we analyze the KW activity during dry and wet years, separately.
Figure 4 highlights the mean rainfall contrast between dry and wet years. As expected, the rainfall in dry years is lower in both area coverage and amounts. For example, mean rainfall in excess of 6 mm d
−1 covers a much smaller area over Central Africa (box region) in dry years compared with wet years. During wet years, rainfall more than 10 mm d
−1 (equivalent to about 920 mm per JAS season) is observed over high terrain in Ethiopia, Cameroon-Nigeria, and coastal West Africa, while similar rainfall amounts are largely absent in dry years.
Figure 4a,b shows that the local maximum and minimum rainfall occurs over similar locations during both dry and wet years. As seen in the figure, dry years rainfall is much less than wet years mean rainfall over Central Africa (bottom panel;
Figure 4). Next, we present dry and wet year composites of various field variables.
Figure 5a,b presents the dry and wet year differences in KW and AEW activities. The dry-wet year KW variances are positive almost over the whole central and western Africa, suggesting a more KW activity in dry years compared with wet years. The peak differences are seen over the maximum rainfall areas in JAS (
Figure 5a; c.f.
Figure 1). This is consistent with Mekonnen et al. [
2]; their Figure 7) who suggested that the number of KWs originating over the East Pacific and propagating over Africa is higher in dry years compared with wet years. As shown in
Figure 5b, dry–wet year AEW variances are negative in the peak summer rainfall areas of western and central Africa. This suggests that AEWs are less active in dry years compared with wet years, as may be expected. As noted in Mekonnen et al. [
6]; their Figure 13, the number of AEWs initiated over Central and East Africa is lower during dry years than wet years, which is associated with a reduced frequency of deep convective activity in East Africa in dry years.
As discussed above, KW activity during dry rainfall years is higher than wet years. KWs explain 4–10% of the total convective variance over the major rainfall areas across the region during dry years. Their contribution is smaller during wet years (3–6%). As shown in
Figure 1, the peak rainfall over eastern, central and western Africa ranges from about 6–12 mm d
−1, which is approximately 552–1104 mm per JAS season. Assuming a one-to-one relationship between deep convective and rainfall variability, KW would contribute about 22–40 mm of the JAS rainfall over West Africa and slightly higher over East Africa.
Rainfall over North Africa sharply declines from about 10 mm d
−1 over the peak rainfall zone to about 2 mm d
−1 near 15° N over a short north-south distance of 200–300 km (
Figure 1). This, in part, can be explained by a lack of moisture for deep convection over the region north of 15° N.
Figure 6 shows the 850 hPa mean specific humidity (q) and wind flow, and the humidity difference between dry and wet years (dry years q-wet years q). The maximum average q is located near 10°–12.5° N, in the same zone as the peak rainfall (cf.
Figure 1). Higher q values are associated with westerly and southwesterly flows that transport moisture from the Gulf of Guinea. Note that at 850 hPa, the flow converges between 15° and 20° N, equatorward of the surface monsoon wind convergence (aka as inter-tropical front), while peak q is located to the south between 10°–12.5° N. The specific humidity sharply decreases between 12.5° and 15° N. As discussed above, the sharp decrease in q, at least in part, explains the sharp decrease in rainfall over the same region.
Figure 6b shows the specific humidity difference between dry and wet years. As expected, q in dry years is lower than wet years. Coastal West Africa shows slightly higher magnitudes of dry year q compared with wet year q, which is consistent with the lack of correlation between Central African and West African rainfall (
Figure 2). Below, we investigate the role of KW in dry and wet years using regression composites computed using dry and wet year Kelvin filtered T
B time series at 10° N, 20° E.
4. Kelvin Wave Structures
Figure 7 presents regressed composite Hovmöllers of T
B and 850 hPa zonal wind for KWs in dry (left panel) and wet years (right panel). Composite anomalies, separately for dry and wet years, are computed by projecting T
B and zonal winds onto Kelvin filtered T
B time series at 10° N, 20° E. Overall, enhanced convection associated with KW coincides with the 850-hPa westerly anomalies, and suppressed convection was in-phase with easterly anomalies, as may be expected e.g., [
23]. Dry years have slightly deeper convective upstream signals compared with wet years over West Africa. Westerly zonal wind anomalies are stronger in dry years than in wet years over the region. Results show that KWs have a stronger impact on the low-level zonal flow, which is consistent with Matthews [
9]. Next, we investigate the influence of KWs on moisture flux by the zonal wind during dry and wet rainfall years.
Figure 8 presents regressed composite anomalies of the 850 hPa zonal moisture flux (qU; where q is specific humidity and U is the zonal wind) associated with KWs over North Africa during dry and wet rainfall years, from day −1 to day +2. Generally, zonal moisture fluxes in dry years are greater in amplitude compared to those in wet years (values > 0.7 × 10
−6 ms
−1·gkg
−1 at day 0 in dry years, for example). Enhanced KW convection is associated with positive (eastward) moisture transport by the zonal wind and suppressed KW convection is associated with negative (westward) moisture transport. At day −1, positive zonal moisture flux and associated enhanced KW convection are located over West Africa spreading eastward and equatorward. At day 0, peak zonal moisture flux and peak KW convection are located near 10° N, 20° E, in the region of peak KW activity (cf.
Figure 1) and together propagate eastward about 10° a day for the next two days. At day 2, the signals of zonal moisture flux and KW convection are seen over East Africa near 40° E but weakened. Overall,
Figure 8 suggests that KWs have a relatively higher influence on zonal moisture flux in dry years compared with wet years.
In addition to its influence on convection, lower tropospheric wind circulation, and moisture transport, KW passages impact AEW initiation and their westward progression over Africa [
1,
3]. However, as shown above, and as implied in Mekonnen et al. [
2], we argue that KWs have a different level of influence on AEW initiation and westward propagation in dry versus wet years. Below, we investigate the impact of KWs on AEW activity. The AEW activity is represented by TD-filtered T
B variance e.g., [
7].
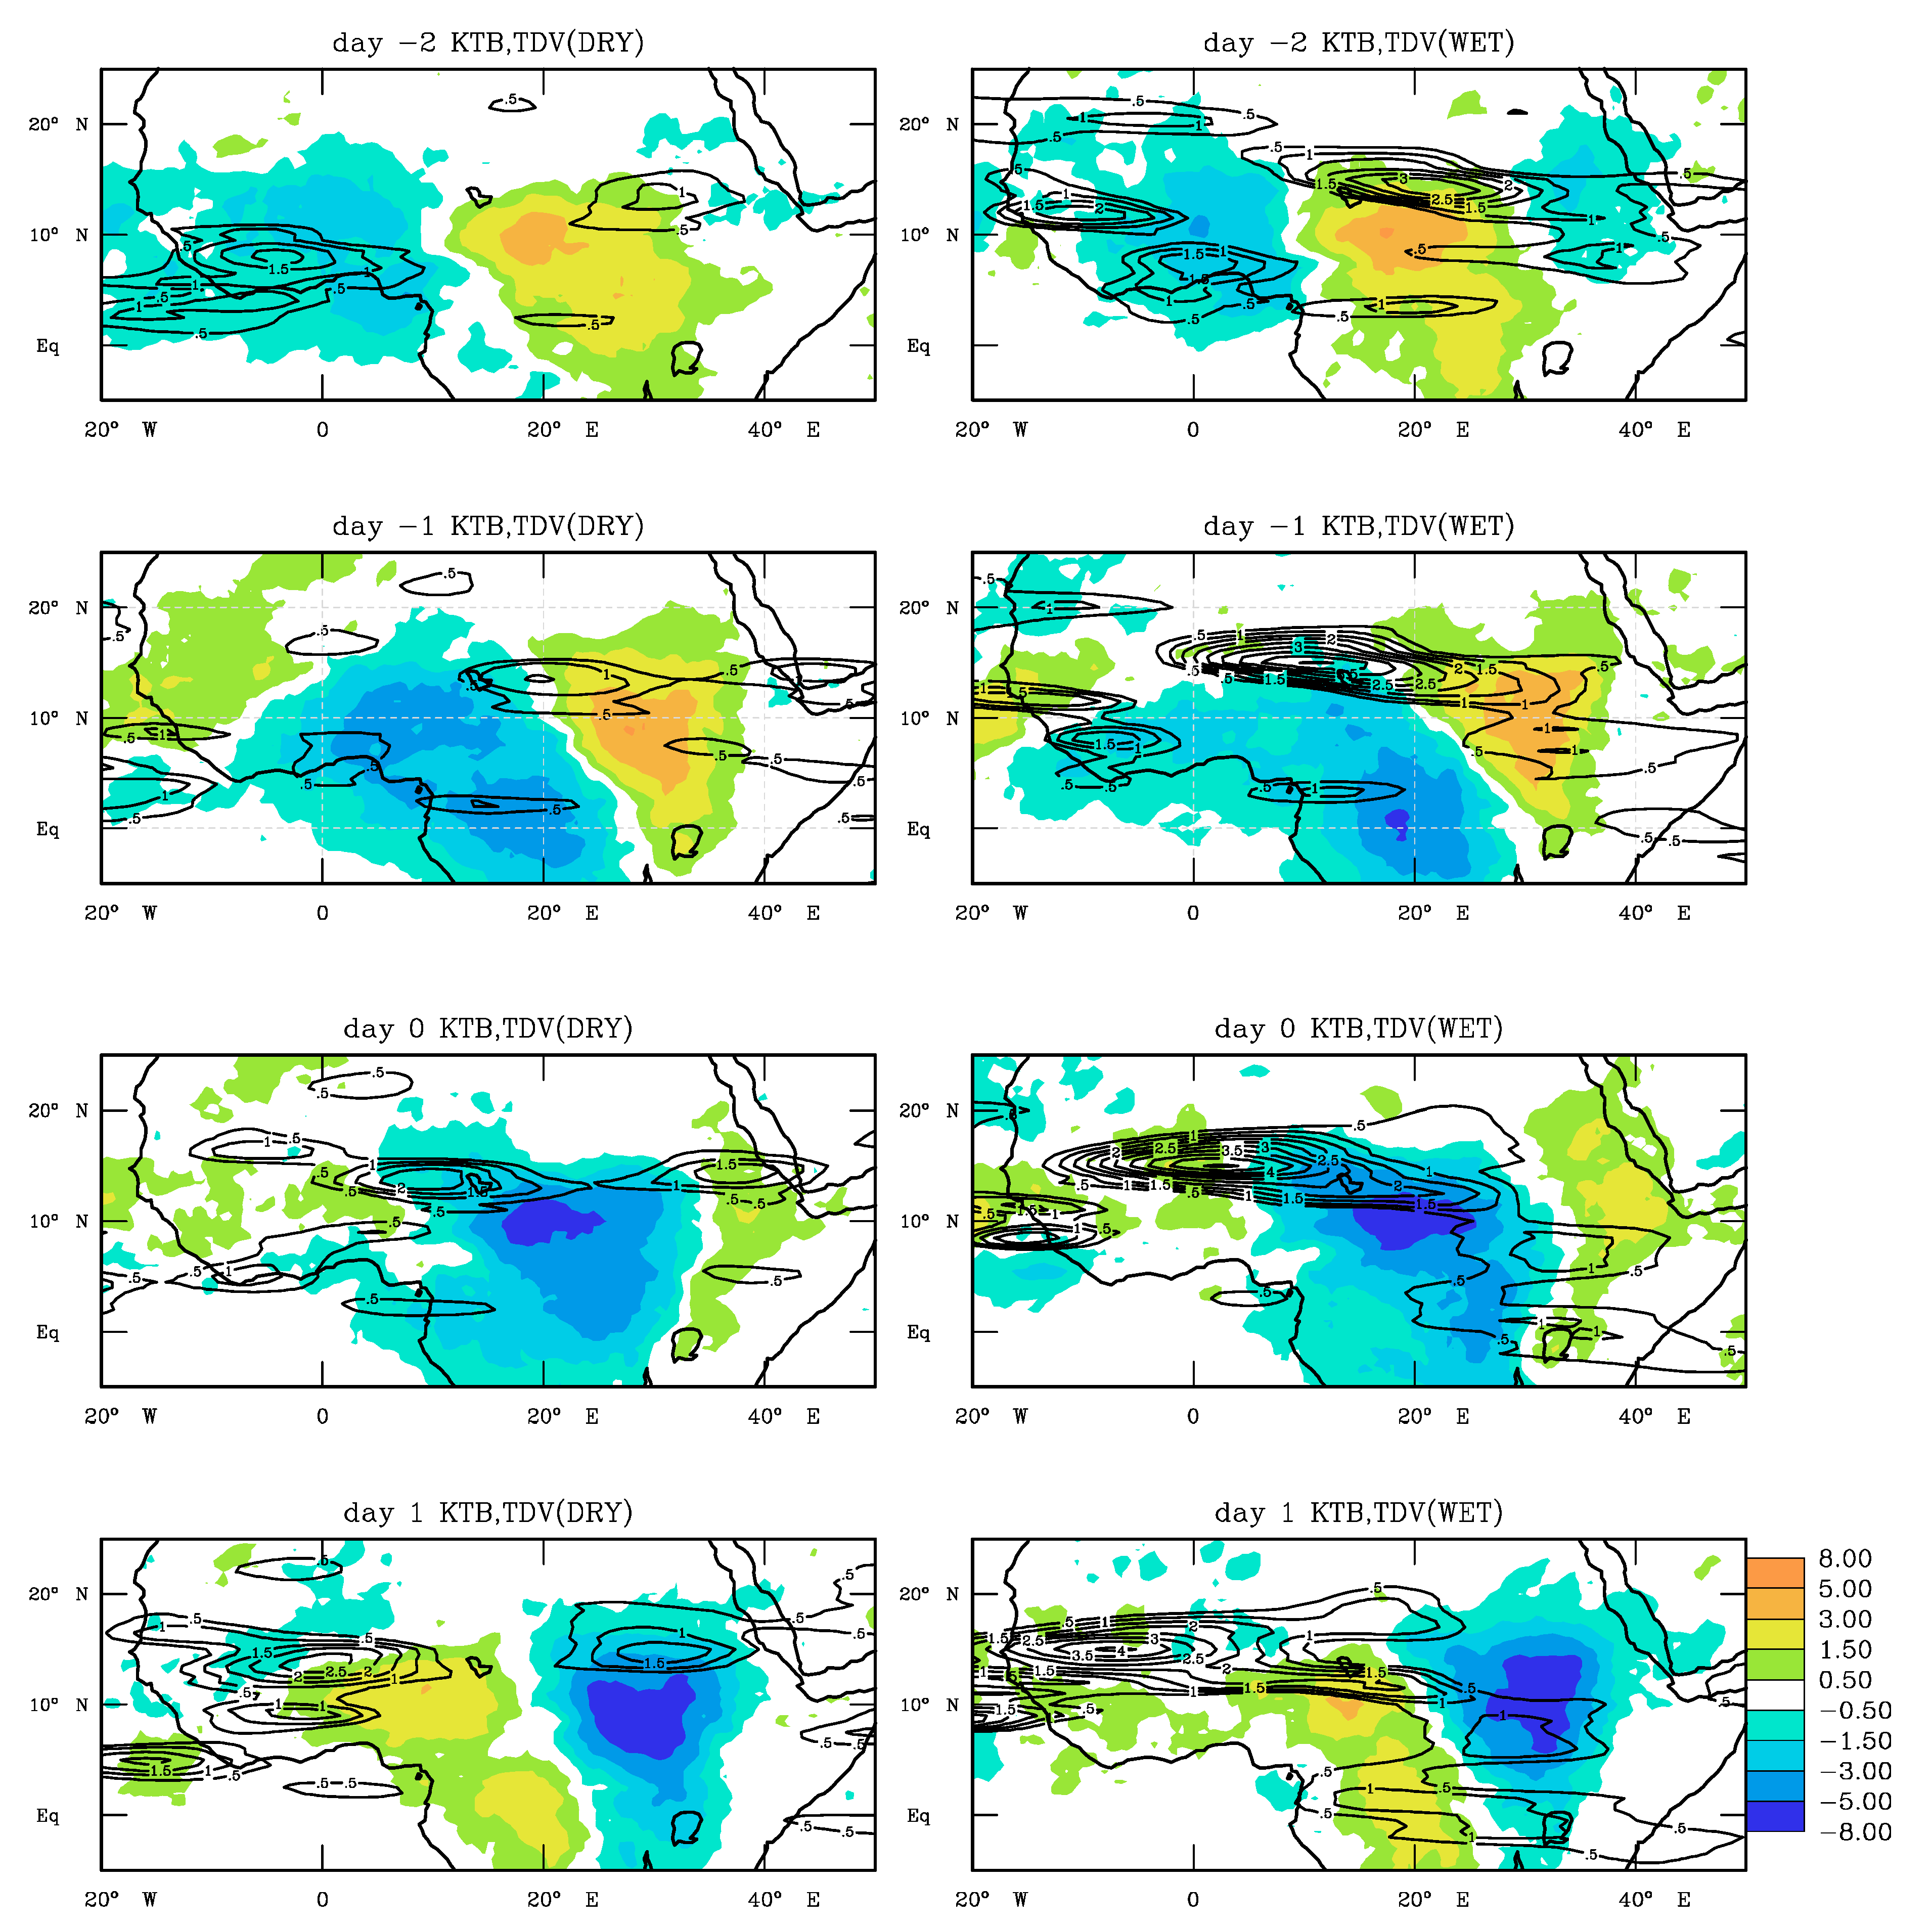
Figure 9 shows composite anomalies of AEW variance projected onto Kelvin filtered T
B time series at 10° N, 20° E from day −2 to day +1 in wet and dry years. Composites of KW T
B anomalies are reproduced for comparison. Dry year composite anomalies are shown on the left and wet years on the right panels. Enhanced KW convection entered the west coast at lag day −3 (not shown). At day −2, the enhanced KW phase is located over West Africa, while the suppressed phase dominated Central Africa in both dry and wet years. At day −1, as enhanced KW moved farther east and located between 10–20° E. Also, at day −1, weak but positive AEW anomalies are seen to the east of enhanced KW in dry years, while much stronger positive AEW anomalies are seen slightly to the north of peak KW convection in wet years. The wet year strong positive AEW anomaly can be traced back to East Africa at day −2 while the enhanced KW phase is still over West Africa. This suggests that enhanced AEW activity during wet years is less influenced by KW activity.
At day 0, the enhanced KW phase arrived in Central Africa in both dry and wet years. In dry years, positive AEW anomalies are seen in the same region with the peak slightly to the west of the maximum KW phase. By comparison, wet year AEWs, at day 0, are significantly strengthened and peak activity is seen about 2000 km to the west of maximum enhanced KW over Central Africa. While dry year positive AEW activity increases in association with KW passage, wet year AEW activity does not appear to draw its strength from KW activity. At day 1, both dry and wet year AEWs increase in strength in West Africa. Wet year AEWs appear to be about twice as strong as dry year AEWs. Several past works e.g., [
8] showed that AEWs form in association with strong mesoscale deep convection over the high terrain in East Africa, indicating that the wet year AEW activity is strongly influenced by locally generated deep convection in East Africa e.g., [
18]. On the other hand, the frequency and intensity of deep convection over East Africa decrease, in part, in association with warmer than normal SSTs over the East Pacific [
21]. As described earlier, KWs generated more frequently and are more active in warmer East Pacific episodic years e.g., [
2].
A simple interpretation of these results (
Figure 9) is that KW convection is more active in dry years compared with wet years over Africa, and hence, a KW passage has a stronger influence in dry years than in wet years. As suggested in Mekonnen et al. [
2], a plausible explanation of KW influence being stronger in dry years than wet years is related to increased initiation of KWs due to enhanced convection over warmer than normal SSTs over the eastern equatorial Pacific. In contrast, colder SSTs would mean suppressed convection locally which may result in fewer KW initiations. As discussed earlier, colder than normal equatorial Pacific SSTs are associated with wet African rainfall years. Additionally, wet rainfall years are characterized by frequent mesoscale deep convection and that is conducive for more AEW activity e.g., [
8], irrespective of KW presence. Thus, as shown in
Figure 5 and
Figure 9, AEWs are more active in wet years compared with dry years and the role of KW on AEW activity seems to be low in wet years.
5. Conclusions
This study has highlighted the influence of Kelvin wave (KW) activity on deep convection and African easterly waves (AEWs) over North Africa during the July to September season by separating dry and wet rainfall years. Results show that the passage of Kelvin waves over Africa influences the lower tropospheric circulation and humidity patterns including convection, in agreement with past studies. Our study shows the impact of propagating KWs is stronger during the African dry rainfall years compared with wet rainfall years.
KW activity (measured by KW filtered T
B variance) is higher during the dry years compared with wet years. More frequent and higher amplitude KW activities are related to warmer than normal sea surface temperature (SST) over the equatorial East Pacific, the KW initiation region as suggested in Mekonnen et al. [
2]. Warmer than normal equatorial East Pacific SSTs coincide with El Niño episodic years, which are known to have a negative correlation with summer rainfall over North Africa e.g., [
21]. Past studies have shown that rainfall over Africa is mainly associated with mesoscale deep convection and AEWs. Results show that AEWs are more active during the wet years and weaker during dry years (
Figure 5). Although dry years are characterized by less frequent deep convection, AEWs can still form and propagate in dry years. We note that local convection is not the only pathway to AEW development e.g., [
24]. This implies that AEWs weakly coupled to deep convection in dry years may be mainly dry waves. In contrast, KW activity is stronger and convection is enhanced in association with KWs in dry years. This suggests that rainfall in dry years is more influenced by KW activity than AEW activity, while wet year rainfall is more influenced by AEWs.
Composite analysis based on linear regression shows that deep convection associated with KWs is slightly more amplified in dry years compared with wet years. KW passage over North Africa has a stronger influence on lower level zonal flow in dry years compared with wet years. In addition, zonal moisture flux associated with KWs is higher in amplitude in dry years compared with wet years. The potential impact of KWs on AEW activity was also examined. Results show that, on average, enhanced KW convection is correlated with above-average AEW activity in dry years. In contrast, in wet years, out-of-phase relationship between enhanced KW convection and above-average AEW activity is observed (
Figure 9). As described in
Section 3 and
Section 4, KW activity over Africa is enhanced during the dry African years. Most of the dry African years (
Figure 2) were also warmer than normal SST years over the equatorial eastern Pacific. During the normal Pacific SST years, the east-west circulation (aka Walker’s circulation) over the Pacific basin and an ascending branch over Africa are dominant patterns in the general tropical circulation. This normal east-west circulation either weakens or shifts eastward from the western Pacific Warm pool region during the warmer than normal years and this happens to coincide with most African dry years e.g., [
21]. Also, as shown in past work e.g., [
6], AEWs initiation is more frequent over eastern Africa in association with more frequent deep convective activity over the region. In contrast, a lower frequency of convection during the dry years means less potential for AEW initiation. So, it is not surprising that the KW–AEW correlation during the wetter than normal African years is out of phase. However, AEW initiation and deep convective activity in dry years are related to enhanced KW activity as found here. This was also described in a synoptic case study in the past e.g., [
2]. Mekonnen et al. [
2] showed that most of the AEW initiation in the summer of 1987 was related to deep convection over East Africa triggered by KW activity.
In conclusion, the evidence in this study suggests that the impact of KWs over Africa during summertime is stronger during dry years than wet years. Therefore, forecasters should be considering KW events propagating into the region from the west, particularly in dry years. It is to be noted that a slight increase in rainfall in association with a propagating wave can have an important influence on agriculture and hydrologic activities over Africa. A better understanding of the role of KW activity, particularly in dry years, that has the potential to influence deep convection and rainfall can be critical for economic planning.


