Article

Changes in Tropical-Cyclone Translation Speed over the Western North Pacific

1
College of Oceanography, Hohai University, Nanjing 210098, China
2
State Key Laboratory of Satellite Ocean Environment Dynamics, Second Institute of Oceanography, Ministry of Natural Resources, Hangzhou 310012, China
3
Southern Laboratory of Ocean Science and Engineering Guangdong Laboratory (Zhuhai), Zhuhai 519082, China
4
State Key Laboratory of Tropical Oceanography, South China Sea Institute of Oceanology, Chinese Academy of Sciences, Guangzhou 510301, China
5
Innovation Academy of South China Sea Ecology and Environmental Engineering, Chinese Academy of Sciences, Guangzhou 510301, China
*
Author to whom correspondence should be addressed.
Atmosphere 2020, 11(1), 93; https://doi.org/10.3390/atmos11010093
Submission received: 8 December 2019 / Revised: 4 January 2020 / Accepted: 8 January 2020 / Published: 13 January 2020
(This article belongs to the Section Meteorology)

Abstract

:
The trend of tropical-cyclone (TC) translation speed is a hot topic recently. Changes in TC translation speed during 1949–2017 over the western North Pacific are analyzed using two best-track datasets here. The TC translation speed decreased during 1949–2017, but there was no significant trend after 1981. The TC translation speed also changes with latitude and intensity. In the tropical ocean, TC translation speed decreased by 5.9% during 69-year recording period. North of 23.5° N, the changes in translation speed is highly consistent with the latitude of TC occurrence. The translation speed of tropical depressions showed no significant trend during the period 1949–2017, but the translation speed of typhoons decreased over the 69-year recording period. The period 1949–1981 contributed most of the slowdown trend. There also was an increase in the frequency of typhoons with translation speed slower than 6 m/s. The decrease of translation speed of typhoons before 1981 was likely caused by the weakening of the summertime tropical circulation.

1. Introduction

As one of the most destructive weather systems on Earth, tropical cyclones (TCs) often cause significant human and property loss in coastal areas. Hence, the changes in TC behavior are of great concern in past years [1,2,3,4,5,6,7,8,9]. Recently, Kossin found that global TC translation speed slowed down by 10% during the period 1949–2016 [10]. And he speculated that the slowdown of TC translation speed may be caused by the weakening of summertime tropical circulation affected by the anthropogenic warming. He further raised that the local rainfall totals would increase potentially with the slowdown of translation speed. However, Moon et al. put forward that the missing data in TC best-track dataset before satellite era (1949–1965) would produce spurious trends in TC translation speed [11]. Another point they discussed is that the high latitudinal dependency of TC translation speed could strongly influence the global trend by the data inhomogeneity. Kossin also acknowledged that the slowdown trend had a latitudinal component, which was unclear whether it was due to the data inhomogeneity or was a climate signal (or both) [12]. Lanzante raised that the long-term changes in TC translation speed appeared to be a few step-like changes, which were largely associated with the natural internal climate variability and introduction of satellite data [13]. Chan also disagreed with Kossin and believed that the introduction of satellite capabilities since 1970s could influence that results to a great degree. Further, he even found a significant speedup of global TC translation speed over land after 1970 [14]. Therefore, it is still controversial about the slowdown trend in global TC translation speed.
Furthermore, Kossin found a decrease in TC translation speed using a longer and more reliable TC data over the continental USA [12]. Further, he proposed that it supported the existence of the slowdown trend in TC translation speed in a particular region, which provided some confidence in the reliability of decrease in TC translation speed observed in other broader regions. It cannot be neglected that the considerable variations in inter-basin TC translation speed and occurrence frequency may lead to inaccurate global trends in translation speed. Therefore, the analysis of changes in TC translation speed over different basins is vital and necessary to discuss the dispute mentioned above. In western North Pacific, the TC occurrence frequency accounted for 30% of the total global TCs [15]. Hence, we only focus on the changes in TC translation speed over the western North Pacific in this study, which we believe to be more reliable and worth exploring.
So far, the studies of changes in TC translation speed over the western North Pacific generally gave an overall trend and were lack of adequate detailed analysis. For the studies of trends in TC behavior over the western North Pacific, there existed significant discrepancies in the results based on different datasets [16,17,18,19,20,21]. This presents the question whether the trends in translation speed result from the discrepancies in TC best-track dataset themselves. Here, we investigated the changes in TC translation speed over the western North Pacific in different areas and intensities using two TC best-track datasets, and briefly discussed the potential reasons for the changes in translation speed as well. The rest of this paper are organized as follows. Section 2 describes the data and methods. Section 3 considers the changes in TC translation speed over the western North Pacific. In Section 4, a summary and discussion are presented.

2. Data and Methods

The TC best-track datasets used in this study are obtained from the China Meteorological Administration (CMA, http://www.typhoon.org.cn) [22] and the Joint Typhoon Warning Center (JTWC, https://pzal.ndbc.noaa.gov/collab/jtwc) [23], which could provide the TC location and intensity (maximum wind speed) at 6-h intervals over the western North Pacific (WNP) during the period 1949–2017. There exist some variations in the two datasets, such as the maximum wind speed which is 2-min mean wind speed in CMA while is 1-min mean wind speed in JTWC. Each of the two datasets has individual characteristics and advantages, and it is hard to say which one is better for analyzing the TC activities over the western North Pacific [24,25].
The TC translation speed is calculated using the geographic distance between two successive TC locations at 6-h intervals. The geographic distances are calculated between a pair of latitude/longitude points on the Earth’s surface, which is based on the World Geodetic System 1984 (WGS-84) model for the Earth ellipsoid. The trends in this study are obtained using linear regression analysis. Statistical significance is based on the P value of the F statistic. The F statistic is the test statistic of the F-test on the regression model, for a significant linear regression relationship between the response variable and the predictor variables.
The percentage change is calculated by the difference of the last point and the first point of the best-fit trend line divided by the first point. The wind speed at 500 hPa is obtained from the National Centers for Environmental Prediction/National Centers for Atmospheric Research (NCEP/NCAR) reanalysis monthly mean data (https://www.esrl.noaa.gov/psd/data/gridded/data.ncep.reanalysis.derived.pressure.html) [26].

3. Results

The changes in annual mean TC translation speed over the western North Pacific are showed in Figure 1. Two datasets of the CMA and JTWC were used here to exclude the possibility that the trends in translation speed resulted from the discrepancies in TC best-track dataset themselves. Although the changes in TC translation speed exhibited considerable differences in the two datasets, they showed the same trends in TC translation speed: a significant slowdown over the 69-year period of the record 1949–2017 (Table 1). We divided the full study period into two periods (1949–1981 and 1982–2019), considering that the full global coverage of the geostationary satellites began in approximately 1981 [27]. We found that the TC translation speed decreased by 9.6% in CMA data set and even 15.5% in JTWC data set during the period 1949–1981. Unfortunately, there was no significant trend after 1981 when the TC best-track data were more reliable. The results before 1981 need further discussion to determine whether there is a real downward trend in TC translation speed. Nevertheless, it at least means that the TC translation speed in western North Pacific is not decreasing all the time. In other words, it is not a major concern in this region that the rainfall totals would be compounded in the future as a result of the slowdown of TC translation speed.
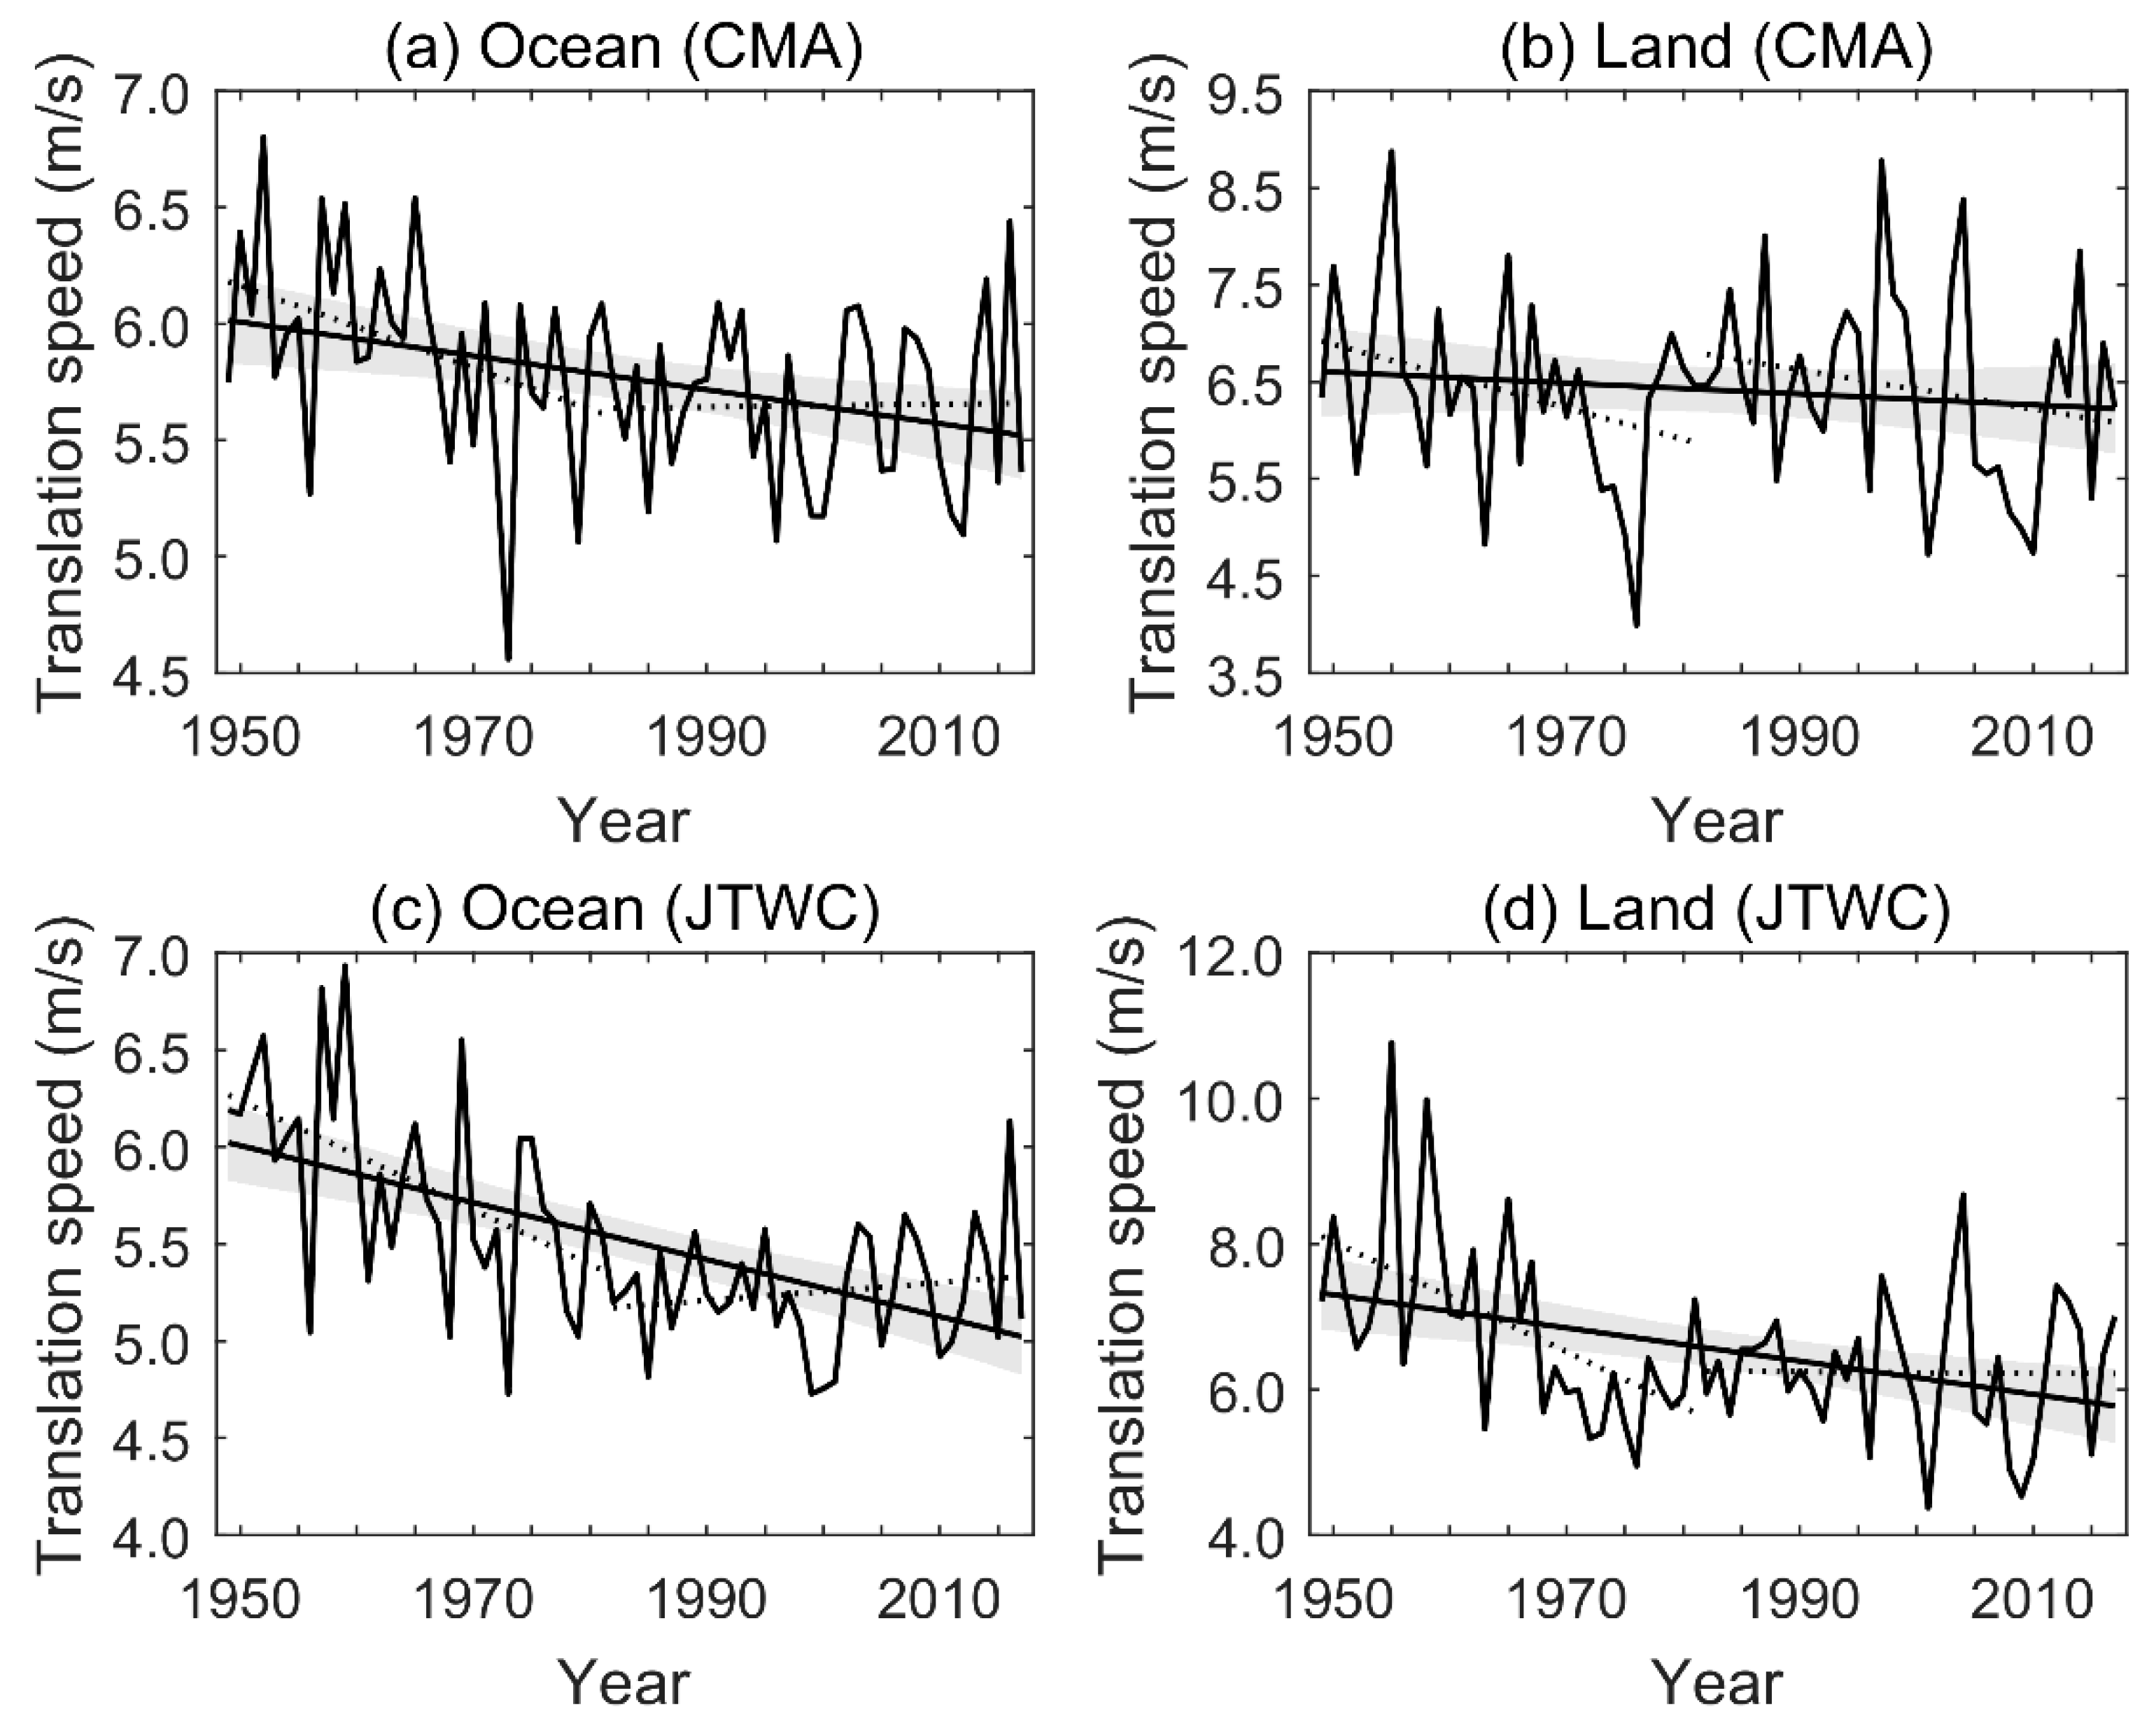
Considering the mean TC translation speed is faster over land than over the ocean, any of the TC data inhomogeneity over land and the ocean may affect the trend in TC translation speed. Hence, we separated the ocean data from the land data to study the annual mean TC translation speed (Figure 2). There was also a decreased trend in the TC translation speed over the ocean during the period 1949–2017 (especially the period 1949–1981), which was very similar to the results in Figure 1. This was related to the fact that the number of TC position points over the ocean accounted for above 90% of the total. Furthermore, it was obvious that the TC translation speed over land also decreased before 1981, although there was no significant trend in the TC translation speed over land during the entire recording period. Chan found a significant speedup of global TC translation speed over land after 1970 [14], but here we showed that the TC translation speed over land in western North Pacific had no significant trend after 1981.
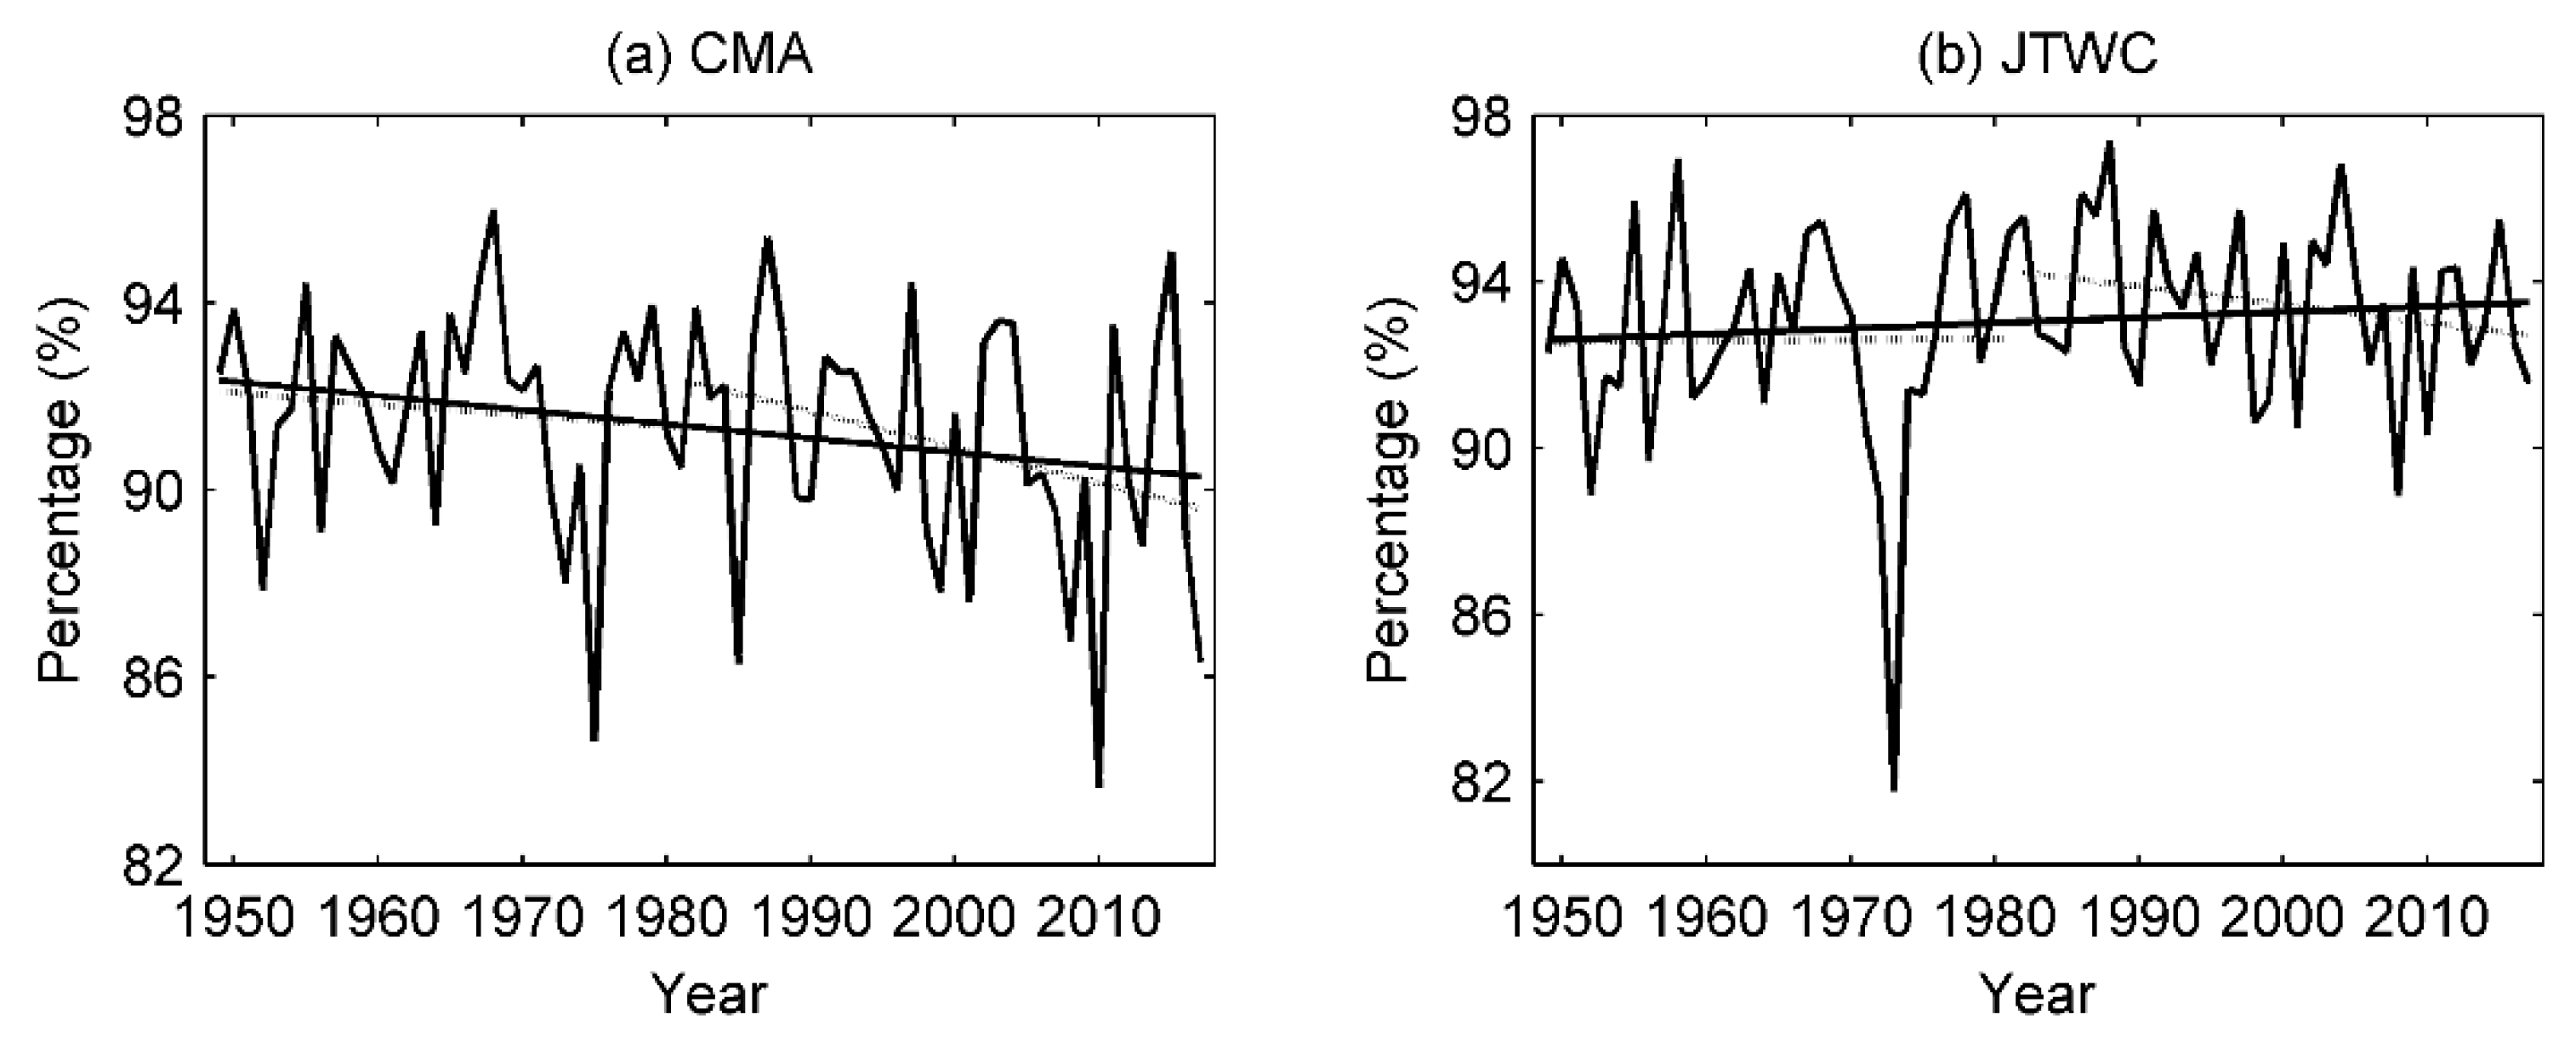
Moon et al. discussed that there was a dramatic increase in the percentage of annual number of global TC position points over ocean after 1981 than the pre-satellite era (1949–1965), which may probably produce unreliability in the trend [11]. Hence, we calculated the percentage of the number of TC position points over the ocean in western North Pacific (Figure 3). This indicated that the percentage was almost unchanged during the two periods (1949–1981 and 1982–2017), which was 91.9% and 91.2% in CMA dataset respectively. Therefore, the slowdown trend in TC translation speed over the ocean in western North Pacific is relatively acceptable.
The results of the annual mean TC translation speed over the whole region may mask some considerable information, such as the variations of translation speed by latitudes and intensities. Hence, the changes in TC translation speed over the ocean in different latitudes and intensities will be further discussed below.
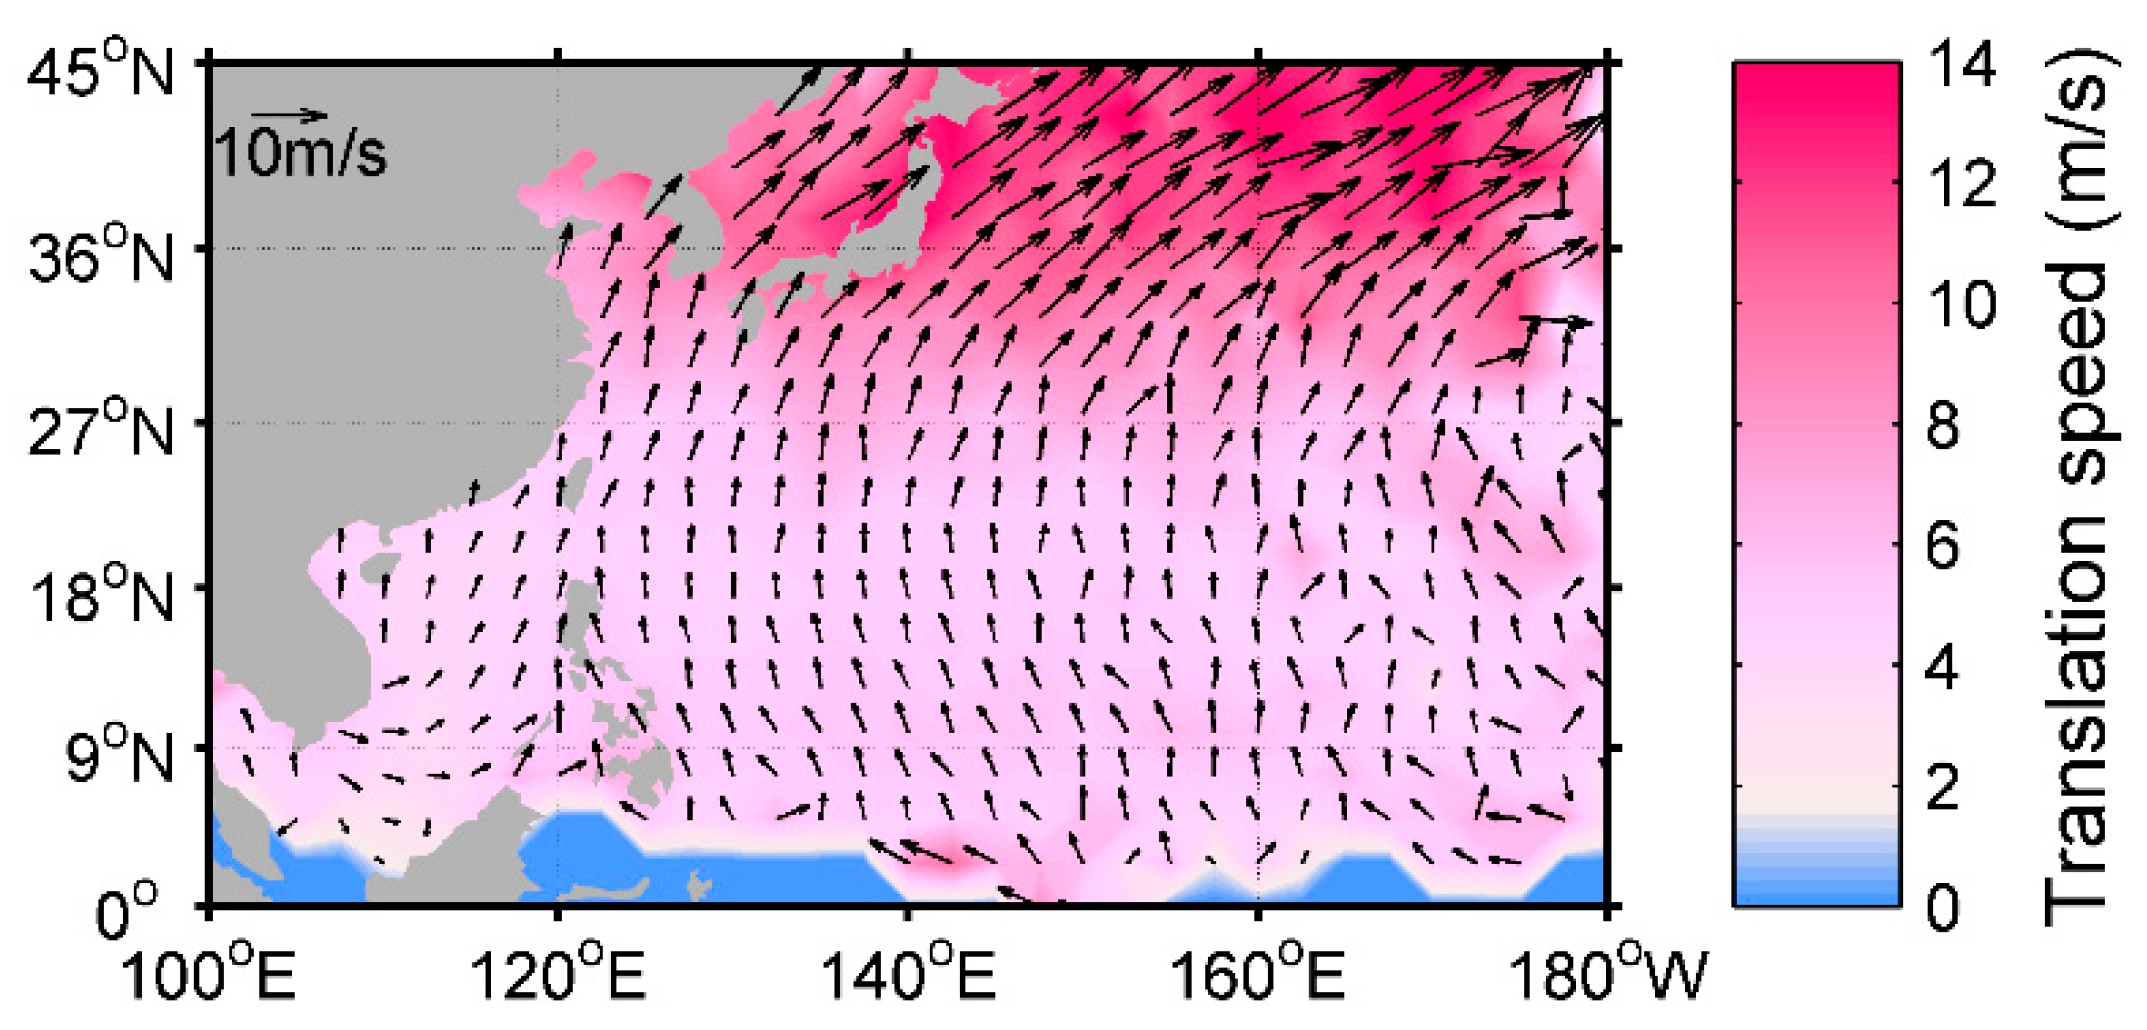
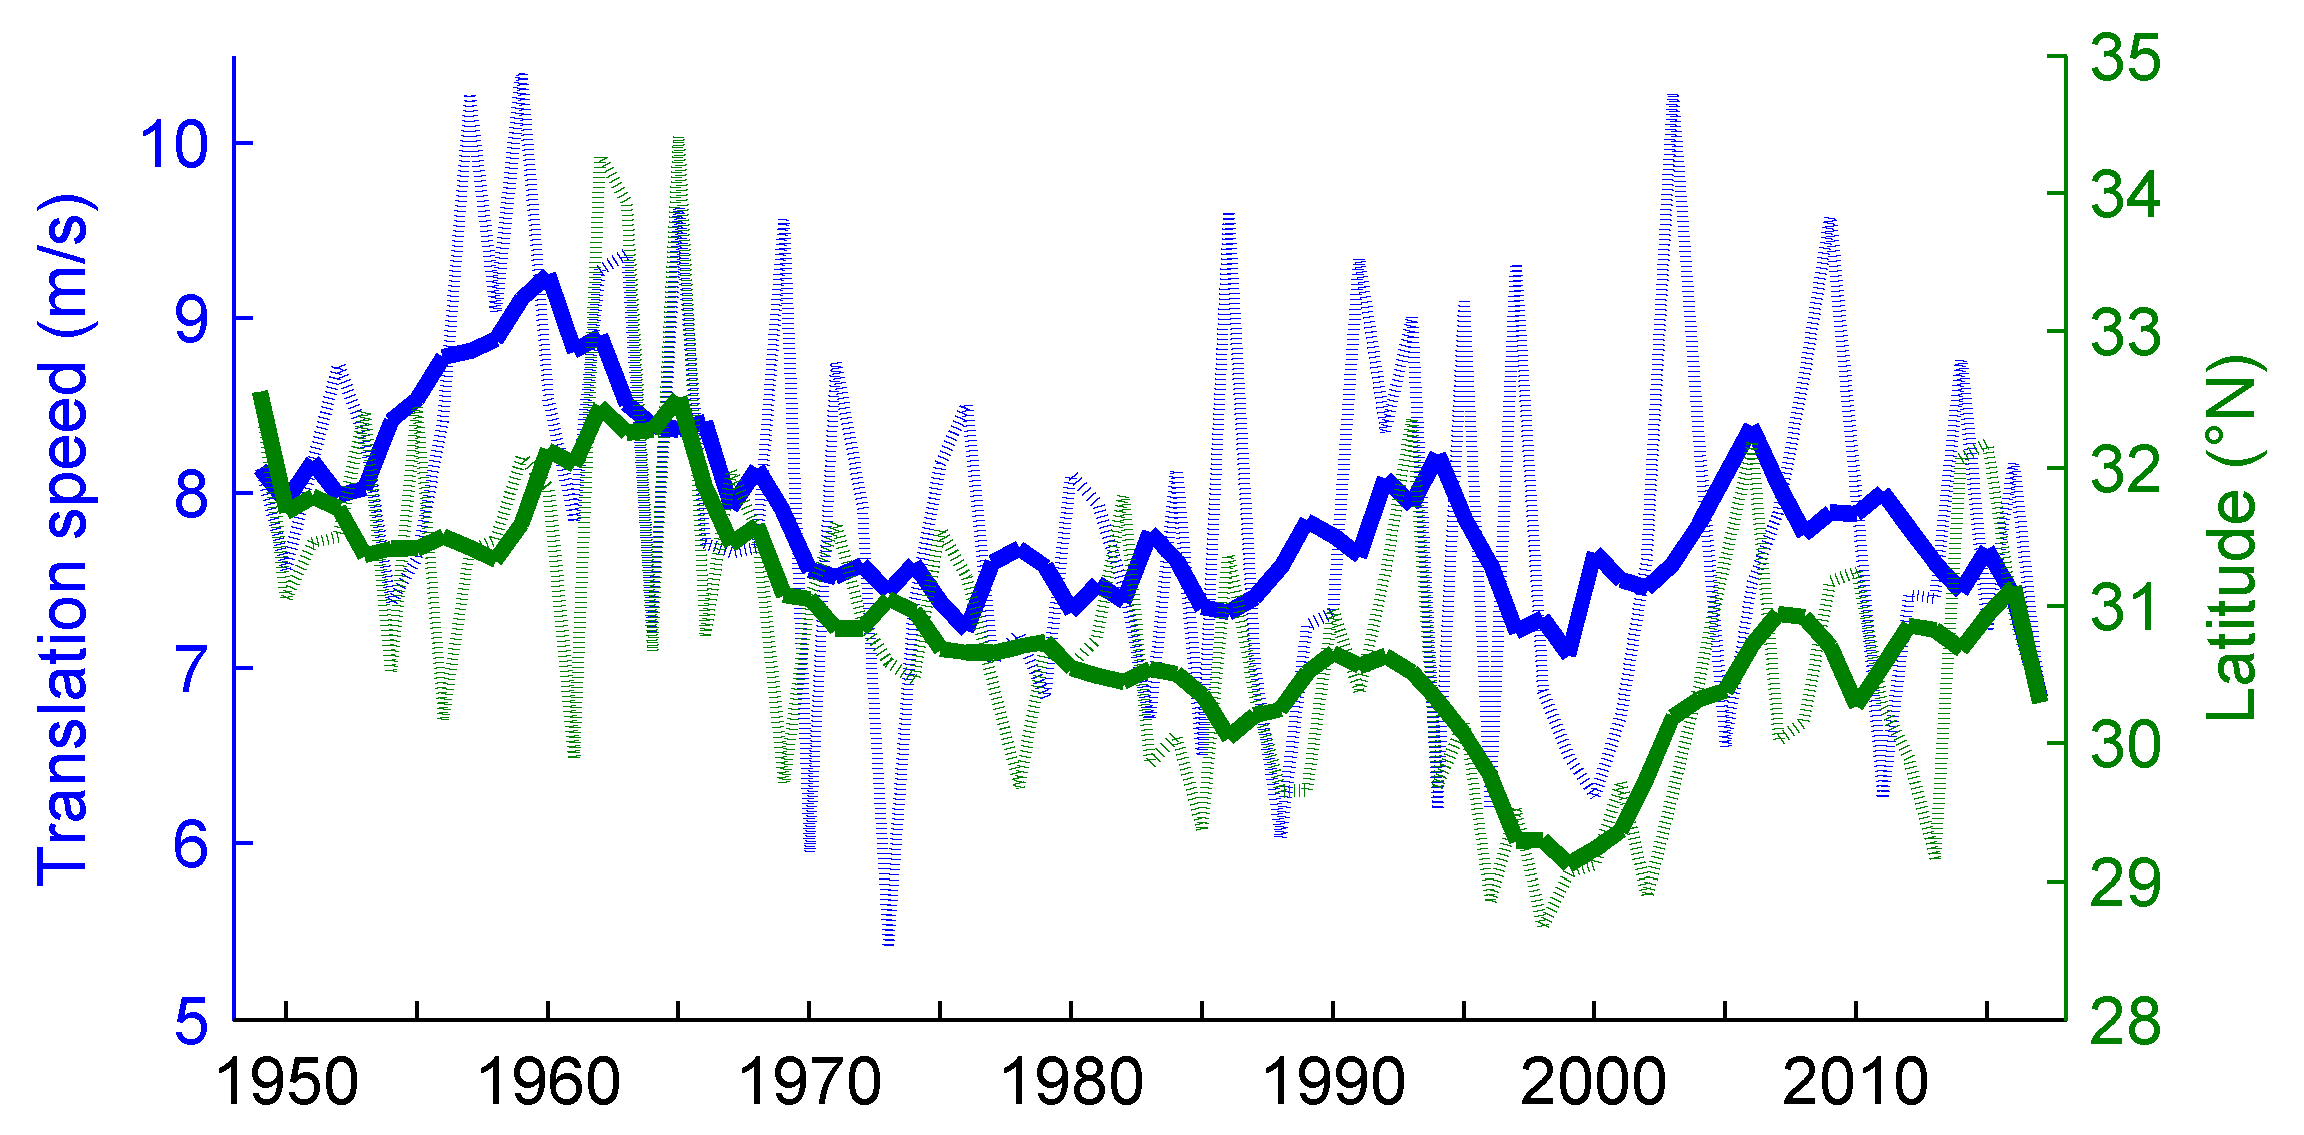
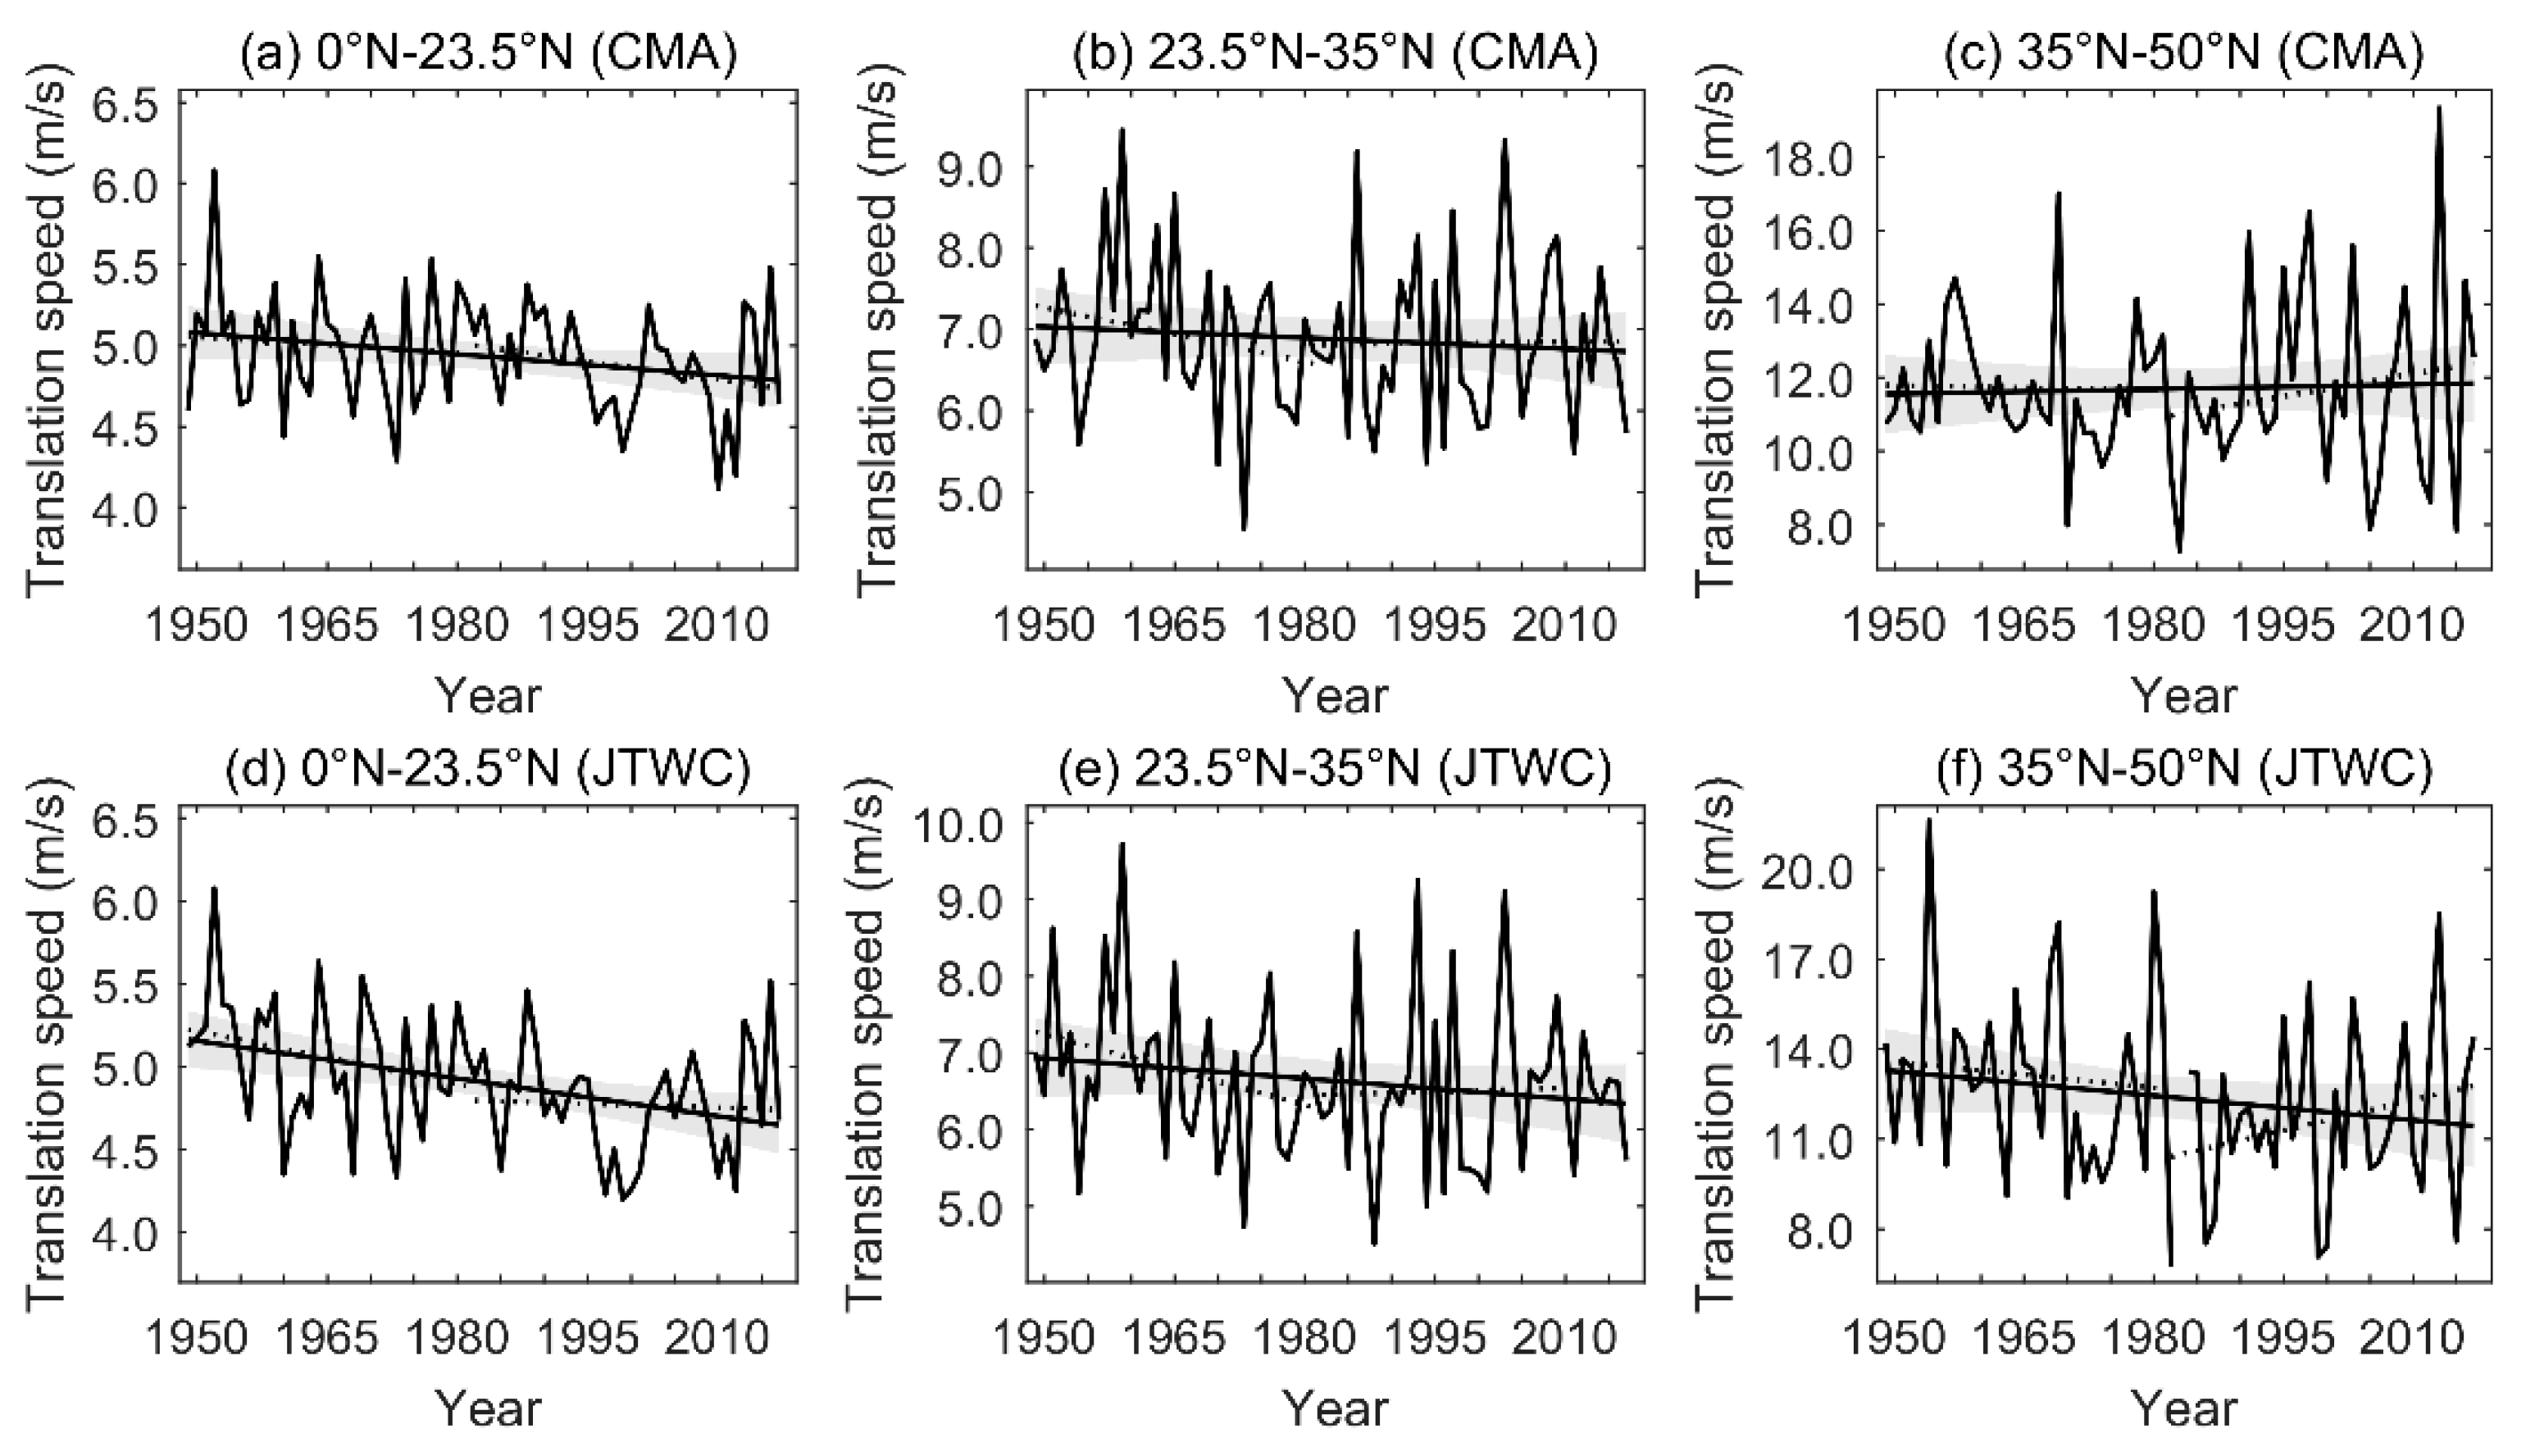
TC translation speed varies largely by latitude (Figure 4). The TC translation speed is relative slower and changes a little in the tropical ocean (latitude below 23.5° N in western North Pacific). When TCs leave the tropical ocean, the translation speed increase rapidly with the latitude (Figure 5). Figure 6 shows the relationship of the annual mean TC translation speed and latitude of TC occurrence in the north of 23.5° N. The changes in TC translation speed is highly consistent with the changes in the latitude of TC occurrence. Considering the high latitudinal dependent of TC translation speed, we studied the annual mean translation speed in different latitude belt over the western North Pacific during the period 1949–2017 (Figure 7). In the north of 23.5° N, the trend in translation speed was not significant during the 69-year period. While over the tropical ocean, there was a significant decrease of TC translation speed by 5.9% in CMA and even 10.0% in JTWC during the period 1949–2017.
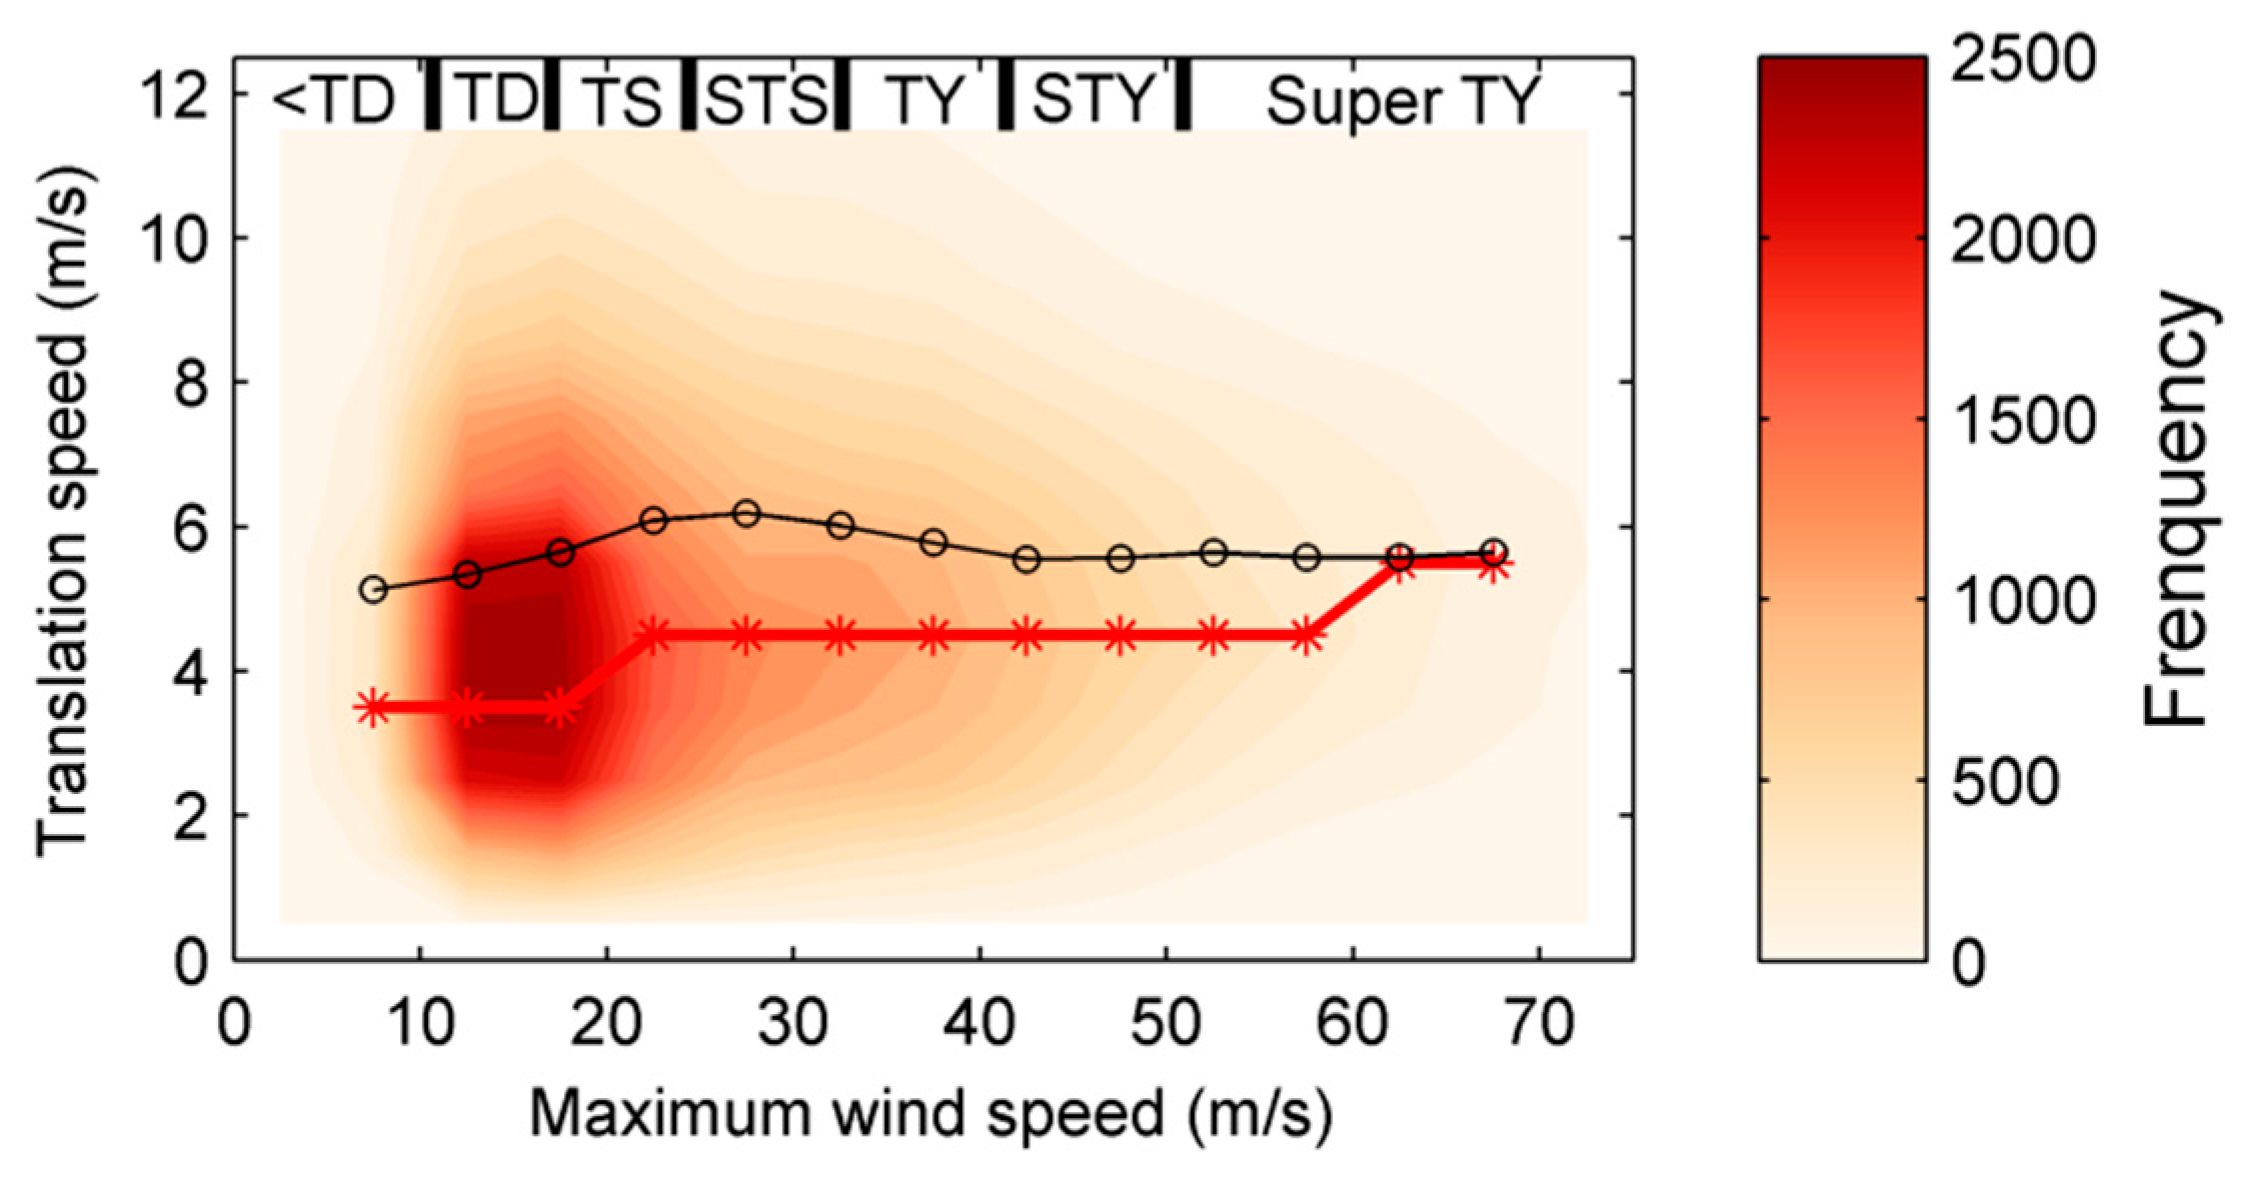
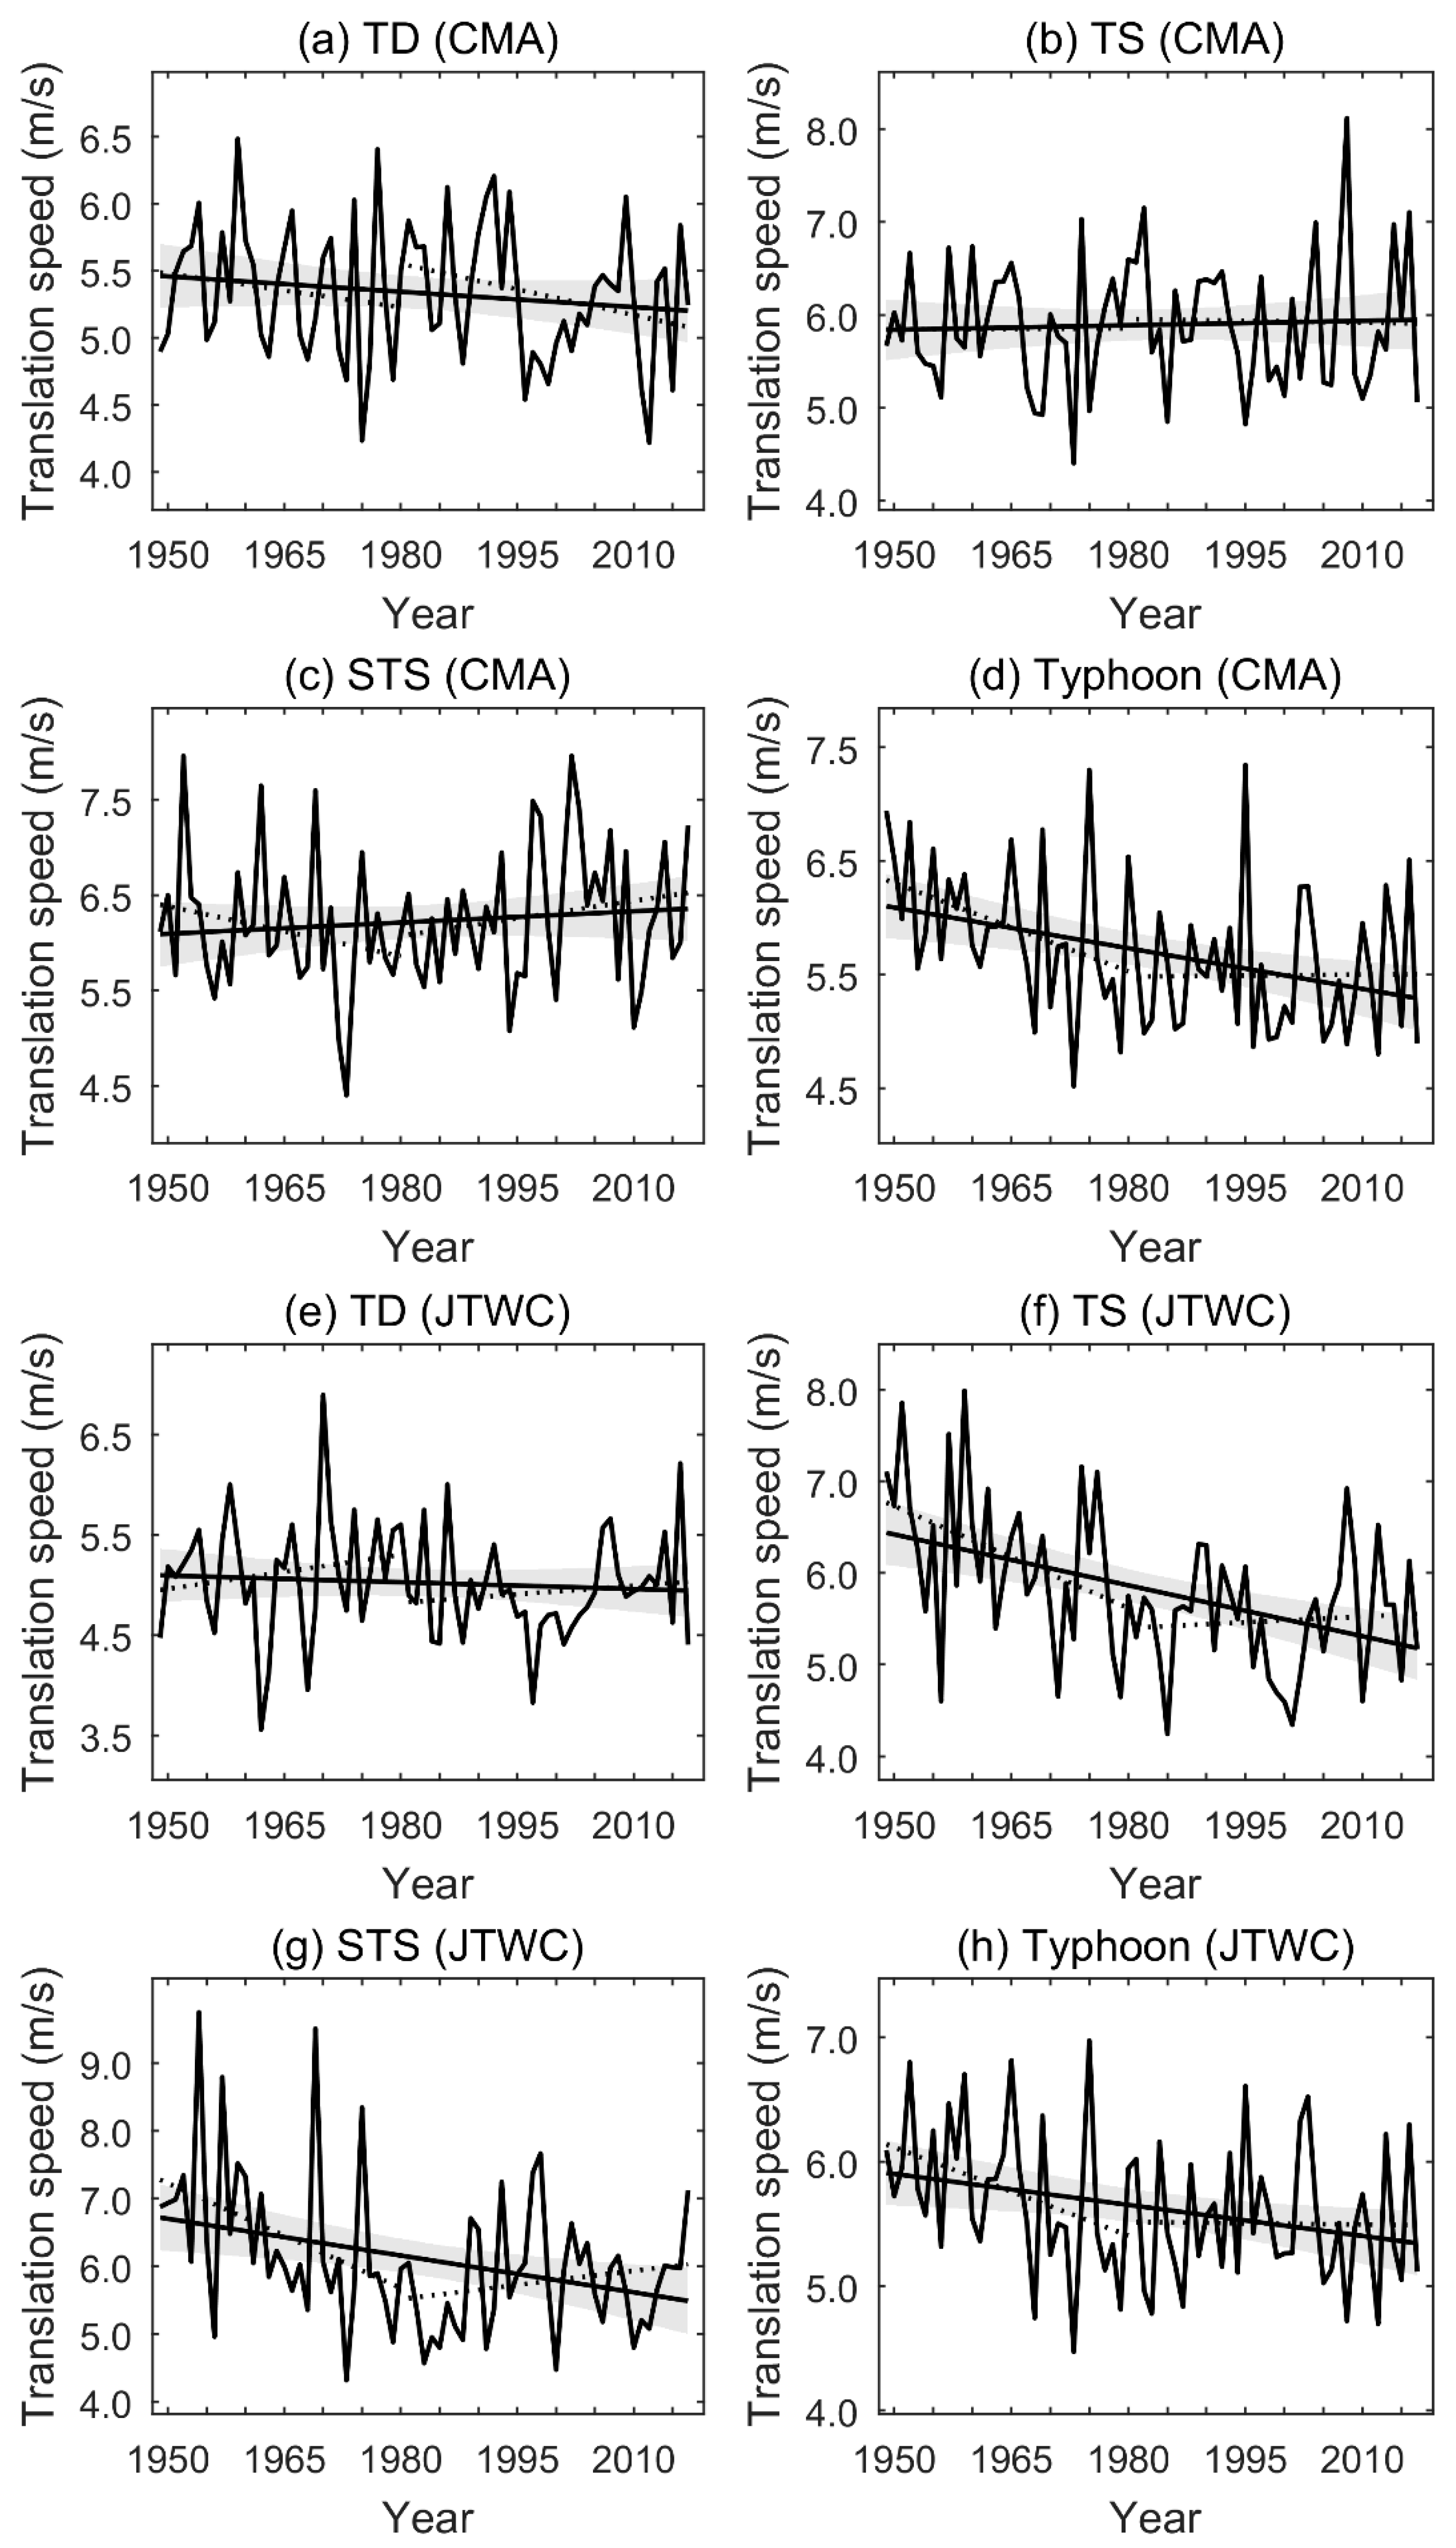
TC translation speed also varies in its intensity. When TC intensity is below the typhoon category (Table 2), the translation speed increases with the maximum wind speed (Figure 8). And the frequency in TC position points below the typhoon category is quite large which accounts for 68.5%. The number of tropical depressions was largely undercounted in the pre-satellite era, which could lead to an increase in TC translation speed [11]. Therefore, the changes in translation speed under different intensities are worth considering. Figure 9 shows the time series of annual mean TC translation speed under different intensities over the ocean in western North Pacific during the period 1949–2017. There was no significant trend in the translation speed of tropical depressions. Nevertheless, the translation speed of typhoons decreased over the 69-year recording period. Similarly, the period 1949–1981 contributed most of the slowdown trend, which we believe to be more reliable compared to the trend in translation speed of tropical depressions. The changes in the possibility density of typhoon frequency in translation speed are showed in Figure 10. The frequency of typhoons with faster translation speed decreased during the period 1949–2017. Note that there was an increase in the frequency of typhoons with translation speed slower than 6 m/s. This also indicated that the translation speed of typhoons over the western North Pacific became slower during the period 1949–2017.
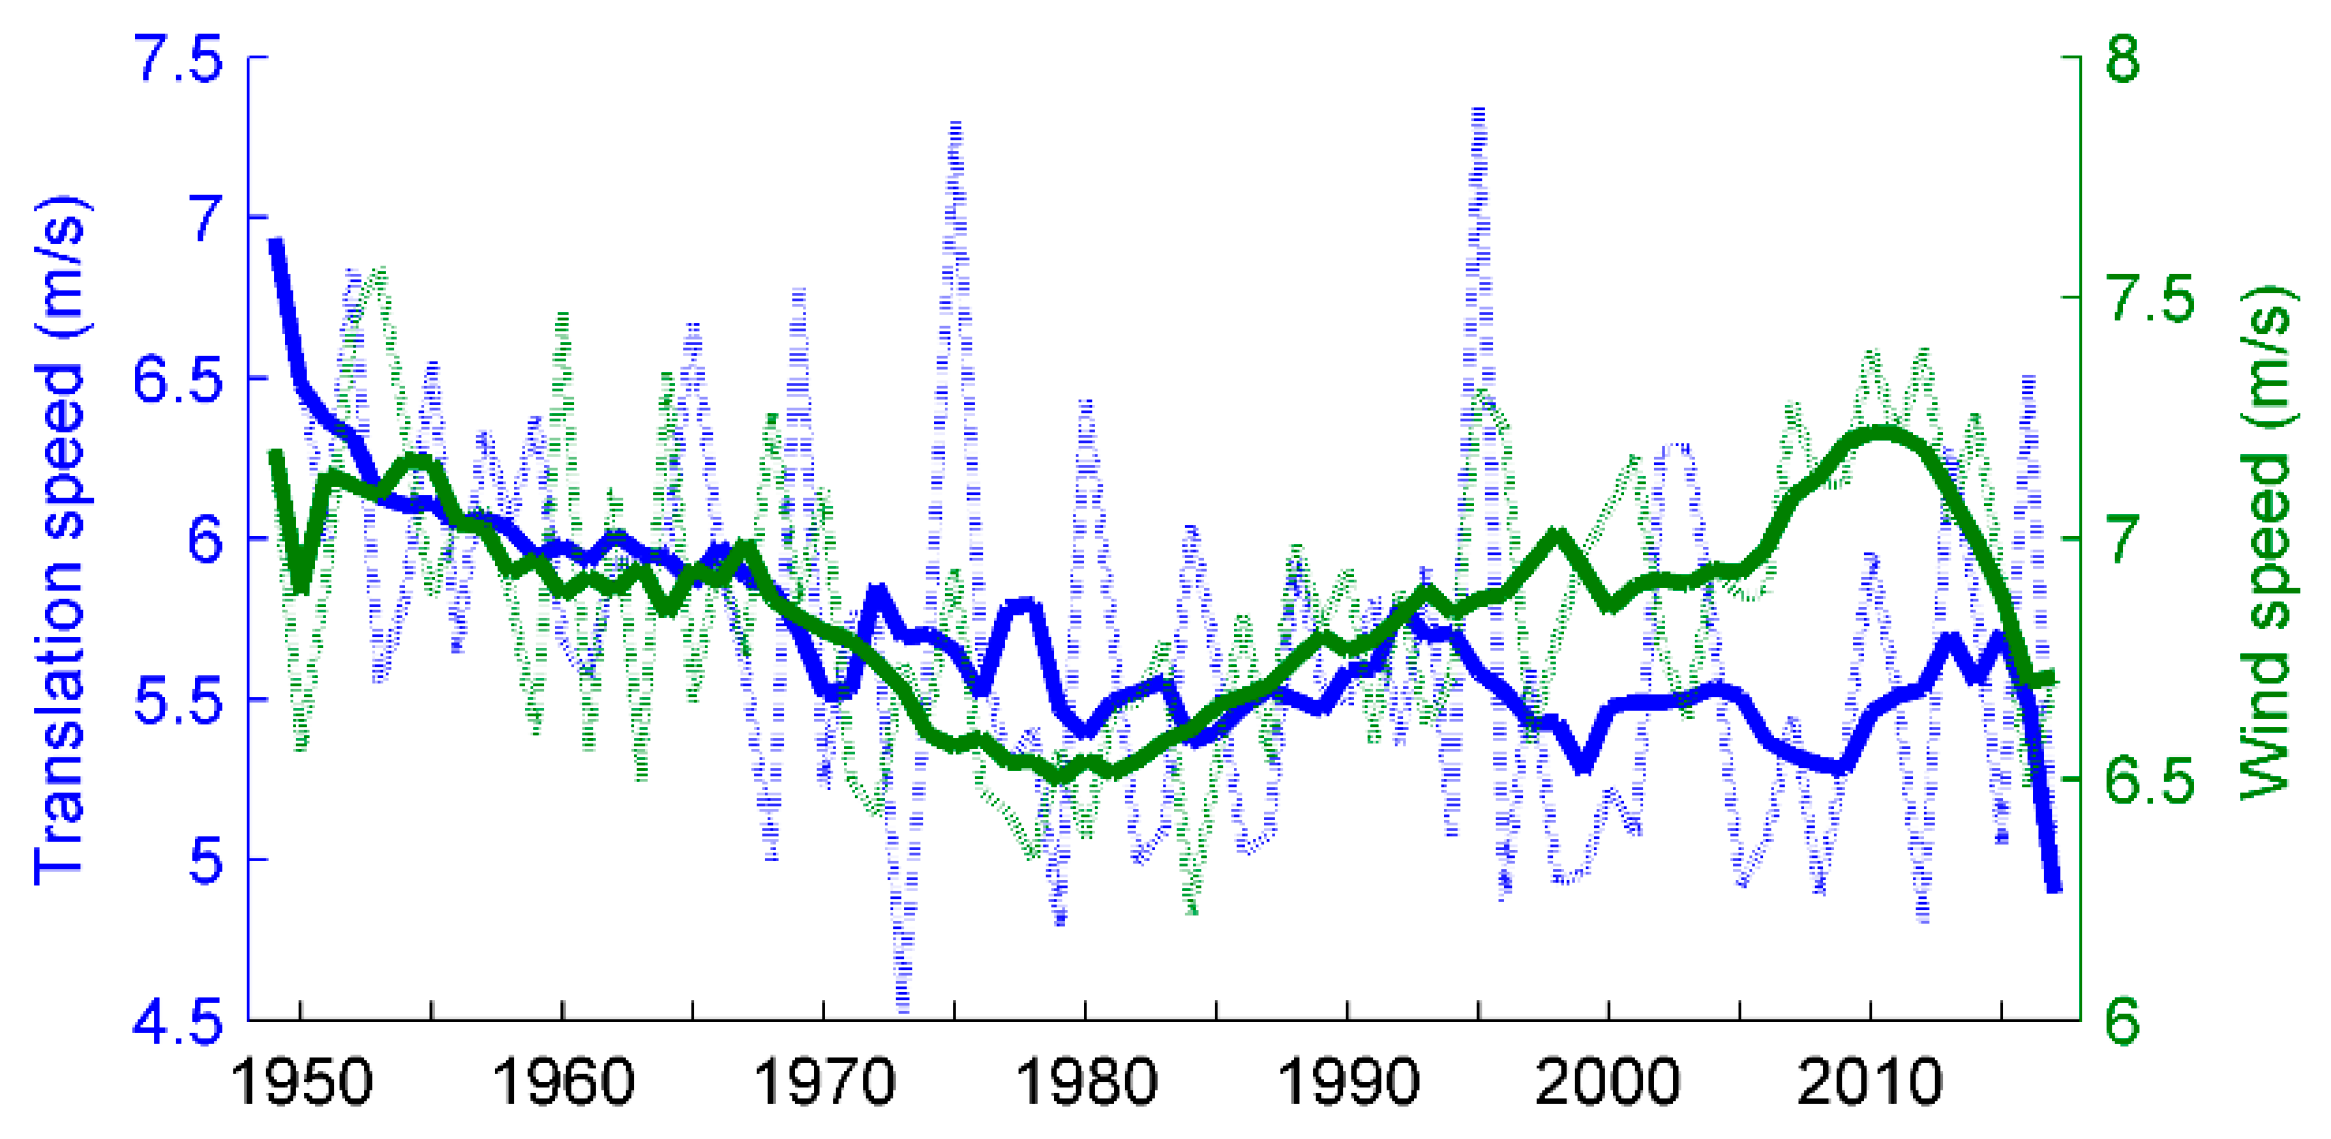
The changes in atmospheric circulation may influence the TC translation speed because the movements of TCs are generally carried along with the ambient environmental wind [28]. Figure 11 shows the trends in wind speed at 500 hPa during summertime over the period 1949–1981 and 1982–2017. Note that there was a significant weakening of the summertime tropical circulation during the period 1949–1981. We calculated the annual mean wind speed at 500 hPa during summertime over the period 1949–2017 (Figure 12). It shows that the changes in translation speed of typhoons over the western North Pacific during the period 1949–1981 was largely relevant to the changes in summertime tropical circulation. Hence, it seems that the significant slowdown trend in translation speed of typhoons was caused by the weakening of the summertime tropical circulation during the period 1949–1981.

4. Discussion

Since studies have found that the global TC translation speed slowed down by 10% in past decades [10], there has been much controversy over the trend in global TC translation speed. Meanwhile, it cannot be neglected that the considerable variations in inter-basin TC translation speed and occurrence frequency may lead to inaccurate global trends in translation speed. We focus only on the changes in TC translation speed over the western North Pacific in this study, which we believe to be more reliable and worth exploring.
There was a significant slowdown trend in the TC translation speed during the period 1949–2017 in both the CMA and JTWC data set (especially before 1981). The trend of TC translation speed over the ocean contributes mostly to the overall trend. TC translation speed was almost unchanged after 1981 when the best-track data was more reliable. The translation speed over land decreased during the period 1949–1981, although there was no significant trend during the entire recording period.
TC translation speed varies largely by latitude. When TCs leave the tropical ocean, the changes in TC translation speed is highly consistent with the changes in the latitude of TC occurrence. TC translation speed significantly decreased during the period 1949–2017 in the tropical ocean, where the TC translation speed varies a little. TC translation speed also varies in its intensity. When TC intensity is below the typhoon category, the translation speed increases with the maximum wind speed. The TC translation speed of typhoons decreased over the 69-year recording period. Similarly, the period 1949–1981 contributed most of the slowdown trend. The frequency of typhoons with faster translation speed also decreased during the period 1949–2017. It was likely that the significant slowdown trend in translation speed of typhoons before 1981 was caused by the weakening of the summertime tropical circulation.
The analysis of the changes in translation speed by different latitudes and intensities is very meaningful but lack adequate attribution here. Because the TC translation speed could control the TC intensity by modulating the strength of the air–sea surface negative thermal feedback, further studies are worth constructing to discuss the relationship of the changes in TC translation speed and intensities.

Author Contributions

Conceptualization, H.Z.; Data curation, D.Z.; Formal analysis, D.Z. and H.Z.; Funding acquisition, H.Z. and D.C.; Investigation, D.Z.; Methodology, H.Z., J.Z., X.C., D.T. and D.C.; Project administration, H.Z.; Software, D.Z.; Supervision, H.Z.; Visualization, D.Z.; Writing—original draft, D.Z. and D.C.; Writing—review & editing, H.Z., J.Z., X.C. and D.T. All authors have read and agreed to the published version of the manuscript.

Funding

This research was funded by the National Key R&D Program of China (2018YFC1506403), the National Program on Global Change and Air-Sea Interaction (GASI-IPOVAI-04), the National Natural Science Foundation of China (41730535, 41806021, 41705048, 41621064, 41731173, 41706007), the Scientific Research Fund of the Second Institute of Oceanography, MNR (JG1813), the China Ocean Mineral Resources Research and Development Association Program (DY135-E2-3-01), and Independent Research Project Program of State Key Laboratory of Tropical Oceanography (LTOZZ1802).

Acknowledgments

We wish to acknowledge the China Meteorological Administration (CMA, http://www.typhoon.org.cn) and the Joint Typhoon Warning Center (JTWC, https://pzal.ndbc.noaa.gov/collab/jtwc) for providing the tropical cyclone best-track data, the National Centers for Environmental Prediction/National Centers for Atmospheric Research (NCEP/NCAR) for providing reanalysis wind speed data (https://www.esrl.noaa.gov/psd/data/gridded/data.ncep.reanalysis.derived.pressure.html).

Conflicts of Interest

The authors declare no conflict of interest.

References

  1. Lee, T.C. A review on the long-term variations of tropical cyclone activity in the typhoon committee region. Trop. Cyclone Res. Rev. 2012, 1, 41–45. [Google Scholar]
  2. Hu, C.; Zhang, C.; Yang, S.; Chen, D.; He, S. Perspective on the northwestward shift of autumn tropical cyclogenesis locations over the western North Pacific from shifting ENSO. Clim. Dyn. 2018, 51, 2455–2465. [Google Scholar] [CrossRef] [Green Version]
  3. Hu, C.; Zhang, C.; Yang, S.; Chen, D. Variable correspondence between western North Pacific tropical cyclone frequency and east Asian subtropical jet stream during boreal summer: A tropical Pacific SST perspective. Int. J. Climatol. 2019, 39, 1768–1776. [Google Scholar] [CrossRef]
  4. Xu, S.; Wang, B. Enhanced western North Pacific tropical cyclone activity in May in recent years. Clim. Dyn. 2014, 42, 383. [Google Scholar] [CrossRef] [Green Version]
  5. Kossin, J.P.; Emanuel, K.A.; Vecchi, G.A. The poleward migration of the location of tropical cyclone maximum intensity. Nature 2014, 509, 349–352. [Google Scholar] [CrossRef] [Green Version]
  6. Song, J.; Klotzbach, P.J. What has controlled the poleward migration of annual averaged location of tropical cyclone lifetime maximum intensity over the Western North Pacific since 1961? Geophys. Res. Lett. 2018, 45. [Google Scholar] [CrossRef]
  7. Zhang, H.; Guan, Y. Latitudinal distribution of landing tropical cyclones over mainland China. Acta Phys. Sin. 2012, 61, 169203. (In Chinese) [Google Scholar]
  8. Zhang, H.; Guan, Y. Relationship between the South China Sea summer monsoon and the first-landfall tropical cyclone over mainland of China. Acta Phys. Sin. 2012, 61, 129201. (In Chinese) [Google Scholar]
  9. Zhang, H.; Guan, Y. Impacts of four types of ENSO events on tropical cyclones making landfall over mainland china based on three best-track datasets. Adv. Atmos. Sci. 2014, 31, 154–164. [Google Scholar] [CrossRef]
  10. Kossin, J.P. A global slowdown of tropical-cyclone translation speed. Nature 2018, 558, 104–107. [Google Scholar] [CrossRef]
  11. Moon, I.-J.; Kim, S.-H.; Chan, J.C.L. Climate change and tropical cyclone trend. Nature 2019. [Google Scholar] [CrossRef] [PubMed]
  12. Kossin, J.P. Reply to: Moon, I.-J. et al.; Lanzante, L.R. Nature 2019, 570, E16–E22. [Google Scholar] [CrossRef] [PubMed]
  13. Lanzante, J.R. Uncertainties in tropical-cyclone translation speed. Nature 2019. [Google Scholar] [CrossRef] [PubMed]
  14. Chan, K.T.F. Are global tropical cyclones moving slower in a warming climate? Environ. Res. Lett. 2019, 14, 104015. [Google Scholar] [CrossRef]
  15. Guan, S.; Li, S.; Hou, Y.; Hu, P.; Liu, Z.; Feng, J. Increasing threat of landfalling typhoons in the western North Pacific between 1974 and 2013. Int. J. Appl. Earth Obs. Geoinf. 2018, 68, 279–286. [Google Scholar] [CrossRef]
  16. Webster, P.J.; Holland, G.J.; Curry, J.A.; Chang, H.R. Changes in tropical cyclone number, duration, and intensity in a warming environment. Science 2005, 309, 1844–1846. [Google Scholar] [CrossRef] [Green Version]
  17. Emanuel, L.K.A. Increasing destructiveness of tropical cyclones over the past 30 years. Nature 2005, 436, 686–688. [Google Scholar] [CrossRef]
  18. Klotzbac, H.P.J. Trends in global tropical cyclone activity over the past twenty years (1986–2005). Geophys. Res. 2006, 33. [Google Scholar] [CrossRef]
  19. Chan, J.C.L. Comment on “Changes in Tropical Cyclone Number, Duration, and Intensity in a Warming Environment”. Science 2006, 311, 1713. [Google Scholar] [CrossRef] [Green Version]
  20. Kamahori, H.; Yamazaki, N.; Mannoji, N.; Takahashi, K. Variability in intense tropical cyclone days in the western North Pacific. SOLA 2006, 2, 104–107. [Google Scholar] [CrossRef] [Green Version]
  21. Landsea, A.C.W.; Harper, B.A.; Hoarau, K.; Knaff, J.A. Can we detect trends in extreme tropical cyclones? Science 2006, 313, 452–454. [Google Scholar] [CrossRef] [PubMed] [Green Version]
  22. Ying, M.; Zhang, W.; Yu, H.; Lu, X.; Feng, J.; Fan, Y.; Zhu, Y.; Chen, D. An overview of the China Meteorological Administration tropical cyclone database. J. Atmos. Ocean. Technol. 2014, 31, 287–301. [Google Scholar] [CrossRef] [Green Version]
  23. Chu, J.-H.; Sampson, C.R.; Levine, A.S.; Fukada, E. The Joint Typhoon Warning Center Tropical Cyclone Best-Tracks, 1945–2000; Naval Research Laboratory: Washington, DC, USA, 2002. [Google Scholar]
  24. Liang, J.; Ren, F.M.; Yang, X.Q. Study on the differences between CMA and JTWC tropical cyclone datasets for northwest Pacific. Acta Oceanol. Sin. 2010, 32, 10–22. (In Chinese) [Google Scholar]
  25. Ren, F.M.; Liang, J.; Wu, G.X.; Dong, W.J.; Yang, X.Q. Reliability analysis of climate change of tropical cyclone activity over the western North Pacific. J. Clim. 2011, 24, 5887–5898. [Google Scholar] [CrossRef]
  26. Kalnay, E.; Kanamitsu, M.; Kistler, R.; Collins, W.; Deaven, D.; Gandin, L.; Iredell, M.; Saha, S.; White, G.; Woollen, J.; et al. The NCEP/NCAR 40-year reanalysis project. Bull. Am. Meteorol. Soc. 1996, 77, 437–470. [Google Scholar] [CrossRef] [Green Version]
  27. Schreck, C.J.; Knapp, K.R.; Kossin, J.P. The impact of best track discrepancies on global tropical cyclone climatologies. Mon. Weather Rev. 2014, 142, 3881–3899. [Google Scholar] [CrossRef]
  28. Chan, J.C.L.; Gray, W.M. Tropical cyclone movement and surrounding flow relationship. Mon. Weather Rev. 1982, 110, 1354–1374. [Google Scholar] [CrossRef] [Green Version]
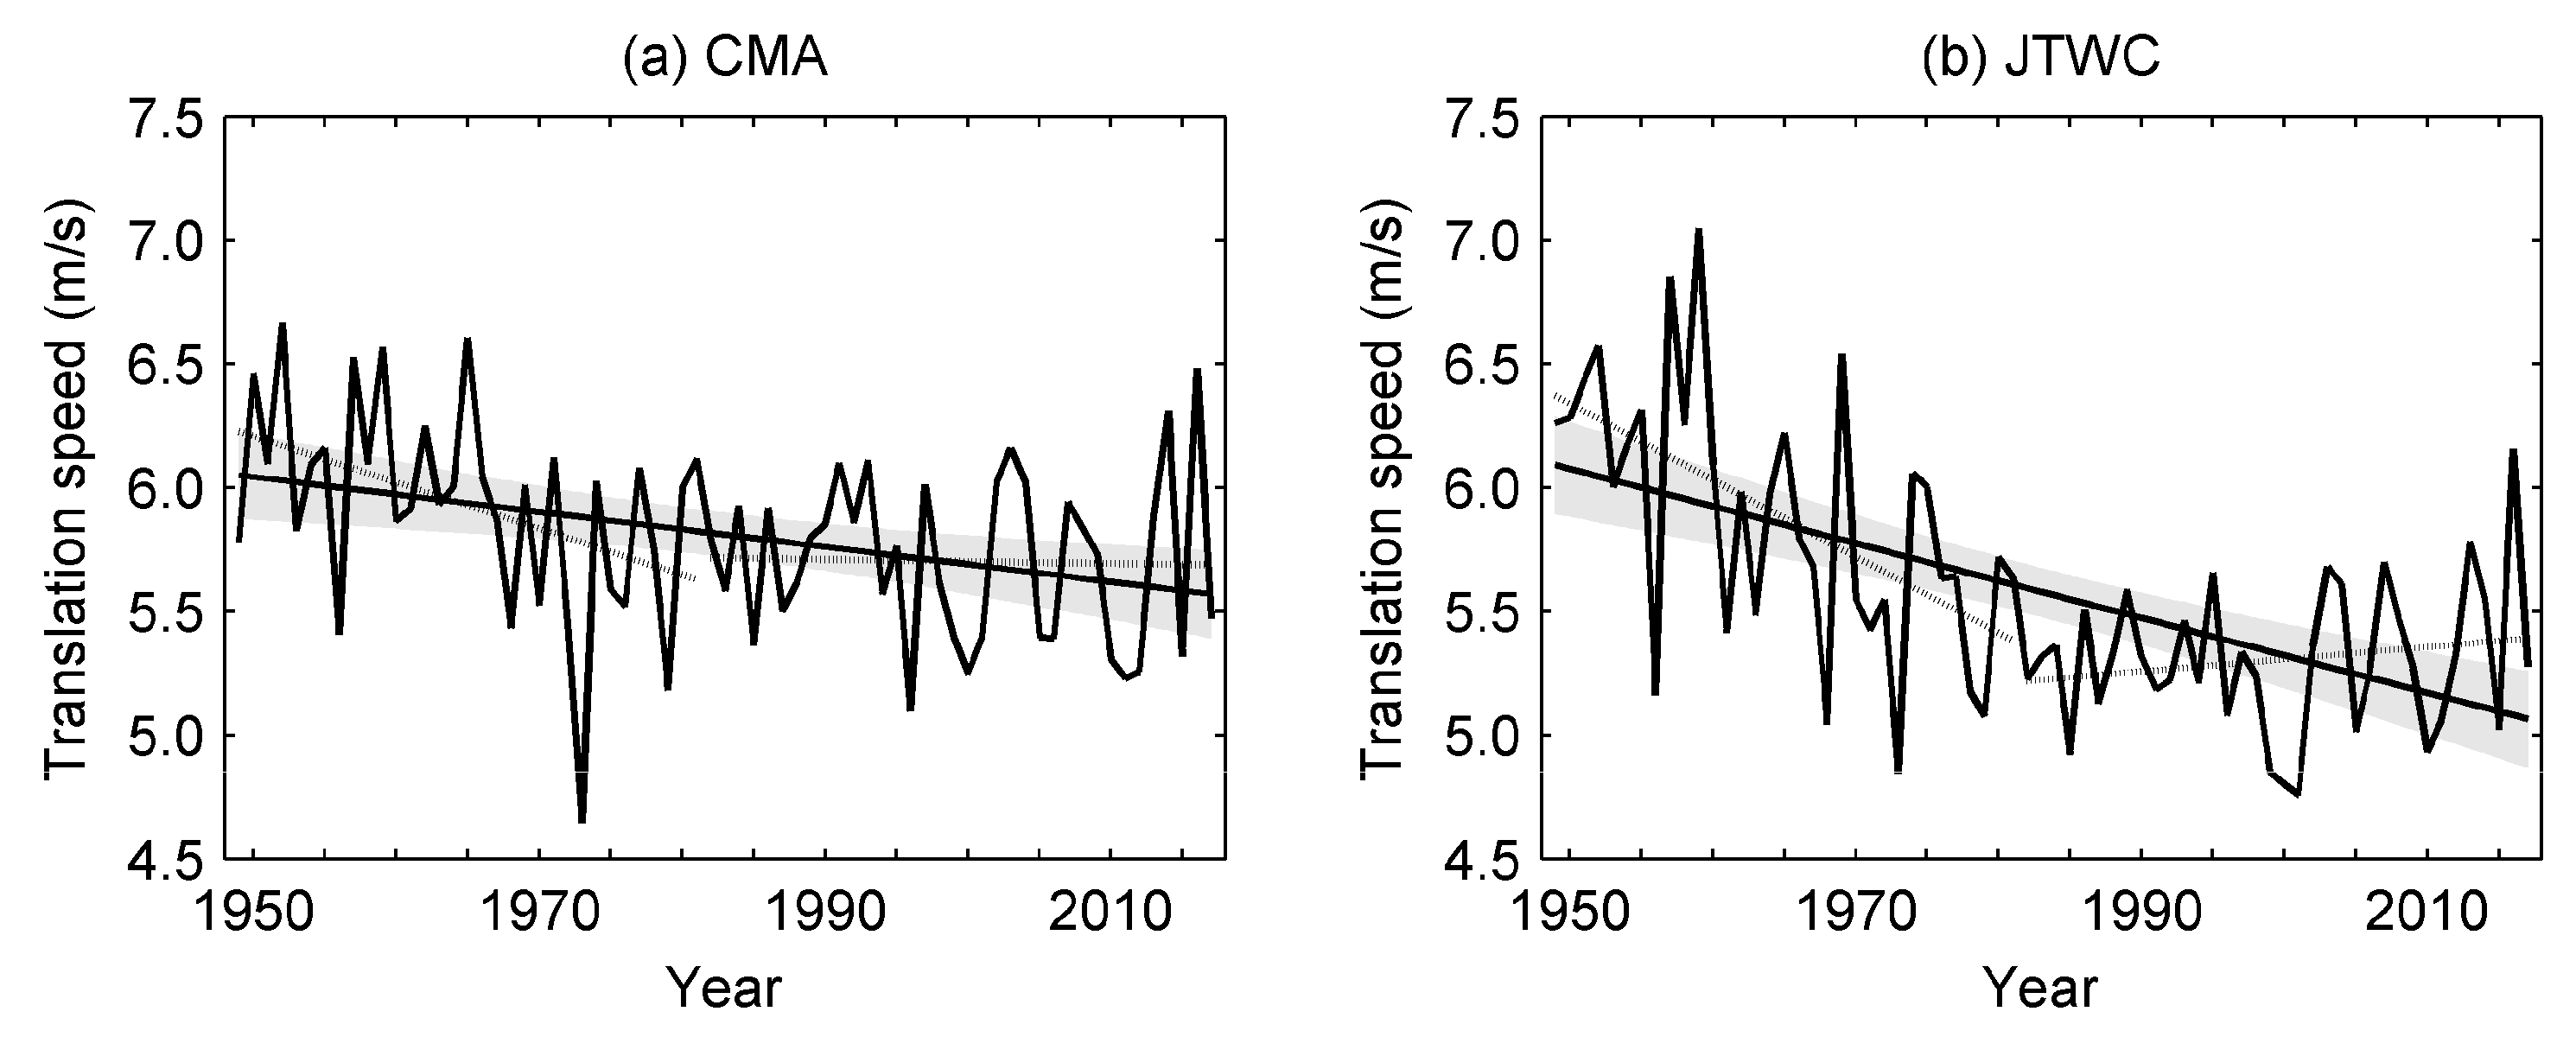
Figure 1. Time series of the annual mean TC translation speed during the period 1949–2017 over the western North Pacific in two datasets of (a) CMA, (b) JTWC and their linear trends. The black dashed lines show the linear trends during the two periods (1949–1981, 1982–2017). The gray shading indicates the two-sided 95% confidence boundary.
Atmosphere 11 00093 g001
Figure 2. Time series of the annual mean TC translation speed (a) over the ocean and (b) over land in CMA datasets and (c) over the ocean, (d) over land in JTWC datasets during the period 1949–2017 in western North Pacific and their linear trends. The black dashed lines show the linear trends during the two periods (1949–1981, 1982–2017). The gray shading indicates the two-sided 95% confidence boundary.
Atmosphere 11 00093 g002
Figure 3. Time series of the yearly percentage of the number of TC position points over the ocean in (a) CMA and (b) JTWC datasets during the period 1949–2017 in western North Pacific and their linear trends. The black dashed lines show the linear trends during the two periods (1949–1981, 1982–2017).
Atmosphere 11 00093 g003
Figure 4. Spatial distribution of the TC translation speed (both the vectors and contours) calculated in each 2.5° × 2.5° box over the western North Pacific during the period 1949–2017.
Atmosphere 11 00093 g004
Figure 5. The frequency of TC position points distributed in translation speed and latitude over the ocean in western North Pacific. The black line shows the mean TC translation speed with the latitude. The red line connects the TC translation speed occurs most often in each latitude.
Atmosphere 11 00093 g005
Figure 6. Time series of the annual mean TC translation speed (blue lines) and latitude of TC occurrence (green lines) in the north of 23.5° N over the ocean in western North Pacific during the period 1949–2017. Thick solid lines represent the 7-year running mean. The correlation coefficient r between TC translation speed and latitude during 1949–2017 is 0.70 (significant above the 99% confidence level).
Atmosphere 11 00093 g006
Figure 7. Time series of the annual mean TC translation speed in different latitude belt: (a) 0–23.5° N (b) 23.5–35° N (c) 35–50° N in CMA datasets and (d) 0–23.5° N (e) 23.5–35° N (f) 35–50° N in JTWC datasets during the period 1949–2017 over the ocean in western North Pacific and their linear trends. The black dashed lines show the linear trends during the two periods (1949–1981, 1982–2017). The gray shading indicates the two-sided 95% confidence boundary.
Atmosphere 11 00093 g007
Figure 8. The frequency of TC position points distributed in translation speed and maximum wind speed over the ocean in western North Pacific. The black line shows the mean TC translation speed with the maximum wind speed. The red line connects the TC translation speed occurs most often for each TC intensity. The intensity of the TCs is divided into seven categories according to the maximum wind speed seeing the China Tropical cyclone Classification (GBT 19201-2006) in CMA (Table 2).
Atmosphere 11 00093 g008
Figure 9. Time series of the annual mean TC translation speed in different intensities (a) TD (b) TS (c) STS (d) typhoon in CMA datasets and (e) TD (f) TS (g) STS (h) typhoon in JTWC datasets during the period 1949–2017 over the ocean in western North Pacific and their linear trends. The black dashed lines show the linear trends during the two periods (1949–1981, 1982–2017). The gray shading indicates the two-sided 95% confidence boundary.
Atmosphere 11 00093 g009
Figure 10. Changes in the distribution of typhoon translation speed over the ocean in the western North Pacific. (a) The changes in the anomalies (from the time series mean) of probability density of the typhoon frequency during 1949–2017; (b) The probability density of the typhoon frequency in the translation speed during two periods of 1949–1981 and 1982–2017.
Atmosphere 11 00093 g010
Figure 11. Trends (contours) in wind speed at 500 hPa during the period (a) 1949–1981 and (b) 1982–2017 over the western North Pacific. The vectors show the climatological mean wind speed at 500 hPa.
Atmosphere 11 00093 g011
Figure 12. Time series of the annual mean translation speed of typhoons (blue lines) and wind speed at 500 hPa (green lines) over the ocean in western North Pacific during the period 1949–2017. Thick solid lines represent the 7-year running mean. The correlation coefficient r between translation speed and wind speed at 500 hPa during 1949–1981 is 0.74 (significant above the 99% confidence level).
Atmosphere 11 00093 g012
Table 1. Trends (m s−1 year−1) and their p-values of the annual mean TC translation speed during three time periods (1949–1981, 1982–2017, 1949–2017) over the western North Pacific. The bold-font marked values represent the corresponding trends with confidence levels above 95%.
1949–1981
Trend (p-Value)
1982–2017
Trend (p-Value)
1949–2017
Trend (p-Value)
CMA−0.019 (0.01)−0.001 (0.88)−0.007 (0.00)
JTWC−0.031 (0.00)0.005 (0.31)−0.015 (0.00)
ocean (CMA)−0.018 (0.03)0.001 (0.91)−0.007 (0.00)
ocean (JTWC)0.028 (0.00)0.005 (0.34)0.015 (0.00)
land (CMA)−0.033 (0.06)−0.020 (0.22)−0.006 (0.34)
land (JTWC)0.076 (0.00)−0.001 (0.94)−0.023 (0.00)
0–23.5° N (CMA)−0.003 (0.65)−0.008 (0.14)−0.004 (0.04)
0–23.5° N (JTWC)−0.011 (0.14)−0.002 (0.78)0.008 (0.00)
23.5–35° N (CMA)−0.022 (0.22)0.001 (0.95)−0.005 (0.46)
23.5–35° N (JTWC)−0.031 (0.11)0.003 (0.87)−0.009 (0.18)
35–50° N (CMA)−0.005 (0.88)0.041 (0.34)0.004 (0.75)
35–50° N (JTWC)−0.029 (0.60)0.068 (0.15)−0.027 (0.13)
tropical depression (CMA)−0.009 (0.41)−0.013 (0.09)−0.004 (0.21)
tropical depression (JTWC)0.011 (0.35)0.006 (0.45)−0002 (0.51)
tropical storm (CMA)0.000 (0.98)−0.001 (0.91)0.002 (0.70)
tropical storm (JTWC)−0.037 (0.02)0.004 (0.67)−0.019 (0.00)
severe tropical storm (CMA)−0.018 (0.21)0.012 (0.27)0.004 (0.37)
severe tropical storm (JTWC)−0.052 (0.03)0.014 (0.26)−0.019 (0.00)
>=typhoon (CMA)−0.026 (0.03)0.001 (0.95)−0.012 (0.00)
>=typhoon (JTWC)−0.024 (0.04)−0.001 (0.93)−0.008 (0.01)
Table 2. Classification of TC intensity according to the maximum wind speed (m/s) referred to the China Tropical Cyclone Classification (GBT 19201-2006) [22] in CMA.
Maximum Wind SpeedTC Intensity
10.8–17.1 m/sTropical depression (TD)
17.2–24.4 m/sTropical storm (TS)
24.5–32.6 m/sSevere tropical storm (STS)
32.7–41.4 m/sTyphoon (TY)
41.5–50.9 m/sSevere typhoon (STY)
≥51.0 m/sSuper typhoon (Super TY)