Abstract
In this paper, the National Centers for Environmental Prediction/National Center for Atmospheric Research (NCEP/NCAR) monthly average reanalysis data from 1954 to 2017, haze days observation data from 1954 to 2017, and PM2.5 daily average mass concentration data from 2013 to 2017 are collected and collated. Firstly, the atmospheric apparent heat source on the Qinghai-Tibet Plateau is estimated based on thermodynamic equations. The correlation between the atmospheric apparent heat source (Q1) on the Qinghai-Tibet Plateau and the air quality in China, especially in the five typical regions (Beijing-Tianjin-Hebei, Fen-Wei Plain, Yangtze River Delta, Pearl River Delta, and Sichuan-Chongqing regions) is analyzed and studied. Through comprehensive diagnosis and synthesis, the differences of the three-dimensional spatial distribution of the circulation field and temperature field (planes and sections) in China and the typical regions in the strong and weak years of the apparent heat source Q1 on the Qinghai-Tibet Plateau in winter are compared, and the different distribution characteristics of the climate circulation background causing the strong and weak years of Q1 on the Qinghai-Tibet Plateau and the influence mechanism on the air quality in different regions in China are discussed. The results show that the spatial distribution of correlation between Q1 on the Qinghai-Tibet Plateau and PM2.5 in December has a northeast-southwest boundary. There is a negative correlation in the southeast region of the boundary, with heavy pollution when the cold source is strong and light pollution when the cold source is weak, while there is a positive correlation in the northwest region of the boundary, with light pollution when the cold source is strong and heavy pollution when the cold source is weak. The Q1 on Qinghai-Tibet Plateau is negatively correlated with air pollution in Beijing-Tianjin-Hebei and Fen-Wei Plain located in the northwest region of the boundary but positively correlated with air pollution in the Yangtze River Delta, Pearl River Delta, and Sichuan-Chongqing regions located in the southeast region of the boundary. In the cold source strong year, the northerly winds are stronger in the middle and high latitudes, and there is an abnormal northerly downward flow in the southeast region, thus the pollution is aggravated by the suppression of convection–diffusion in a downward flow. However, abnormal updraft in the northwest region exists, reducing pollution. In the cold source weak year, the situation is just the opposite.
1. Introduction
Atmospheric heat source refers to non-adiabatic heating in the atmosphere, including heating the atmosphere in the form of sensible heat, condensation latent heat, and radiation heating, which is the driving force of atmospheric circulation. The Qinghai-Tibet Plateau accounts for a quarter of China’s land area, with an average altitude of more than 4000 m and about 1/3 of the troposphere height. It is the world’s largest plateau with the highest altitude and the most complex topography [1]. Ye et al. [2] and Flohn [3] pointed out that the Qinghai-Tibet Plateau was a powerful heat source in summer, transporting a large amount of heat and water vapor to the atmosphere in the central troposphere. Ye et al. [2] also pointed out for the first time that the Qinghai-Tibet Plateau was a cold source in winter.
There are significant seasonal differences in the distribution of atmospheric heat sources/sinks over the Qinghai-Tibet Plateau. People have calculated and analyzed the atmospheric heating condition of the Qinghai-Tibet Plateau and found that the Qinghai-Tibet Plateau is a heat source for the whole year. There are two heat source-sink conversions each year, which are converted to a heat source in April and continue until September, with the strongest heat source months being June and July. The heat source turns into a cold source in October every year, with the strongest cold source in December [4,5,6,7,8].
In 1997, Wu et al. [9,10] put forward the “sensible heat pump” model. It was believed that the atmosphere over the Qinghai-Tibet Plateau sinks in winter and “discharges” to the periphery of the low altitude of the plateau. In summer, the atmosphere around the low altitude of the plateau is “pumped” up by the plateau and discharged outward in the upper troposphere. This cyclic pumping–discharging effect and the large-scale atmospheric rise-fall caused by it are like a giant “air pump” standing over the subtropical regions in the middle and east of Eurasia, which can effectively control the atmospheric circulation and seasonal climate changes in Asia and significantly affect the formation and changes of winter and summer monsoon in Asia. Yu et al. [11] summed up previous studies and believed that the heating effect of the Qinghai-Tibet Plateau had an important impact on the atmospheric circulation in the plateau and its surrounding areas. The possible mechanism is as follows: In the year when the heating intensity of the Qinghai-Tibet Plateau is strong, the upward movement, lower convergence and upper divergence of the plateau and its neighboring areas are all enhanced, which makes the suction effect of the plateau heating on the lower warm and humid air in the surrounding areas, and the discharge effect of the upper atmosphere to the surrounding areas are strengthened. At the same time, the summer water vapor transport in the eastern part of the southwest area is enhanced, and the water vapor convergence and upward movement are also enhanced, and vice versa.
Studies have shown that the thermal effect of the Qinghai-Tibet Plateau has an important influence on the East Asian circulation and the local circulation in the downstream region [12,13,14,15,16], and also has an important influence on the atmospheric pollution in the downstream region. Previous researchers have analyzed the heat sources and sinks on the Qinghai-Tibet Plateau in different seasons in detail, and also have made detailed studies on the influence of heat source changes on atmospheric motion, but the influence on atmospheric pollution is relatively small. With the rapid growth of China’s national economy and the acceleration of industrialization and urbanization, the air pollution problem experienced by developed countries for more than 100 years has also occurred frequently in economically developed areas of China in the past 20 to 30 years. Xu et al. [17,18] have found that the heat source intensity on the Qinghai-Tibet Plateau in winter is significantly positively correlated with haze days in eastern China using data from 1980 to 2012. When the heat source on the Qinghai-Tibet Plateau is unusually warm in winter, the wind in East Asia is weak in winter, the northwest wind in eastern China is weakened, and the southwest wind is strengthened, thus enhancing the transportation of marine water vapor to eastern China, resulting in higher humidity in the lower atmosphere, which is conducive to the moisture absorption and growth of aerosols in eastern China. In addition, the lower atmosphere in eastern China has an obvious inversion structure and the pollution in eastern China is aggravated.
According to the previous studies that the thermal effect of the Qinghai-Tibet Plateau has an obvious influence on the atmospheric circulation in the surrounding and downstream areas and the heat source/sink intensity of the Qinghai-Tibet Plateau has an obvious connection with the pollution situation in China in winter. However, is the influence of the atmospheric heat source of the Qinghai-Tibet Plateau on the pollution situation in different regions of China consistent in winter? If not, what are the possible influencing factors? The above problems are still unclear. Therefore, the relationship between the thermal effect of the Qinghai-Tibet Plateau in winter and the pollution of typical regions in China, and the related influencing mechanism are analyzed using longer-term data in this paper.
2. Information and Methods
2.1. Information Introduction
The NCEP/NCAR global reanalysis data from 1954 to 2017 used in this paper included geopotential height, temperature, wind speed, and vertical velocity, etc., with 17 layers in the vertical direction and a 2.5 × 2.5 horizontal resolution. The PM2.5 mass concentration data used in this paper came from China’s air quality online monitoring platform, which carried out secondary verification and statistics on the real-time data of 367 monitoring stations in the country provided by the Ministry of Environmental Protection, and finally released the daily air quality data of each city. The daily PM2.5 mass concentration data from 2013 to 2017 were selected, including 1498 stations in the country, and 902 stations with continuous observation data were selected for analysis in this paper.
Haze day data came from the latest special haze day data set (V1.0) [19] compiled and updated by the national meteorological information center in 2018. The data set included the daily values of haze weather phenomena (including fog, light fog, and haze) observed by basic stations, benchmark weather stations, and general weather stations in China, and the regular visibility, relative humidity, and wind direction of 4 standard hours (00, 06, 12, and 18 UTC) each day. In the process of making this data set, 3 kinds of methods were applied: Climatic threshold value or allowable value check, internal consistency check, and spatial consistency check, to ensure that the data were under quality control, with good quality and complete data. Moreover, the “haze” phenomenon was observed in accordance with the requirements of “ground meteorological observation code” of China’s central meteorological administration. In this paper, 2444 sites with good data integrity in the whole country from 1958 to 2017 were selected for research.
2.2. Atmospheric Apparent Heat Source Q1
There are currently two main methods for calculating atmospheric heat sources. One is a positive algorithm or a direct algorithm, which uses direct observation data to calculate sensible heating, radiant heating, and condensation latent heat heating, respectively. Taking the 3 terms is the atmospheric heat source. The other is an inverse algorithm or indirect algorithm, which uses conventional meteorological data such as wind field, air temperature, and potential height to determine the apparent heat source of the atmosphere from the energy balance through the heat inflow equation. Both the calculation method and the data will lead to the uncertainty of the result. The positive algorithm can only obtain the entire layer of the heat source, while the inverted algorithm can obtain the vertical structure of the heat source, but the accuracy of the results depends on the accuracy of the reanalysis data [8,20].
In this study, the “inverse algorithm” was used to calculate the monthly heat source on the Qinghai-Tibet Plateau [21] over 75–100° E and 27.5–37.5° N. The apparent heat source Q1 formula is as follows:
where Q1 is the apparent heat source of each layer, T is the temperature, θ is the potential temperature, and ω is the vertical velocity of the p coordinate and assume that the vertical velocity at the top of the troposphere is 0. = R/Cp, R and Cp are the dry air gas constant and specific heat at constant pressure, respectively. V is the horizontal wind vector, is 1000 hPa. Q1 of each isostatic pressing layer can be calculated from Equation (1).
The vertical integral value of atmospheric apparent heat source can be expressed as:
where (Q1) is the entire apparent heat source, ps and pt are the ground pressure and atmospheric top pressure (taking 100 hPa), respectively, and g is the gravitational acceleration.
The integral value Q1 of the whole layer of the apparent heat source over the Qinghai-Tibet Plateau represents the thermal effect of the Qinghai-Tibet Plateau. December with the strongest cold source representing winter is selected for research in this paper. The standardized apparent heat source Q1 on the Qinghai-Tibet plateau from December 1954 to 2017, which was used the Z-score method, is shown in Figure 1.
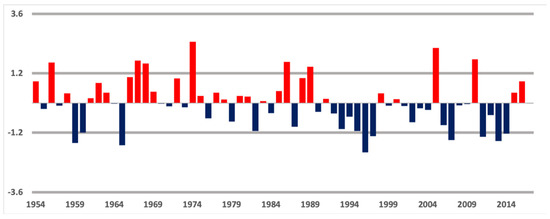
Figure 1.
Standardized apparent heat source Q1 of Qinghai-Tibet Plateau in December from 1954 to 2017.
2.3. Selection of Strong and Weak Years of Apparent Heat Source Q1 on the Qinghai-Tibet Plateau in Winter
In order to find more obvious characteristics of strong and weak cold source years, on the premise of having enough samples, we tried to select the target years with ±1.2 as the standard according to the standardized Qinghai-Tibet plateau heat source Q1 from 1954 to 2017, and the standard was slightly stricter than ±1. The years with an index less than −1.2 were determined as cold source strong years. The years which met the standard were 1959, 1960, 1965, 1996, 1997, 2007, 2011, 2013, and 2014, and the years with an index greater than 1.2 were cold source weak years, including 1956, 1967, 1968, 1974, 1986, 1989, 2005, and 2010. The correlation analysis and synthesis analysis were used in this paper.
3. Results
3.1. Relationship between the Apparent Heat Source Q1 on the Qinghai-Tibet Plateau and Air Pollution in China
3.1.1. Spatial Distribution Characteristics of Correlation between the Apparent Heat Source Q1 on the Qinghai-Tibet Plateau and PM2.5 Concentration in China
The mass concentration of PM2.5 in December at the national stations from 2013 to 2017 and the apparent heat source Q1 on the Qinghai-Tibet Plateau during the same period were analyzed for correlations. The stations with correlation coefficients higher than 0.7 (red dots) and lower than −0.7 (blue dots) are shown in Figure 2. All stations in the figure have passed the 80% confidence test. As can be seen from Figure 2, the correlation between the apparent heat source Q1 on the Qinghai-Tibet plateau and PM2.5 concentration had an obvious northeast-southwest boundary. In the northwest region of the boundary, the PM2.5 concentration and the apparent heat source Q1 on the Qinghai-Tibet plateau were mainly positively correlated, while in the southeast region of the boundary, they were negatively positively correlated.
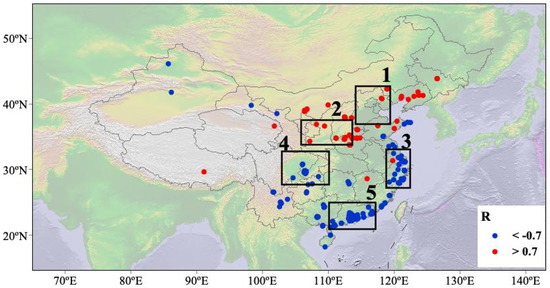
Figure 2.
Spatial distribution characteristics of the correlation between the apparent heat source Q1 on the Qinghai-Tibet plateau and PM2.5 concentration in China and five typical regions. The boxes in the figure are, respectively, five typical polluted areas: 1. Beijing-Tianjin-Hebei, 2. Fenwei Plain, 3. Chengdu-Chongqing, 4. Pearl River Delta, and 5. Yangtze River Delta.
Among the five typical pollution areas, the apparent heat source Q1 on the Qinghai-Tibet plateau and the concentration of PM2.5 were mainly positively correlated in the Beijing-Tianjin-Hebei region and Fen-Wei plain. That was the stronger the cold source of the Qinghai-Tibet plateau, the lower the mass concentration of PM2.5 in the Beijing-Tianjin-Hebei region and the Fen-Wei plain, the weaker the cold source of the Qinghai-Tibet plateau and the higher the concentration of PM2.5 in these two regions. However, the apparent heat source Q1 on the Qinghai-Tibet plateau and the concentration of PM2.5 were obviously negatively correlated in the Yangtze River Delta, Sichuan-Chongqing, and the Pearl River Delta regions. That was, the stronger the cold source on the Qinghai-Tibet Plateau, the heavier the pollution in these three regions; the weaker the cold source on the Qinghai-Tibet Plateau, and the lighter the pollution.
3.1.2. Correlation between the Apparent Heat Source Q1 on the Qinghai-Tibet Plateau and PM2.5 Concentration in Five Typical Regions
The time series of the average PM2.5 mass concentration of five typical regional observation stations in December from 2013 to 2017 and the apparent heat source Q1 on the Qinghai-Tibet Plateau during the same period are shown in Figure 3. The average PM2.5 mass concentrations of five typical regional observation stations from 2013 to 2017 in December and the apparent heat source Q1 of the Qinghai-Tibet Plateau during the same period were taken as a time series, and their correlations were analyzed. As shown in Figure 3, the Beijing-Tianjin-Hebei region (Figure 3a), Fen-Wei plain (Figure 3b), Yangtze River Delta (Figure 3c), Sichuan-Chongqing region (Figure 3d), and Pearl River Delta (Figure 3e) were, respectively, from top to bottom. For each region, we used 84, 59, 163, 44, and 87 data points in calculating the averages of PM2.5.
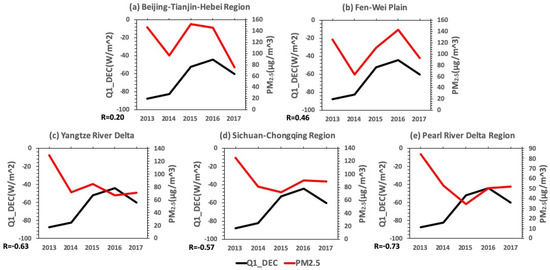
Figure 3.
Correlation between the apparent heat source Q1 on the Qinghai-Tibet plateau and PM2.5 concentration in typical areas of China.
As can be seen from Figure 3, the mass concentration of PM2.5 in the Beijing-Tianjin-Hebei region and Fen-Wei Plain was positively correlated with the time series of apparent heat source Q1 of the Qinghai-Tibet Plateau, with correlation coefficients of 0.20 and 0.46, respectively. In 2014, the cold source on the Qinghai-Tibet Plateau was relatively strong, and the mass concentration of PM2.5 decreased in the two regions. And in 2015–2016, the cold source on the Qinghai-Tibet Plateau was relatively weak and the mass concentration of PM2.5 was relatively high. However, in 2017, the cold source of Qinghai-Tibet Plateau increased while the mass concentration of PM2.5 decreased in these two regions.
While the PM2.5 concentration in the other three typical regions of the Yangtze River Delta, Sichuan-Chongqing region, and Pearl River Delta was negatively correlated with Q1, with correlation coefficients of −0.63, −0.57, and −0.73, respectively. In 2013, the cold source on the Qinghai-Tibet Plateau was strong and the concentration of PM2.5 was high. From 2014 to 2016, the cold source on the Qinghai-Tibet Plateau weakened and the mass concentration of PM2.5 in the three regions decreased. And from 2016 to 2017, the cold source on the Qinghai-Tibet Plateau became stronger while the mass concentration of PM2.5 in the three regions increased.
From 2014 to 2016, the cold source on the Qinghai-Tibet Plateau weakened while the mass concentration of PM2.5 in the Yangtze River Delta and Pearl River Delta decreased. From 2016 to 2017, the cold source on the Qinghai-Tibet Plateau increased while the mass concentration of PM2.5 in the Yangtze River Delta and Pearl River Delta increased.
3.1.3. Correlation between the Apparent Heat Source Q1 on the Qinghai-Tibet Plateau and Concentration of PM2.5 in Typical Cities
In the five typical regions, the representative cities were selected for the time series of PM2.5 mass concentration and the apparent heat source Q1 on the Qinghai-Tibet plateau from December 2013 to December 2017. As shown in Figure 4, the representative cities were Beijing (Figure 4a), Baoji (Figure 4b), Shanghai (Figure 4c), Chongqing (Figure 4d), and Shenzhen (Figure 4e), and their correlation was consistent with the typical regions.
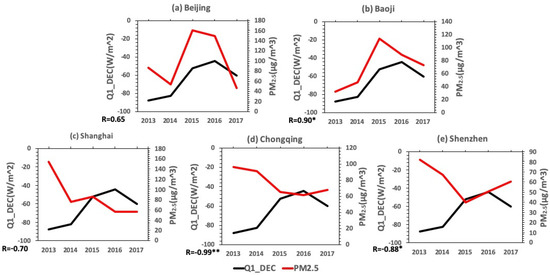
Figure 4.
Correlation between the apparent heat source Q1 of the Qinghai-Tibet plateau and PM2.5 concentration of the representative cities of typical regions in China; (* means passing the single-tailed 95% confidence test, ** means passing the single-tailed 99% confidence test).
The mass concentration of PM2.5 in Beijing and Baoji was significantly positively correlated with the apparent heat source Q1 on the Qinghai-Tibet Plateau, with correlation coefficients of 0.65 and 0.90, respectively. The correlation coefficient of Baoji passed the 95% confidence test. The mass concentration of PM2.5 in Shanghai, Chongqing, and Shenzhen had a significant negative correlation with the apparent heat source Q1 on the Qinghai-Tibet Plateau, with correlation coefficients of −0.70, −0.99, and −0.88, respectively, of which Chongqing passed the 95% confidence test and Shenzhen passed the 99% confidence test.
3.2. Analysis of Circulation and Temperature Fields in Strong and Weak Years of the Apparent Heat Source Q1 on the Qinghai-Tibet Plateau
3.2.1. General Circulation Situation
In the cold source weak year, the sea level field in most areas of our country, there was abnormal cold high pressure, but there was a weak thermal low pressure only in the Guangxi and Yunnan province, causing a weak convergence rise (Figure 5b). 500 hPa south branch groove deepens guiding the 850 hPa southerly airflow northward, which changed into a westerly airflow due to the topography of the Qinghai-Tibet plateau and then into an abnormal southwesterly airflow in southwest China. However, there was also an abnormal low potential at 500 hPa from the western Pacific to Beijing-Tianjin-Hebei region. The easterly airflow at 850 hPa in the northeast region was strengthened and changed to the northerly airflow in the Beijing-Tianjin-Hebei region, which merged with the southwest airflow from the southwest region at about 35° N region (Figure 5d).
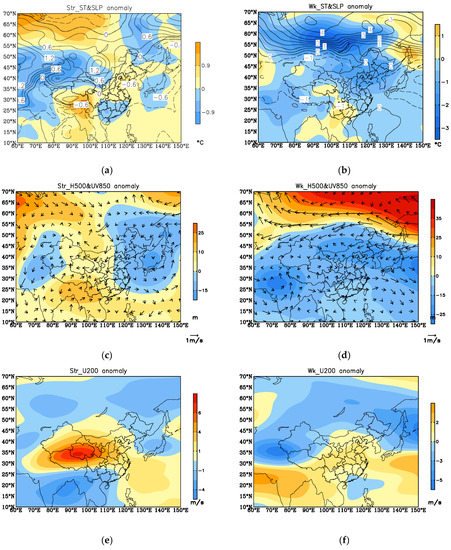
Figure 5.
Sea level temperature and air pressure (a,b), units (°C and Pa), 850 hPa uv wind and 500 hPa potential height (c,d), units (m/s and m), 200 hPa latitudinal wind speed (e,f), units (m/s) in Q1 strong and weak year and their differences (strong–weak year). (a,c,e) for a strong year, (b,d,f) for a weak year.
At 200 hPa, the westerly anomaly in the year with strong cold source appeared from the central Qinghai-Tibet Plateau to Qinghai, while it appeared in India and Bay of Bengal in the year with a weak cold source. Therefore, the westerly anomaly in the year with a strong cold source was more northerly and easterly than that in the year with a weak cold source (Figure 5e,f).
3.2.2. Profile of the Wind Field and Temperature Field in Five Typical Pollution Areas
(1) Beijing-Tianjin-Hebei Region
In the Beijing-Tianjin-Hebei region, PM2.5 concentration was positively correlated with the apparent heat source Q1 on the Qinghai-Tibet plateau. That was, the stronger the cold source on the Qinghai-Tibet plateau in winter, the pollution in the Beijing-Tianjin-Hebei region decreased, while the pollution increased when the cold source weakened. In order to investigate the reason for the existence of this correlation characteristic from the circulation field, the wind field, and temperature field were, respectively, made along 40° N and 105° E. The analysis showed that in the year of the strong cold source (upper left Figure 6), the lower layer was the abnormal west-west downward flow on the east-west section of the Beijing-Tianjin-Hebei region, and, the abnormally high temperature weakened the sinking component of the wind. In the year of the weak cold source (upper right Figure 6), the east-west section had abnormal airflow rising to the east, while the abnormal “inversion layer” existed, which inhibited the rising airflow. In addition, the reduction of horizontal wind speed near the ground was affected by the terrain, which was conducive to pollutant accumulation.
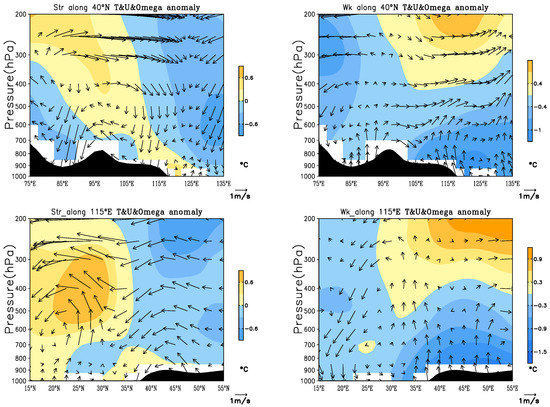
Figure 6.
Circulation and temperature fields in the east-west section (top) and north-south section (bottom) of Beijing-Tianjin-Hebei region in strong (left) and weak (right) cold source years on the Qinghai-Tibet plateau.
The vertical section of the north-south wind field and temperature field along 105° E in Beijing-Tianjin-Hebei (36–40° N) showed that in the cold source strong year (lower left Figure 6), there was an abnormal northerly downward flow from north to south, and the higher temperature in the lower layer weakened the sinking component, which was conducive to transporting pollutants southward. However, in the year of the weak cold source (lower right Figure 6), the inversion layer inhibited the local updraft, and there was a weak southerly airflow, which transported pollutants from the south area of Beijing-Tianjin-Hebei to the north, which was blocked by the Yanshan Mountain and reduced the horizontal wind speed, resulting in pollutant accumulation.
(2) Fen-Wei Plain
The situation in the Fen-Wei Plain was similar to that in Beijing-Tianjin-Hebei Region, and PM2.5 concentration was positively correlated with the apparent heat source Q1 on the Qinghai-Tibet Plateau. In the cold source strong year of the Qinghai-Tibet Plateau, there was an abnormal easterly wind near the ground on the east-west vertical section (upper left Figure 7) along 35° N in Fen-Wei Plain (107–112° E), and the abnormal warm near-surface temperature was conducive to the upward-lifting of pollutants, which was guided away from the plain by the abnormal easterly rising airflow at 700 hPa, while the easterly airflow in the eastern region (about 115° E) was affected by the sinking component and sunk along the terrain, which was not conducive to the transportation of pollutants to the Fen-Wei Plain and the reduction of pollution conditions. However, in the cold source weak year (upper right Figure 7), the temperature below 500 hPa in the Fen-Wei Plain was abnormally cold, which inhibited vertical diffusion. Moreover, the abnormal downward flow of 105° E and the easterly updraft from Henan and other places near 115° E moved along the terrain and merged in the near-surface of Fen-Wei Plain, resulting in increased pollution in the plain.
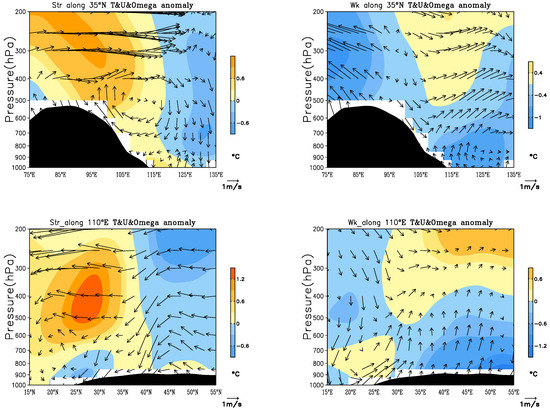
Figure 7.
Circulation and temperature fields in the east-west (top) and north-south (bottom) cross-sections of the Fen-Wei Plain region in strong (left) and weak (right) cold source years of the Qinghai-Tibet plateau.
On the vertical section along 110° E in the north-south direction of Fen-Wei Plain (from 34° to 36° N), there was an abnormal northerly wind in the year of the strong cold source (lower left Figure 7) and abnormal warm temperature in the lower layer, which was favorable for transporting pollutants southward along the terrain. In the cold source weak year (lower right Figure 7), there was a southerly airflow rising along the terrain, and the temperature in the lower layer was abnormally cold, which was conducive to inhibiting the rising airflow, resulting in the accumulation of pollutants in the Fen-Wei Plain.
(3) Yangtze River Delta
In the Yangtze River Delta region, PM2.5 concentration was negatively correlated with the apparent heat source Q1 on the Qinghai-Tibet Plateau. In the cold source year, there was an abnormally strong “inversion cover” on the east-west vertical section of the Yangtze River Delta region (118–122° E) along 30° N (upper left Figure 8), which was conducive to inhibiting vertical movement. Moreover, the west downward flow sinking along the Qinghai-Tibet Plateau below 850 hPa entrained pollutants passing through the region into the Yangtze River Delta region, which aggravated pollution. However, in weak years (upper right Figure 8), the westerly airflow sinking along the mountains rose at about 105° N, and the subsidence through the Yangtze River Delta region was unusually weak. Moreover, the westerly airflow near 117.5° E turned into uplifting airflow, which was conducive to the vertical diffusion of pollutants.
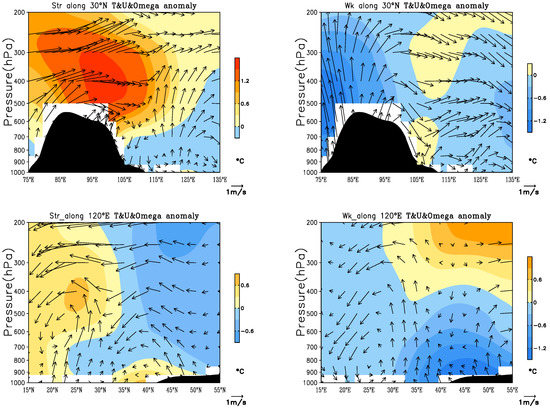
Figure 8.
Circulation and temperature fields in the east-west (top) and north-south (bottom) cross-sections of the Yangtze River Delta region in strong (left) and weak (right) cold source years on the Qinghai-Tibet plateau.
On the vertical section of the Yangtze River Delta (27–34° N) in the south-north direction along 120° E, in the strong cold source year (lower left Figure 8), the downward flow on the north side of about 800 hPa over the Yangtze River Delta inhibited weak uplift airflow at the lower level, which was not conducive to the vertical diffusion of pollutants. However, in the cold source weak year (lower right Figure 8), there was a consistent uplift airflow over the Yangtze River Delta region, which was conducive to the vertical diffusion of pollutants.
(4) Sichuan-Chongqing Region
In the Sichuan-Chongqing regions, PM2.5 concentration was negatively correlated with the apparent heat source Q1 on the Qinghai-Tibet Plateau. In the year of strong cold source on the Qinghai-Tibet Plateau, on the east-west vertical section along 30° N in Sichuan-Chongqing area (103–108° E) (upper left Figure 9), there was an unusually strong “inversion cover”. Moreover, the continuously downward flow below 700 hPa along the mountain inhibited the vertical diffusion of local pollutants. However, in weak years (upper right Figure 9), there was abnormal easterly uplift airflow in Sichuan-Chongqing regions, and abnormal warm near-ground temperature, which was conducive to strengthening the uplift movement.
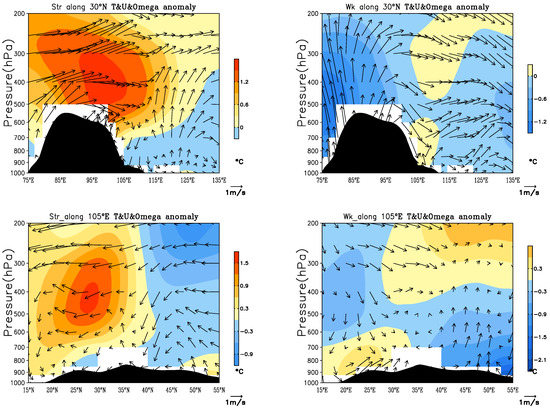
Figure 9.
Circulation and temperature fields in east-west (top) and north-south (bottom) cross-section of the Sichuan-Chongqing region in strong (left) and weak (right) cold source years on the Qinghai-Tibet plateau.
On the vertical section in the south-north direction of Sichuan-Chongqing area (28–33° N) along 105° E, there was also an abnormally strong “inversion cover” in the year of the strong cold source (lower left Figure 9). Moreover, there was a consistent downward flow below 700 hPa, which inhibited the uplift and diffusion and was conducive to the accumulation of pollutants. However, in weak years (lower right Figure 9), there was abnormal southward uplift flow at 700 hPa and the abnormal warm near-ground temperature was conducive to strengthening uplift movement and reducing pollution.
(5) Pearl River Delta Region
In the Pearl River Delta region, PM2.5 concentration was negatively correlated with the apparent heat source Q1 on the Qinghai-Tibet Plateau. On the east-west vertical section of the Pearl River Delta region (110–116° E) along 22.5° N, when the cold source was strong (upper left Figure 10), there was an abnormal “inversion cover”, which was conducive to inhibiting vertical movement. Moreover, there was a west downward flow, causing the transportation of pollutants from the west region to the Pearl River Delta and accumulated locally, resulting in increased pollution. In cold source weak years (upper right Figure 10), there was ascending airflow from east to west in the Pearl River Delta region, and the temperature in the lower layer was abnormally high, thus enhancing the uplift effect and causing less pollution.
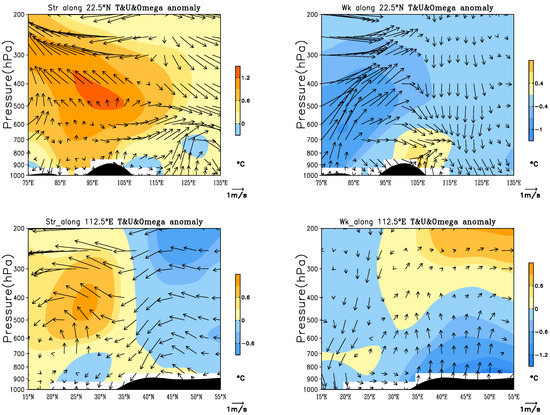
Figure 10.
Circulation and temperature fields in the east-west (top) and north-south (bottom) cross-section of the Pearl River Delta region in strong (left) and weak (right) cold source years on the Qinghai-Tibet plateau.
On the vertical section along 112.5° E in the south-north direction of the Pearl River Delta region (21–25° N), there was also an unusually strong “inversion cover” in the year of the strong cold source (lower left Figure 10), and there were weak southerly airflow at low latitude and northerly airflow at high latitude converging and sinking in the north-south direction, which was conducive to pollutant accumulation and aggravated pollution. In cold source weak years (lower right Figure 10), there was a clean southerly airflow from the ocean surface, which transported pollutants to the north, causing the pollution to weaken. Therefore, the pollution in the Pearl River Delta region was light in weak cold source years.
3.3. Spatial Distribution of Correlation between the Apparent Heat Source Q1 on Qinghai-Tibet Plateau and Haze Days in China and The Difference between the Two Sides of the Boundary Line
Haze data had a long time series from 1954 to 2017, thus the correlation between Q1 on the Qinghai-Tibet plateau and air pollution in China, especially in typical regions, was analyzed by using long time series haze data. First, the haze days in December from 1954 to 2017 were treated by subtracting the national index trend value for many years to ignore the impact of increasing anthropogenic emissions, and then the correlation analysis was made between the haze days in China and the apparent heat source Q1 on the Qinghai-Tibet Plateau in the same period. The spatial distribution of correlation between the apparent heat source Q1 and haze days are shown in Figure 11. It can be seen from Figure 11 that there existed an obvious northeast-southwest boundary line across the country. On the southeast area of the boundary, there was mainly a negative correlation, with strong cold sources and more haze days, while on the northwest region of the boundary and northeast China, there was mainly a positive correlation, with strong cold sources and fewer haze days.
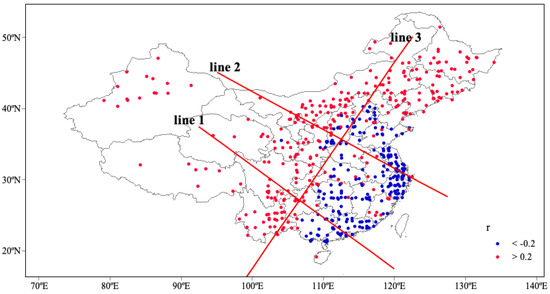
Figure 11.
Spatial correlation distributions and profile diagram between the apparent heat source Q1 on Qinghai-Tibet plateau and the haze days in China.
Three section lines were selected in Figure 11, namely, Section line 1: along (92.5° E, 37.5° N)–(120° E, 17.5° N) northwest-southeast direction; Section line 2: along (95° E, 45° N)–(127.5° E, 27.5° N) northwest-southeast section line; Section line 3: along (122.5° E, 50° N)–(100° E, 17.5° N) northwest-southeast direction. Section line 1 and Section line 3 intersects near Guiyang (106° E, 27° N), and Section line 2 intersects Section line 3 near Jincheng (112.66° E, 35.5° N).
Vertical profiles of wind and temperature field were made along Section lines 1 and 2 to analyze the influence mechanism of different pollution conditions on both sides of the northeast-southwest boundary line (Figure 12).
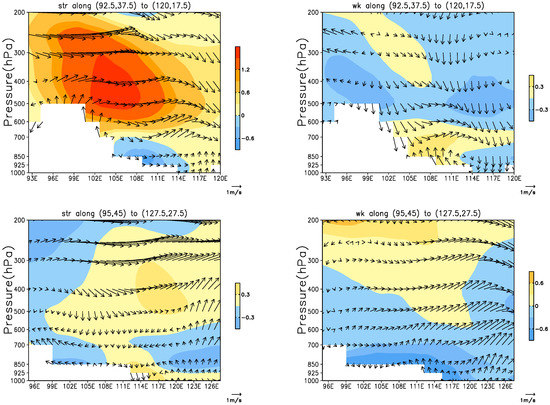
Figure 12.
Circulation and temperature fields on the northwest-southeast section line 1 (top) and line 2 (bottom) in strong and weak Q1 years.
On the northwest-southeast section (92.5° E, 37.5° N)–(120° E, 17.5° N) (upper Figure 12), in strong cold source years, the northwest region of 106° E boundary was a consistent southeast updraft, and due to topographic reasons, the temperature of the near-surface layer was warmer, thus strengthening the upward movement, which was conducive to the diffusion of pollution. While the southeast region of boundary about 106–114° E corresponding to Guizhou, Guangxi, and Guangdong areas, the lower layer was a northwest downward flow, and the temperature was abnormally low, which was conducive to inhibiting convection–diffusion and aggravating pollution. In Q1 weak years, the northwest region of the 106° E boundary, such as northwest Guizhou and Sichuan, was a consistent northwest downward flow, which inhibited uplift and diffusion. However, there was uplifted airflow at the lower layers of Guangxi and Guangdong in the southeast regions of boundary and the temperature of the near-surface layer was abnormally warm, which was conducive to strengthening the uplifting movement and reducing pollution.
On the northwest-southeast section (95° E, 45° N to 127.5° E, 27.5° N) along the boundary line of 111° E (bottom Figure 12), in the strong cold source years, the ocean surface temperature was abnormally warm, with updraft reaching 850–700 hPa and transferring to southerly airflow to the northwest. After encountering northerly downward flow from the north near 111° E region, it sinks in Henan, Anhui, Jiangsu, Shanghai, and Zhejiang regions southeast of the boundary line and the underlying horizontal wind was weak, which was conducive to pollutant accumulation. However, in weak years, the southeast area of the boundary was consistent with the ascending airflow, which was conducive to vertical diffusion. And in the northwest region of the boundary, it was changed from the slight southerly updraft along the terrain to the downward flow, and the abnormal warm temperature in the lower layer was conducive to strengthening the subsidence of the airflow, resulting in the accumulation of pollution in the northwest region.
Therefore, when the cold source was strong, the pollution in the northwest region of the dividing line was light, while the pollution in the southeast region was heavy. And it was just the opposite when the cold source was weak.
4. Summaries and Discussions
The spatial distribution of correlation between the apparent heat source Q1 on the Qinghai-Tibet Plateau and PM2.5 concentration in China has a northeast-southwest boundary, and it has a negative correlation in the southeast region, which is when the cold source is strong, the pollution in this area is heavy. However, it has a positive correlation in the northwest region, which is when the cold source is strong, the pollution is light. In the Beijing-Tianjin-Hebei and Fen-Wei regions, there is a positive correlation between Q1 and PM2.5 concentration while in Yangtze River Delta, Sichuan-Chongqing, and Pearl River Delta regions, there is a negative correlation.
Compared with PM2.5, the haze data have a long time series (1954–present). Analysis of the correlation between haze and Q1 shows that the spatial distribution has similar characteristics to PM2.5, with a northeast-southwest boundary line, with a positive correlation to the north and negative correlation to the south of the boundary line.
The comparative analysis of the circulation field and temperature field in different Q1 shows that in the strong cold source, northerly winds strengthen in the middle and high latitudes, and there has a northerly sinking airflow in the southeast region suppressing convection and diffusion, resulting in increased pollution. However, there exists a rising airflow, which reduced pollution in the northwest region. When the cold source is weak, the situation is just the opposite.
In the cold source weak year, the geopotential height over the Bay of Bengal at 500 hPa decreases, corresponding to the deepening of the southern branch channel, leading the 850 hPa southerly airflow to the north, which changes to the southerly airflow due to the influence of plateau topography and merges with the easterly airflow in North China at about 35° N, while the northwest area has abnormal downward flow, thus aggravating the pollution. When the cold source increases, the abnormal westerly jet at 200 hPa appears over the Qinghai-Tibet Plateau to Qinghai, the East Asian trough at 500 hPa deepens, the Siberian high on the ground increases, the northerly winds at mid-high latitudes strengthen, and the downward flow at the southeast region has an abnormal northerly, thus inhibiting the convection–diffusion, causing the pollution to increase.
Analysis of the circulation situation shows that the thermal effect of the Qinghai-Tibet Plateau has an important influence on the atmospheric circulation in the plateau, its surrounding areas and downstream areas. In the year of strong heating of the Qinghai-Tibet Plateau, the upward movement, convergence of the lower layer and divergence of the upper layer in the plateau and its adjacent areas are enhanced, and the suction effect of the plateau heating on the surrounding lower layer air and the emission effect of the upper atmosphere to the surrounding areas are enhanced, and vice versa. The thermal effect of the Qinghai-Tibet Plateau can affect the atmospheric circulation field in its surrounding and downstream areas, thus affecting the atmospheric pollution in the surrounding and downstream areas, and the effects on the atmospheric pollution in different areas are different. Through correlation analysis of the winter heat source Q1 on the Qinghai-Tibet Plateau and the PM2.5 concentration data of 902 stations in China in the past 5 years, as well as correlation analysis of the haze data of Q1 and 2444 stations in China since 1958, it is shown that there is a northeast-southwest boundary line in China. In the southeast region of the boundary line, Q1 is negatively correlated with pollution and positively correlated in the northwest region of the boundary line. The thermal effects of the Qinghai-Tibet Plateau have different impacts on the atmospheric circulation in different regions, therefore, Q1 is positively correlated with air pollution in the Beijing-Tianjin-Hebei and Fen-Wei Plain areas located in the northwest region of the dividing line, while the Yangtze River Delta, Sichuan-Chongqing, and Pearl River Delta areas located in the southeast region of the dividing line are mainly negatively correlated.
Based on the observation data, we preliminarily discuss the influence of the change of the Q1 on the Qinghai-Tibet plateau on the atmospheric circulation and meteorological conditions in different typical regions of China, and it also potentially affects the increase of air pollution events in China. In recent years, the Chinese government has taken many important measures and made great progress in reducing emissions and air pollution. However, China’s unique and complex geographical distribution may affect the effectiveness of China’s air pollution control measures. Therefore, we have identified and discussed major pollution areas in China, and the role of thermal variability on the Qinghai-Tibet plateau may be taken into account when planning the location of new industrial facilities for China’s future development, thus as to prioritize the reduction of anthropogenic emissions in vulnerable areas, thereby reducing the number and severity of air pollution events.
Subsequent research needs to collect PM2.5 concentration data from more monitoring stations in a longer time series and by means of high-precision simulation and sensitivity tests of numerical models, thus as to deeply explore how the thermal effects of the Qinghai-Tibet Plateau affect the atmospheric pollution in the surrounding and downstream areas, and how the strong and weak years of the thermal effects of the Qinghai-Tibet Plateau affect the atmospheric circulation and the atmospheric pollution in different regions in China.
Author Contributions
Conceptualization, X.A.; methodology, C.W. and Y.Z.; software, Y.L.; validation, Y.L.; formal analysis, Y.L.; resources, C.W. and Y.L.; data curation, C.W. and Y.L.; writing—original draft preparation, Y.L.; writing—review and editing, X.A.; supervision, G.F. and J.L.; project administration, X.A.; funding acquisition, X.A. All authors have read and agreed to the published version of the manuscript.
Funding
This research was funded by the National Natural Science Foundation of China (grant numbers 91644223), China; the National Natural Science Foundation of China (grant numbers 41975173), China.
Conflicts of Interest
The authors declare no conflict of interest.
References
- Qiao, Y.; Zhou, S.; Ma, Y.; Wang, C.; Li, Q. Dynamic Effect of Tibetan Plateau and Its Impact on Weather and Climate in China. Meteorol. Sci. Technol. 2014, 42, 1039–1046. [Google Scholar]
- Ye, D.; Luo, S.; Zhu, B. The flow field structure and the heat balance in the troposphere in the Tibetan Plateau and its vicinity. J. Trop. Meteorol. 1957, 2, 108–121. (In Chinese) [Google Scholar]
- Flohn, H. Large-scale aspects of the “summer monsoon” in South and East Asia. J. Meteorol. Soc. Jpn. 1957, 75, 180–186. [Google Scholar] [CrossRef]
- Yang, W.; Ye, D.; Wu, G. Diagnostic Analysis of Thermal Field and Circulation Field in Tibetan Plateau in Summer. Chin. J. Atmos. Sci. 1992, 3, 287–301. (In Chinese) [Google Scholar]
- Chen, L.; Duan, T.; Li, W. Atmospheric heat source changes over the Tibetan Plateau in summer and the characteristics of atmospheric energy budget in 1979. Acta Meteorol. Sin. 1985, 1, 1–12. [Google Scholar]
- Zhao, P.; Chen, L. Climatic Characteristics of Atmospheric Heat Source over the Tibetan Plateau in the Past 35 Years and Its Relationship with Precipitation in China. Chin. Sci. (D Earth Sci.) 2001, 4, 327–332. [Google Scholar]
- Wang, T.; Wu, G.; Wan, R. Influence of the Mechanical and Thermal Forcing of Tibetan Plateau on the Circulation of the Asian Summer Monsoon Area. Plateau Meteorol. 2008, 1, 1–9. (In Chinese) [Google Scholar]
- Zhong, S.; He, J.; Guan, Z.; Wen, M. Climatic characteristics of the atmospheric heat source over the Tibetan Plateau during 1961–2001. J. Trop. Meteorol. 2009, 67, 407–416. (In Chinese) [Google Scholar]
- Wu, G.; Li, W.; Guo, H. Sensible heat driven air-pump over the Tibetan Plateau and its impacts on the Asian summer monsoon. In Collections on the Memory of Zhao Jiuzhang; Ye, D., Ed.; Beijing Science Press: Beijing, China, 1997; pp. 116–126. (In Chinese) [Google Scholar]
- Wu, G.; Liu, Y.; He, B.; Bao, Q.; Wang, Z. Review of the Impact of the Tibetan Plateau Sensible Heat Driven Air-Pump on the Asian Summer Monsoon. Chin. J. Atmos. Sci. 2018, 42, 488–504. (In Chinese) [Google Scholar]
- Yu, L.; Feng, C.; Li, X.; Cui, Y. Recent Progress in the Impact of the Heat Sources over Tibetan Plateau on Summer Precipitation over Southwest China. Plateau Mt. Meteorol. Res. 2015, 35, 91–95. (In Chinese) [Google Scholar]
- Ye, D.; Gao, Y. The Meteorology of the Qinghai-Xizang (Tibetan) Plateau; Beijing Science Press: Beijing, China, 1992; 278p. [Google Scholar]
- Ding, Y. Effects of the Qinghai-Xizang (Tibetan) plateauon the circulation features over the plateau and its surroundingareas. Adv. Atmos. Sci. 1992, 9, 112–130. [Google Scholar]
- Wu, G.; Liu, Y.; He, B. Thermal controls on the Asian summer monsoon. Sci. Rep. 2012, 2, 404. [Google Scholar] [CrossRef] [PubMed]
- Liu, Y.; Wu, G.; Hong, J. Revisiting Asian monsoon formation and change associated with Tibetan Plateau forcing: II. Change. Clim. Dyn. 2012, 39, 1183–1195. [Google Scholar] [CrossRef]
- Boos, W.; Kuang, Z. Sensitivity of the South Asian monsoon to elevated and non-elevated heating. Sci. Rep. 2013, 3, 1192. [Google Scholar] [CrossRef] [PubMed]
- Xu, X.; Wang, Y.; Zhao, T.; Cheng, X.; Meng, Y.; Ding, G. “Harbor” effect of large topography on haze distribution in eastern China and its climate modulation on decadal variations in haze. Chin. Sci. Bull. 2015, 60, 1132–1145. [Google Scholar]
- Xu, X.; Zhao, T.; Liu, F.; Gong, S.L.; Kristovich, D.; Lu, C.; Guo, Y.; Cheng, X.; Wang, Y.; Ding, G. Climate modulation of the Tibetan Plateau on haze in China. Atmos. Chem. Phys. 2016, 16, 1365–1375. [Google Scholar] [CrossRef]
- Yu, Y.; Zhang, Z.; Feng, M. National Meteorological Information Center Smog Data Set (V1.0); National Meteorological Information Center Internal Data: Beijing, China, 2013. (In Chinese)
- Luo, X.; Xu, J. Atmospheric heat source on the Tibetan Plateau and its uncertain factors. Adv. Clim. Chang. Res. 2019, 15, 33–40. (In Chinese) [Google Scholar]
- Yanai, M.; Li, C.; Song, Z. Seasonal heating of the Tibetan plateau and its effects on the evolution of the Asian summer monsoon. J. Meteorol. Soc. Jpn. 1992, 70, 319–351. [Google Scholar] [CrossRef]
© 2019 by the authors. Licensee MDPI, Basel, Switzerland. This article is an open access article distributed under the terms and conditions of the Creative Commons Attribution (CC BY) license (http://creativecommons.org/licenses/by/4.0/).